Ballard, CA Map & Demographics
Ballard Map
Ballard Overview
$61,184
PER CAPITA INCOME
$112,031
AVG FAMILY INCOME
$106,458
AVG HOUSEHOLD INCOME
48.1%
WAGE / INCOME GAP [ % ]
51.9¢/ $1
WAGE / INCOME GAP [ $ ]
0.57
INEQUALITY / GINI INDEX
721
TOTAL POPULATION
289
MALE POPULATION
432
FEMALE POPULATION
66.90
MALES / 100 FEMALES
149.48
FEMALES / 100 MALES
42.2
MEDIAN AGE
3.5
AVG FAMILY SIZE
2.8
AVG HOUSEHOLD SIZE
265
LABOR FORCE [ PEOPLE ]
49.6%
PERCENT IN LABOR FORCE
1.1%
UNEMPLOYMENT RATE
Ballard Area Codes
Income in Ballard
Income Overview in Ballard
Per Capita Income in Ballard is $61,184, while median incomes of families and households are $112,031 and $106,458 respectively.
| Characteristic | Number | Measure |
| Per Capita Income | 721 | $61,184 |
| Median Family Income | 181 | $112,031 |
| Mean Family Income | 181 | $202,656 |
| Median Household Income | 257 | $106,458 |
| Mean Household Income | 257 | $165,926 |
| Income Deficit | 181 | $0 |
| Wage / Income Gap (%) | 721 | 48.15% |
| Wage / Income Gap ($) | 721 | 51.85¢ per $1 |
| Gini / Inequality Index | 721 | 0.57 |
Earnings by Sex in Ballard
Average Earnings in Ballard are $53,846, $77,679 for men and $40,278 for women, a difference of 48.1%.
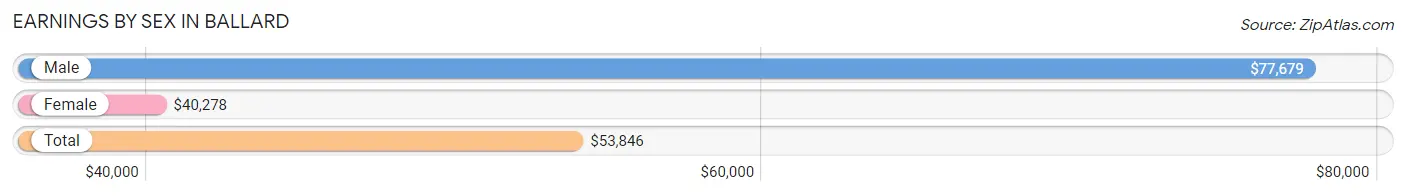
| Sex | Number | Average Earnings |
| Male | 158 (46.5%) | $77,679 |
| Female | 182 (53.5%) | $40,278 |
| Total | 340 (100.0%) | $53,846 |
Earnings by Sex by Income Bracket in Ballard
The most common earnings brackets in Ballard are $100,000+ for men (45 | 28.5%) and $55,000 to $64,999 for women (47 | 25.8%).
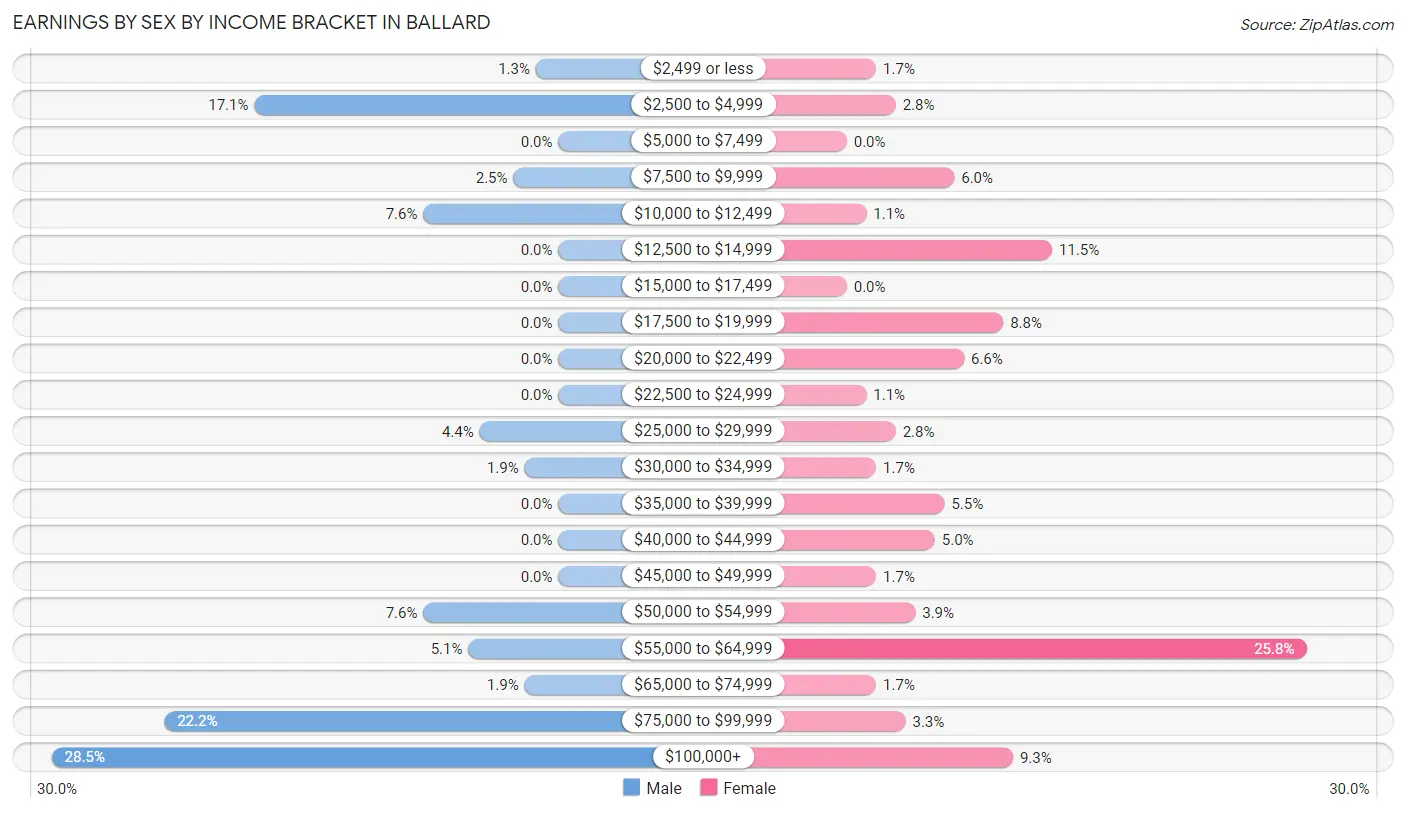
| Income | Male | Female |
| $2,499 or less | 2 (1.3%) | 3 (1.7%) |
| $2,500 to $4,999 | 27 (17.1%) | 5 (2.8%) |
| $5,000 to $7,499 | 0 (0.0%) | 0 (0.0%) |
| $7,500 to $9,999 | 4 (2.5%) | 11 (6.0%) |
| $10,000 to $12,499 | 12 (7.6%) | 2 (1.1%) |
| $12,500 to $14,999 | 0 (0.0%) | 21 (11.5%) |
| $15,000 to $17,499 | 0 (0.0%) | 0 (0.0%) |
| $17,500 to $19,999 | 0 (0.0%) | 16 (8.8%) |
| $20,000 to $22,499 | 0 (0.0%) | 12 (6.6%) |
| $22,500 to $24,999 | 0 (0.0%) | 2 (1.1%) |
| $25,000 to $29,999 | 7 (4.4%) | 5 (2.8%) |
| $30,000 to $34,999 | 3 (1.9%) | 3 (1.7%) |
| $35,000 to $39,999 | 0 (0.0%) | 10 (5.5%) |
| $40,000 to $44,999 | 0 (0.0%) | 9 (5.0%) |
| $45,000 to $49,999 | 0 (0.0%) | 3 (1.7%) |
| $50,000 to $54,999 | 12 (7.6%) | 7 (3.8%) |
| $55,000 to $64,999 | 8 (5.1%) | 47 (25.8%) |
| $65,000 to $74,999 | 3 (1.9%) | 3 (1.7%) |
| $75,000 to $99,999 | 35 (22.2%) | 6 (3.3%) |
| $100,000+ | 45 (28.5%) | 17 (9.3%) |
| Total | 158 (100.0%) | 182 (100.0%) |
Earnings by Sex by Educational Attainment in Ballard
Average earnings in Ballard are $77,679 for men and $40,694 for women, a difference of 47.6%. Men with an educational attainment of high school diploma enjoy the highest average annual earnings of $98,056, while those with bachelor's degree education earn the least with $79,375. Women with an educational attainment of bachelor's degree earn the most with the average annual earnings of $56,250, while those with graduate degree education have the smallest earnings of $14,226.
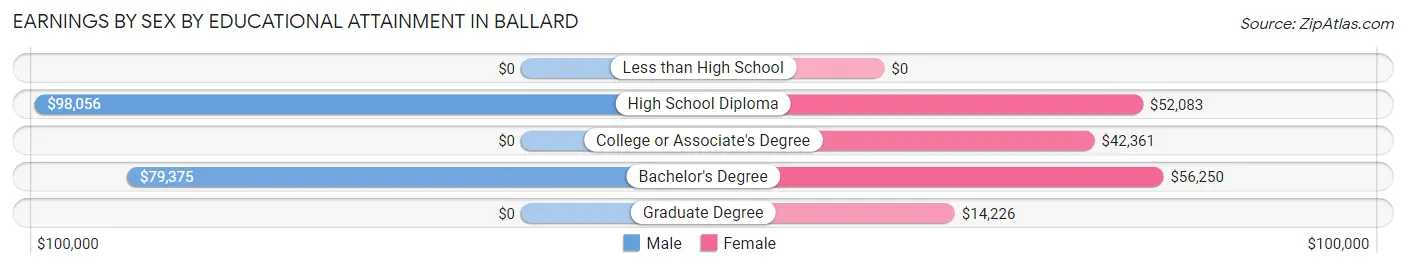
| Educational Attainment | Male Income | Female Income |
| Less than High School | - | - |
| High School Diploma | $98,056 | $52,083 |
| College or Associate's Degree | - | - |
| Bachelor's Degree | $79,375 | $56,250 |
| Graduate Degree | - | - |
| Total | $77,679 | $40,694 |
Family Income in Ballard
Family Income Brackets in Ballard
According to the Ballard family income data, there are 57 families falling into the $200,000+ income range, which is the most common income bracket and makes up 31.5% of all families.
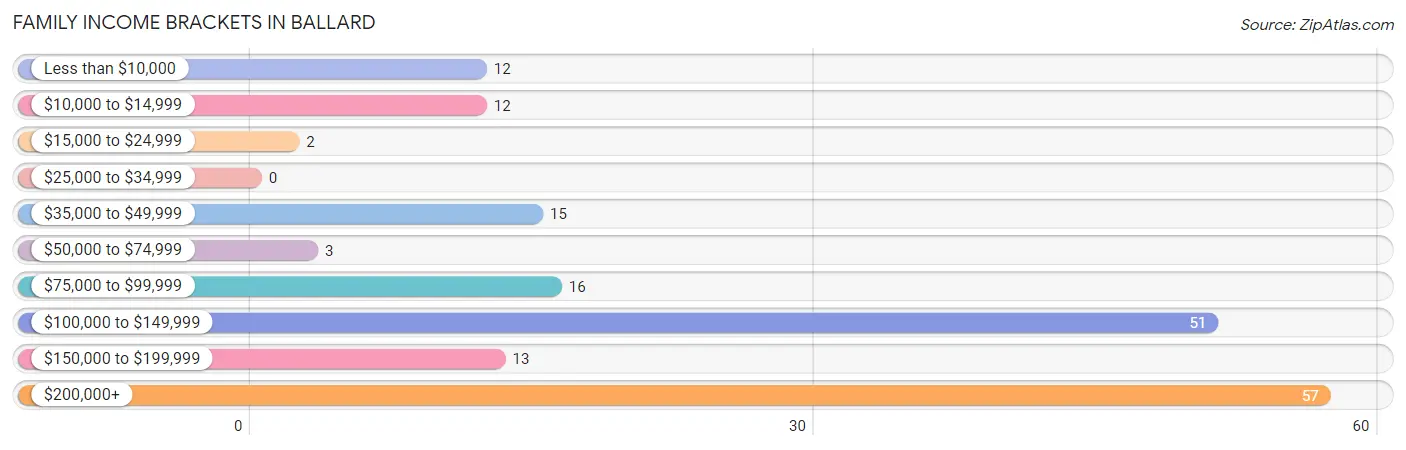
| Income Bracket | # Families | % Families |
| Less than $10,000 | 12 | 6.6% |
| $10,000 to $14,999 | 12 | 6.6% |
| $15,000 to $24,999 | 2 | 1.1% |
| $25,000 to $34,999 | 0 | 0.0% |
| $35,000 to $49,999 | 15 | 8.3% |
| $50,000 to $74,999 | 3 | 1.7% |
| $75,000 to $99,999 | 16 | 8.8% |
| $100,000 to $149,999 | 51 | 28.2% |
| $150,000 to $199,999 | 13 | 7.2% |
| $200,000+ | 57 | 31.5% |
Family Income by Famaliy Size in Ballard
4-person families (23 | 12.7%) account for the highest median family income in Ballard with $232,917 per family, while 4-person families (23 | 12.7%) have the highest median income of $58,229 per family member.
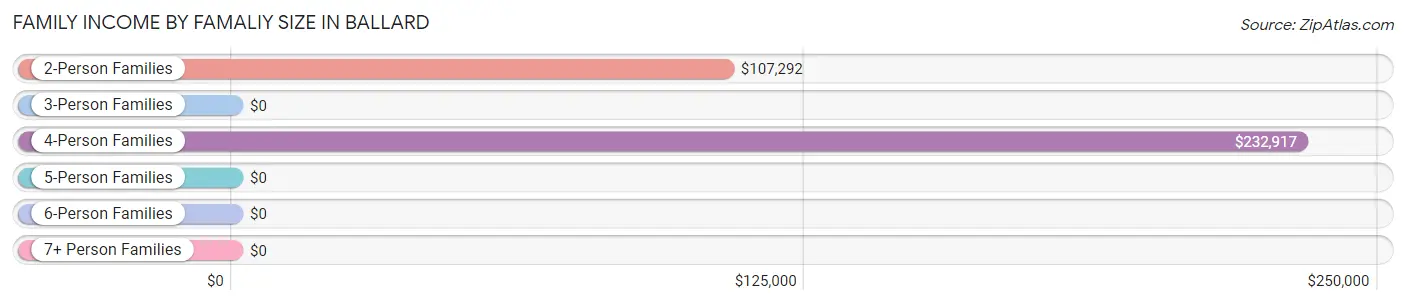
| Income Bracket | # Families | Median Income |
| 2-Person Families | 97 (53.6%) | $107,292 |
| 3-Person Families | 20 (11.1%) | $0 |
| 4-Person Families | 23 (12.7%) | $232,917 |
| 5-Person Families | 25 (13.8%) | $0 |
| 6-Person Families | 16 (8.8%) | $0 |
| 7+ Person Families | 0 (0.0%) | $0 |
| Total | 181 (100.0%) | $112,031 |
Family Income by Number of Earners in Ballard
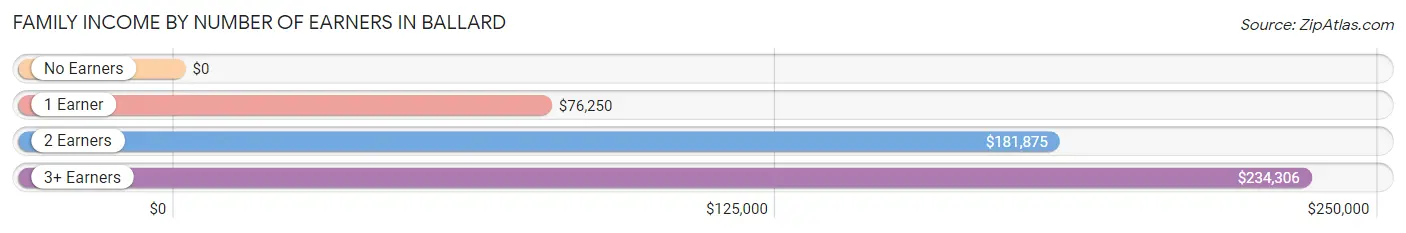
| Number of Earners | # Families | Median Income |
| No Earners | 61 (33.7%) | $0 |
| 1 Earner | 39 (21.5%) | $76,250 |
| 2 Earners | 58 (32.0%) | $181,875 |
| 3+ Earners | 23 (12.7%) | $234,306 |
| Total | 181 (100.0%) | $112,031 |
Household Income in Ballard
Household Income Brackets in Ballard
With 59 households falling in the category, the $200,000+ income range is the most frequent in Ballard, accounting for 23.0% of all households. In contrast, only 5 households (1.9%) fall into the $15,000 to $24,999 income bracket, making it the least populous group.
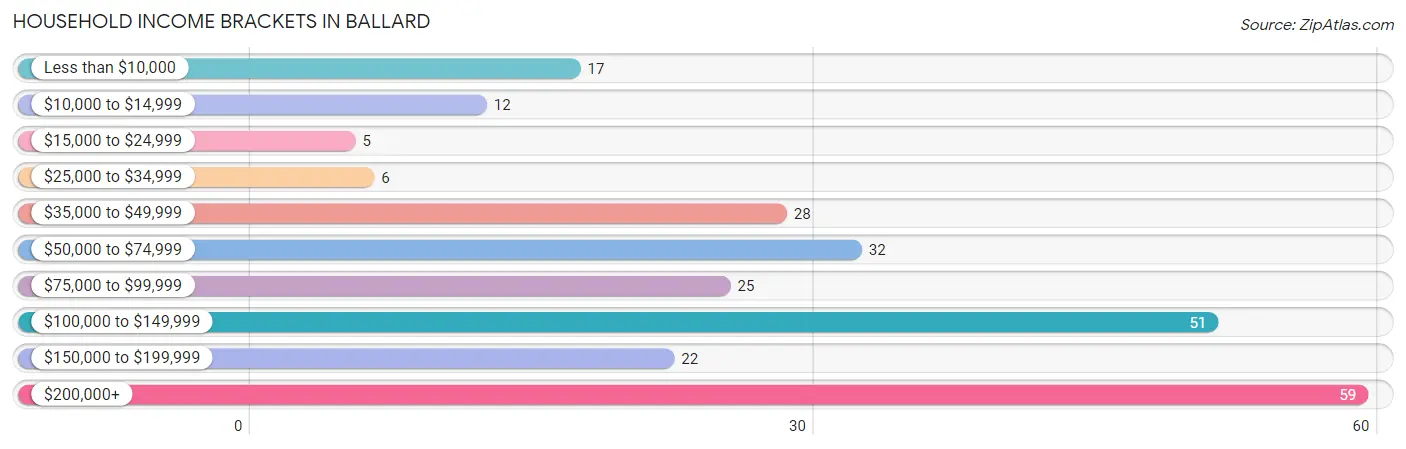
| Income Bracket | # Households | % Households |
| Less than $10,000 | 17 | 6.6% |
| $10,000 to $14,999 | 12 | 4.7% |
| $15,000 to $24,999 | 5 | 1.9% |
| $25,000 to $34,999 | 6 | 2.3% |
| $35,000 to $49,999 | 28 | 10.9% |
| $50,000 to $74,999 | 32 | 12.5% |
| $75,000 to $99,999 | 25 | 9.7% |
| $100,000 to $149,999 | 51 | 19.8% |
| $150,000 to $199,999 | 22 | 8.6% |
| $200,000+ | 59 | 23.0% |
Household Income by Householder Age in Ballard
The median household income in Ballard is $106,458, with the highest median household income of $109,444 found in the 45 to 64 years age bracket for the primary householder. A total of 108 households (42.0%) fall into this category.
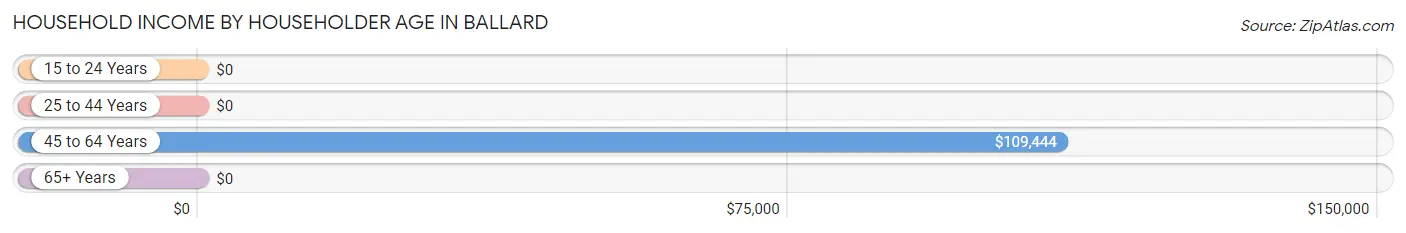
| Income Bracket | # Households | Median Income |
| 15 to 24 Years | 0 (0.0%) | $0 |
| 25 to 44 Years | 56 (21.8%) | $0 |
| 45 to 64 Years | 108 (42.0%) | $109,444 |
| 65+ Years | 93 (36.2%) | $0 |
| Total | 257 (100.0%) | $106,458 |
Poverty in Ballard
Income Below Poverty by Sex and Age in Ballard
With 10.7% poverty level for males and 8.1% for females among the residents of Ballard, 18 to 24 year old males and 16 and 17 year old females are the most vulnerable to poverty, with 4 males (100.0%) and 4 females (57.1%) in their respective age groups living below the poverty level.
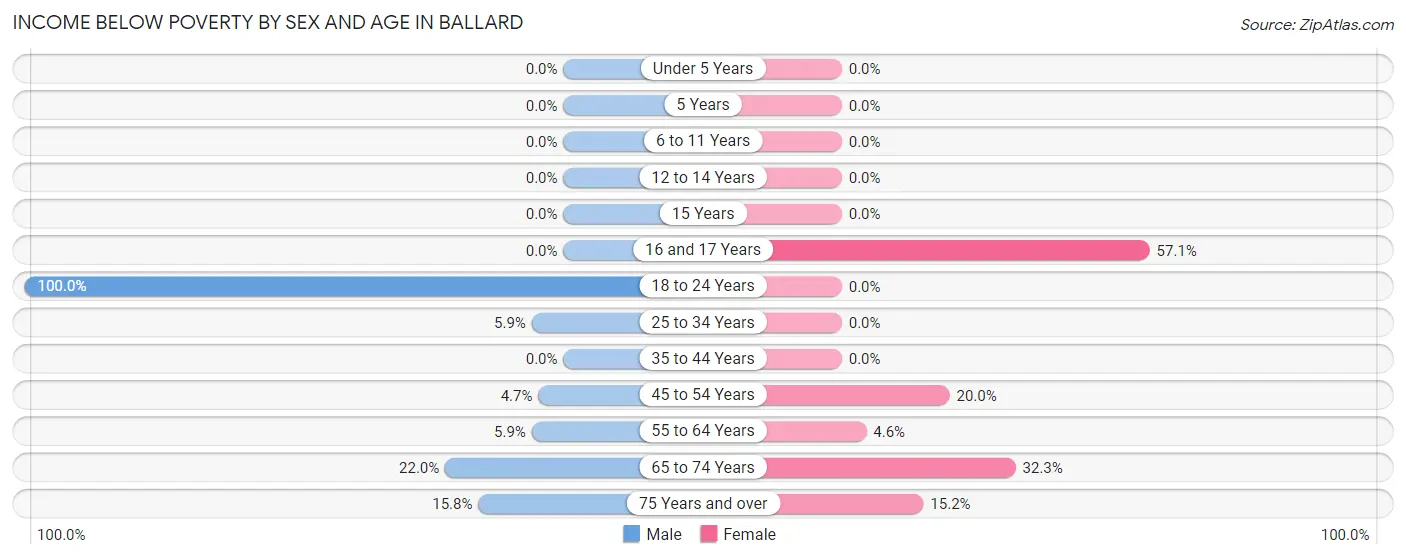
| Age Bracket | Male | Female |
| Under 5 Years | 0 (0.0%) | 0 (0.0%) |
| 5 Years | 0 (0.0%) | 0 (0.0%) |
| 6 to 11 Years | 0 (0.0%) | 0 (0.0%) |
| 12 to 14 Years | 0 (0.0%) | 0 (0.0%) |
| 15 Years | 0 (0.0%) | 0 (0.0%) |
| 16 and 17 Years | 0 (0.0%) | 4 (57.1%) |
| 18 to 24 Years | 4 (100.0%) | 0 (0.0%) |
| 25 to 34 Years | 2 (5.9%) | 0 (0.0%) |
| 35 to 44 Years | 0 (0.0%) | 0 (0.0%) |
| 45 to 54 Years | 2 (4.6%) | 3 (20.0%) |
| 55 to 64 Years | 2 (5.9%) | 3 (4.5%) |
| 65 to 74 Years | 18 (22.0%) | 20 (32.3%) |
| 75 Years and over | 3 (15.8%) | 5 (15.1%) |
| Total | 31 (10.7%) | 35 (8.1%) |
Income Above Poverty by Sex and Age in Ballard
According to the poverty statistics in Ballard, males aged under 5 years and females aged under 5 years are the age groups that are most secure financially, with 100.0% of males and 100.0% of females in these age groups living above the poverty line.
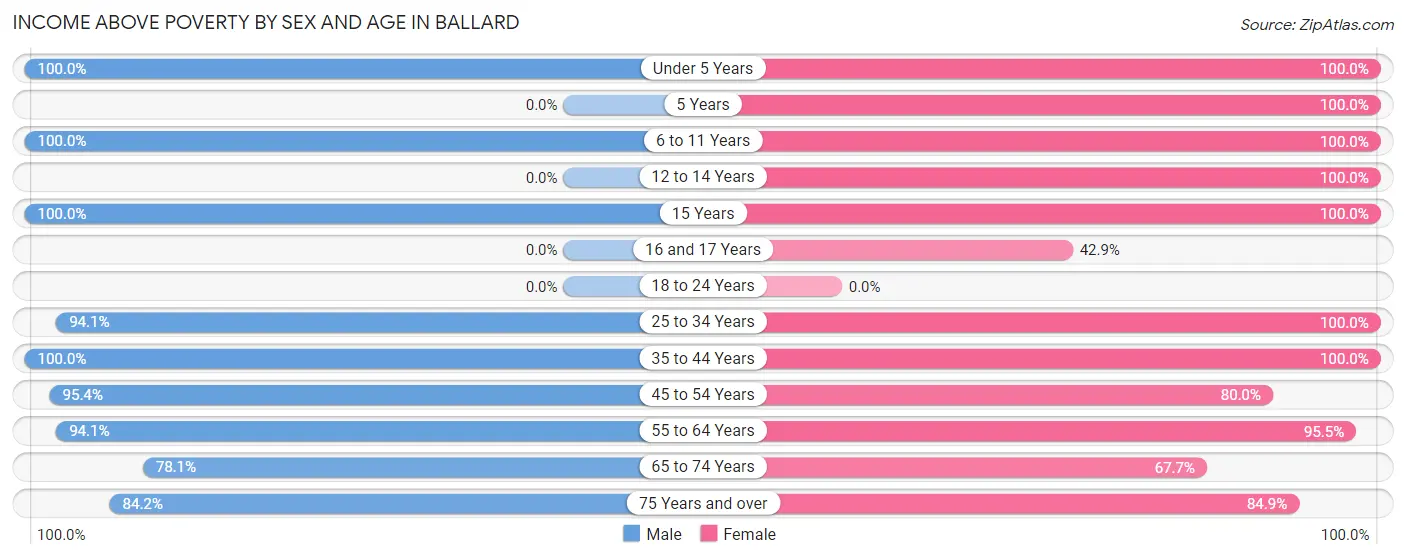
| Age Bracket | Male | Female |
| Under 5 Years | 26 (100.0%) | 59 (100.0%) |
| 5 Years | 0 (0.0%) | 27 (100.0%) |
| 6 to 11 Years | 24 (100.0%) | 8 (100.0%) |
| 12 to 14 Years | 0 (0.0%) | 29 (100.0%) |
| 15 Years | 3 (100.0%) | 11 (100.0%) |
| 16 and 17 Years | 0 (0.0%) | 3 (42.9%) |
| 18 to 24 Years | 0 (0.0%) | 0 (0.0%) |
| 25 to 34 Years | 32 (94.1%) | 63 (100.0%) |
| 35 to 44 Years | 20 (100.0%) | 52 (100.0%) |
| 45 to 54 Years | 41 (95.4%) | 12 (80.0%) |
| 55 to 64 Years | 32 (94.1%) | 63 (95.5%) |
| 65 to 74 Years | 64 (78.0%) | 42 (67.7%) |
| 75 Years and over | 16 (84.2%) | 28 (84.9%) |
| Total | 258 (89.3%) | 397 (91.9%) |
Income Below Poverty Among Married-Couple Families in Ballard
The poverty statistics for married-couple families in Ballard show that 13.6% or 21 of the total 155 families live below the poverty line. Families with no children have the highest poverty rate of 21.9%, comprising of 21 families. On the other hand, families with 1 or 2 children have the lowest poverty rate of 0.0%, which includes 0 families.
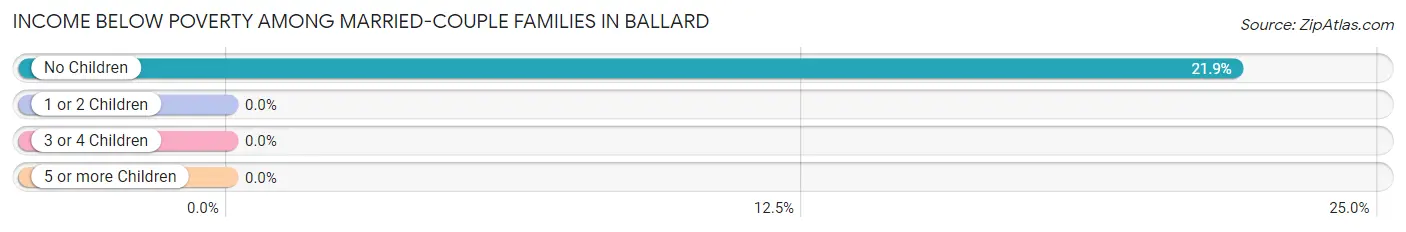
| Children | Above Poverty | Below Poverty |
| No Children | 75 (78.1%) | 21 (21.9%) |
| 1 or 2 Children | 35 (100.0%) | 0 (0.0%) |
| 3 or 4 Children | 24 (100.0%) | 0 (0.0%) |
| 5 or more Children | 0 (0.0%) | 0 (0.0%) |
| Total | 134 (86.5%) | 21 (13.6%) |
Income Below Poverty Among Single-Parent Households in Ballard
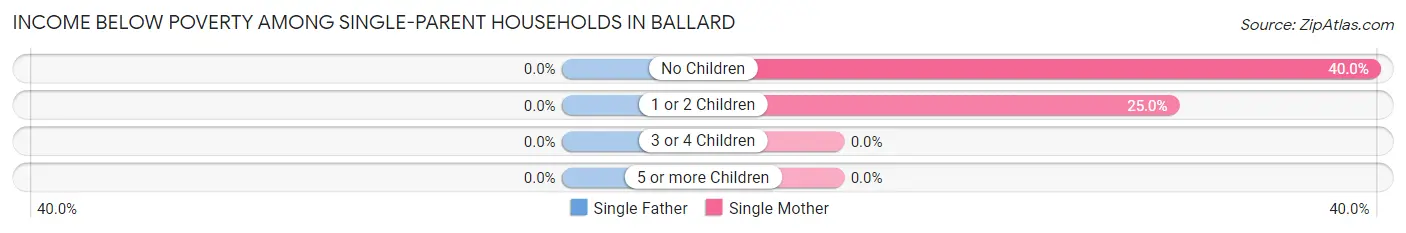
| Children | Single Father | Single Mother |
| No Children | 0 (0.0%) | 2 (40.0%) |
| 1 or 2 Children | 0 (0.0%) | 3 (25.0%) |
| 3 or 4 Children | 0 (0.0%) | 0 (0.0%) |
| 5 or more Children | 0 (0.0%) | 0 (0.0%) |
| Total | 0 (0.0%) | 5 (29.4%) |
Income Below Poverty Among Married-Couple vs Single-Parent Households in Ballard
The poverty data for Ballard shows that 21 of the married-couple family households (13.6%) and 5 of the single-parent households (19.2%) are living below the poverty level. Within the married-couple family households, those with no children have the highest poverty rate, with 21 households (21.9%) falling below the poverty line. Among the single-parent households, those with 1 or 2 children have the highest poverty rate, with 3 household (25.0%) living below poverty.
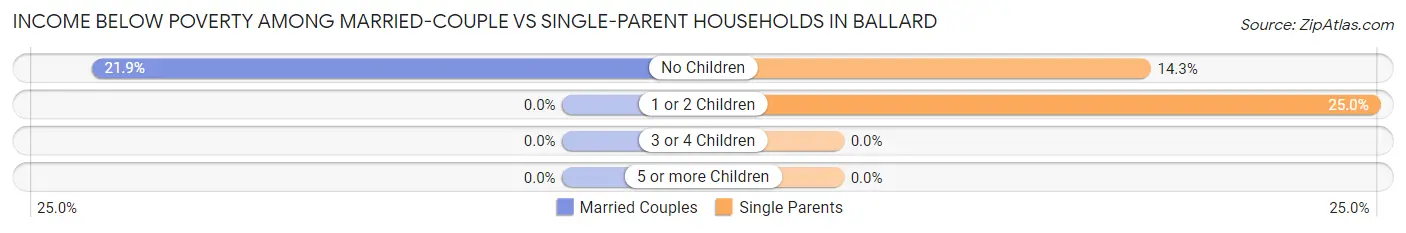
| Children | Married-Couple Families | Single-Parent Households |
| No Children | 21 (21.9%) | 2 (14.3%) |
| 1 or 2 Children | 0 (0.0%) | 3 (25.0%) |
| 3 or 4 Children | 0 (0.0%) | 0 (0.0%) |
| 5 or more Children | 0 (0.0%) | 0 (0.0%) |
| Total | 21 (13.6%) | 5 (19.2%) |
Race in Ballard
The most populous races in Ballard are White / Caucasian (686 | 95.2%), Hispanic or Latino (80 | 11.1%), and Two or more Races (21 | 2.9%).
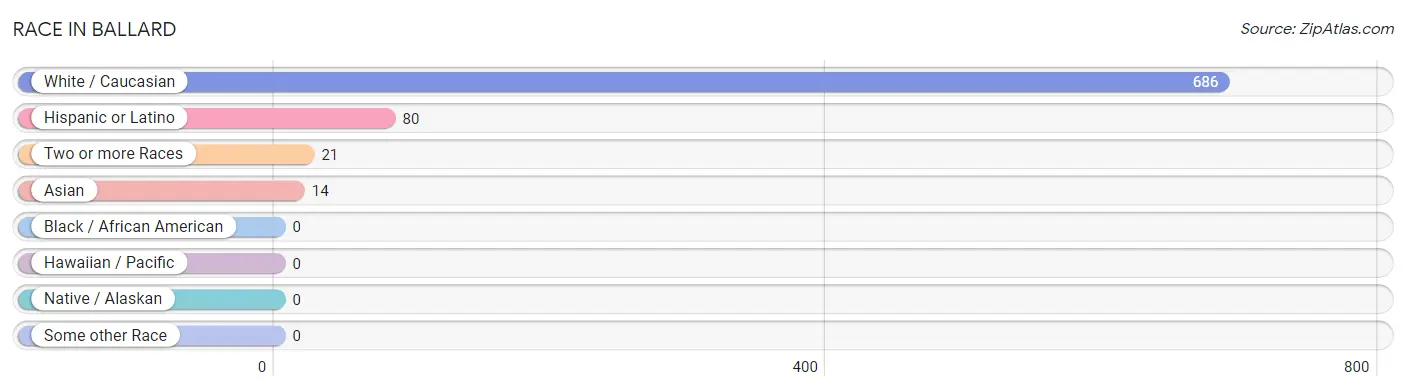
| Race | # Population | % Population |
| Asian | 14 | 1.9% |
| Black / African American | 0 | 0.0% |
| Hawaiian / Pacific | 0 | 0.0% |
| Hispanic or Latino | 80 | 11.1% |
| Native / Alaskan | 0 | 0.0% |
| White / Caucasian | 686 | 95.2% |
| Two or more Races | 21 | 2.9% |
| Some other Race | 0 | 0.0% |
| Total | 721 | 100.0% |
Ancestry in Ballard
The most populous ancestries reported in Ballard are Scottish (145 | 20.1%), German (113 | 15.7%), French (111 | 15.4%), English (89 | 12.3%), and Irish (87 | 12.1%), together accounting for 75.6% of all Ballard residents.
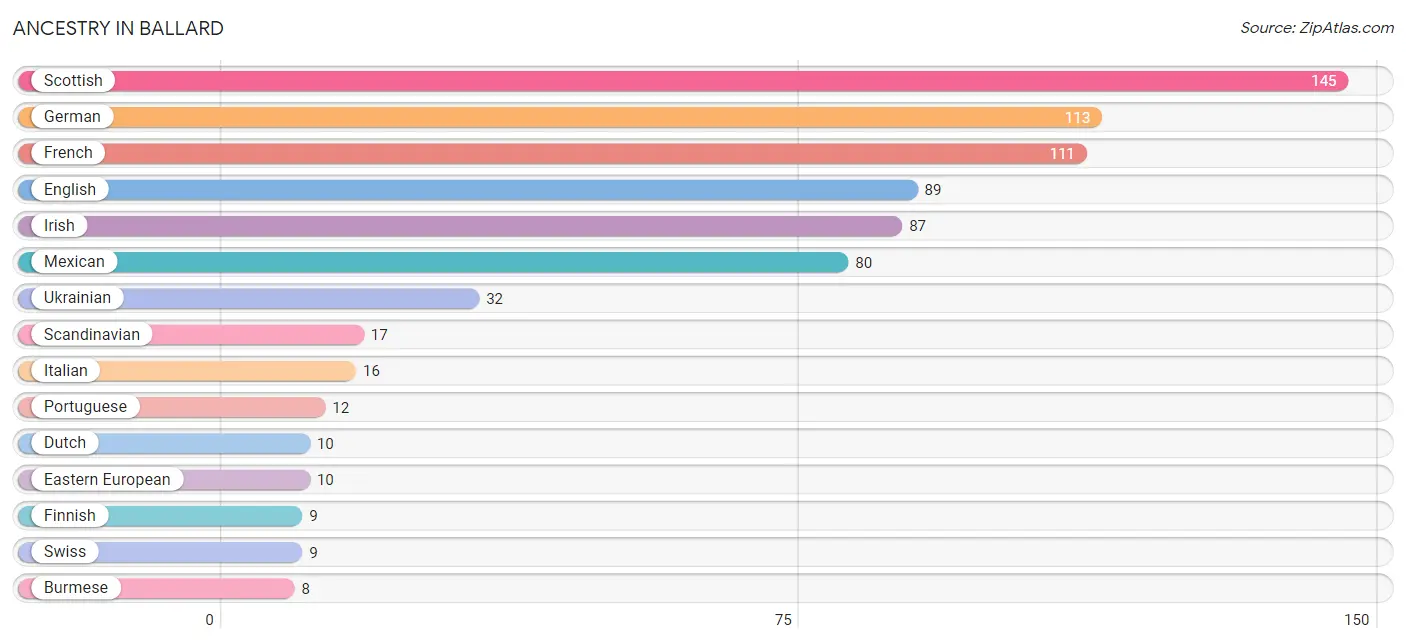
| Ancestry | # Population | % Population |
| American | 2 | 0.3% |
| Bhutanese | 7 | 1.0% |
| Burmese | 8 | 1.1% |
| Cherokee | 2 | 0.3% |
| Danish | 8 | 1.1% |
| Dutch | 10 | 1.4% |
| Eastern European | 10 | 1.4% |
| English | 89 | 12.3% |
| European | 3 | 0.4% |
| Finnish | 9 | 1.3% |
| French | 111 | 15.4% |
| German | 113 | 15.7% |
| Hungarian | 4 | 0.5% |
| Indian (Asian) | 4 | 0.5% |
| Irish | 87 | 12.1% |
| Italian | 16 | 2.2% |
| Mexican | 80 | 11.1% |
| Northern European | 3 | 0.4% |
| Norwegian | 7 | 1.0% |
| Portuguese | 12 | 1.7% |
| Scandinavian | 17 | 2.4% |
| Scottish | 145 | 20.1% |
| Swedish | 4 | 0.5% |
| Swiss | 9 | 1.3% |
| Ukrainian | 32 | 4.4% | View All 25 Rows |
Immigrants in Ballard
The most numerous immigrant groups reported in Ballard came from Europe (41 | 5.7%), Portugal (18 | 2.5%), Southern Europe (18 | 2.5%), Germany (15 | 2.1%), and Western Europe (15 | 2.1%), together accounting for 14.8% of all Ballard residents.
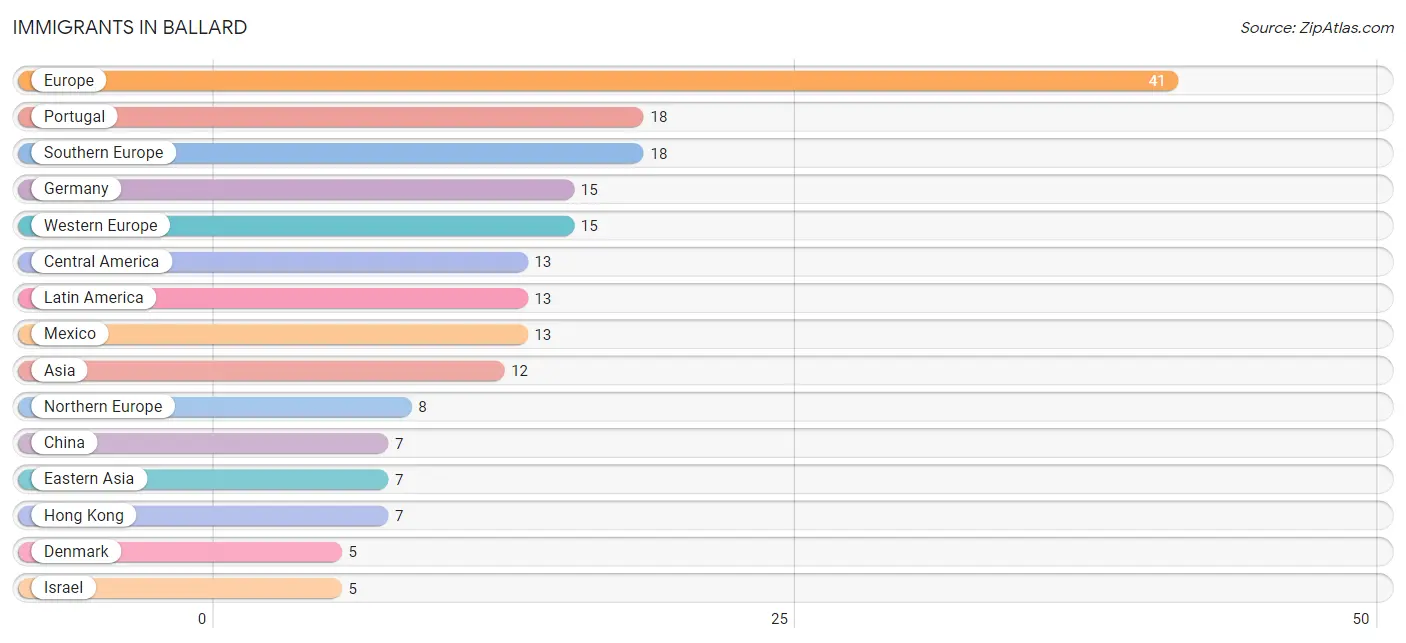
| Immigration Origin | # Population | % Population |
| Asia | 12 | 1.7% |
| Central America | 13 | 1.8% |
| China | 7 | 1.0% |
| Denmark | 5 | 0.7% |
| Eastern Asia | 7 | 1.0% |
| Europe | 41 | 5.7% |
| Germany | 15 | 2.1% |
| Hong Kong | 7 | 1.0% |
| Ireland | 3 | 0.4% |
| Israel | 5 | 0.7% |
| Latin America | 13 | 1.8% |
| Mexico | 13 | 1.8% |
| Northern Europe | 8 | 1.1% |
| Portugal | 18 | 2.5% |
| Southern Europe | 18 | 2.5% |
| Western Asia | 5 | 0.7% |
| Western Europe | 15 | 2.1% | View All 17 Rows |
Sex and Age in Ballard
Sex and Age in Ballard
The most populous age groups in Ballard are 65 to 69 Years (62 | 21.4%) for men and Under 5 Years (59 | 13.7%) for women.
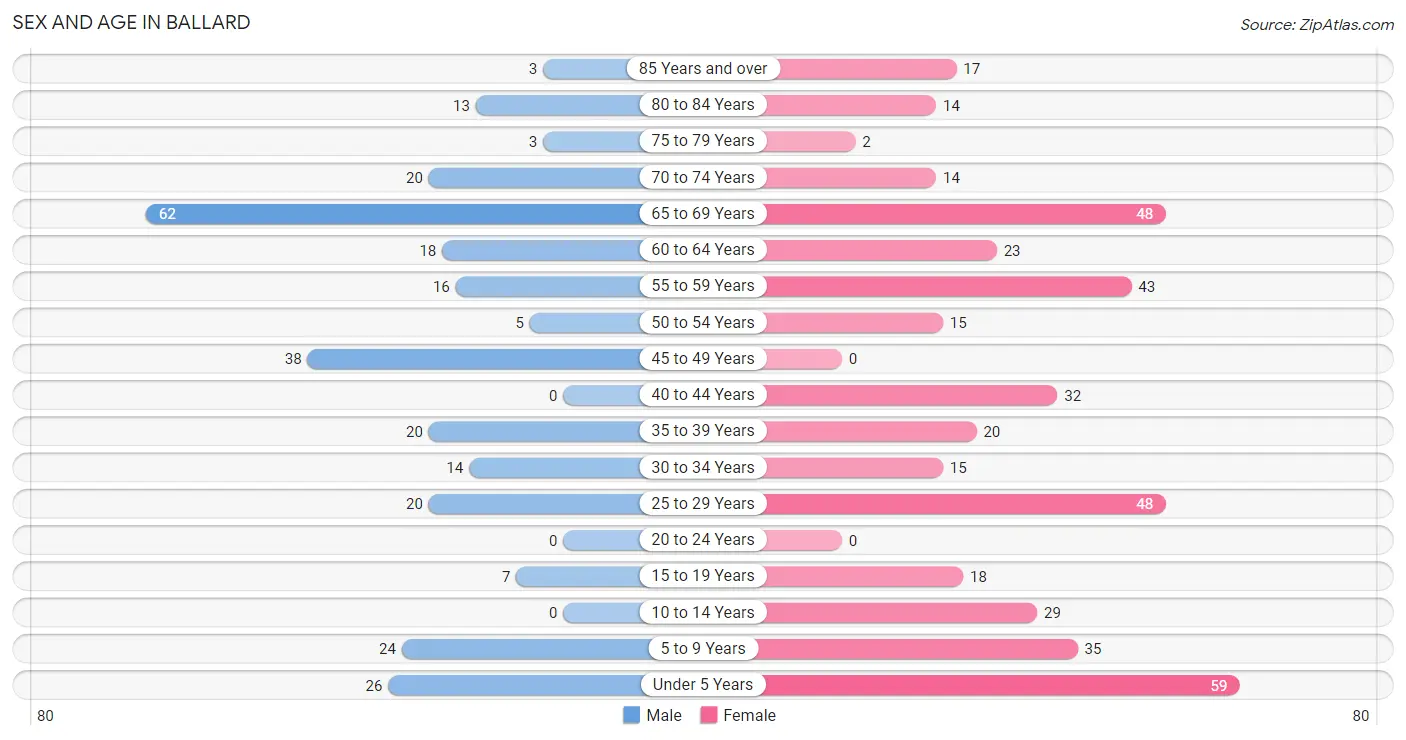
| Age Bracket | Male | Female |
| Under 5 Years | 26 (9.0%) | 59 (13.7%) |
| 5 to 9 Years | 24 (8.3%) | 35 (8.1%) |
| 10 to 14 Years | 0 (0.0%) | 29 (6.7%) |
| 15 to 19 Years | 7 (2.4%) | 18 (4.2%) |
| 20 to 24 Years | 0 (0.0%) | 0 (0.0%) |
| 25 to 29 Years | 20 (6.9%) | 48 (11.1%) |
| 30 to 34 Years | 14 (4.8%) | 15 (3.5%) |
| 35 to 39 Years | 20 (6.9%) | 20 (4.6%) |
| 40 to 44 Years | 0 (0.0%) | 32 (7.4%) |
| 45 to 49 Years | 38 (13.2%) | 0 (0.0%) |
| 50 to 54 Years | 5 (1.7%) | 15 (3.5%) |
| 55 to 59 Years | 16 (5.5%) | 43 (10.0%) |
| 60 to 64 Years | 18 (6.2%) | 23 (5.3%) |
| 65 to 69 Years | 62 (21.4%) | 48 (11.1%) |
| 70 to 74 Years | 20 (6.9%) | 14 (3.2%) |
| 75 to 79 Years | 3 (1.0%) | 2 (0.5%) |
| 80 to 84 Years | 13 (4.5%) | 14 (3.2%) |
| 85 Years and over | 3 (1.0%) | 17 (3.9%) |
| Total | 289 (100.0%) | 432 (100.0%) |
Families and Households in Ballard
Median Family Size in Ballard
The median family size in Ballard is 3.48 persons per family, with single male/father families (9 | 5.0%) accounting for the largest median family size of 4.33 persons per family. On the other hand, single female/mother families (17 | 9.4%) represent the smallest median family size with 2.29 persons per family.
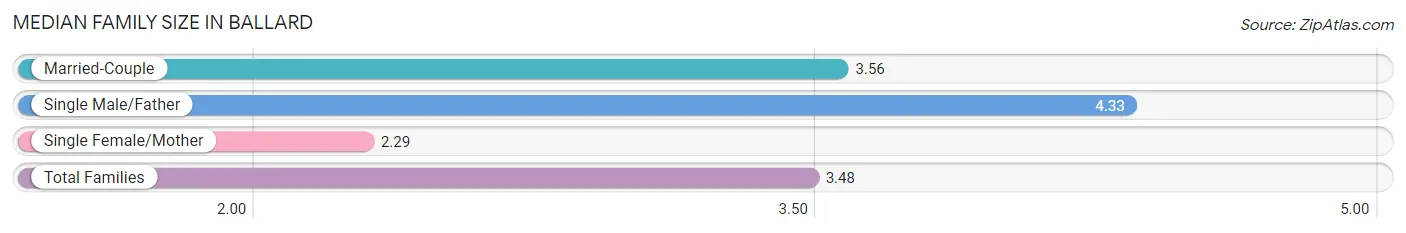
| Family Type | # Families | Family Size |
| Married-Couple | 155 (85.6%) | 3.56 |
| Single Male/Father | 9 (5.0%) | 4.33 |
| Single Female/Mother | 17 (9.4%) | 2.29 |
| Total Families | 181 (100.0%) | 3.48 |
Median Household Size in Ballard
The median household size in Ballard is 2.81 persons per household, with single male/father households (9 | 3.5%) accounting for the largest median household size of 4.33 persons per household. non-family households (76 | 29.6%) represent the smallest median household size with 1.17 persons per household.
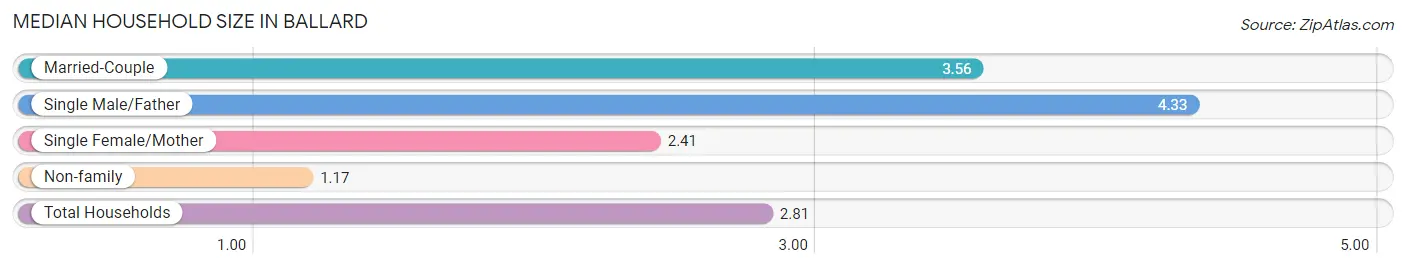
| Household Type | # Households | Household Size |
| Married-Couple | 155 (60.3%) | 3.56 |
| Single Male/Father | 9 (3.5%) | 4.33 |
| Single Female/Mother | 17 (6.6%) | 2.41 |
| Non-family | 76 (29.6%) | 1.17 |
| Total Households | 257 (100.0%) | 2.81 |
Household Size by Marriage Status in Ballard
Out of a total of 257 households in Ballard, 181 (70.4%) are family households, while 76 (29.6%) are nonfamily households. The most numerous type of family households are 2-person households, comprising 97, and the most common type of nonfamily households are 1-person households, comprising 65.
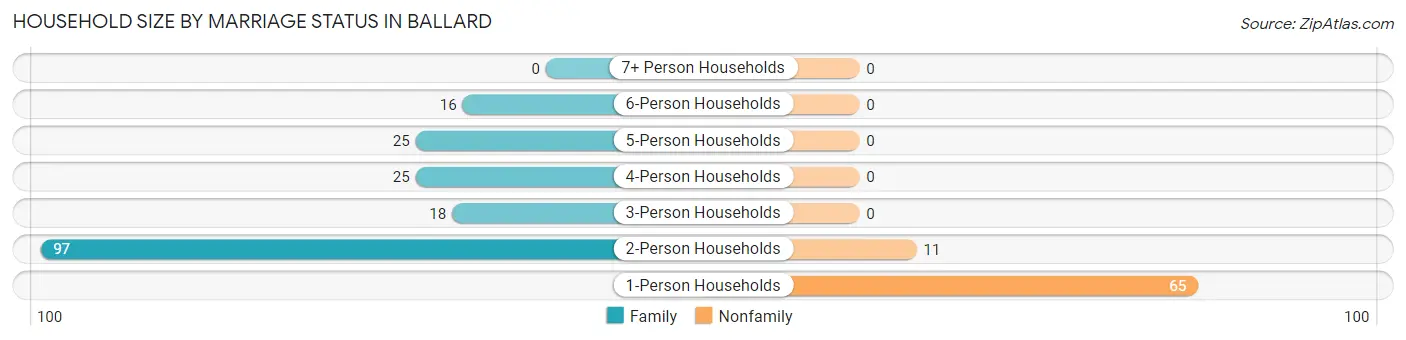
| Household Size | Family Households | Nonfamily Households |
| 1-Person Households | - | 65 (25.3%) |
| 2-Person Households | 97 (37.7%) | 11 (4.3%) |
| 3-Person Households | 18 (7.0%) | 0 (0.0%) |
| 4-Person Households | 25 (9.7%) | 0 (0.0%) |
| 5-Person Households | 25 (9.7%) | 0 (0.0%) |
| 6-Person Households | 16 (6.2%) | 0 (0.0%) |
| 7+ Person Households | 0 (0.0%) | 0 (0.0%) |
| Total | 181 (70.4%) | 76 (29.6%) |
Female Fertility in Ballard
Fertility by Age in Ballard
Average fertility rate in Ballard is 60.0 births per 1,000 women. Women in the age bracket of 35 to 50 years have the highest fertility rate with 154.0 births per 1,000 women. Women in the age bracket of 35 to 50 years acount for 100.0% of all women with births.
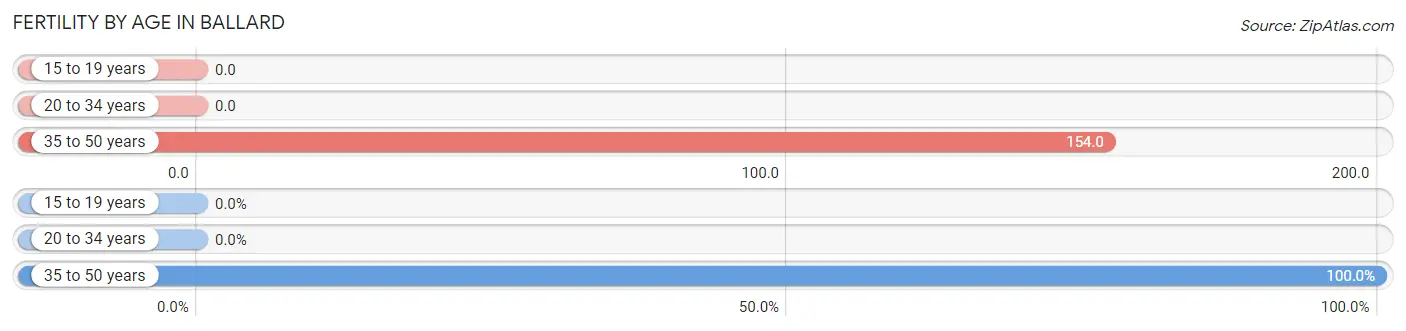
| Age Bracket | Women with Births | Births / 1,000 Women |
| 15 to 19 years | 0 (0.0%) | 0.0 |
| 20 to 34 years | 0 (0.0%) | 0.0 |
| 35 to 50 years | 8 (100.0%) | 154.0 |
| Total | 8 (100.0%) | 60.0 |
Fertility by Age by Marriage Status in Ballard
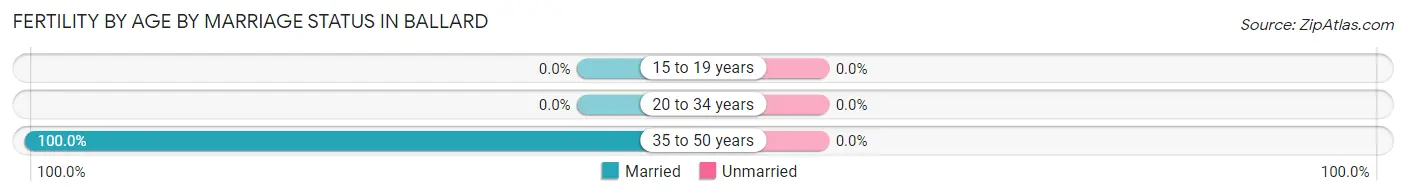
| Age Bracket | Married | Unmarried |
| 15 to 19 years | 0 (0.0%) | 0 (0.0%) |
| 20 to 34 years | 0 (0.0%) | 0 (0.0%) |
| 35 to 50 years | 8 (100.0%) | 0 (0.0%) |
| Total | 8 (100.0%) | 0 (0.0%) |
Fertility by Education in Ballard
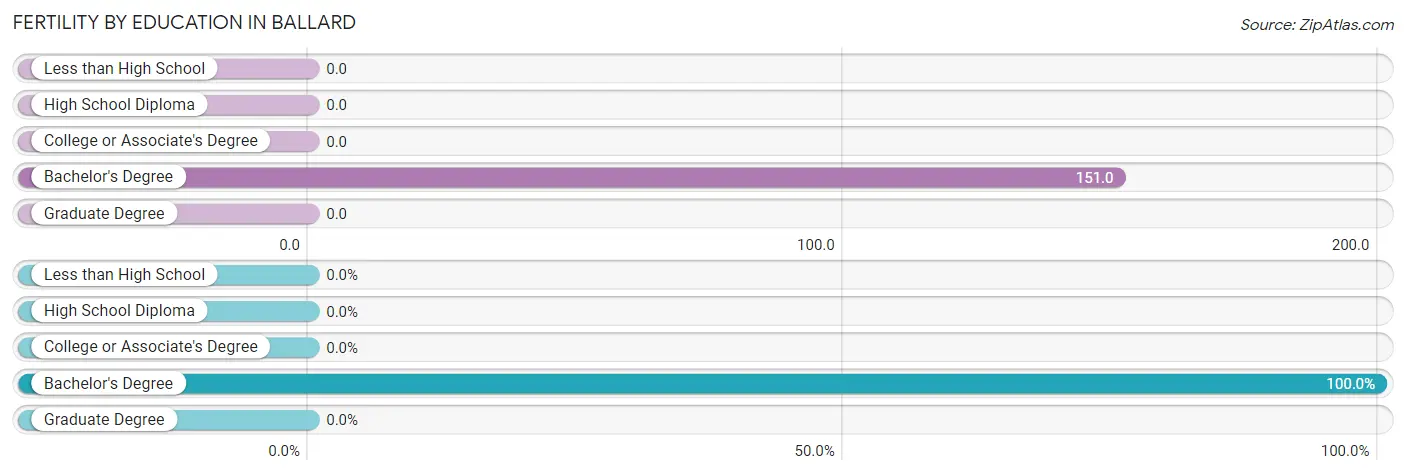
| Educational Attainment | Women with Births | Births / 1,000 Women |
| Less than High School | 0 (0.0%) | 0.0 |
| High School Diploma | 0 (0.0%) | 0.0 |
| College or Associate's Degree | 0 (0.0%) | 0.0 |
| Bachelor's Degree | 8 (100.0%) | 151.0 |
| Graduate Degree | 0 (0.0%) | 0.0 |
| Total | 8 (100.0%) | 60.0 |
Fertility by Education by Marriage Status in Ballard
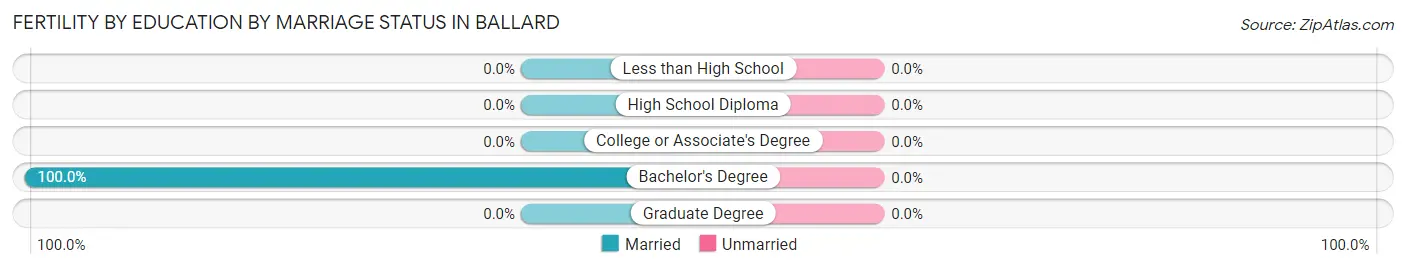
| Educational Attainment | Married | Unmarried |
| Less than High School | 0 (0.0%) | 0 (0.0%) |
| High School Diploma | 0 (0.0%) | 0 (0.0%) |
| College or Associate's Degree | 0 (0.0%) | 0 (0.0%) |
| Bachelor's Degree | 8 (100.0%) | 0 (0.0%) |
| Graduate Degree | 0 (0.0%) | 0 (0.0%) |
| Total | 8 (100.0%) | 0 (0.0%) |
Employment Characteristics in Ballard
Employment by Class of Employer in Ballard
Among the 253 employed individuals in Ballard, private company employees (109 | 43.1%), self-employed (not incorporated) (92 | 36.4%), and self-employed (incorporated) (27 | 10.7%) make up the most common classes of employment.
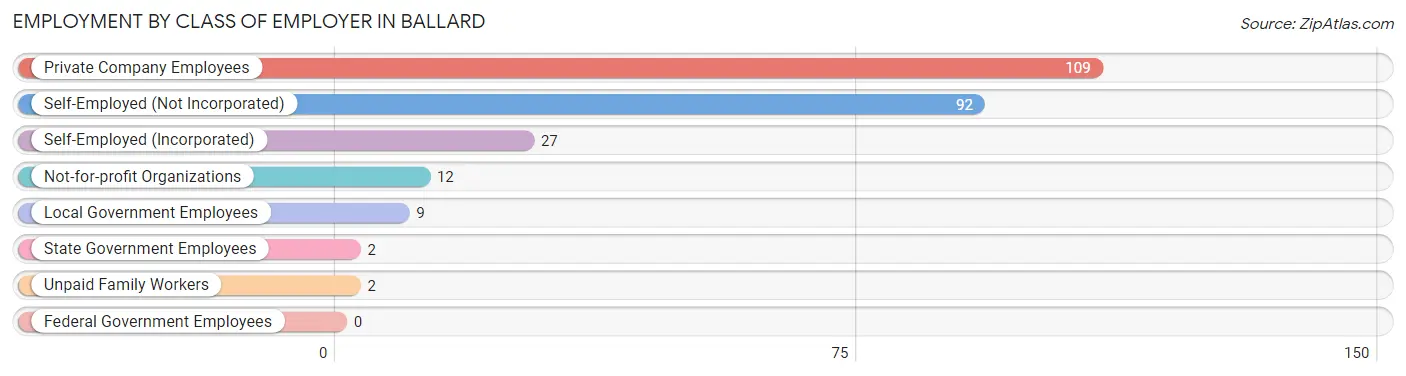
| Employer Class | # Employees | % Employees |
| Private Company Employees | 109 | 43.1% |
| Self-Employed (Incorporated) | 27 | 10.7% |
| Self-Employed (Not Incorporated) | 92 | 36.4% |
| Not-for-profit Organizations | 12 | 4.7% |
| Local Government Employees | 9 | 3.6% |
| State Government Employees | 2 | 0.8% |
| Federal Government Employees | 0 | 0.0% |
| Unpaid Family Workers | 2 | 0.8% |
| Total | 253 | 100.0% |
Employment Status by Age in Ballard
According to the labor force statistics for Ballard, out of the total population over 16 years of age (534), 49.6% or 265 individuals are in the labor force, with 1.1% or 3 of them unemployed. The age group with the highest labor force participation rate is 25 to 29 years, with 79.4% or 54 individuals in the labor force. Within the labor force, the 60 to 64 years age range has the highest percentage of unemployed individuals, with 13.0% or 3 of them being unemployed.
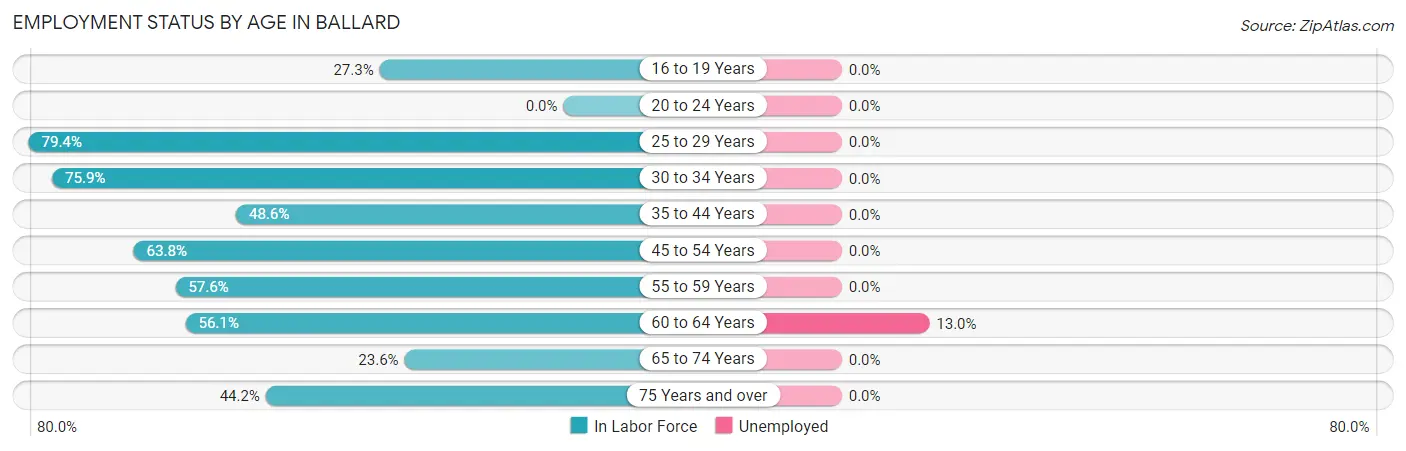
| Age Bracket | In Labor Force | Unemployed |
| 16 to 19 Years | 3 (27.3%) | 0 (0.0%) |
| 20 to 24 Years | 0 (0.0%) | 0 (0.0%) |
| 25 to 29 Years | 54 (79.4%) | 0 (0.0%) |
| 30 to 34 Years | 22 (75.9%) | 0 (0.0%) |
| 35 to 44 Years | 35 (48.6%) | 0 (0.0%) |
| 45 to 54 Years | 37 (63.8%) | 0 (0.0%) |
| 55 to 59 Years | 34 (57.6%) | 0 (0.0%) |
| 60 to 64 Years | 23 (56.1%) | 3 (13.0%) |
| 65 to 74 Years | 34 (23.6%) | 0 (0.0%) |
| 75 Years and over | 23 (44.2%) | 0 (0.0%) |
| Total | 265 (49.6%) | 3 (1.1%) |
Employment Status by Educational Attainment in Ballard
According to labor force statistics for Ballard, 62.7% of individuals (205) out of the total population between 25 and 64 years of age (327) are in the labor force, with 1.5% or 3 of them being unemployed. The group with the highest labor force participation rate are those with the educational attainment of high school diploma, with 80.8% or 42 individuals in the labor force. Within the labor force, individuals with bachelor's degree or higher education have the highest percentage of unemployment, with 3.7% or 3 of them being unemployed.
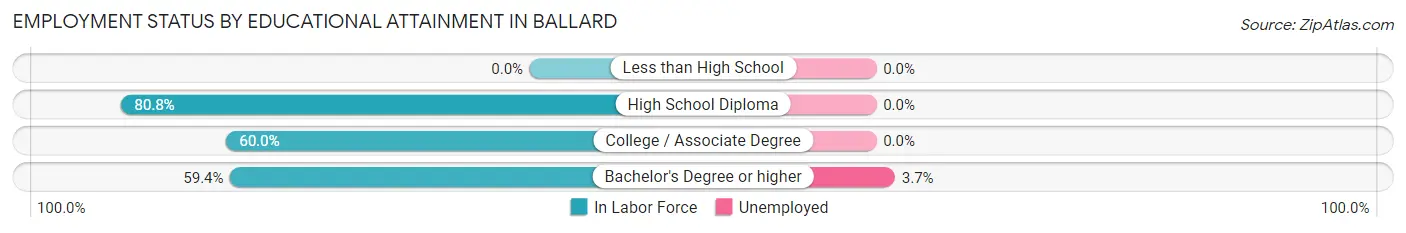
| Educational Attainment | In Labor Force | Unemployed |
| Less than High School | 0 (0.0%) | 0 (0.0%) |
| High School Diploma | 42 (80.8%) | 0 (0.0%) |
| College / Associate Degree | 81 (60.0%) | 0 (0.0%) |
| Bachelor's Degree or higher | 82 (59.4%) | 5 (3.7%) |
| Total | 205 (62.7%) | 5 (1.5%) |
Employment Occupations by Sex in Ballard
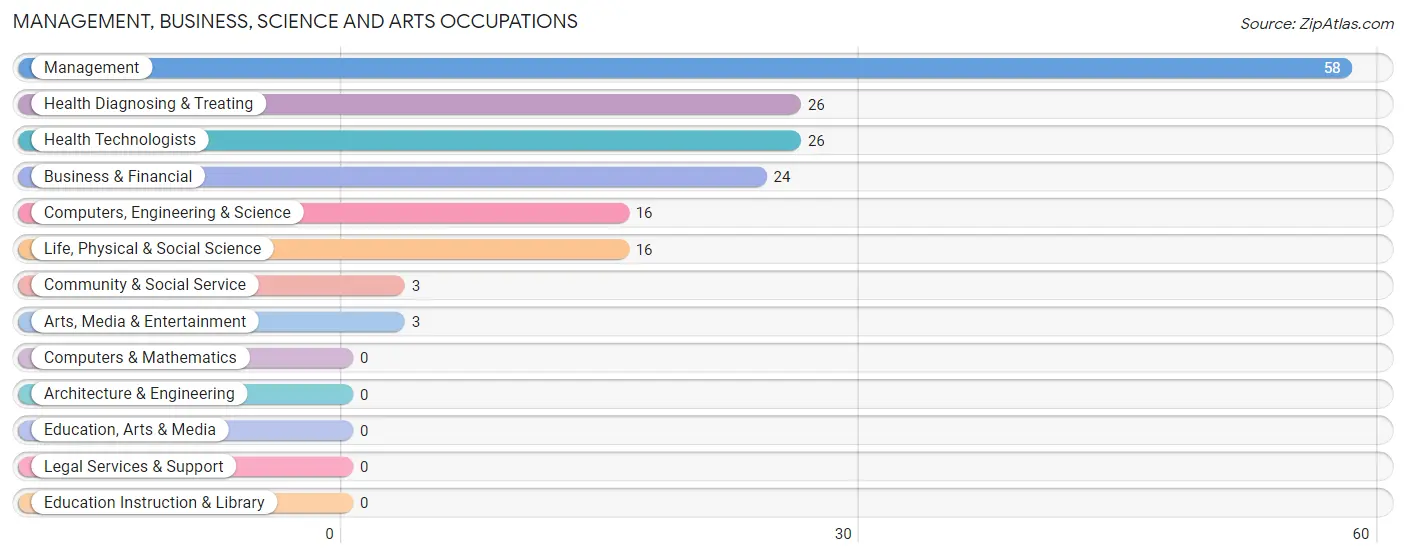
Management, Business, Science and Arts Occupations
The most common Management, Business, Science and Arts occupations in Ballard are Management (58 | 22.1%), Health Diagnosing & Treating (26 | 9.9%), Health Technologists (26 | 9.9%), Business & Financial (24 | 9.2%), and Computers, Engineering & Science (16 | 6.1%).
Management, Business, Science and Arts Occupations by Sex
Within the Management, Business, Science and Arts occupations in Ballard, the most male-oriented occupations are Management (50.0%), Business & Financial (50.0%), and Health Diagnosing & Treating (46.2%), while the most female-oriented occupations are Computers, Engineering & Science (100.0%), Life, Physical & Social Science (100.0%), and Community & Social Service (100.0%).
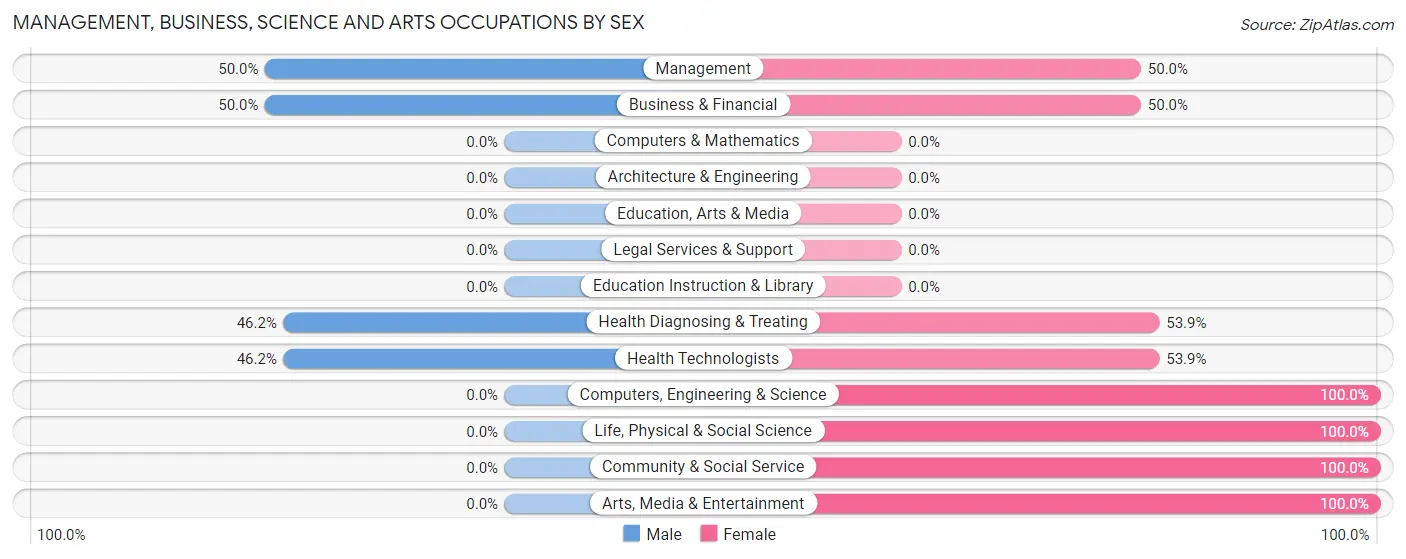
| Occupation | Male | Female |
| Management | 29 (50.0%) | 29 (50.0%) |
| Business & Financial | 12 (50.0%) | 12 (50.0%) |
| Computers, Engineering & Science | 0 (0.0%) | 16 (100.0%) |
| Computers & Mathematics | 0 (0.0%) | 0 (0.0%) |
| Architecture & Engineering | 0 (0.0%) | 0 (0.0%) |
| Life, Physical & Social Science | 0 (0.0%) | 16 (100.0%) |
| Community & Social Service | 0 (0.0%) | 3 (100.0%) |
| Education, Arts & Media | 0 (0.0%) | 0 (0.0%) |
| Legal Services & Support | 0 (0.0%) | 0 (0.0%) |
| Education Instruction & Library | 0 (0.0%) | 0 (0.0%) |
| Arts, Media & Entertainment | 0 (0.0%) | 3 (100.0%) |
| Health Diagnosing & Treating | 12 (46.2%) | 14 (53.8%) |
| Health Technologists | 12 (46.2%) | 14 (53.8%) |
| Total (Category) | 53 (41.7%) | 74 (58.3%) |
| Total (Overall) | 104 (39.7%) | 158 (60.3%) |
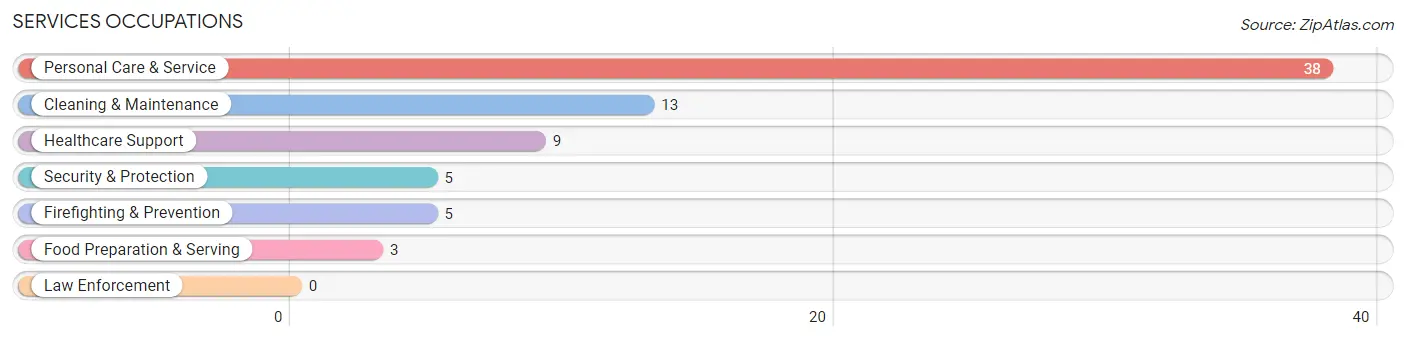
Services Occupations
The most common Services occupations in Ballard are Personal Care & Service (38 | 14.5%), Cleaning & Maintenance (13 | 5.0%), Healthcare Support (9 | 3.4%), Security & Protection (5 | 1.9%), and Firefighting & Prevention (5 | 1.9%).
Services Occupations by Sex
Within the Services occupations in Ballard, the most male-oriented occupations are Security & Protection (100.0%), Firefighting & Prevention (100.0%), and Healthcare Support (44.4%), while the most female-oriented occupations are Food Preparation & Serving (100.0%), Cleaning & Maintenance (100.0%), and Personal Care & Service (86.8%).
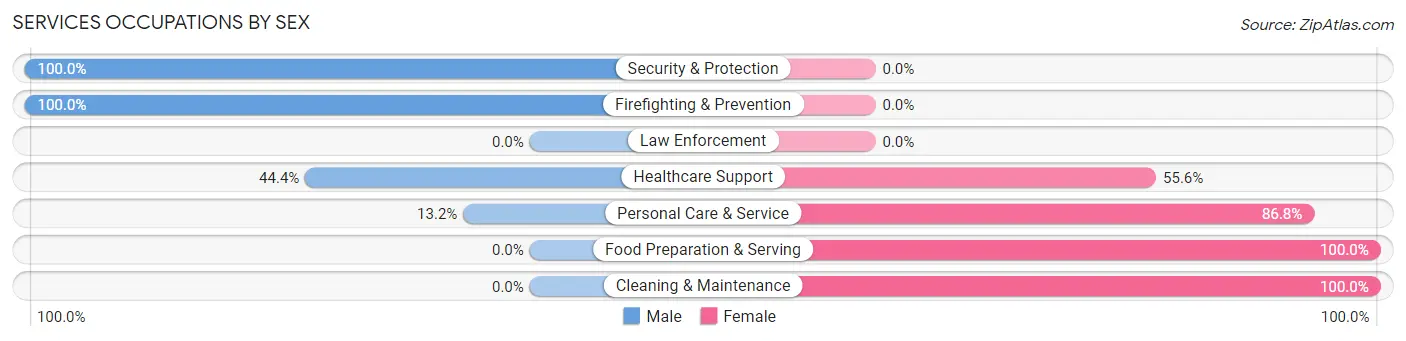
| Occupation | Male | Female |
| Healthcare Support | 4 (44.4%) | 5 (55.6%) |
| Security & Protection | 5 (100.0%) | 0 (0.0%) |
| Firefighting & Prevention | 5 (100.0%) | 0 (0.0%) |
| Law Enforcement | 0 (0.0%) | 0 (0.0%) |
| Food Preparation & Serving | 0 (0.0%) | 3 (100.0%) |
| Cleaning & Maintenance | 0 (0.0%) | 13 (100.0%) |
| Personal Care & Service | 5 (13.2%) | 33 (86.8%) |
| Total (Category) | 14 (20.6%) | 54 (79.4%) |
| Total (Overall) | 104 (39.7%) | 158 (60.3%) |
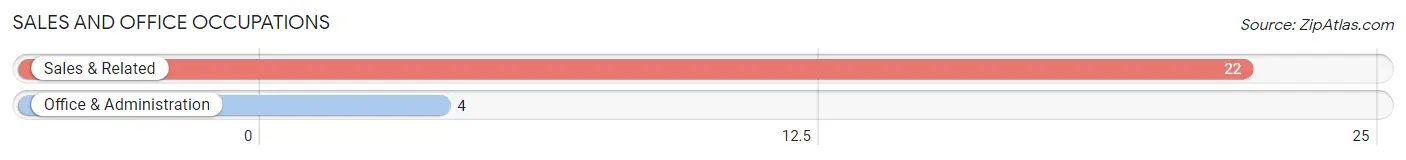
Sales and Office Occupations
The most common Sales and Office occupations in Ballard are Sales & Related (22 | 8.4%), and Office & Administration (4 | 1.5%).
Sales and Office Occupations by Sex
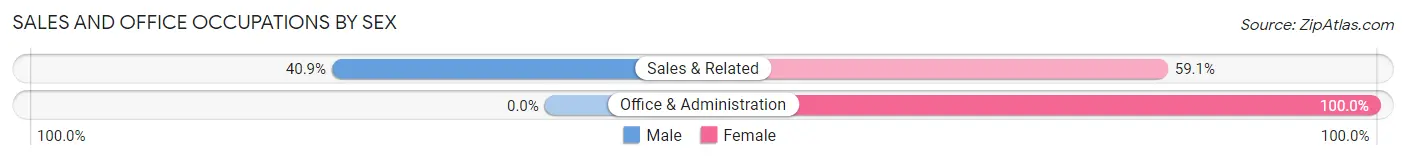
| Occupation | Male | Female |
| Sales & Related | 9 (40.9%) | 13 (59.1%) |
| Office & Administration | 0 (0.0%) | 4 (100.0%) |
| Total (Category) | 9 (34.6%) | 17 (65.4%) |
| Total (Overall) | 104 (39.7%) | 158 (60.3%) |
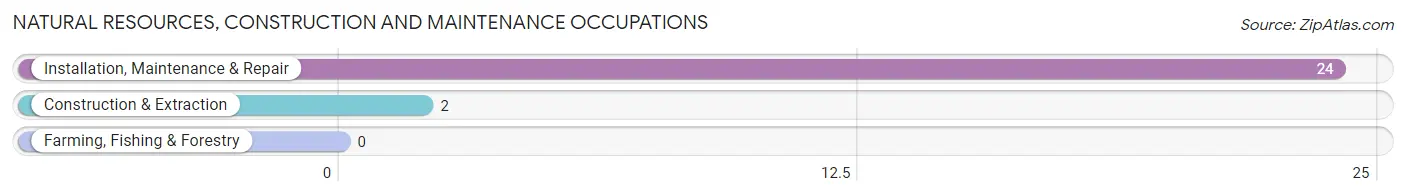
Natural Resources, Construction and Maintenance Occupations
The most common Natural Resources, Construction and Maintenance occupations in Ballard are Installation, Maintenance & Repair (24 | 9.2%), and Construction & Extraction (2 | 0.8%).
Natural Resources, Construction and Maintenance Occupations by Sex
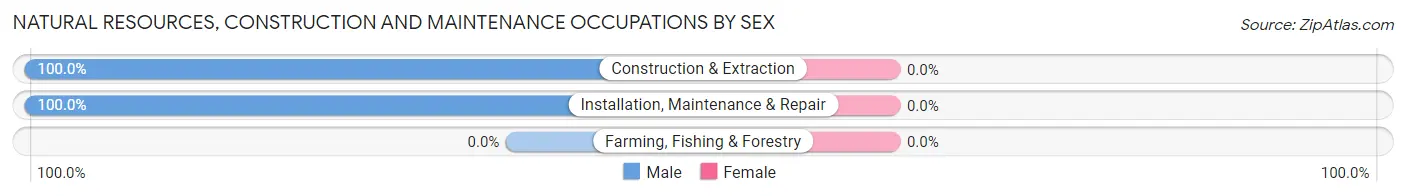
| Occupation | Male | Female |
| Farming, Fishing & Forestry | 0 (0.0%) | 0 (0.0%) |
| Construction & Extraction | 2 (100.0%) | 0 (0.0%) |
| Installation, Maintenance & Repair | 24 (100.0%) | 0 (0.0%) |
| Total (Category) | 26 (100.0%) | 0 (0.0%) |
| Total (Overall) | 104 (39.7%) | 158 (60.3%) |
Production, Transportation and Moving Occupations
The most common Production, Transportation and Moving occupations in Ballard are Production (13 | 5.0%), and Material Moving (2 | 0.8%).
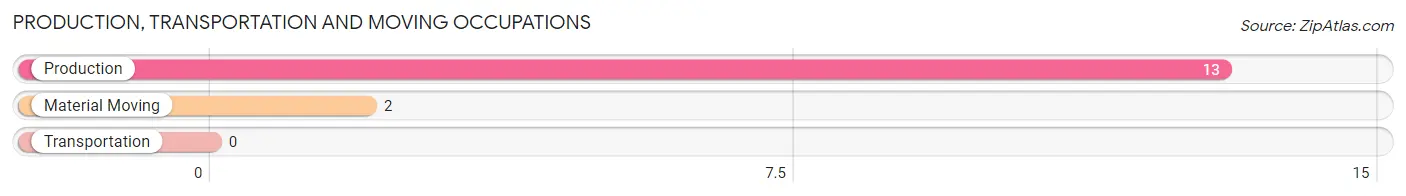
Production, Transportation and Moving Occupations by Sex
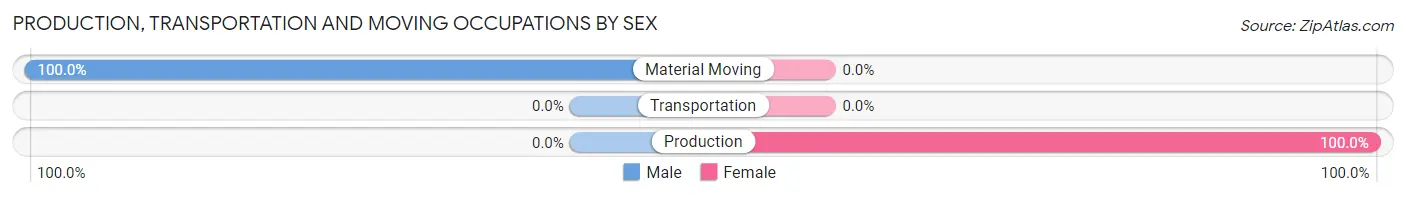
| Occupation | Male | Female |
| Production | 0 (0.0%) | 13 (100.0%) |
| Transportation | 0 (0.0%) | 0 (0.0%) |
| Material Moving | 2 (100.0%) | 0 (0.0%) |
| Total (Category) | 2 (13.3%) | 13 (86.7%) |
| Total (Overall) | 104 (39.7%) | 158 (60.3%) |
Employment Industries by Sex in Ballard
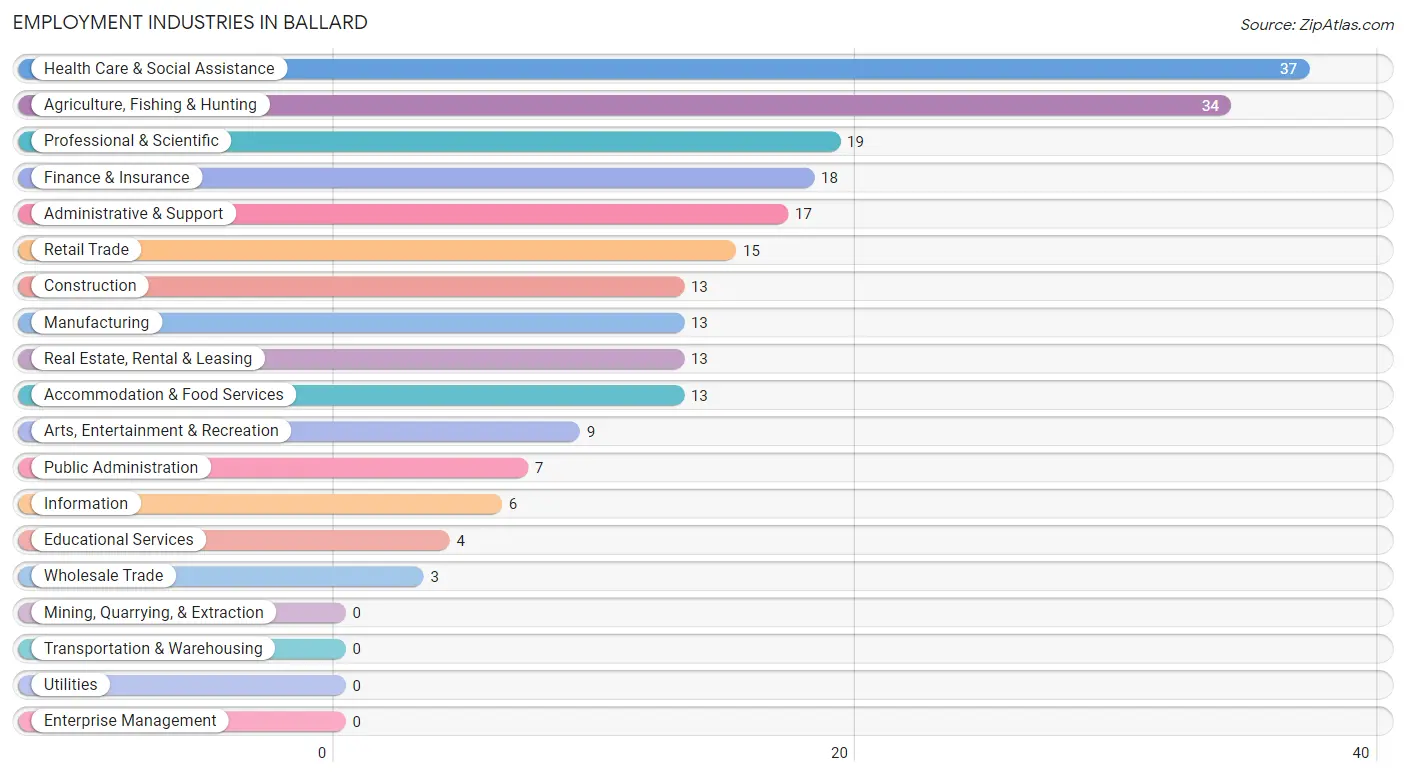
Employment Industries in Ballard
The major employment industries in Ballard include Health Care & Social Assistance (37 | 14.1%), Agriculture, Fishing & Hunting (34 | 13.0%), Professional & Scientific (19 | 7.2%), Finance & Insurance (18 | 6.9%), and Administrative & Support (17 | 6.5%).
Employment Industries by Sex in Ballard
The Ballard industries that see more men than women are Information (100.0%), Arts, Entertainment & Recreation (100.0%), and Real Estate, Rental & Leasing (76.9%), whereas the industries that tend to have a higher number of women are Agriculture, Fishing & Hunting (100.0%), Manufacturing (100.0%), and Wholesale Trade (100.0%).
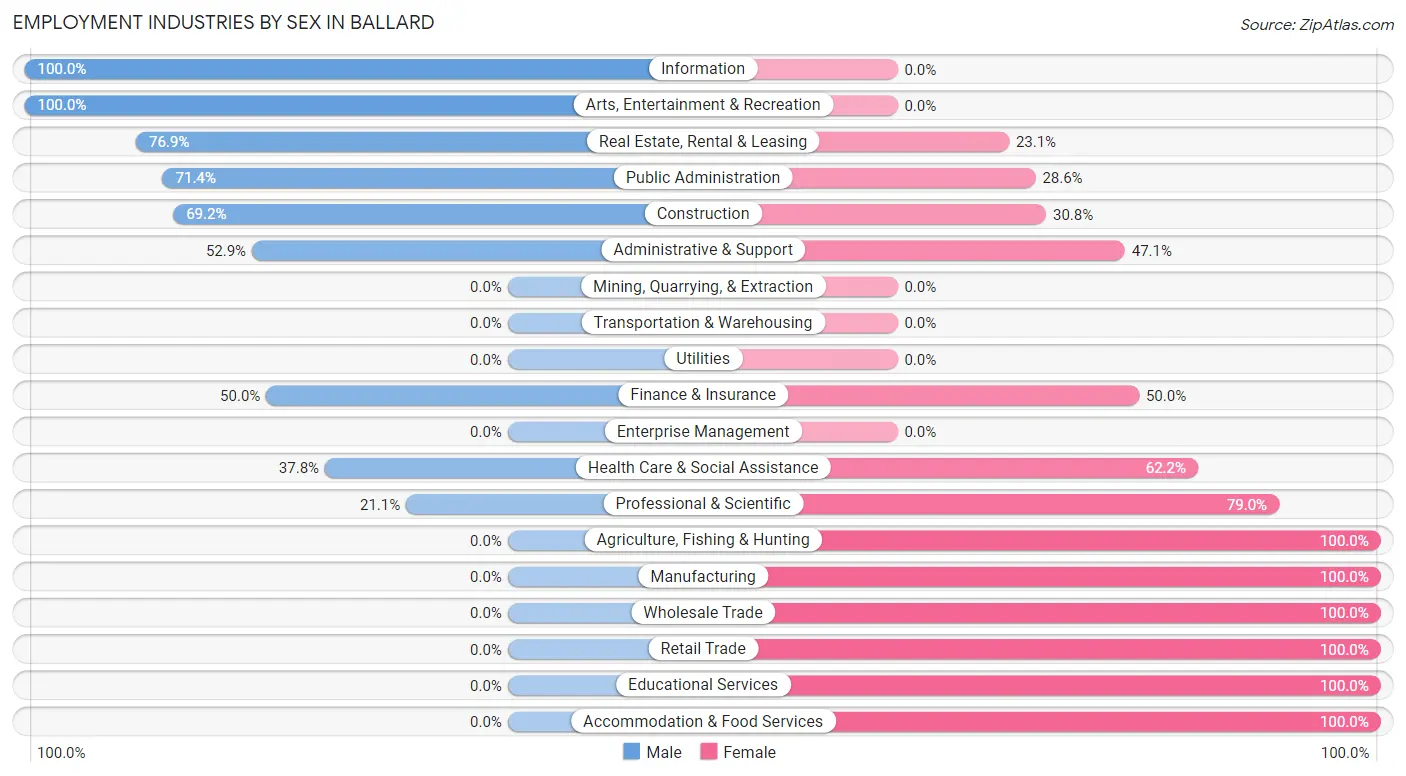
| Industry | Male | Female |
| Agriculture, Fishing & Hunting | 0 (0.0%) | 34 (100.0%) |
| Mining, Quarrying, & Extraction | 0 (0.0%) | 0 (0.0%) |
| Construction | 9 (69.2%) | 4 (30.8%) |
| Manufacturing | 0 (0.0%) | 13 (100.0%) |
| Wholesale Trade | 0 (0.0%) | 3 (100.0%) |
| Retail Trade | 0 (0.0%) | 15 (100.0%) |
| Transportation & Warehousing | 0 (0.0%) | 0 (0.0%) |
| Utilities | 0 (0.0%) | 0 (0.0%) |
| Information | 6 (100.0%) | 0 (0.0%) |
| Finance & Insurance | 9 (50.0%) | 9 (50.0%) |
| Real Estate, Rental & Leasing | 10 (76.9%) | 3 (23.1%) |
| Professional & Scientific | 4 (21.0%) | 15 (78.9%) |
| Enterprise Management | 0 (0.0%) | 0 (0.0%) |
| Administrative & Support | 9 (52.9%) | 8 (47.1%) |
| Educational Services | 0 (0.0%) | 4 (100.0%) |
| Health Care & Social Assistance | 14 (37.8%) | 23 (62.2%) |
| Arts, Entertainment & Recreation | 9 (100.0%) | 0 (0.0%) |
| Accommodation & Food Services | 0 (0.0%) | 13 (100.0%) |
| Public Administration | 5 (71.4%) | 2 (28.6%) |
| Total | 104 (39.7%) | 158 (60.3%) |
Education in Ballard
School Enrollment in Ballard
The most common levels of schooling among the 105 students in Ballard are nursery / preschool (32 | 30.5%), middle school (29 | 27.6%), and high school (24 | 22.9%).
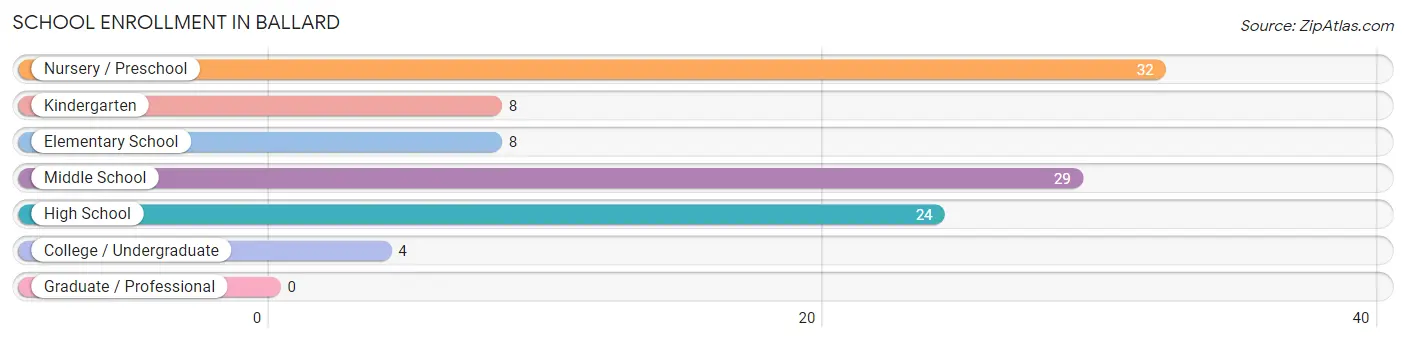
| School Level | # Students | % Students |
| Nursery / Preschool | 32 | 30.5% |
| Kindergarten | 8 | 7.6% |
| Elementary School | 8 | 7.6% |
| Middle School | 29 | 27.6% |
| High School | 24 | 22.9% |
| College / Undergraduate | 4 | 3.8% |
| Graduate / Professional | 0 | 0.0% |
| Total | 105 | 100.0% |
School Enrollment by Age by Funding Source in Ballard
Out of a total of 105 students who are enrolled in schools in Ballard, 42 (40.0%) attend a private institution, while the remaining 63 (60.0%) are enrolled in public schools. The age group of 3 to 4 year olds has the highest likelihood of being enrolled in private schools, with 23 (100.0% in the age bracket) enrolled. Conversely, the age group of 5 to 9 year old has the lowest likelihood of being enrolled in a private school, with 25 (100.0% in the age bracket) attending a public institution.
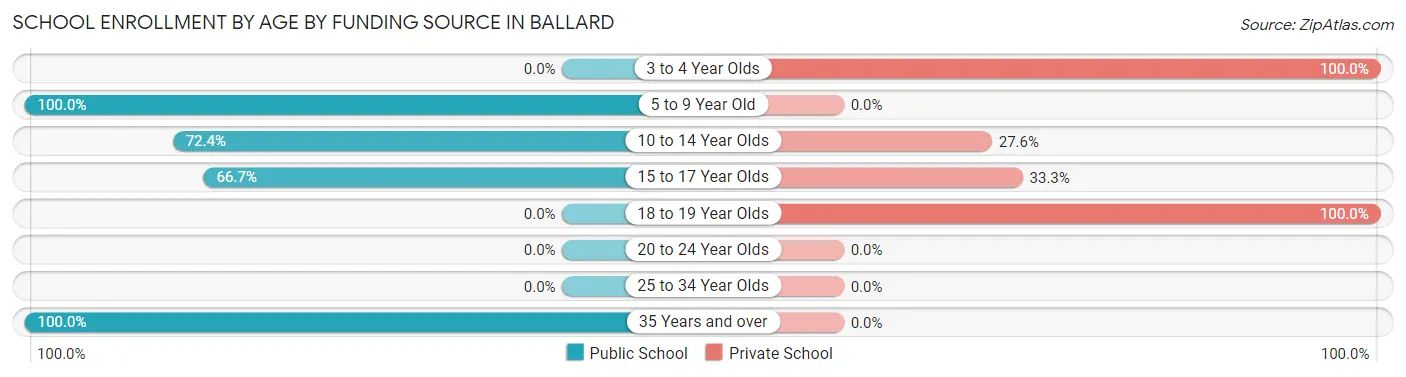
| Age Bracket | Public School | Private School |
| 3 to 4 Year Olds | 0 (0.0%) | 23 (100.0%) |
| 5 to 9 Year Old | 25 (100.0%) | 0 (0.0%) |
| 10 to 14 Year Olds | 21 (72.4%) | 8 (27.6%) |
| 15 to 17 Year Olds | 14 (66.7%) | 7 (33.3%) |
| 18 to 19 Year Olds | 0 (0.0%) | 4 (100.0%) |
| 20 to 24 Year Olds | 0 (0.0%) | 0 (0.0%) |
| 25 to 34 Year Olds | 0 (0.0%) | 0 (0.0%) |
| 35 Years and over | 3 (100.0%) | 0 (0.0%) |
| Total | 63 (60.0%) | 42 (40.0%) |
Educational Attainment by Field of Study in Ballard
Business (49 | 21.4%), science & technology (38 | 16.6%), visual & performing arts (23 | 10.0%), psychology (21 | 9.2%), and social sciences (21 | 9.2%) are the most common fields of study among 229 individuals in Ballard who have obtained a bachelor's degree or higher.
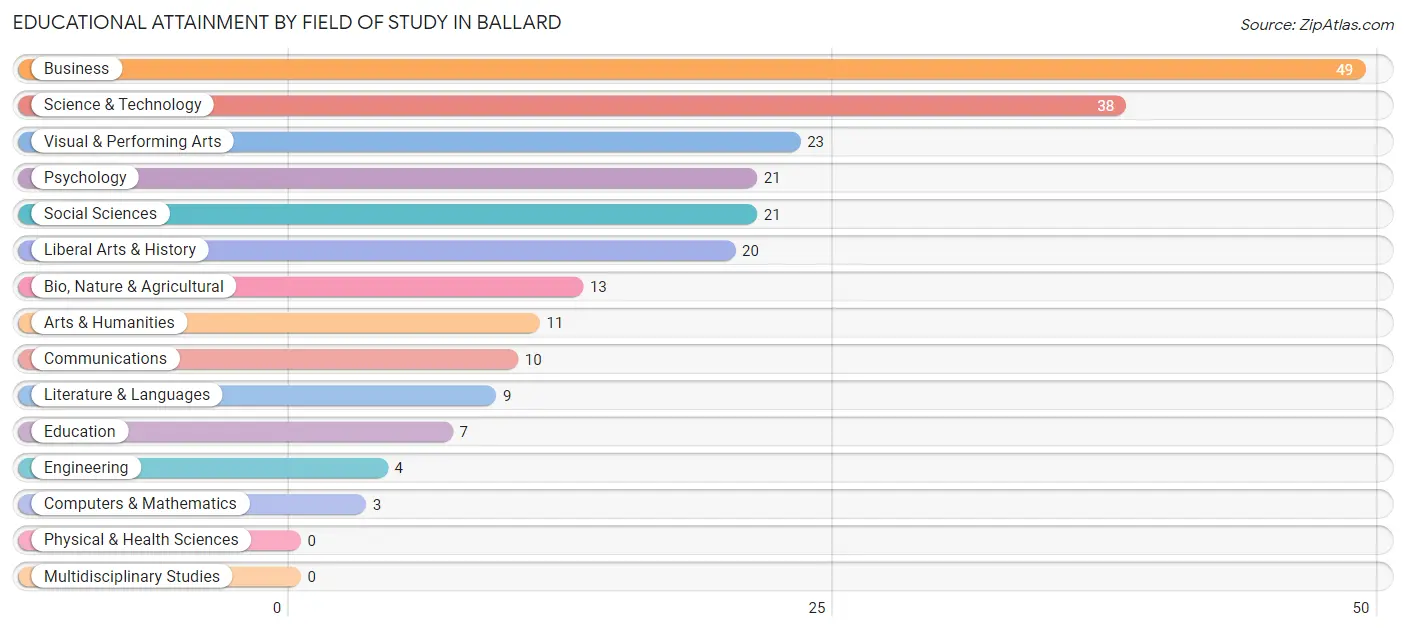
| Field of Study | # Graduates | % Graduates |
| Computers & Mathematics | 3 | 1.3% |
| Bio, Nature & Agricultural | 13 | 5.7% |
| Physical & Health Sciences | 0 | 0.0% |
| Psychology | 21 | 9.2% |
| Social Sciences | 21 | 9.2% |
| Engineering | 4 | 1.8% |
| Multidisciplinary Studies | 0 | 0.0% |
| Science & Technology | 38 | 16.6% |
| Business | 49 | 21.4% |
| Education | 7 | 3.1% |
| Literature & Languages | 9 | 3.9% |
| Liberal Arts & History | 20 | 8.7% |
| Visual & Performing Arts | 23 | 10.0% |
| Communications | 10 | 4.4% |
| Arts & Humanities | 11 | 4.8% |
| Total | 229 | 100.0% |
Transportation & Commute in Ballard
Vehicle Availability by Sex in Ballard
The most prevalent vehicle ownership categories in Ballard are males with 3 vehicles (63, accounting for 62.4%) and females with 3 vehicles (58, making up 41.4%).
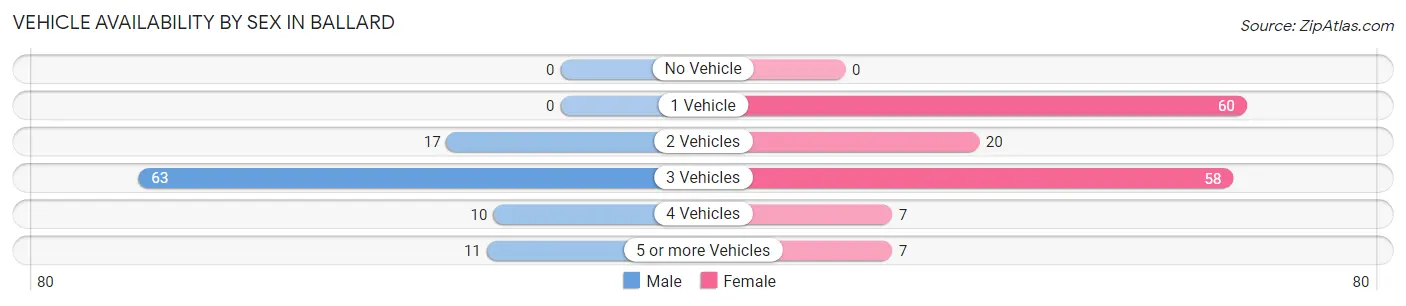
| Vehicles Available | Male | Female |
| No Vehicle | 0 (0.0%) | 0 (0.0%) |
| 1 Vehicle | 0 (0.0%) | 60 (39.5%) |
| 2 Vehicles | 17 (16.8%) | 20 (13.2%) |
| 3 Vehicles | 63 (62.4%) | 58 (38.2%) |
| 4 Vehicles | 10 (9.9%) | 7 (4.6%) |
| 5 or more Vehicles | 11 (10.9%) | 7 (4.6%) |
| Total | 101 (100.0%) | 152 (100.0%) |
Commute Time in Ballard
The most frequently occuring commute durations in Ballard are 5 to 9 minutes (70 commuters, 37.2%), 10 to 14 minutes (30 commuters, 16.0%), and 15 to 19 minutes (25 commuters, 13.3%).
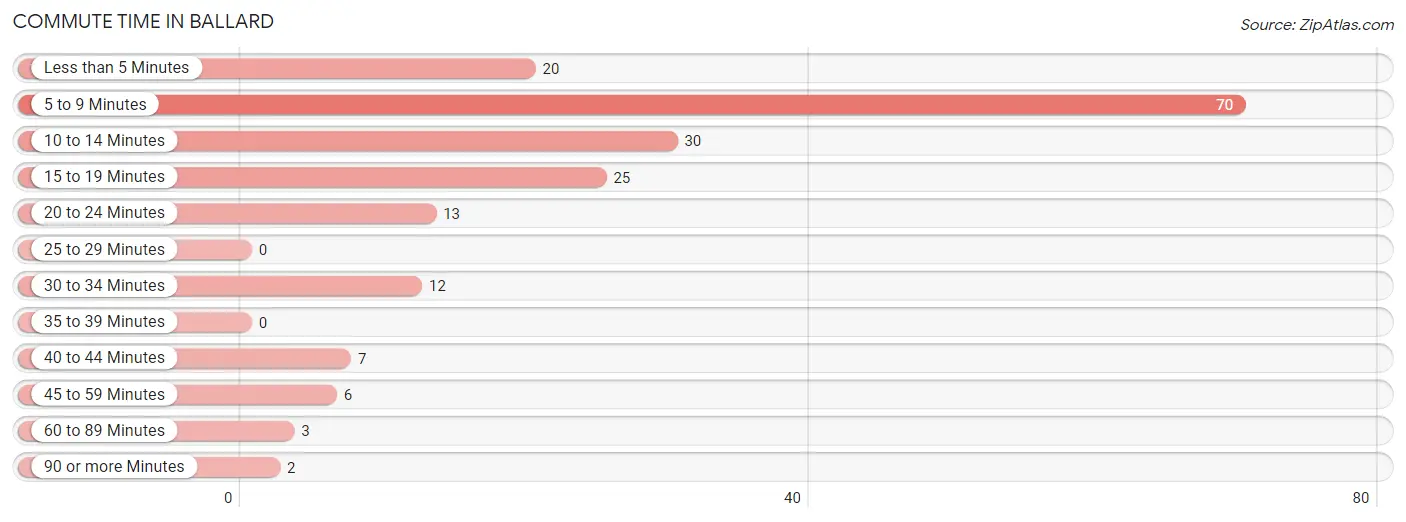
| Commute Time | # Commuters | % Commuters |
| Less than 5 Minutes | 20 | 10.6% |
| 5 to 9 Minutes | 70 | 37.2% |
| 10 to 14 Minutes | 30 | 16.0% |
| 15 to 19 Minutes | 25 | 13.3% |
| 20 to 24 Minutes | 13 | 6.9% |
| 25 to 29 Minutes | 0 | 0.0% |
| 30 to 34 Minutes | 12 | 6.4% |
| 35 to 39 Minutes | 0 | 0.0% |
| 40 to 44 Minutes | 7 | 3.7% |
| 45 to 59 Minutes | 6 | 3.2% |
| 60 to 89 Minutes | 3 | 1.6% |
| 90 or more Minutes | 2 | 1.1% |
Commute Time by Sex in Ballard
The most common commute times in Ballard are 5 to 9 minutes (20 commuters, 25.6%) for males and 5 to 9 minutes (50 commuters, 45.5%) for females.
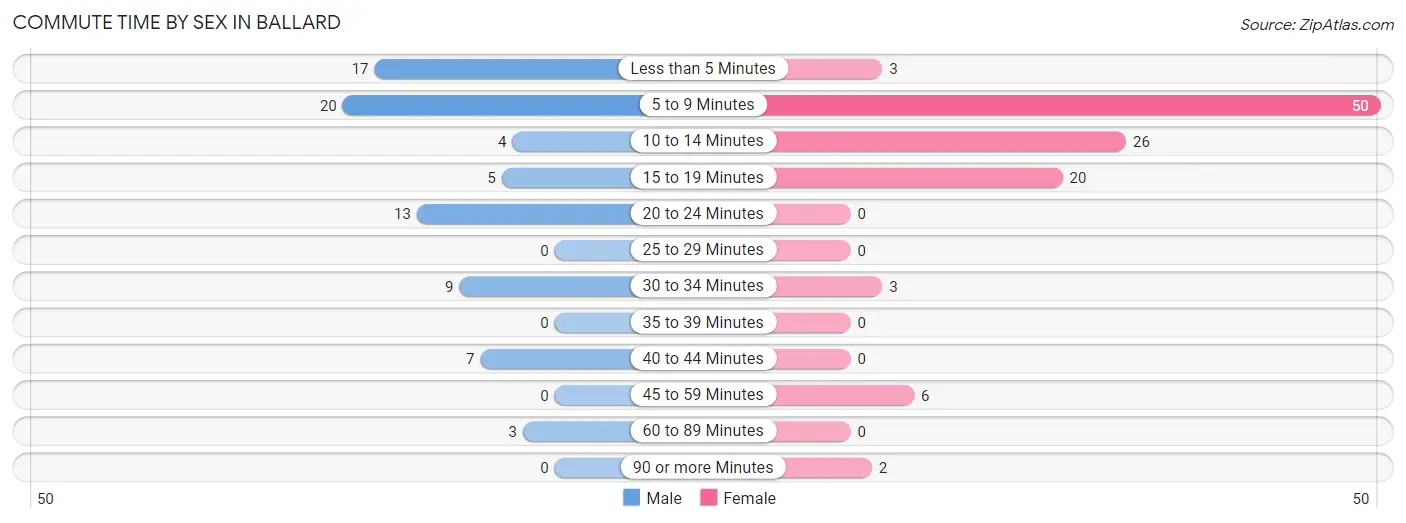
| Commute Time | Male | Female |
| Less than 5 Minutes | 17 (21.8%) | 3 (2.7%) |
| 5 to 9 Minutes | 20 (25.6%) | 50 (45.5%) |
| 10 to 14 Minutes | 4 (5.1%) | 26 (23.6%) |
| 15 to 19 Minutes | 5 (6.4%) | 20 (18.2%) |
| 20 to 24 Minutes | 13 (16.7%) | 0 (0.0%) |
| 25 to 29 Minutes | 0 (0.0%) | 0 (0.0%) |
| 30 to 34 Minutes | 9 (11.5%) | 3 (2.7%) |
| 35 to 39 Minutes | 0 (0.0%) | 0 (0.0%) |
| 40 to 44 Minutes | 7 (9.0%) | 0 (0.0%) |
| 45 to 59 Minutes | 0 (0.0%) | 6 (5.4%) |
| 60 to 89 Minutes | 3 (3.8%) | 0 (0.0%) |
| 90 or more Minutes | 0 (0.0%) | 2 (1.8%) |
Time of Departure to Work by Sex in Ballard
The most frequent times of departure to work in Ballard are 8:00 AM to 8:29 AM (43, 55.1%) for males and 8:00 AM to 8:29 AM (54, 49.1%) for females.
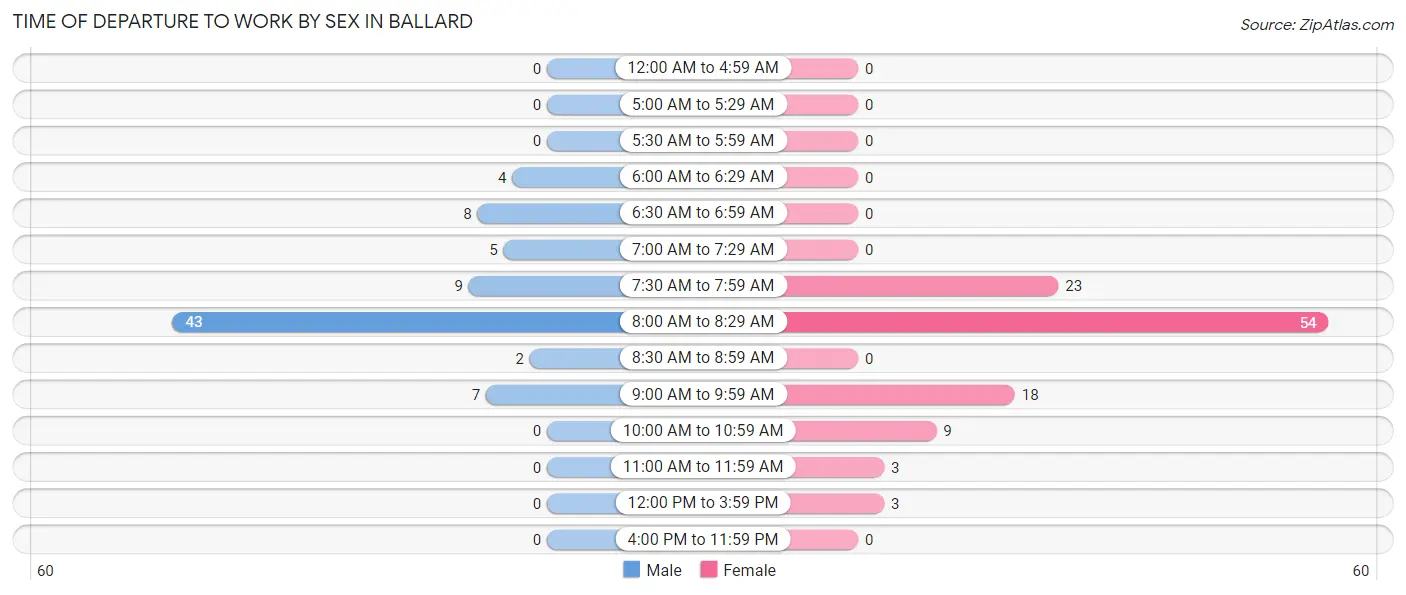
| Time of Departure | Male | Female |
| 12:00 AM to 4:59 AM | 0 (0.0%) | 0 (0.0%) |
| 5:00 AM to 5:29 AM | 0 (0.0%) | 0 (0.0%) |
| 5:30 AM to 5:59 AM | 0 (0.0%) | 0 (0.0%) |
| 6:00 AM to 6:29 AM | 4 (5.1%) | 0 (0.0%) |
| 6:30 AM to 6:59 AM | 8 (10.3%) | 0 (0.0%) |
| 7:00 AM to 7:29 AM | 5 (6.4%) | 0 (0.0%) |
| 7:30 AM to 7:59 AM | 9 (11.5%) | 23 (20.9%) |
| 8:00 AM to 8:29 AM | 43 (55.1%) | 54 (49.1%) |
| 8:30 AM to 8:59 AM | 2 (2.6%) | 0 (0.0%) |
| 9:00 AM to 9:59 AM | 7 (9.0%) | 18 (16.4%) |
| 10:00 AM to 10:59 AM | 0 (0.0%) | 9 (8.2%) |
| 11:00 AM to 11:59 AM | 0 (0.0%) | 3 (2.7%) |
| 12:00 PM to 3:59 PM | 0 (0.0%) | 3 (2.7%) |
| 4:00 PM to 11:59 PM | 0 (0.0%) | 0 (0.0%) |
| Total | 78 (100.0%) | 110 (100.0%) |
Housing Occupancy in Ballard
Occupancy by Ownership in Ballard
Of the total 257 dwellings in Ballard, owner-occupied units account for 188 (73.2%), while renter-occupied units make up 69 (26.9%).
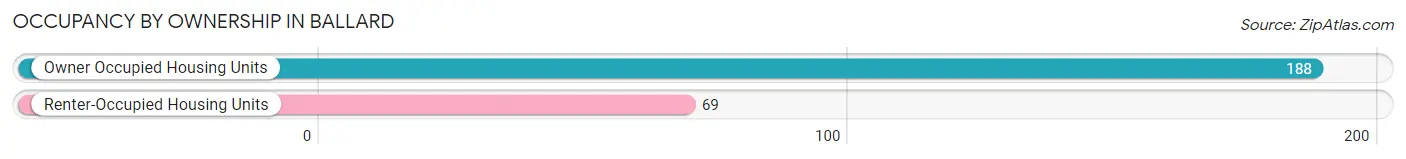
| Occupancy | # Housing Units | % Housing Units |
| Owner Occupied Housing Units | 188 | 73.2% |
| Renter-Occupied Housing Units | 69 | 26.9% |
| Total Occupied Housing Units | 257 | 100.0% |
Occupancy by Household Size in Ballard
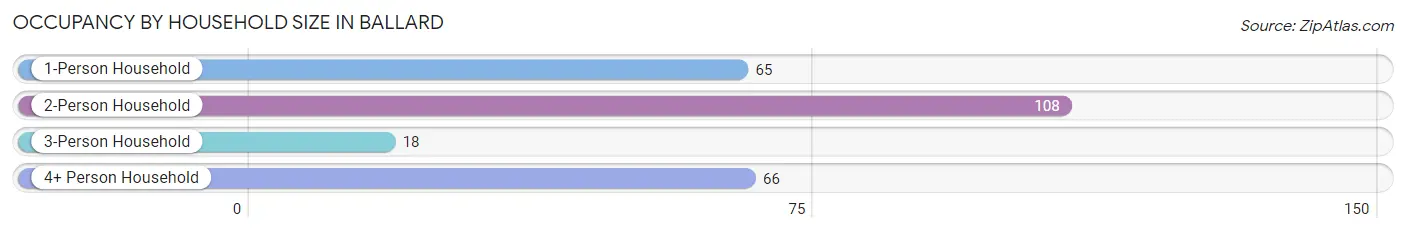
| Household Size | # Housing Units | % Housing Units |
| 1-Person Household | 65 | 25.3% |
| 2-Person Household | 108 | 42.0% |
| 3-Person Household | 18 | 7.0% |
| 4+ Person Household | 66 | 25.7% |
| Total Housing Units | 257 | 100.0% |
Occupancy by Ownership by Household Size in Ballard
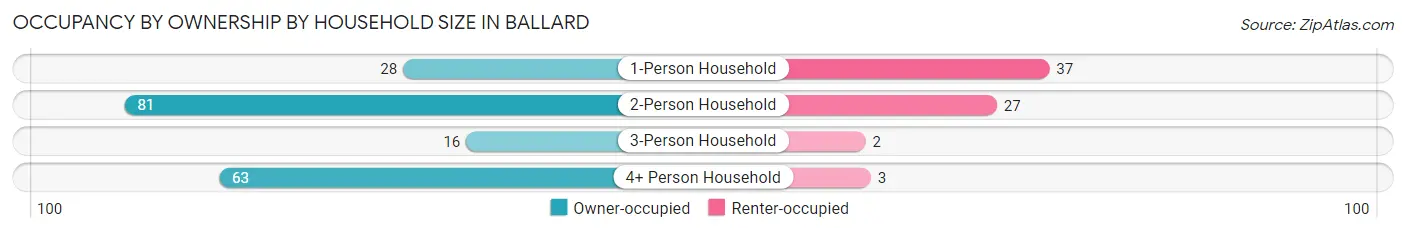
| Household Size | Owner-occupied | Renter-occupied |
| 1-Person Household | 28 (43.1%) | 37 (56.9%) |
| 2-Person Household | 81 (75.0%) | 27 (25.0%) |
| 3-Person Household | 16 (88.9%) | 2 (11.1%) |
| 4+ Person Household | 63 (95.5%) | 3 (4.5%) |
| Total Housing Units | 188 (73.2%) | 69 (26.9%) |
Occupancy by Educational Attainment in Ballard
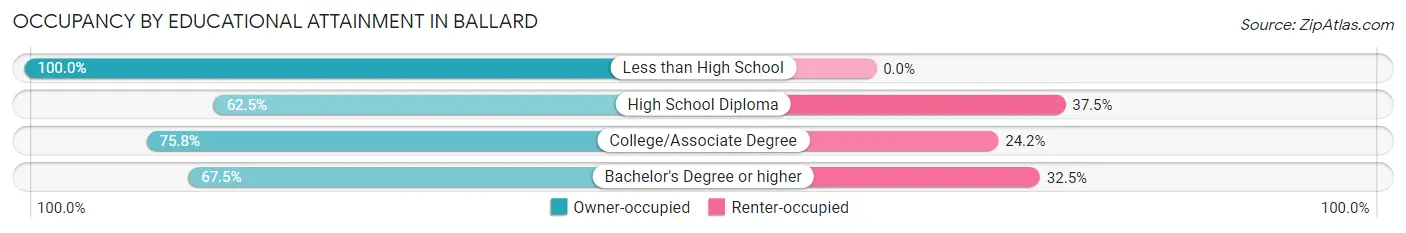
| Household Size | Owner-occupied | Renter-occupied |
| Less than High School | 24 (100.0%) | 0 (0.0%) |
| High School Diploma | 15 (62.5%) | 9 (37.5%) |
| College/Associate Degree | 72 (75.8%) | 23 (24.2%) |
| Bachelor's Degree or higher | 77 (67.5%) | 37 (32.5%) |
Occupancy by Age of Householder in Ballard
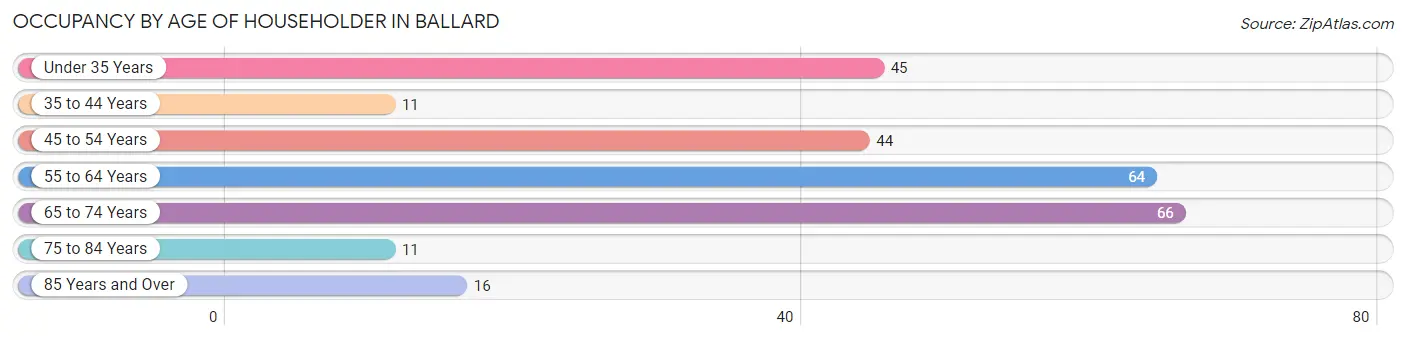
| Age Bracket | # Households | % Households |
| Under 35 Years | 45 | 17.5% |
| 35 to 44 Years | 11 | 4.3% |
| 45 to 54 Years | 44 | 17.1% |
| 55 to 64 Years | 64 | 24.9% |
| 65 to 74 Years | 66 | 25.7% |
| 75 to 84 Years | 11 | 4.3% |
| 85 Years and Over | 16 | 6.2% |
| Total | 257 | 100.0% |
Housing Finances in Ballard
Median Income by Occupancy in Ballard
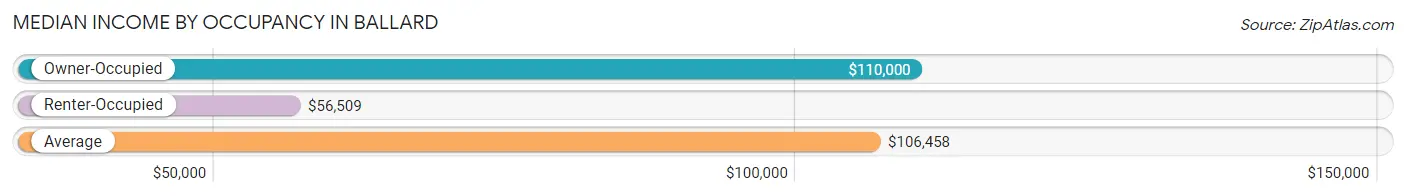
| Occupancy Type | # Households | Median Income |
| Owner-Occupied | 188 (73.2%) | $110,000 |
| Renter-Occupied | 69 (26.9%) | $56,509 |
| Average | 257 (100.0%) | $106,458 |
Occupancy by Householder Income Bracket in Ballard
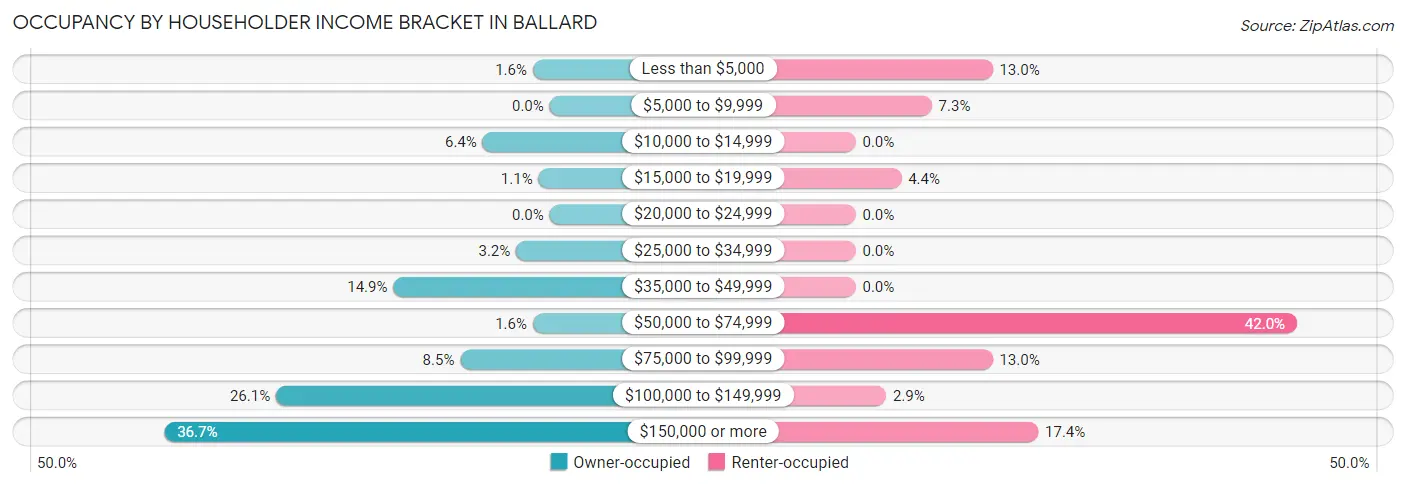
| Income Bracket | Owner-occupied | Renter-occupied |
| Less than $5,000 | 3 (1.6%) | 9 (13.0%) |
| $5,000 to $9,999 | 0 (0.0%) | 5 (7.2%) |
| $10,000 to $14,999 | 12 (6.4%) | 0 (0.0%) |
| $15,000 to $19,999 | 2 (1.1%) | 3 (4.3%) |
| $20,000 to $24,999 | 0 (0.0%) | 0 (0.0%) |
| $25,000 to $34,999 | 6 (3.2%) | 0 (0.0%) |
| $35,000 to $49,999 | 28 (14.9%) | 0 (0.0%) |
| $50,000 to $74,999 | 3 (1.6%) | 29 (42.0%) |
| $75,000 to $99,999 | 16 (8.5%) | 9 (13.0%) |
| $100,000 to $149,999 | 49 (26.1%) | 2 (2.9%) |
| $150,000 or more | 69 (36.7%) | 12 (17.4%) |
| Total | 188 (100.0%) | 69 (100.0%) |
Monthly Housing Cost Tiers in Ballard
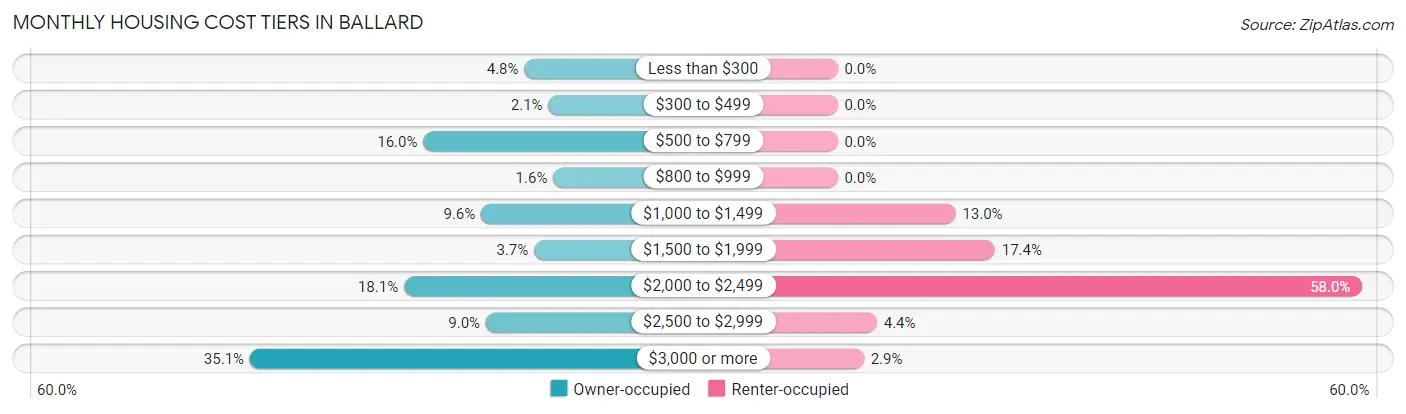
| Monthly Cost | Owner-occupied | Renter-occupied |
| Less than $300 | 9 (4.8%) | 0 (0.0%) |
| $300 to $499 | 4 (2.1%) | 0 (0.0%) |
| $500 to $799 | 30 (16.0%) | 0 (0.0%) |
| $800 to $999 | 3 (1.6%) | 0 (0.0%) |
| $1,000 to $1,499 | 18 (9.6%) | 9 (13.0%) |
| $1,500 to $1,999 | 7 (3.7%) | 12 (17.4%) |
| $2,000 to $2,499 | 34 (18.1%) | 40 (58.0%) |
| $2,500 to $2,999 | 17 (9.0%) | 3 (4.3%) |
| $3,000 or more | 66 (35.1%) | 2 (2.9%) |
| Total | 188 (100.0%) | 69 (100.0%) |
Physical Housing Characteristics in Ballard
Housing Structures in Ballard
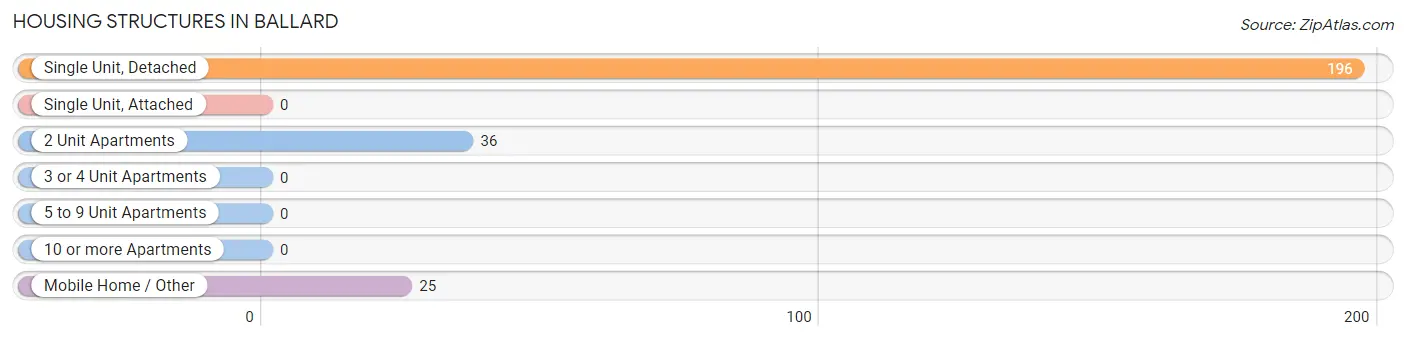
| Structure Type | # Housing Units | % Housing Units |
| Single Unit, Detached | 196 | 76.3% |
| Single Unit, Attached | 0 | 0.0% |
| 2 Unit Apartments | 36 | 14.0% |
| 3 or 4 Unit Apartments | 0 | 0.0% |
| 5 to 9 Unit Apartments | 0 | 0.0% |
| 10 or more Apartments | 0 | 0.0% |
| Mobile Home / Other | 25 | 9.7% |
| Total | 257 | 100.0% |
Housing Structures by Occupancy in Ballard
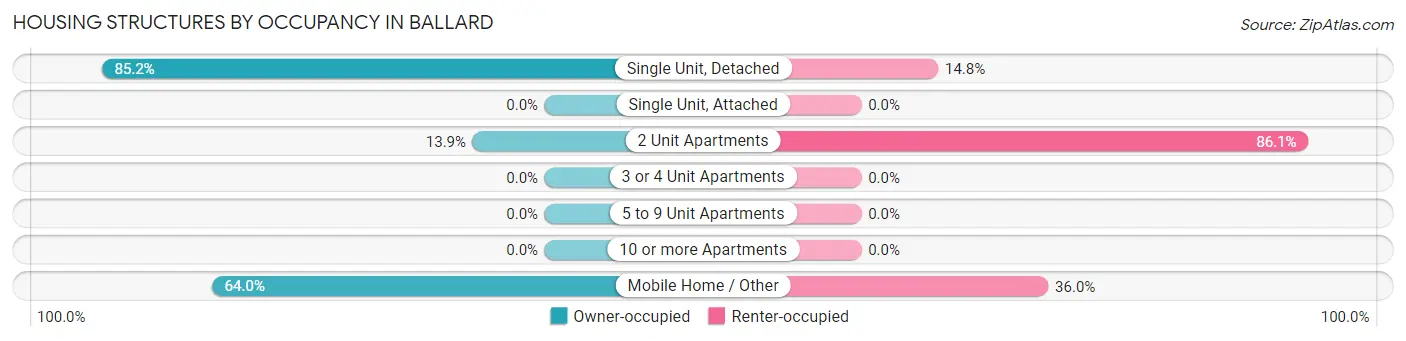
| Structure Type | Owner-occupied | Renter-occupied |
| Single Unit, Detached | 167 (85.2%) | 29 (14.8%) |
| Single Unit, Attached | 0 (0.0%) | 0 (0.0%) |
| 2 Unit Apartments | 5 (13.9%) | 31 (86.1%) |
| 3 or 4 Unit Apartments | 0 (0.0%) | 0 (0.0%) |
| 5 to 9 Unit Apartments | 0 (0.0%) | 0 (0.0%) |
| 10 or more Apartments | 0 (0.0%) | 0 (0.0%) |
| Mobile Home / Other | 16 (64.0%) | 9 (36.0%) |
| Total | 188 (73.2%) | 69 (26.9%) |
Housing Structures by Number of Rooms in Ballard
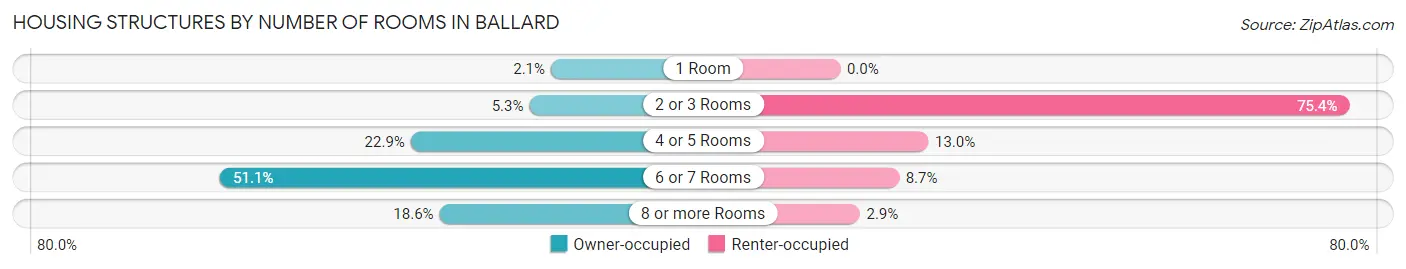
| Number of Rooms | Owner-occupied | Renter-occupied |
| 1 Room | 4 (2.1%) | 0 (0.0%) |
| 2 or 3 Rooms | 10 (5.3%) | 52 (75.4%) |
| 4 or 5 Rooms | 43 (22.9%) | 9 (13.0%) |
| 6 or 7 Rooms | 96 (51.1%) | 6 (8.7%) |
| 8 or more Rooms | 35 (18.6%) | 2 (2.9%) |
| Total | 188 (100.0%) | 69 (100.0%) |
Housing Structure by Heating Type in Ballard
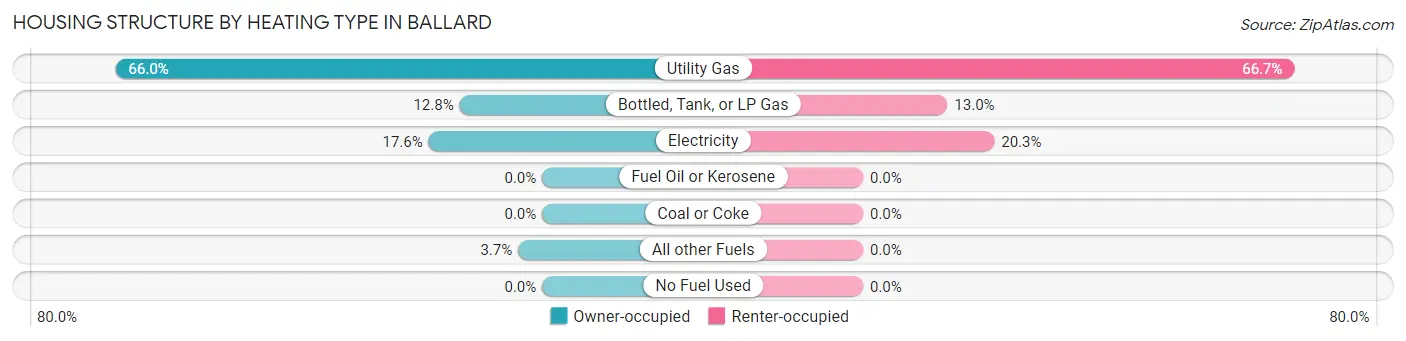
| Heating Type | Owner-occupied | Renter-occupied |
| Utility Gas | 124 (66.0%) | 46 (66.7%) |
| Bottled, Tank, or LP Gas | 24 (12.8%) | 9 (13.0%) |
| Electricity | 33 (17.5%) | 14 (20.3%) |
| Fuel Oil or Kerosene | 0 (0.0%) | 0 (0.0%) |
| Coal or Coke | 0 (0.0%) | 0 (0.0%) |
| All other Fuels | 7 (3.7%) | 0 (0.0%) |
| No Fuel Used | 0 (0.0%) | 0 (0.0%) |
| Total | 188 (100.0%) | 69 (100.0%) |
Household Vehicle Usage in Ballard
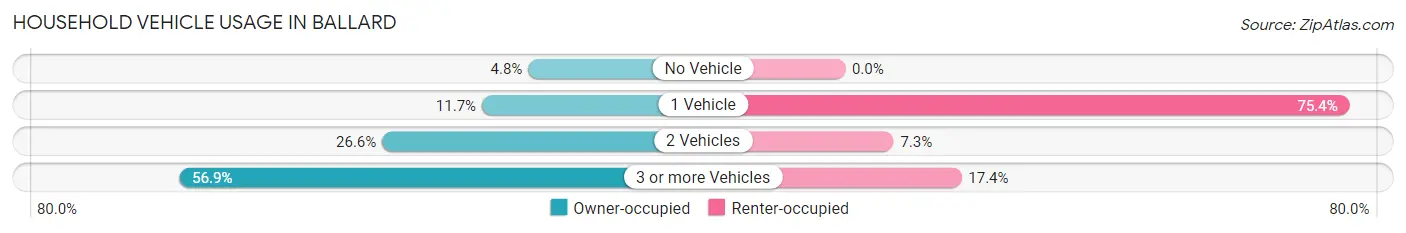
| Vehicles per Household | Owner-occupied | Renter-occupied |
| No Vehicle | 9 (4.8%) | 0 (0.0%) |
| 1 Vehicle | 22 (11.7%) | 52 (75.4%) |
| 2 Vehicles | 50 (26.6%) | 5 (7.2%) |
| 3 or more Vehicles | 107 (56.9%) | 12 (17.4%) |
| Total | 188 (100.0%) | 69 (100.0%) |
Real Estate & Mortgages in Ballard
Real Estate and Mortgage Overview in Ballard
| Characteristic | Without Mortgage | With Mortgage |
| Housing Units | 114 | 74 |
| Median Property Value | - | - |
| Median Household Income | $108,333 | $29 |
| Monthly Housing Costs | $1,200 | $64 |
| Real Estate Taxes | - | - |
Property Value by Mortgage Status in Ballard
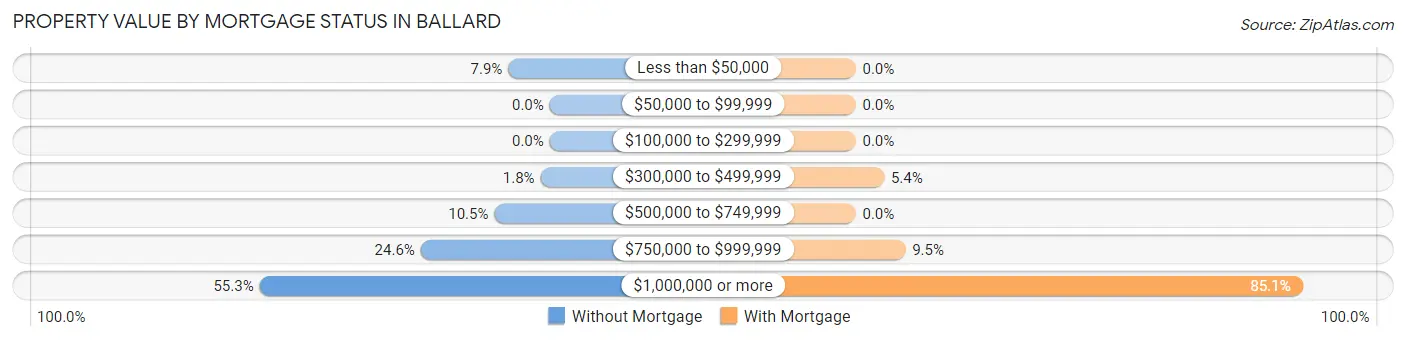
| Property Value | Without Mortgage | With Mortgage |
| Less than $50,000 | 9 (7.9%) | 0 (0.0%) |
| $50,000 to $99,999 | 0 (0.0%) | 0 (0.0%) |
| $100,000 to $299,999 | 0 (0.0%) | 0 (0.0%) |
| $300,000 to $499,999 | 2 (1.8%) | 4 (5.4%) |
| $500,000 to $749,999 | 12 (10.5%) | 0 (0.0%) |
| $750,000 to $999,999 | 28 (24.6%) | 7 (9.5%) |
| $1,000,000 or more | 63 (55.3%) | 63 (85.1%) |
| Total | 114 (100.0%) | 74 (100.0%) |
Household Income by Mortgage Status in Ballard
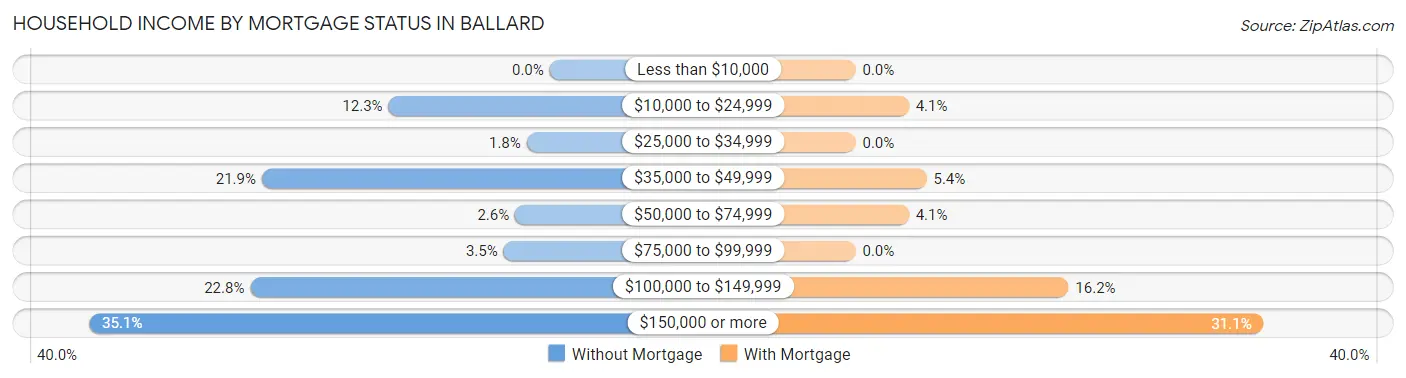
| Household Income | Without Mortgage | With Mortgage |
| Less than $10,000 | 0 (0.0%) | 0 (0.0%) |
| $10,000 to $24,999 | 14 (12.3%) | 3 (4.1%) |
| $25,000 to $34,999 | 2 (1.8%) | 0 (0.0%) |
| $35,000 to $49,999 | 25 (21.9%) | 4 (5.4%) |
| $50,000 to $74,999 | 3 (2.6%) | 3 (4.1%) |
| $75,000 to $99,999 | 4 (3.5%) | 0 (0.0%) |
| $100,000 to $149,999 | 26 (22.8%) | 12 (16.2%) |
| $150,000 or more | 40 (35.1%) | 23 (31.1%) |
| Total | 114 (100.0%) | 74 (100.0%) |
Property Value to Household Income Ratio in Ballard
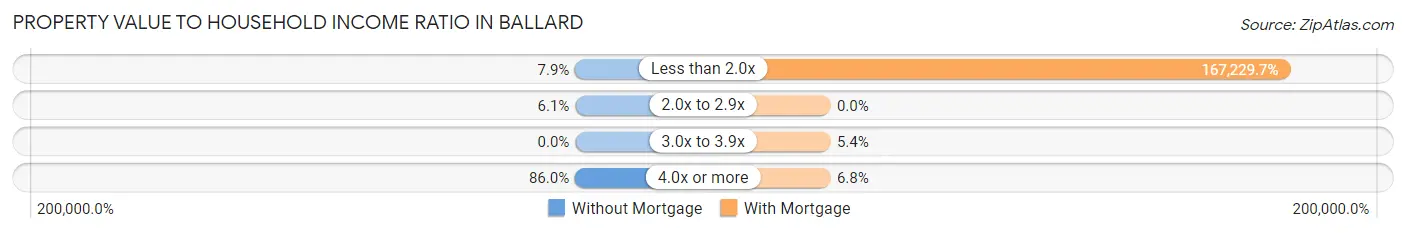
| Value-to-Income Ratio | Without Mortgage | With Mortgage |
| Less than 2.0x | 9 (7.9%) | 123,750 (167,229.7%) |
| 2.0x to 2.9x | 7 (6.1%) | 0 (0.0%) |
| 3.0x to 3.9x | 0 (0.0%) | 4 (5.4%) |
| 4.0x or more | 98 (86.0%) | 5 (6.8%) |
| Total | 114 (100.0%) | 74 (100.0%) |
Real Estate Taxes by Mortgage Status in Ballard
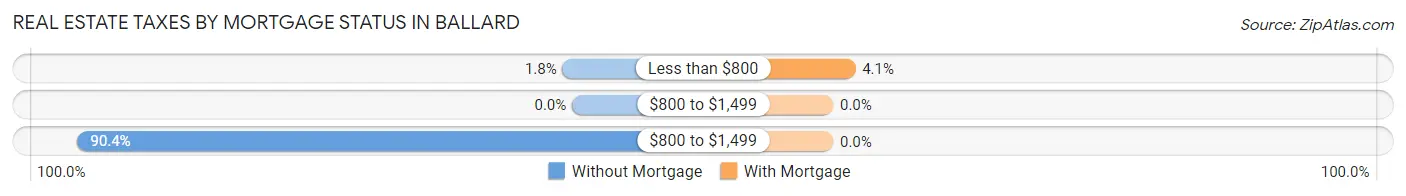
| Property Taxes | Without Mortgage | With Mortgage |
| Less than $800 | 2 (1.8%) | 3 (4.1%) |
| $800 to $1,499 | 0 (0.0%) | 0 (0.0%) |
| $800 to $1,499 | 103 (90.3%) | 0 (0.0%) |
| Total | 114 (100.0%) | 74 (100.0%) |
Health & Disability in Ballard
Health Insurance Coverage by Age in Ballard
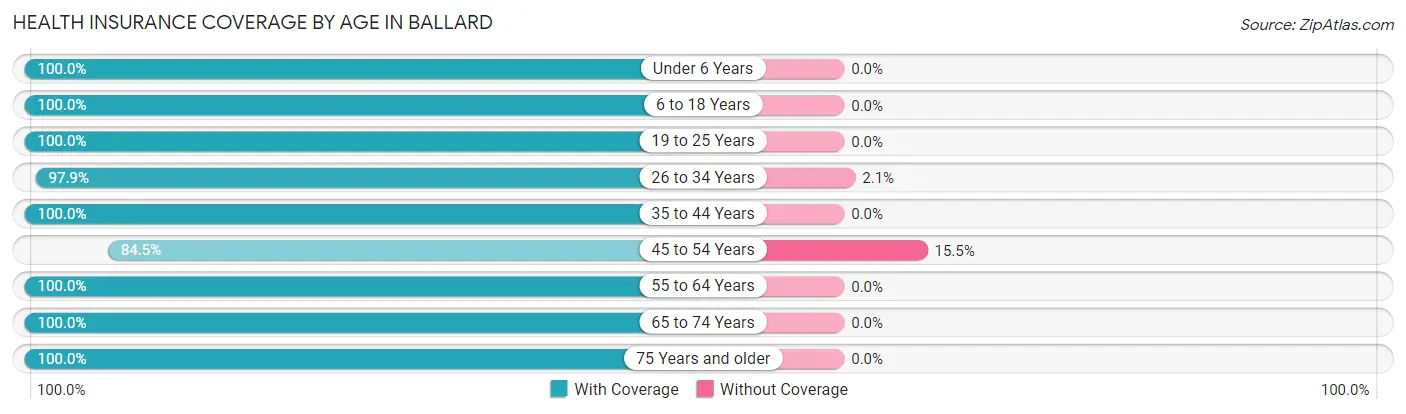
| Age Bracket | With Coverage | Without Coverage |
| Under 6 Years | 112 (100.0%) | 0 (0.0%) |
| 6 to 18 Years | 82 (100.0%) | 0 (0.0%) |
| 19 to 25 Years | 4 (100.0%) | 0 (0.0%) |
| 26 to 34 Years | 95 (97.9%) | 2 (2.1%) |
| 35 to 44 Years | 72 (100.0%) | 0 (0.0%) |
| 45 to 54 Years | 49 (84.5%) | 9 (15.5%) |
| 55 to 64 Years | 100 (100.0%) | 0 (0.0%) |
| 65 to 74 Years | 144 (100.0%) | 0 (0.0%) |
| 75 Years and older | 52 (100.0%) | 0 (0.0%) |
| Total | 710 (98.5%) | 11 (1.5%) |
Health Insurance Coverage by Citizenship Status in Ballard
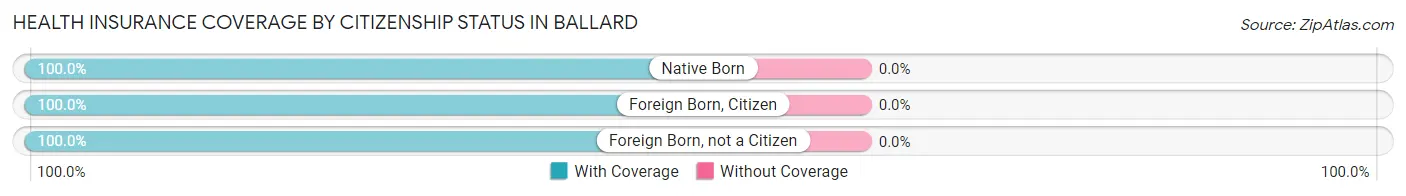
| Citizenship Status | With Coverage | Without Coverage |
| Native Born | 112 (100.0%) | 0 (0.0%) |
| Foreign Born, Citizen | 82 (100.0%) | 0 (0.0%) |
| Foreign Born, not a Citizen | 4 (100.0%) | 0 (0.0%) |
Health Insurance Coverage by Household Income in Ballard
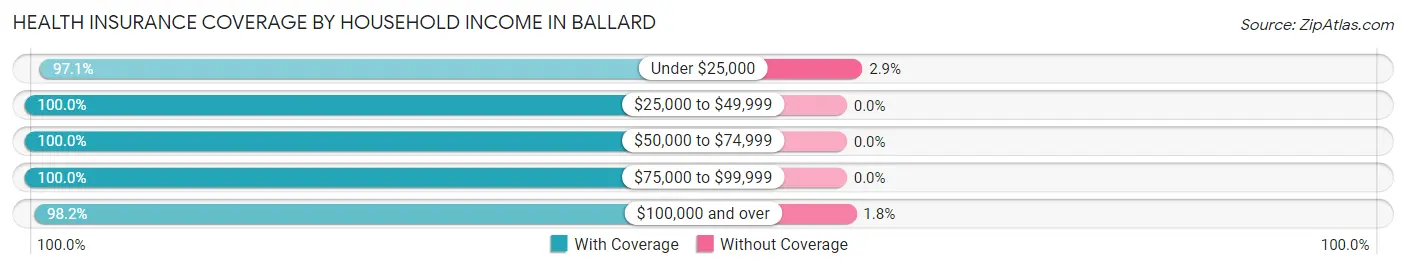
| Household Income | With Coverage | Without Coverage |
| Under $25,000 | 67 (97.1%) | 2 (2.9%) |
| $25,000 to $49,999 | 77 (100.0%) | 0 (0.0%) |
| $50,000 to $74,999 | 36 (100.0%) | 0 (0.0%) |
| $75,000 to $99,999 | 39 (100.0%) | 0 (0.0%) |
| $100,000 and over | 491 (98.2%) | 9 (1.8%) |
Public vs Private Health Insurance Coverage by Age in Ballard
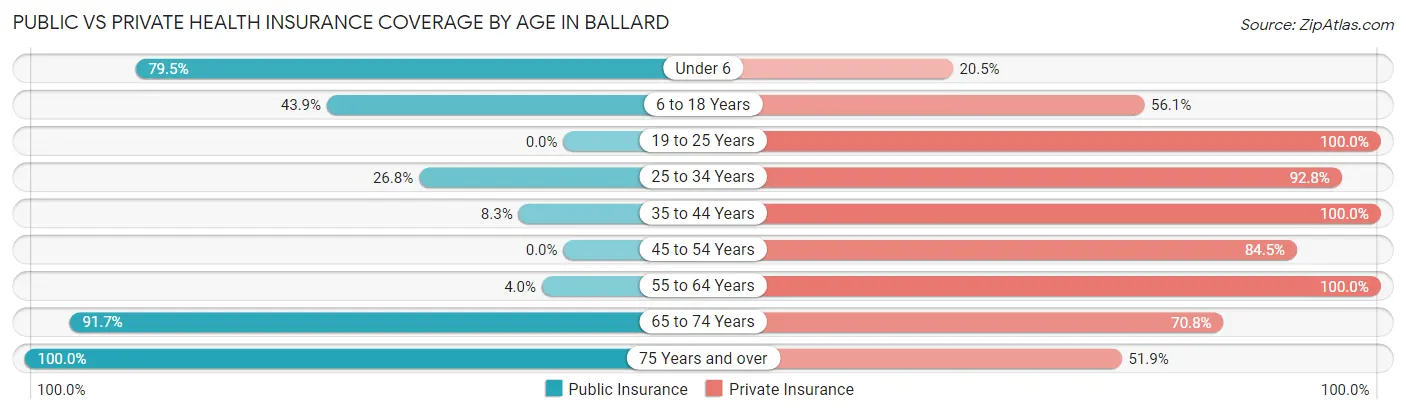
| Age Bracket | Public Insurance | Private Insurance |
| Under 6 | 89 (79.5%) | 23 (20.5%) |
| 6 to 18 Years | 36 (43.9%) | 46 (56.1%) |
| 19 to 25 Years | 0 (0.0%) | 4 (100.0%) |
| 25 to 34 Years | 26 (26.8%) | 90 (92.8%) |
| 35 to 44 Years | 6 (8.3%) | 72 (100.0%) |
| 45 to 54 Years | 0 (0.0%) | 49 (84.5%) |
| 55 to 64 Years | 4 (4.0%) | 100 (100.0%) |
| 65 to 74 Years | 132 (91.7%) | 102 (70.8%) |
| 75 Years and over | 52 (100.0%) | 27 (51.9%) |
| Total | 345 (47.8%) | 513 (71.2%) |
Disability Status by Sex by Age in Ballard
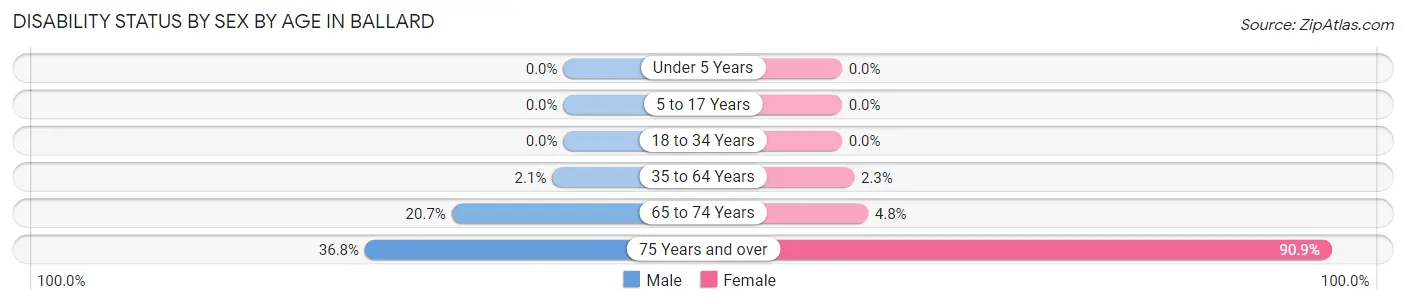
| Age Bracket | Male | Female |
| Under 5 Years | 0 (0.0%) | 0 (0.0%) |
| 5 to 17 Years | 0 (0.0%) | 0 (0.0%) |
| 18 to 34 Years | 0 (0.0%) | 0 (0.0%) |
| 35 to 64 Years | 2 (2.1%) | 3 (2.3%) |
| 65 to 74 Years | 17 (20.7%) | 3 (4.8%) |
| 75 Years and over | 7 (36.8%) | 30 (90.9%) |
Disability Class by Sex by Age in Ballard
Disability Class: Hearing Difficulty
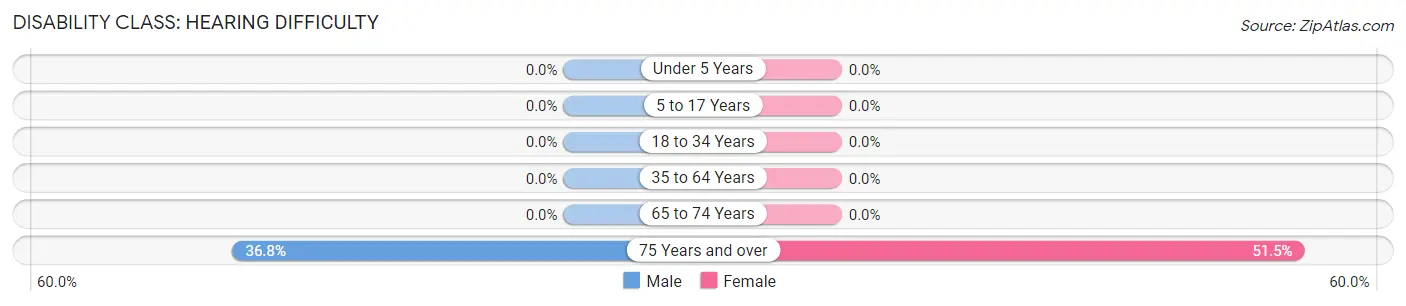
| Age Bracket | Male | Female |
| Under 5 Years | 0 (0.0%) | 0 (0.0%) |
| 5 to 17 Years | 0 (0.0%) | 0 (0.0%) |
| 18 to 34 Years | 0 (0.0%) | 0 (0.0%) |
| 35 to 64 Years | 0 (0.0%) | 0 (0.0%) |
| 65 to 74 Years | 0 (0.0%) | 0 (0.0%) |
| 75 Years and over | 7 (36.8%) | 17 (51.5%) |
Disability Class: Vision Difficulty
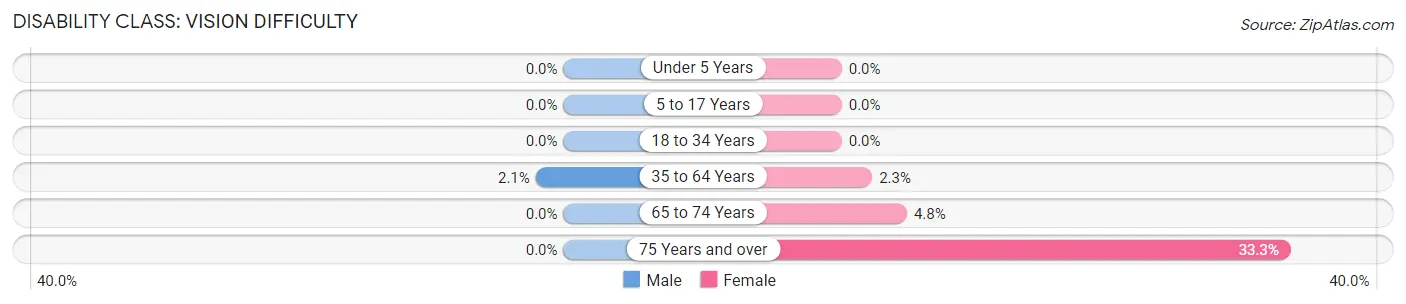
| Age Bracket | Male | Female |
| Under 5 Years | 0 (0.0%) | 0 (0.0%) |
| 5 to 17 Years | 0 (0.0%) | 0 (0.0%) |
| 18 to 34 Years | 0 (0.0%) | 0 (0.0%) |
| 35 to 64 Years | 2 (2.1%) | 3 (2.3%) |
| 65 to 74 Years | 0 (0.0%) | 3 (4.8%) |
| 75 Years and over | 0 (0.0%) | 11 (33.3%) |
Disability Class: Cognitive Difficulty
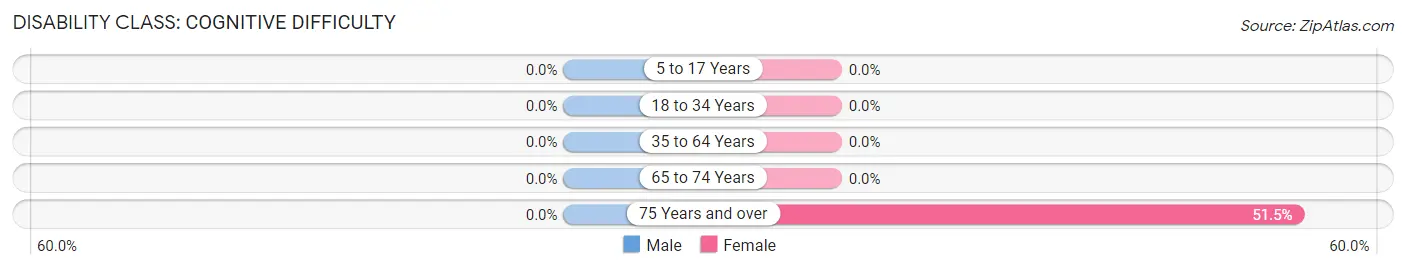
| Age Bracket | Male | Female |
| 5 to 17 Years | 0 (0.0%) | 0 (0.0%) |
| 18 to 34 Years | 0 (0.0%) | 0 (0.0%) |
| 35 to 64 Years | 0 (0.0%) | 0 (0.0%) |
| 65 to 74 Years | 0 (0.0%) | 0 (0.0%) |
| 75 Years and over | 0 (0.0%) | 17 (51.5%) |
Disability Class: Ambulatory Difficulty
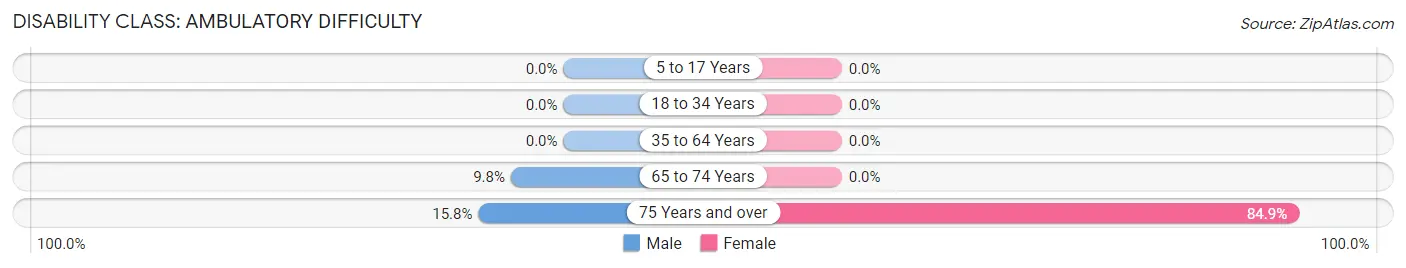
| Age Bracket | Male | Female |
| 5 to 17 Years | 0 (0.0%) | 0 (0.0%) |
| 18 to 34 Years | 0 (0.0%) | 0 (0.0%) |
| 35 to 64 Years | 0 (0.0%) | 0 (0.0%) |
| 65 to 74 Years | 8 (9.8%) | 0 (0.0%) |
| 75 Years and over | 3 (15.8%) | 28 (84.9%) |
Disability Class: Self-Care Difficulty
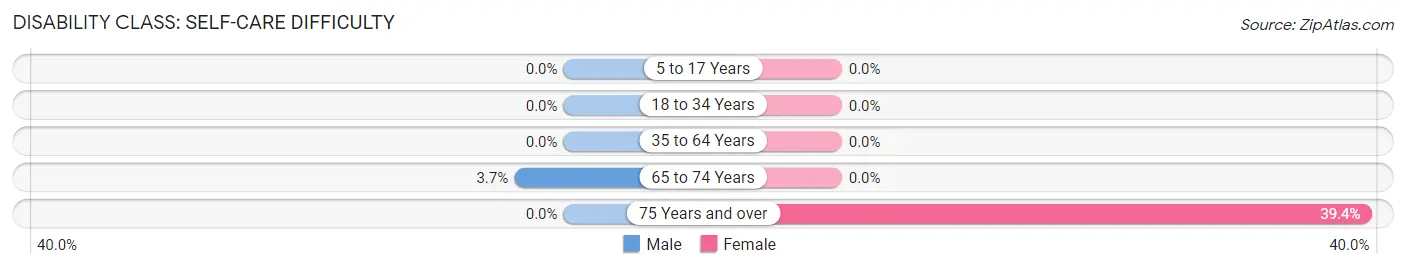
| Age Bracket | Male | Female |
| 5 to 17 Years | 0 (0.0%) | 0 (0.0%) |
| 18 to 34 Years | 0 (0.0%) | 0 (0.0%) |
| 35 to 64 Years | 0 (0.0%) | 0 (0.0%) |
| 65 to 74 Years | 3 (3.7%) | 0 (0.0%) |
| 75 Years and over | 0 (0.0%) | 13 (39.4%) |
Technology Access in Ballard
Computing Device Access in Ballard
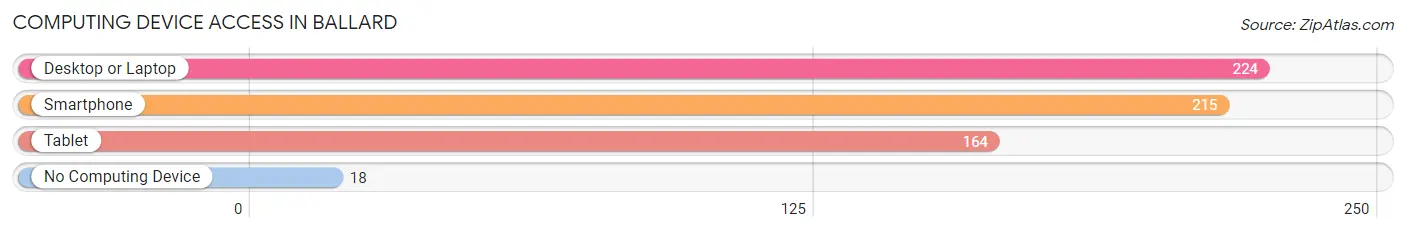
| Device Type | # Households | % Households |
| Desktop or Laptop | 224 | 87.2% |
| Smartphone | 215 | 83.7% |
| Tablet | 164 | 63.8% |
| No Computing Device | 18 | 7.0% |
| Total | 257 | 100.0% |
Internet Access in Ballard
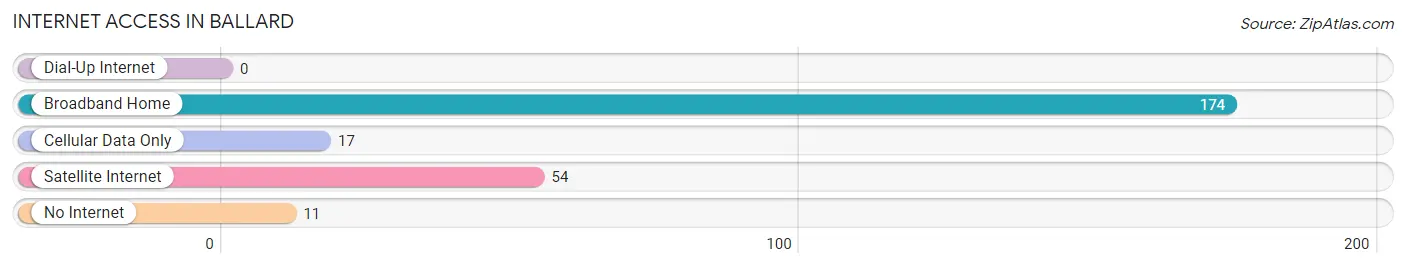
| Internet Type | # Households | % Households |
| Dial-Up Internet | 0 | 0.0% |
| Broadband Home | 174 | 67.7% |
| Cellular Data Only | 17 | 6.6% |
| Satellite Internet | 54 | 21.0% |
| No Internet | 11 | 4.3% |
| Total | 257 | 100.0% |
Ballard Summary
Ballard is a small unincorporated community located in the foothills of the Sierra Nevada Mountains in El Dorado County, California. It is situated in the Sierra Nevada foothills, approximately 20 miles east of Placerville and 40 miles northeast of Sacramento. The population of Ballard was estimated to be around 1,000 in 2020.
History
Ballard was founded in 1849 by a group of miners who were searching for gold in the area. The town was named after one of the miners, William Ballard, who was the first to discover gold in the area. The town quickly grew and by 1851, it had a population of over 500 people. The town was home to several businesses, including a hotel, saloon, and general store.
In the late 1800s, Ballard was a popular destination for tourists and travelers. The town was known for its beautiful scenery and its proximity to the nearby lakes and rivers. The town was also home to several resorts and hotels, which attracted visitors from all over the country.
In the early 1900s, Ballard began to decline in population as the gold rush ended and the town's economy shifted to logging and ranching. The town's population decreased to around 500 by the 1950s.
Geography
Ballard is located in the Sierra Nevada foothills, approximately 20 miles east of Placerville and 40 miles northeast of Sacramento. The town is situated at an elevation of 2,400 feet and is surrounded by rolling hills and forests. The nearby lakes and rivers provide a variety of recreational activities, including fishing, boating, and swimming.
The climate in Ballard is mild and temperate, with hot summers and cold winters. The average annual temperature is around 60 degrees Fahrenheit. The average annual precipitation is around 25 inches.
Economy
The economy of Ballard is largely based on tourism and recreation. The town is home to several resorts and hotels, which attract visitors from all over the country. The nearby lakes and rivers provide a variety of recreational activities, including fishing, boating, and swimming.
The town is also home to several small businesses, including restaurants, shops, and galleries. The town is also home to several wineries, which produce a variety of wines.
Demographics
The population of Ballard was estimated to be around 1,000 in 2020. The town is predominantly white, with around 90% of the population identifying as Caucasian. The median household income is around $50,000. The town has a low unemployment rate, with only around 4% of the population unemployed.
Conclusion
Ballard is a small unincorporated community located in the foothills of the Sierra Nevada Mountains in El Dorado County, California. The town was founded in 1849 by a group of miners who were searching for gold in the area. The town quickly grew and by 1851, it had a population of over 500 people. The town is predominantly white, with around 90% of the population identifying as Caucasian. The economy of Ballard is largely based on tourism and recreation. The town is home to several resorts and hotels, which attract visitors from all over the country. The nearby lakes and rivers provide a variety of recreational activities, including fishing, boating, and swimming. The town is also home to several small businesses, including restaurants, shops, and galleries. The town is also home to several wineries, which produce a variety of wines.
Common Questions
What is Per Capita Income in Ballard?
Per Capita income in Ballard is $61,184.
What is the Median Family Income in Ballard?
Median Family Income in Ballard is $112,031.
What is the Median Household income in Ballard?
Median Household Income in Ballard is $106,458.
What is Income or Wage Gap in Ballard?
Income or Wage Gap in Ballard is 48.1%.
Women in Ballard earn 51.9 cents for every dollar earned by a man.
What is Inequality or Gini Index in Ballard?
Inequality or Gini Index in Ballard is 0.57.
What is the Total Population of Ballard?
Total Population of Ballard is 721.
What is the Total Male Population of Ballard?
Total Male Population of Ballard is 289.
What is the Total Female Population of Ballard?
Total Female Population of Ballard is 432.
What is the Ratio of Males per 100 Females in Ballard?
There are 66.90 Males per 100 Females in Ballard.
What is the Ratio of Females per 100 Males in Ballard?
There are 149.48 Females per 100 Males in Ballard.
What is the Median Population Age in Ballard?
Median Population Age in Ballard is 42.2 Years.
What is the Average Family Size in Ballard
Average Family Size in Ballard is 3.5 People.
What is the Average Household Size in Ballard
Average Household Size in Ballard is 2.8 People.
How Large is the Labor Force in Ballard?
There are 265 People in the Labor Forcein in Ballard.
What is the Percentage of People in the Labor Force in Ballard?
49.6% of People are in the Labor Force in Ballard.
What is the Unemployment Rate in Ballard?
Unemployment Rate in Ballard is 1.1%.