Zip Codes with the Highest Percentage of Population Employed in Installation, Maintenance & Repair in La Puente, CA
RELATED REPORTS & OPTIONS
Installation, Maintenance & Repair
La Puente
Compare Zip Codes
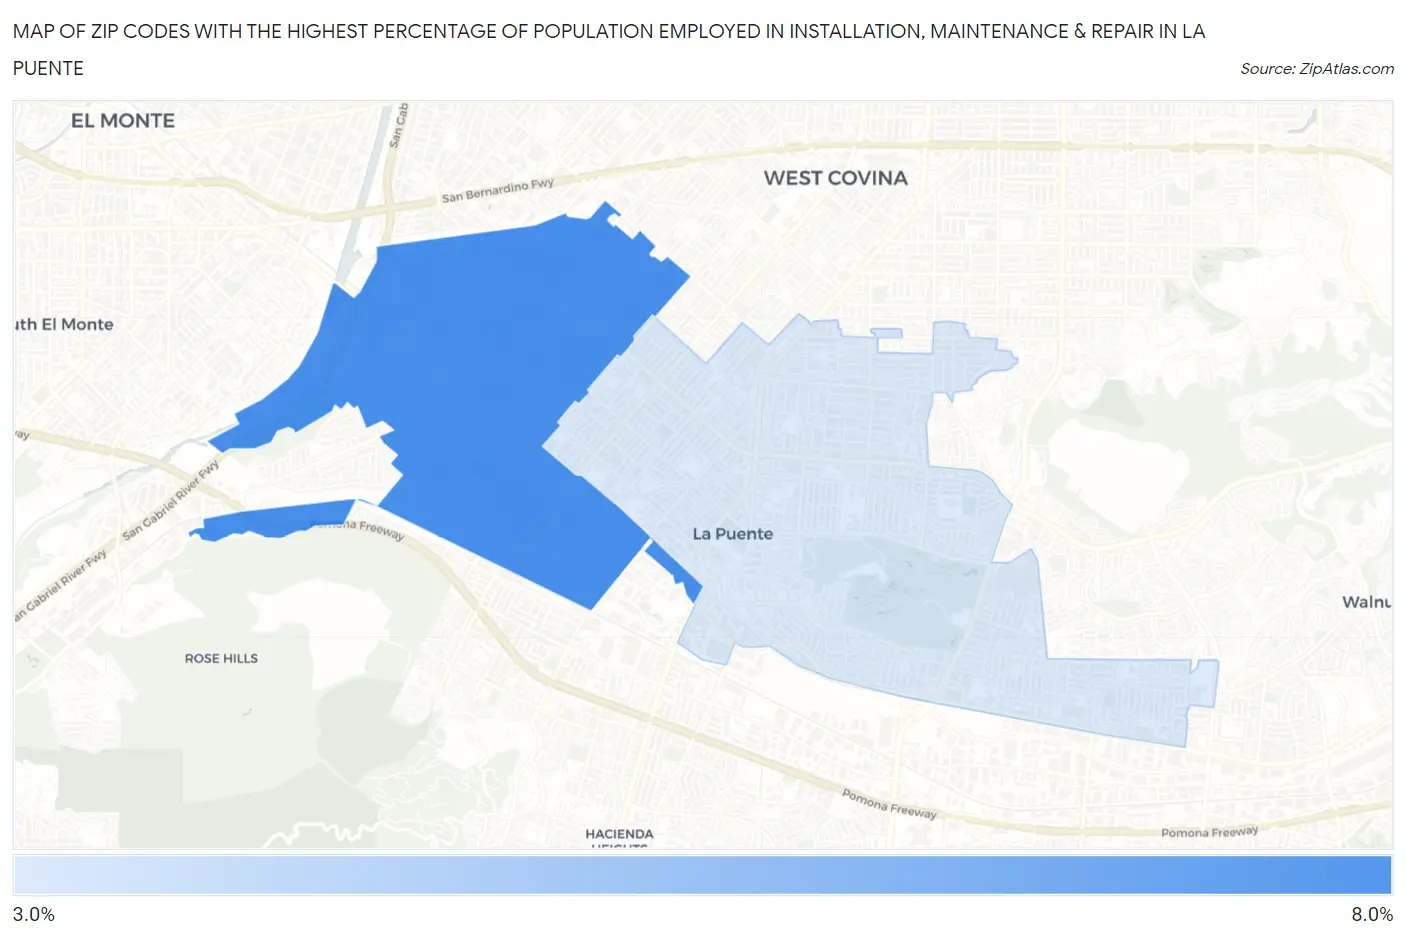
Map of Zip Codes with the Highest Percentage of Population Employed in Installation, Maintenance & Repair in La Puente
3.9%
6.0%
Zip Codes with the Highest Percentage of Population Employed in Installation, Maintenance & Repair in La Puente, CA
| Zip Code | % Employed | vs State | vs National | |
| 1. | 91746 | 6.0% | 2.6%(+3.45)#140 | 3.1%(+2.94)#6,115 |
| 2. | 91744 | 3.9% | 2.6%(+1.37)#346 | 3.1%(+0.862)#12,670 |
1
Common Questions
What are the Top Zip Codes with the Highest Percentage of Population Employed in Installation, Maintenance & Repair in La Puente, CA?
Top Zip Codes with the Highest Percentage of Population Employed in Installation, Maintenance & Repair in La Puente, CA are:
What zip code has the Highest Percentage of Population Employed in Installation, Maintenance & Repair in La Puente, CA?
91746 has the Highest Percentage of Population Employed in Installation, Maintenance & Repair in La Puente, CA with 6.0%.
What is the Percentage of Population Employed in Installation, Maintenance & Repair in La Puente, CA?
Percentage of Population Employed in Installation, Maintenance & Repair in La Puente is 4.7%.
What is the Percentage of Population Employed in Installation, Maintenance & Repair in California?
Percentage of Population Employed in Installation, Maintenance & Repair in California is 2.6%.
What is the Percentage of Population Employed in Installation, Maintenance & Repair in the United States?
Percentage of Population Employed in Installation, Maintenance & Repair in the United States is 3.1%.