Cities with the Highest Percentage of Population with a Degree in Arts and Humanities in California
RELATED REPORTS & OPTIONS
Arts and Humanities
California
Compare Cities
Map of Cities with the Highest Percentage of Population with a Degree in Arts and Humanities in California
0.0%
100.0%
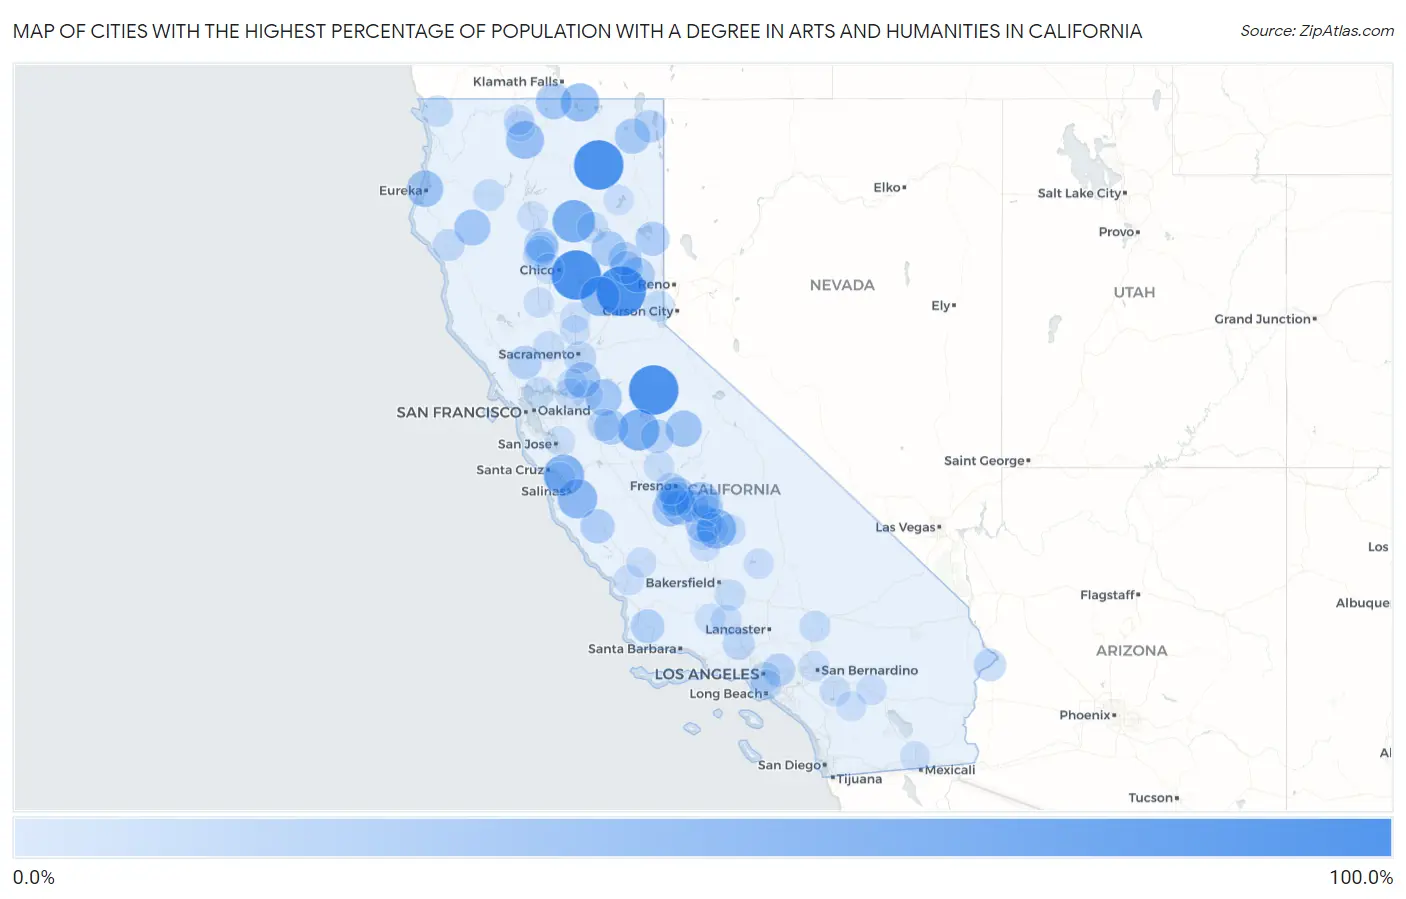
Cities with the Highest Percentage of Population with a Degree in Arts and Humanities in California
| City | % Graduates | vs State | vs National | |
| 1. | Salyer | 100.0% | 5.4%(+94.6)#1 | 6.0%(+94.0)#14 |
| 2. | Cherokee | 100.0% | 5.4%(+94.6)#2 | 6.0%(+94.0)#46 |
| 3. | Bieber | 100.0% | 5.4%(+94.6)#3 | 6.0%(+94.0)#61 |
| 4. | Sierra Village | 100.0% | 5.4%(+94.6)#4 | 6.0%(+94.0)#83 |
| 5. | Bear Valley Cdp Mariposa County | 100.0% | 5.4%(+94.6)#5 | 6.0%(+94.0)#93 |
| 6. | Graniteville | 100.0% | 5.4%(+94.6)#6 | 6.0%(+94.0)#128 |
| 7. | Mineral | 69.2% | 5.4%(+63.9)#7 | 6.0%(+63.2)#198 |
| 8. | Snelling | 63.6% | 5.4%(+58.3)#8 | 6.0%(+57.6)#237 |
| 9. | Pajaro | 61.6% | 5.4%(+56.2)#9 | 6.0%(+55.6)#251 |
| 10. | Strathmore | 57.4% | 5.4%(+52.1)#10 | 6.0%(+51.5)#285 |
| 11. | Chualar | 56.7% | 5.4%(+51.3)#11 | 6.0%(+50.7)#288 |
| 12. | North San Juan | 56.7% | 5.4%(+51.3)#12 | 6.0%(+50.7)#289 |
| 13. | Tulelake | 51.7% | 5.4%(+46.4)#13 | 6.0%(+45.7)#339 |
| 14. | Edgewood | 50.0% | 5.4%(+44.6)#14 | 6.0%(+44.0)#400 |
| 15. | East Tulare Villa | 45.5% | 5.4%(+40.1)#15 | 6.0%(+39.5)#450 |
| 16. | Samoa | 44.4% | 5.4%(+39.1)#16 | 6.0%(+38.4)#462 |
| 17. | Wawona | 43.3% | 5.4%(+38.0)#17 | 6.0%(+37.3)#487 |
| 18. | Peters | 42.9% | 5.4%(+37.5)#18 | 6.0%(+36.9)#493 |
| 19. | Ruth | 41.9% | 5.4%(+36.6)#19 | 6.0%(+35.9)#512 |
| 20. | Dorris | 41.7% | 5.4%(+36.3)#20 | 6.0%(+35.7)#515 |
| 21. | Sultana | 41.4% | 5.4%(+36.0)#21 | 6.0%(+35.4)#525 |
| 22. | Thornton | 40.0% | 5.4%(+34.6)#22 | 6.0%(+34.0)#557 |
| 23. | Riverdale | 39.0% | 5.4%(+33.7)#23 | 6.0%(+33.0)#610 |
| 24. | Bowles | 38.5% | 5.4%(+33.1)#24 | 6.0%(+32.5)#631 |
| 25. | Daphnedale Park | 38.5% | 5.4%(+33.1)#25 | 6.0%(+32.5)#633 |
| 26. | Keddie | 37.9% | 5.4%(+32.6)#26 | 6.0%(+31.9)#647 |
| 27. | Laton | 37.5% | 5.4%(+32.1)#27 | 6.0%(+31.5)#651 |
| 28. | Calpine | 36.8% | 5.4%(+31.5)#28 | 6.0%(+30.8)#688 |
| 29. | Keyes | 35.3% | 5.4%(+29.9)#29 | 6.0%(+29.3)#743 |
| 30. | Patton Village | 34.3% | 5.4%(+28.9)#30 | 6.0%(+28.3)#782 |
| 31. | Pine Canyon | 33.9% | 5.4%(+28.6)#31 | 6.0%(+27.9)#788 |
| 32. | Gerber | 33.8% | 5.4%(+28.5)#32 | 6.0%(+27.8)#794 |
| 33. | Jones Valley | 33.5% | 5.4%(+28.2)#33 | 6.0%(+27.5)#798 |
| 34. | Monmouth | 33.3% | 5.4%(+28.0)#34 | 6.0%(+27.3)#837 |
| 35. | Los Alamos | 32.6% | 5.4%(+27.3)#35 | 6.0%(+26.6)#893 |
| 36. | Rutherford | 31.6% | 5.4%(+26.2)#36 | 6.0%(+25.6)#948 |
| 37. | Caruthers | 31.5% | 5.4%(+26.2)#37 | 6.0%(+25.5)#951 |
| 38. | Catheys Valley | 31.3% | 5.4%(+26.0)#38 | 6.0%(+25.3)#963 |
| 39. | Cromberg | 30.8% | 5.4%(+25.4)#39 | 6.0%(+24.8)#998 |
| 40. | Graeagle | 29.8% | 5.4%(+24.5)#40 | 6.0%(+23.8)#1,058 |
| 41. | Irwindale | 28.9% | 5.4%(+23.5)#41 | 6.0%(+22.9)#1,108 |
| 42. | Traver | 28.6% | 5.4%(+23.2)#42 | 6.0%(+22.6)#1,123 |
| 43. | Franklin Cdp Merced County | 28.2% | 5.4%(+22.8)#43 | 6.0%(+22.2)#1,178 |
| 44. | Lake City | 28.0% | 5.4%(+22.6)#44 | 6.0%(+22.0)#1,196 |
| 45. | Bayview Cdp Contra Costa County | 27.0% | 5.4%(+21.6)#45 | 6.0%(+21.0)#1,291 |
| 46. | Bluewater | 26.9% | 5.4%(+21.6)#46 | 6.0%(+20.9)#1,297 |
| 47. | Fruitridge Pocket | 26.4% | 5.4%(+21.1)#47 | 6.0%(+20.4)#1,341 |
| 48. | Riverdale Park | 26.4% | 5.4%(+21.0)#48 | 6.0%(+20.4)#1,342 |
| 49. | Hasley Canyon | 25.9% | 5.4%(+20.5)#49 | 6.0%(+19.9)#1,378 |
| 50. | West Park | 25.3% | 5.4%(+19.9)#50 | 6.0%(+19.3)#1,417 |
| 51. | Benbow | 25.0% | 5.4%(+19.6)#51 | 6.0%(+19.0)#1,478 |
| 52. | Tehama | 24.1% | 5.4%(+18.8)#52 | 6.0%(+18.1)#1,572 |
| 53. | Junction City | 23.3% | 5.4%(+17.9)#53 | 6.0%(+17.3)#1,674 |
| 54. | Corning | 23.0% | 5.4%(+17.6)#54 | 6.0%(+17.0)#1,717 |
| 55. | Gasquet | 22.9% | 5.4%(+17.6)#55 | 6.0%(+16.9)#1,722 |
| 56. | Ivanhoe | 22.9% | 5.4%(+17.5)#56 | 6.0%(+16.9)#1,727 |
| 57. | Plainview | 22.6% | 5.4%(+17.2)#57 | 6.0%(+16.6)#1,764 |
| 58. | Chester | 22.6% | 5.4%(+17.2)#58 | 6.0%(+16.6)#1,769 |
| 59. | Springville | 22.2% | 5.4%(+16.9)#59 | 6.0%(+16.2)#1,806 |
| 60. | Seville | 22.2% | 5.4%(+16.9)#60 | 6.0%(+16.2)#1,809 |
| 61. | Richfield | 22.2% | 5.4%(+16.9)#61 | 6.0%(+16.2)#1,818 |
| 62. | Carnelian Bay | 22.2% | 5.4%(+16.8)#62 | 6.0%(+16.2)#1,829 |
| 63. | Sonoma State University | 22.1% | 5.4%(+16.7)#63 | 6.0%(+16.1)#1,841 |
| 64. | Vernon | 21.7% | 5.4%(+16.4)#64 | 6.0%(+15.7)#1,893 |
| 65. | Arvin | 21.5% | 5.4%(+16.1)#65 | 6.0%(+15.5)#1,929 |
| 66. | East Rancho Dominguez | 21.3% | 5.4%(+15.9)#66 | 6.0%(+15.3)#1,954 |
| 67. | Port Costa | 21.3% | 5.4%(+15.9)#67 | 6.0%(+15.3)#1,957 |
| 68. | Silver Lakes | 21.2% | 5.4%(+15.8)#68 | 6.0%(+15.2)#1,970 |
| 69. | Pajaro Dunes | 20.8% | 5.4%(+15.5)#69 | 6.0%(+14.8)#2,027 |
| 70. | Lincoln Village | 20.7% | 5.4%(+15.4)#70 | 6.0%(+14.7)#2,039 |
| 71. | Pinon Hills | 20.4% | 5.4%(+15.0)#71 | 6.0%(+14.4)#2,091 |
| 72. | Del Dios | 20.3% | 5.4%(+14.9)#72 | 6.0%(+14.3)#2,105 |
| 73. | Lebec | 20.1% | 5.4%(+14.7)#73 | 6.0%(+14.1)#2,134 |
| 74. | Esparto | 20.0% | 5.4%(+14.6)#74 | 6.0%(+14.0)#2,223 |
| 75. | East Bakersfield | 19.8% | 5.4%(+14.5)#75 | 6.0%(+13.9)#2,234 |
| 76. | Madera Acres | 19.8% | 5.4%(+14.5)#76 | 6.0%(+13.8)#2,240 |
| 77. | San Jacinto | 19.8% | 5.4%(+14.5)#77 | 6.0%(+13.8)#2,241 |
| 78. | Dixon Lane Meadow Creek | 19.8% | 5.4%(+14.4)#78 | 6.0%(+13.8)#2,246 |
| 79. | Bethel Island | 19.8% | 5.4%(+14.4)#79 | 6.0%(+13.8)#2,252 |
| 80. | Earlimart | 19.7% | 5.4%(+14.3)#80 | 6.0%(+13.7)#2,261 |
| 81. | Spaulding | 19.6% | 5.4%(+14.2)#81 | 6.0%(+13.6)#2,281 |
| 82. | Grenada | 19.5% | 5.4%(+14.1)#82 | 6.0%(+13.5)#2,289 |
| 83. | Garden Farms | 19.3% | 5.4%(+13.9)#83 | 6.0%(+13.3)#2,337 |
| 84. | Weldon | 19.2% | 5.4%(+13.9)#84 | 6.0%(+13.2)#2,345 |
| 85. | Muscoy | 19.2% | 5.4%(+13.8)#85 | 6.0%(+13.2)#2,359 |
| 86. | Isleton | 19.1% | 5.4%(+13.8)#86 | 6.0%(+13.2)#2,370 |
| 87. | Anderson | 19.1% | 5.4%(+13.7)#87 | 6.0%(+13.1)#2,379 |
| 88. | Camp Pendleton Mainside | 19.1% | 5.4%(+13.7)#88 | 6.0%(+13.1)#2,380 |
| 89. | Thousand Palms | 19.0% | 5.4%(+13.7)#89 | 6.0%(+13.1)#2,386 |
| 90. | Hamilton City | 19.0% | 5.4%(+13.7)#90 | 6.0%(+13.1)#2,388 |
| 91. | Montague | 18.6% | 5.4%(+13.2)#91 | 6.0%(+12.6)#2,483 |
| 92. | Maxwell | 18.5% | 5.4%(+13.1)#92 | 6.0%(+12.5)#2,515 |
| 93. | Shandon | 18.5% | 5.4%(+13.1)#93 | 6.0%(+12.5)#2,516 |
| 94. | Tipton | 18.3% | 5.4%(+13.0)#94 | 6.0%(+12.3)#2,537 |
| 95. | Imperial | 17.9% | 5.4%(+12.6)#95 | 6.0%(+12.0)#2,635 |
| 96. | Anza | 17.8% | 5.4%(+12.5)#96 | 6.0%(+11.9)#2,659 |
| 97. | Olivehurst | 17.8% | 5.4%(+12.4)#97 | 6.0%(+11.8)#2,676 |
| 98. | Pine Mountain Club | 17.7% | 5.4%(+12.4)#98 | 6.0%(+11.7)#2,680 |
| 99. | Alum Rock | 17.7% | 5.4%(+12.3)#99 | 6.0%(+11.7)#2,690 |
| 100. | East Nicolaus | 17.6% | 5.4%(+12.3)#100 | 6.0%(+11.7)#2,718 |
Common Questions
What are the Top 10 Cities with the Highest Percentage of Population with a Degree in Arts and Humanities in California?
Top 10 Cities with the Highest Percentage of Population with a Degree in Arts and Humanities in California are:
#1
100.0%
#2
100.0%
#3
100.0%
#4
100.0%
#5
69.2%
#6
63.6%
#7
61.6%
#8
57.4%
#9
56.7%
#10
56.7%
What city has the Highest Percentage of Population with a Degree in Arts and Humanities in California?
Cherokee has the Highest Percentage of Population with a Degree in Arts and Humanities in California with 100.0%.
What is the Percentage of Population with a Degree in Arts and Humanities in the State of California?
Percentage of Population with a Degree in Arts and Humanities in California is 5.4%.
What is the Percentage of Population with a Degree in Arts and Humanities in the United States?
Percentage of Population with a Degree in Arts and Humanities in the United States is 6.0%.