Cities with the Highest Percentage of Families with Income Above $100,000 in California
RELATED REPORTS & OPTIONS
Family Income | $100k+
California
Compare Cities
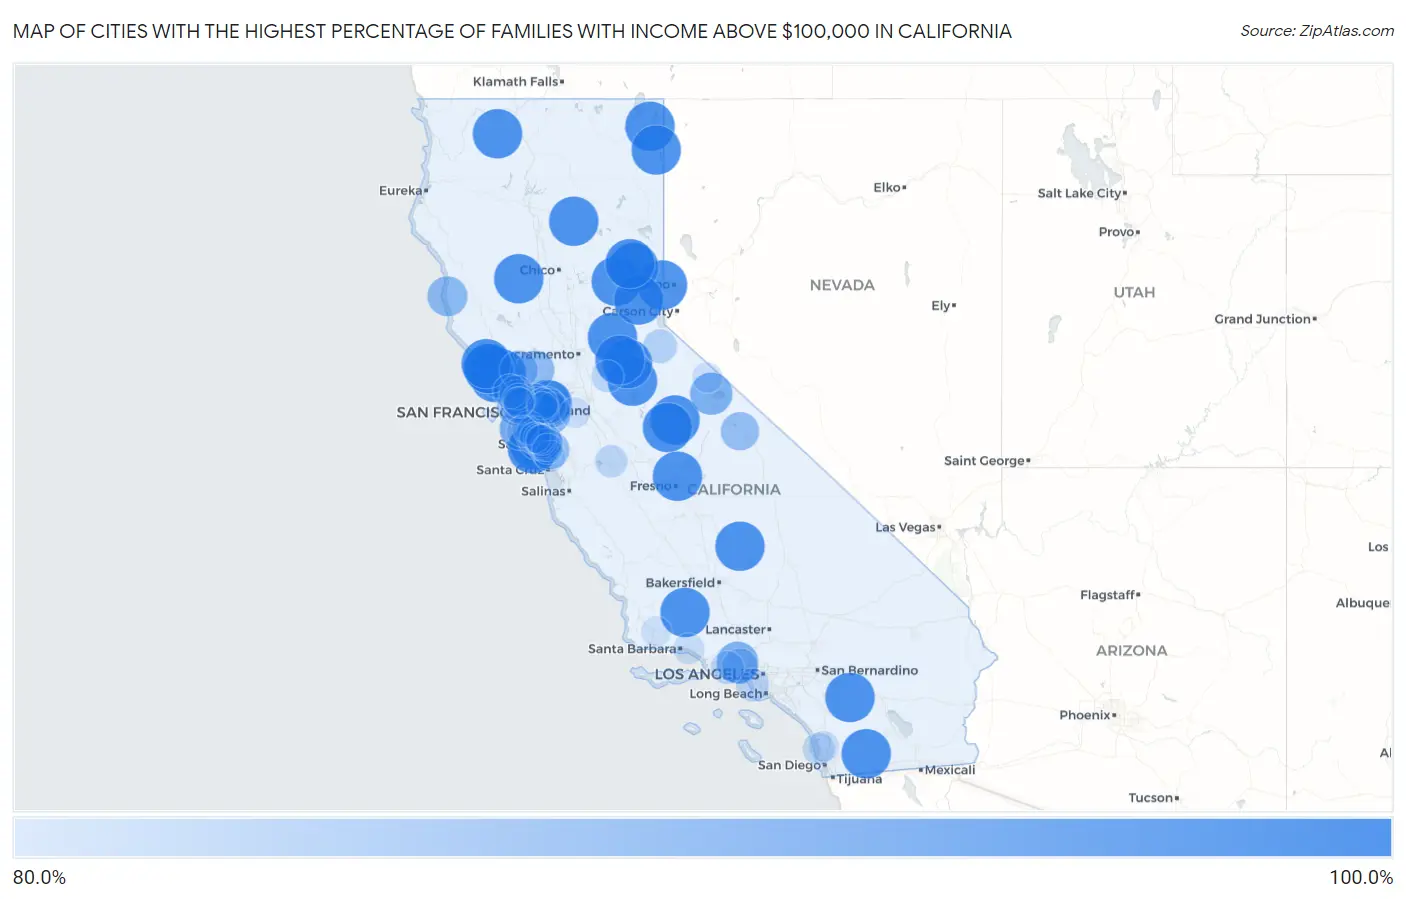
Map of Cities with the Highest Percentage of Families with Income Above $100,000 in California
0.0%
100.0%
Cities with the Highest Percentage of Families with Income Above $100,000 in California
| City | Families with Income > $100k | vs State | vs National | |
| 1. | La Honda | 100.0% | 52.2%(+47.8)#1 | 46.1%(+53.9)#14 |
| 2. | Elfin Forest | 100.0% | 52.2%(+47.8)#2 | 46.1%(+53.9)#18 |
| 3. | Bodega | 100.0% | 52.2%(+47.8)#3 | 46.1%(+53.9)#20 |
| 4. | El Portal | 100.0% | 52.2%(+47.8)#4 | 46.1%(+53.9)#25 |
| 5. | Dillon Beach | 100.0% | 52.2%(+47.8)#5 | 46.1%(+53.9)#27 |
| 6. | Mountain Ranch | 100.0% | 52.2%(+47.8)#6 | 46.1%(+53.9)#48 |
| 7. | Coloma | 100.0% | 52.2%(+47.8)#7 | 46.1%(+53.9)#51 |
| 8. | Mountain Meadows | 100.0% | 52.2%(+47.8)#8 | 46.1%(+53.9)#59 |
| 9. | Bloomfield | 100.0% | 52.2%(+47.8)#9 | 46.1%(+53.9)#86 |
| 10. | Midpines | 100.0% | 52.2%(+47.8)#10 | 46.1%(+53.9)#90 |
| 11. | Fort Washington | 100.0% | 52.2%(+47.8)#11 | 46.1%(+53.9)#105 |
| 12. | Loma Mar | 100.0% | 52.2%(+47.8)#12 | 46.1%(+53.9)#151 |
| 13. | Old River | 100.0% | 52.2%(+47.8)#13 | 46.1%(+53.9)#161 |
| 14. | Downieville | 100.0% | 52.2%(+47.8)#14 | 46.1%(+53.9)#162 |
| 15. | Mount Laguna | 100.0% | 52.2%(+47.8)#15 | 46.1%(+53.9)#163 |
| 16. | Sereno Del Mar | 100.0% | 52.2%(+47.8)#16 | 46.1%(+53.9)#175 |
| 17. | Verdi | 100.0% | 52.2%(+47.8)#17 | 46.1%(+53.9)#176 |
| 18. | Gold Mountain | 100.0% | 52.2%(+47.8)#18 | 46.1%(+53.9)#180 |
| 19. | Greenview | 100.0% | 52.2%(+47.8)#19 | 46.1%(+53.9)#183 |
| 20. | Kingvale | 100.0% | 52.2%(+47.8)#20 | 46.1%(+53.9)#205 |
| 21. | Mineral | 100.0% | 52.2%(+47.8)#21 | 46.1%(+53.9)#221 |
| 22. | Bear Valley Cdp Alpine County | 100.0% | 52.2%(+47.8)#22 | 46.1%(+53.9)#225 |
| 23. | Bear Valley Cdp Mariposa County | 100.0% | 52.2%(+47.8)#23 | 46.1%(+53.9)#229 |
| 24. | Carmet | 100.0% | 52.2%(+47.8)#24 | 46.1%(+53.9)#242 |
| 25. | Volcano | 100.0% | 52.2%(+47.8)#25 | 46.1%(+53.9)#247 |
| 26. | Fiddletown | 100.0% | 52.2%(+47.8)#26 | 46.1%(+53.9)#251 |
| 27. | Elk Creek | 100.0% | 52.2%(+47.8)#27 | 46.1%(+53.9)#280 |
| 28. | Mountain Center | 100.0% | 52.2%(+47.8)#28 | 46.1%(+53.9)#281 |
| 29. | Lake City | 100.0% | 52.2%(+47.8)#29 | 46.1%(+53.9)#321 |
| 30. | Mohawk Vista | 100.0% | 52.2%(+47.8)#30 | 46.1%(+53.9)#330 |
| 31. | California Hot Springs | 100.0% | 52.2%(+47.8)#31 | 46.1%(+53.9)#360 |
| 32. | Jenner | 100.0% | 52.2%(+47.8)#32 | 46.1%(+53.9)#379 |
| 33. | Eagleville | 100.0% | 52.2%(+47.8)#33 | 46.1%(+53.9)#388 |
| 34. | Cuyama | 100.0% | 52.2%(+47.8)#34 | 46.1%(+53.9)#403 |
| 35. | Olde Stockdale | 97.4% | 52.2%(+45.2)#35 | 46.1%(+51.3)#431 |
| 36. | Shell Ridge | 96.6% | 52.2%(+44.4)#36 | 46.1%(+50.5)#436 |
| 37. | North Gate | 95.3% | 52.2%(+43.1)#37 | 46.1%(+49.2)#451 |
| 38. | Montara | 94.6% | 52.2%(+42.4)#38 | 46.1%(+48.5)#458 |
| 39. | Mono City | 93.9% | 52.2%(+41.7)#39 | 46.1%(+47.8)#474 |
| 40. | Bell Canyon | 93.4% | 52.2%(+41.2)#40 | 46.1%(+47.3)#486 |
| 41. | Pepperdine University | 92.8% | 52.2%(+40.6)#41 | 46.1%(+46.7)#497 |
| 42. | Norris Canyon | 92.6% | 52.2%(+40.4)#42 | 46.1%(+46.5)#502 |
| 43. | Caspar | 92.0% | 52.2%(+39.8)#43 | 46.1%(+45.9)#513 |
| 44. | West Menlo Park | 91.3% | 52.2%(+39.1)#44 | 46.1%(+45.2)#532 |
| 45. | Silverado Resort | 91.0% | 52.2%(+38.8)#45 | 46.1%(+44.9)#541 |
| 46. | Muir Beach | 91.0% | 52.2%(+38.8)#46 | 46.1%(+44.9)#542 |
| 47. | Monte Sereno | 90.7% | 52.2%(+38.5)#47 | 46.1%(+44.6)#551 |
| 48. | Swall Meadows | 90.6% | 52.2%(+38.4)#48 | 46.1%(+44.5)#557 |
| 49. | Glen Ellen | 90.5% | 52.2%(+38.3)#49 | 46.1%(+44.4)#559 |
| 50. | El Macero | 90.2% | 52.2%(+38.0)#50 | 46.1%(+44.1)#574 |
| 51. | Kensington | 90.1% | 52.2%(+37.9)#51 | 46.1%(+44.0)#576 |
| 52. | Ross | 90.0% | 52.2%(+37.8)#52 | 46.1%(+43.9)#585 |
| 53. | Piedmont | 89.9% | 52.2%(+37.7)#53 | 46.1%(+43.8)#589 |
| 54. | Tiburon | 89.9% | 52.2%(+37.7)#54 | 46.1%(+43.8)#590 |
| 55. | Portola Valley | 89.7% | 52.2%(+37.5)#55 | 46.1%(+43.6)#598 |
| 56. | Loyola | 89.5% | 52.2%(+37.3)#56 | 46.1%(+43.4)#607 |
| 57. | Castle Hill | 89.4% | 52.2%(+37.2)#57 | 46.1%(+43.3)#614 |
| 58. | Orinda | 89.2% | 52.2%(+37.0)#58 | 46.1%(+43.1)#621 |
| 59. | Los Altos | 89.1% | 52.2%(+36.9)#59 | 46.1%(+43.0)#627 |
| 60. | Emerald Lake Hills | 89.1% | 52.2%(+36.9)#60 | 46.1%(+43.0)#630 |
| 61. | Igo | 88.9% | 52.2%(+36.7)#61 | 46.1%(+42.8)#647 |
| 62. | Sausalito | 88.6% | 52.2%(+36.4)#62 | 46.1%(+42.5)#655 |
| 63. | Atherton | 88.6% | 52.2%(+36.4)#63 | 46.1%(+42.5)#656 |
| 64. | Tamalpais Homestead Valley | 88.5% | 52.2%(+36.3)#64 | 46.1%(+42.4)#662 |
| 65. | Hidden Hills | 88.3% | 52.2%(+36.1)#65 | 46.1%(+42.2)#675 |
| 66. | Danville | 87.8% | 52.2%(+35.6)#66 | 46.1%(+41.7)#699 |
| 67. | Alamo | 87.8% | 52.2%(+35.6)#67 | 46.1%(+41.7)#700 |
| 68. | San Miguel Cdp Contra Costa County | 87.2% | 52.2%(+35.0)#68 | 46.1%(+41.1)#733 |
| 69. | Lucas Valley Marinwood | 87.0% | 52.2%(+34.8)#69 | 46.1%(+40.9)#746 |
| 70. | California Polytechnic State University | 86.9% | 52.2%(+34.7)#70 | 46.1%(+40.8)#753 |
| 71. | Nicasio | 86.9% | 52.2%(+34.7)#71 | 46.1%(+40.8)#759 |
| 72. | Kirkwood | 86.8% | 52.2%(+34.6)#72 | 46.1%(+40.7)#763 |
| 73. | Manhattan Beach | 86.2% | 52.2%(+34.0)#73 | 46.1%(+40.1)#799 |
| 74. | San Carlos | 86.1% | 52.2%(+33.9)#74 | 46.1%(+40.0)#806 |
| 75. | Hillsborough | 86.1% | 52.2%(+33.9)#75 | 46.1%(+40.0)#809 |
| 76. | Lake Sherwood | 86.1% | 52.2%(+33.9)#76 | 46.1%(+40.0)#813 |
| 77. | Cupertino | 85.8% | 52.2%(+33.6)#77 | 46.1%(+39.7)#824 |
| 78. | Los Altos Hills | 85.8% | 52.2%(+33.6)#78 | 46.1%(+39.7)#825 |
| 79. | Kentfield | 85.8% | 52.2%(+33.6)#79 | 46.1%(+39.7)#826 |
| 80. | Volta | 85.7% | 52.2%(+33.5)#80 | 46.1%(+39.6)#837 |
| 81. | Del Mar | 85.4% | 52.2%(+33.2)#81 | 46.1%(+39.3)#858 |
| 82. | Camanche Village | 85.4% | 52.2%(+33.2)#82 | 46.1%(+39.3)#860 |
| 83. | Bayview Cdp Contra Costa County | 85.3% | 52.2%(+33.1)#83 | 46.1%(+39.2)#869 |
| 84. | El Granada | 84.8% | 52.2%(+32.6)#84 | 46.1%(+38.7)#907 |
| 85. | Lafayette | 84.7% | 52.2%(+32.5)#85 | 46.1%(+38.6)#915 |
| 86. | Lexington Hills | 84.7% | 52.2%(+32.5)#86 | 46.1%(+38.6)#918 |
| 87. | Highlands | 84.6% | 52.2%(+32.4)#87 | 46.1%(+38.5)#932 |
| 88. | Trabuco Canyon | 84.6% | 52.2%(+32.4)#88 | 46.1%(+38.5)#934 |
| 89. | Moraga | 84.5% | 52.2%(+32.3)#89 | 46.1%(+38.4)#937 |
| 90. | La Canada Flintridge | 84.4% | 52.2%(+32.2)#90 | 46.1%(+38.3)#941 |
| 91. | Toro Canyon | 84.4% | 52.2%(+32.2)#91 | 46.1%(+38.3)#947 |
| 92. | Mountain House | 84.1% | 52.2%(+31.9)#92 | 46.1%(+38.0)#961 |
| 93. | Fairbanks Ranch | 84.1% | 52.2%(+31.9)#93 | 46.1%(+38.0)#965 |
| 94. | Bridgeport | 84.0% | 52.2%(+31.8)#94 | 46.1%(+37.9)#974 |
| 95. | Mill Valley | 83.9% | 52.2%(+31.7)#95 | 46.1%(+37.8)#979 |
| 96. | Woodside | 83.9% | 52.2%(+31.7)#96 | 46.1%(+37.8)#980 |
| 97. | Ladera | 83.9% | 52.2%(+31.7)#97 | 46.1%(+37.8)#983 |
| 98. | Palo Alto | 83.8% | 52.2%(+31.6)#98 | 46.1%(+37.7)#985 |
| 99. | Saratoga | 83.8% | 52.2%(+31.6)#99 | 46.1%(+37.7)#986 |
| 100. | Los Olivos | 83.8% | 52.2%(+31.6)#100 | 46.1%(+37.7)#991 |
Common Questions
What are the Top 10 Cities with the Highest Percentage of Families with Income Above $100,000 in California?
Top 10 Cities with the Highest Percentage of Families with Income Above $100,000 in California are:
#1
100.0%
#2
100.0%
#3
100.0%
#4
100.0%
#5
100.0%
#6
100.0%
#7
100.0%
#8
100.0%
#9
100.0%
#10
100.0%
What city has the Highest Percentage of Families with Income Above $100,000 in California?
La Honda has the Highest Percentage of Families with Income Above $100,000 in California with 100.0%.
What is the Percentage of Families with Income Above $100,000 in the State of California?
Percentage of Families with Income Above $100,000 in California is 52.2%.
What is the Percentage of Families with Income Above $100,000 in the United States?
Percentage of Families with Income Above $100,000 in the United States is 46.1%.