Cities with the Largest Bangladeshi Community in California
RELATED REPORTS & OPTIONS
Bangladeshi
California
Compare Cities
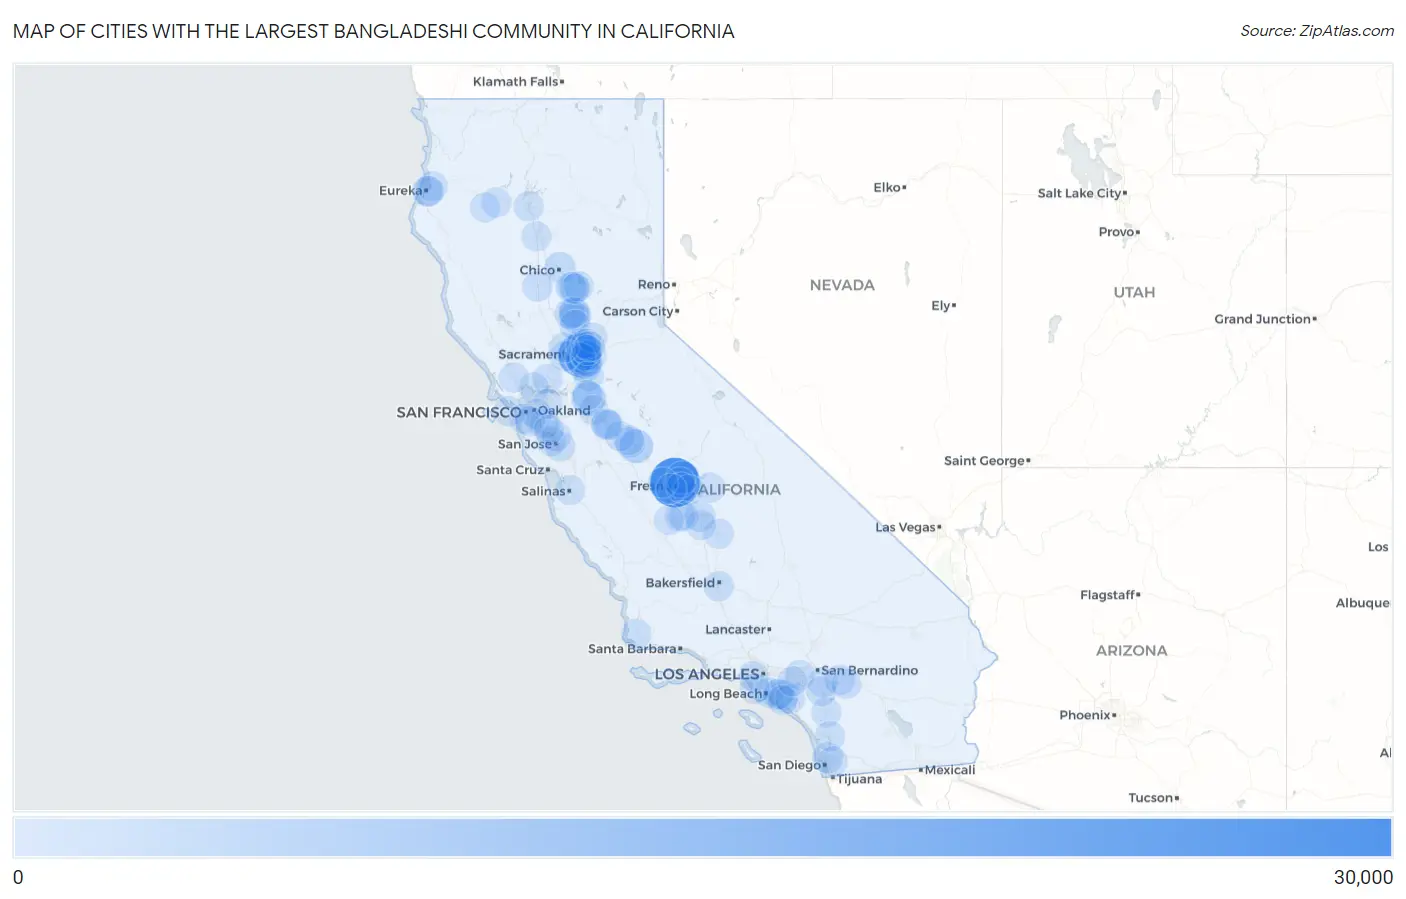
Map of Cities with the Largest Bangladeshi Community in California
0
30,000
Cities with the Largest Bangladeshi Community in California
| City | Bangladeshi | vs State | vs National | |
| 1. | Fresno | 26,899 | 112,008(24.02%)#1 | 348,407(7.72%)#2 |
| 2. | Sacramento | 18,134 | 112,008(16.19%)#2 | 348,407(5.20%)#3 |
| 3. | Florin | 5,369 | 112,008(4.79%)#3 | 348,407(1.54%)#8 |
| 4. | Stockton | 5,262 | 112,008(4.70%)#4 | 348,407(1.51%)#10 |
| 5. | Merced | 4,854 | 112,008(4.33%)#5 | 348,407(1.39%)#12 |
| 6. | Clovis | 3,194 | 112,008(2.85%)#6 | 348,407(0.92%)#15 |
| 7. | Elk Grove | 2,435 | 112,008(2.17%)#7 | 348,407(0.70%)#23 |
| 8. | Linda | 2,313 | 112,008(2.07%)#8 | 348,407(0.66%)#24 |
| 9. | Chico | 1,684 | 112,008(1.50%)#9 | 348,407(0.48%)#32 |
| 10. | Oroville | 1,662 | 112,008(1.48%)#10 | 348,407(0.48%)#33 |
| 11. | Lemon Hill | 1,521 | 112,008(1.36%)#11 | 348,407(0.44%)#34 |
| 12. | Franklin Cdp Merced County | 1,382 | 112,008(1.23%)#12 | 348,407(0.40%)#37 |
| 13. | Visalia | 1,153 | 112,008(1.03%)#13 | 348,407(0.33%)#38 |
| 14. | Rancho Cordova | 1,152 | 112,008(1.03%)#14 | 348,407(0.33%)#39 |
| 15. | Thermalito | 1,119 | 112,008(1.00%)#15 | 348,407(0.32%)#41 |
| 16. | Olivehurst | 1,106 | 112,008(0.99%)#16 | 348,407(0.32%)#42 |
| 17. | Vineyard | 1,098 | 112,008(0.98%)#17 | 348,407(0.32%)#43 |
| 18. | San Diego | 1,003 | 112,008(0.90%)#18 | 348,407(0.29%)#49 |
| 19. | Arden Arcade | 859 | 112,008(0.77%)#19 | 348,407(0.25%)#50 |
| 20. | Eureka | 813 | 112,008(0.73%)#20 | 348,407(0.23%)#55 |
| 21. | Yuba City | 810 | 112,008(0.72%)#21 | 348,407(0.23%)#56 |
| 22. | Parkway | 678 | 112,008(0.61%)#22 | 348,407(0.19%)#63 |
| 23. | San Jose | 506 | 112,008(0.45%)#23 | 348,407(0.15%)#75 |
| 24. | Modesto | 467 | 112,008(0.42%)#24 | 348,407(0.13%)#82 |
| 25. | Rio Linda | 459 | 112,008(0.41%)#25 | 348,407(0.13%)#85 |
| 26. | North Highlands | 452 | 112,008(0.40%)#26 | 348,407(0.13%)#87 |
| 27. | Atwater | 451 | 112,008(0.40%)#27 | 348,407(0.13%)#88 |
| 28. | Willows | 450 | 112,008(0.40%)#28 | 348,407(0.13%)#89 |
| 29. | Los Angeles | 428 | 112,008(0.38%)#29 | 348,407(0.12%)#92 |
| 30. | Sanger | 399 | 112,008(0.36%)#30 | 348,407(0.11%)#99 |
| 31. | Tarpey Village | 383 | 112,008(0.34%)#31 | 348,407(0.11%)#105 |
| 32. | Westminster | 360 | 112,008(0.32%)#32 | 348,407(0.10%)#111 |
| 33. | Marysville | 351 | 112,008(0.31%)#33 | 348,407(0.10%)#115 |
| 34. | Santa Ana | 344 | 112,008(0.31%)#34 | 348,407(0.10%)#119 |
| 35. | Banning | 341 | 112,008(0.30%)#35 | 348,407(0.10%)#120 |
| 36. | Bakersfield | 337 | 112,008(0.30%)#36 | 348,407(0.10%)#123 |
| 37. | Oakland | 334 | 112,008(0.30%)#37 | 348,407(0.10%)#124 |
| 38. | San Francisco | 307 | 112,008(0.27%)#38 | 348,407(0.09%)#132 |
| 39. | Porterville | 280 | 112,008(0.25%)#39 | 348,407(0.08%)#147 |
| 40. | Tulare | 278 | 112,008(0.25%)#40 | 348,407(0.08%)#150 |
| 41. | Garden Grove | 277 | 112,008(0.25%)#41 | 348,407(0.08%)#151 |
| 42. | Redding | 276 | 112,008(0.25%)#42 | 348,407(0.08%)#153 |
| 43. | Elverta | 266 | 112,008(0.24%)#43 | 348,407(0.08%)#155 |
| 44. | Arcata | 261 | 112,008(0.23%)#44 | 348,407(0.07%)#158 |
| 45. | Armona | 250 | 112,008(0.22%)#45 | 348,407(0.07%)#161 |
| 46. | Davis | 247 | 112,008(0.22%)#46 | 348,407(0.07%)#165 |
| 47. | Fairfield | 237 | 112,008(0.21%)#47 | 348,407(0.07%)#173 |
| 48. | Moreno Valley | 233 | 112,008(0.21%)#48 | 348,407(0.07%)#174 |
| 49. | Delhi | 232 | 112,008(0.21%)#49 | 348,407(0.07%)#180 |
| 50. | Lompoc | 227 | 112,008(0.20%)#50 | 348,407(0.07%)#186 |
| 51. | La Riviera | 226 | 112,008(0.20%)#51 | 348,407(0.06%)#187 |
| 52. | Oroville East | 216 | 112,008(0.19%)#52 | 348,407(0.06%)#190 |
| 53. | Plumas Lake | 208 | 112,008(0.19%)#53 | 348,407(0.06%)#197 |
| 54. | Temecula | 204 | 112,008(0.18%)#54 | 348,407(0.06%)#201 |
| 55. | Hanford | 204 | 112,008(0.18%)#55 | 348,407(0.06%)#202 |
| 56. | Long Beach | 203 | 112,008(0.18%)#56 | 348,407(0.06%)#203 |
| 57. | Milpitas | 203 | 112,008(0.18%)#57 | 348,407(0.06%)#204 |
| 58. | Fruitridge Pocket | 197 | 112,008(0.18%)#58 | 348,407(0.06%)#209 |
| 59. | Torrance | 191 | 112,008(0.17%)#59 | 348,407(0.05%)#212 |
| 60. | Squaw Valley | 189 | 112,008(0.17%)#60 | 348,407(0.05%)#213 |
| 61. | Sunnyside | 188 | 112,008(0.17%)#61 | 348,407(0.05%)#214 |
| 62. | Santa Clara | 177 | 112,008(0.16%)#62 | 348,407(0.05%)#224 |
| 63. | Rosemont | 176 | 112,008(0.16%)#63 | 348,407(0.05%)#225 |
| 64. | Red Bluff | 172 | 112,008(0.15%)#64 | 348,407(0.05%)#226 |
| 65. | Winton | 172 | 112,008(0.15%)#65 | 348,407(0.05%)#227 |
| 66. | Vallejo | 167 | 112,008(0.15%)#66 | 348,407(0.05%)#232 |
| 67. | Rocklin | 167 | 112,008(0.15%)#67 | 348,407(0.05%)#233 |
| 68. | Daly City | 163 | 112,008(0.15%)#68 | 348,407(0.05%)#234 |
| 69. | Myrtletown | 163 | 112,008(0.15%)#69 | 348,407(0.05%)#237 |
| 70. | Manteca | 159 | 112,008(0.14%)#70 | 348,407(0.05%)#240 |
| 71. | Irvine | 154 | 112,008(0.14%)#71 | 348,407(0.04%)#242 |
| 72. | Hayward | 149 | 112,008(0.13%)#72 | 348,407(0.04%)#249 |
| 73. | South Oroville | 149 | 112,008(0.13%)#73 | 348,407(0.04%)#251 |
| 74. | Lemoore Station | 140 | 112,008(0.12%)#74 | 348,407(0.04%)#259 |
| 75. | Douglas City | 139 | 112,008(0.12%)#75 | 348,407(0.04%)#260 |
| 76. | Galt | 137 | 112,008(0.12%)#76 | 348,407(0.04%)#262 |
| 77. | Lincoln Village | 137 | 112,008(0.12%)#77 | 348,407(0.04%)#263 |
| 78. | Walnut Creek | 133 | 112,008(0.12%)#78 | 348,407(0.04%)#267 |
| 79. | South San Francisco | 132 | 112,008(0.12%)#79 | 348,407(0.04%)#268 |
| 80. | Hayfork | 126 | 112,008(0.11%)#80 | 348,407(0.04%)#272 |
| 81. | Bayview Cdp Humboldt County | 126 | 112,008(0.11%)#81 | 348,407(0.04%)#273 |
| 82. | Petaluma | 125 | 112,008(0.11%)#82 | 348,407(0.04%)#275 |
| 83. | Ontario | 120 | 112,008(0.11%)#83 | 348,407(0.03%)#282 |
| 84. | Ceres | 117 | 112,008(0.10%)#84 | 348,407(0.03%)#285 |
| 85. | Antelope | 117 | 112,008(0.10%)#85 | 348,407(0.03%)#286 |
| 86. | Biola | 117 | 112,008(0.10%)#86 | 348,407(0.03%)#289 |
| 87. | Costa Mesa | 116 | 112,008(0.10%)#87 | 348,407(0.03%)#290 |
| 88. | Escondido | 109 | 112,008(0.10%)#88 | 348,407(0.03%)#300 |
| 89. | Woodland | 100 | 112,008(0.09%)#89 | 348,407(0.03%)#311 |
| 90. | La Mesa | 100 | 112,008(0.09%)#90 | 348,407(0.03%)#312 |
| 91. | Rouse | 98 | 112,008(0.09%)#91 | 348,407(0.03%)#321 |
| 92. | Chino Hills | 93 | 112,008(0.08%)#92 | 348,407(0.03%)#329 |
| 93. | Bonadelle Ranchos | 89 | 112,008(0.08%)#93 | 348,407(0.03%)#339 |
| 94. | Citrus Heights | 85 | 112,008(0.08%)#94 | 348,407(0.02%)#349 |
| 95. | West Park | 85 | 112,008(0.08%)#95 | 348,407(0.02%)#350 |
| 96. | Fremont | 84 | 112,008(0.07%)#96 | 348,407(0.02%)#351 |
| 97. | Perris | 82 | 112,008(0.07%)#97 | 348,407(0.02%)#357 |
| 98. | Carmichael | 82 | 112,008(0.07%)#98 | 348,407(0.02%)#358 |
| 99. | Cabazon | 82 | 112,008(0.07%)#99 | 348,407(0.02%)#359 |
| 100. | Salinas | 75 | 112,008(0.07%)#100 | 348,407(0.02%)#376 |
Common Questions
What are the Top 10 Cities with the Largest Bangladeshi Community in California?
Top 10 Cities with the Largest Bangladeshi Community in California are:
What city has the Largest Bangladeshi Community in California?
Fresno has the Largest Bangladeshi Community in California with 26,899.
What is the Total Bangladeshi Population in the State of California?
Total Bangladeshi Population in California is 112,008.
What is the Total Bangladeshi Population in the United States?
Total Bangladeshi Population in the United States is 348,407.