Anza, CA Map & Demographics
Anza Map
Anza Overview
$31,096
PER CAPITA INCOME
$90,986
AVG FAMILY INCOME
$50,956
AVG HOUSEHOLD INCOME
30.7%
WAGE / INCOME GAP [ % ]
69.3¢/ $1
WAGE / INCOME GAP [ $ ]
0.48
INEQUALITY / GINI INDEX
1,959
TOTAL POPULATION
970
MALE POPULATION
989
FEMALE POPULATION
98.08
MALES / 100 FEMALES
101.96
FEMALES / 100 MALES
43.3
MEDIAN AGE
3.5
AVG FAMILY SIZE
2.6
AVG HOUSEHOLD SIZE
990
LABOR FORCE [ PEOPLE ]
65.1%
PERCENT IN LABOR FORCE
10.3%
UNEMPLOYMENT RATE
Anza Zip Codes
Anza Area Codes
Income in Anza
Income Overview in Anza
Per Capita Income in Anza is $31,096, while median incomes of families and households are $90,986 and $50,956 respectively.
| Characteristic | Number | Measure |
| Per Capita Income | 1,959 | $31,096 |
| Median Family Income | 371 | $90,986 |
| Mean Family Income | 371 | $99,930 |
| Median Household Income | 748 | $50,956 |
| Mean Household Income | 748 | $78,369 |
| Income Deficit | 371 | $0 |
| Wage / Income Gap (%) | 1,959 | 30.67% |
| Wage / Income Gap ($) | 1,959 | 69.33¢ per $1 |
| Gini / Inequality Index | 1,959 | 0.48 |
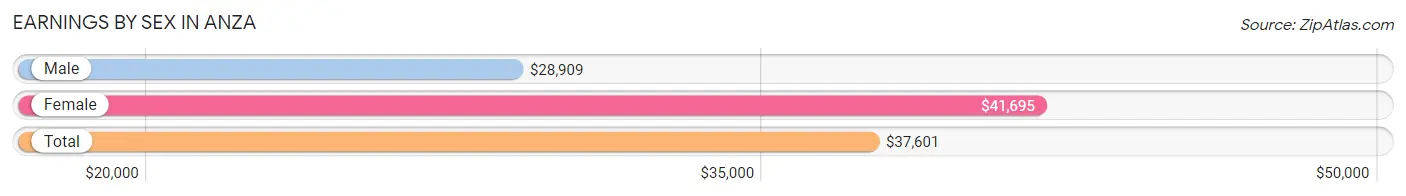
Earnings by Sex in Anza
Average Earnings in Anza are $37,601, $28,909 for men and $41,695 for women, a difference of 30.7%.
| Sex | Number | Average Earnings |
| Male | 561 (52.3%) | $28,909 |
| Female | 512 (47.7%) | $41,695 |
| Total | 1,073 (100.0%) | $37,601 |
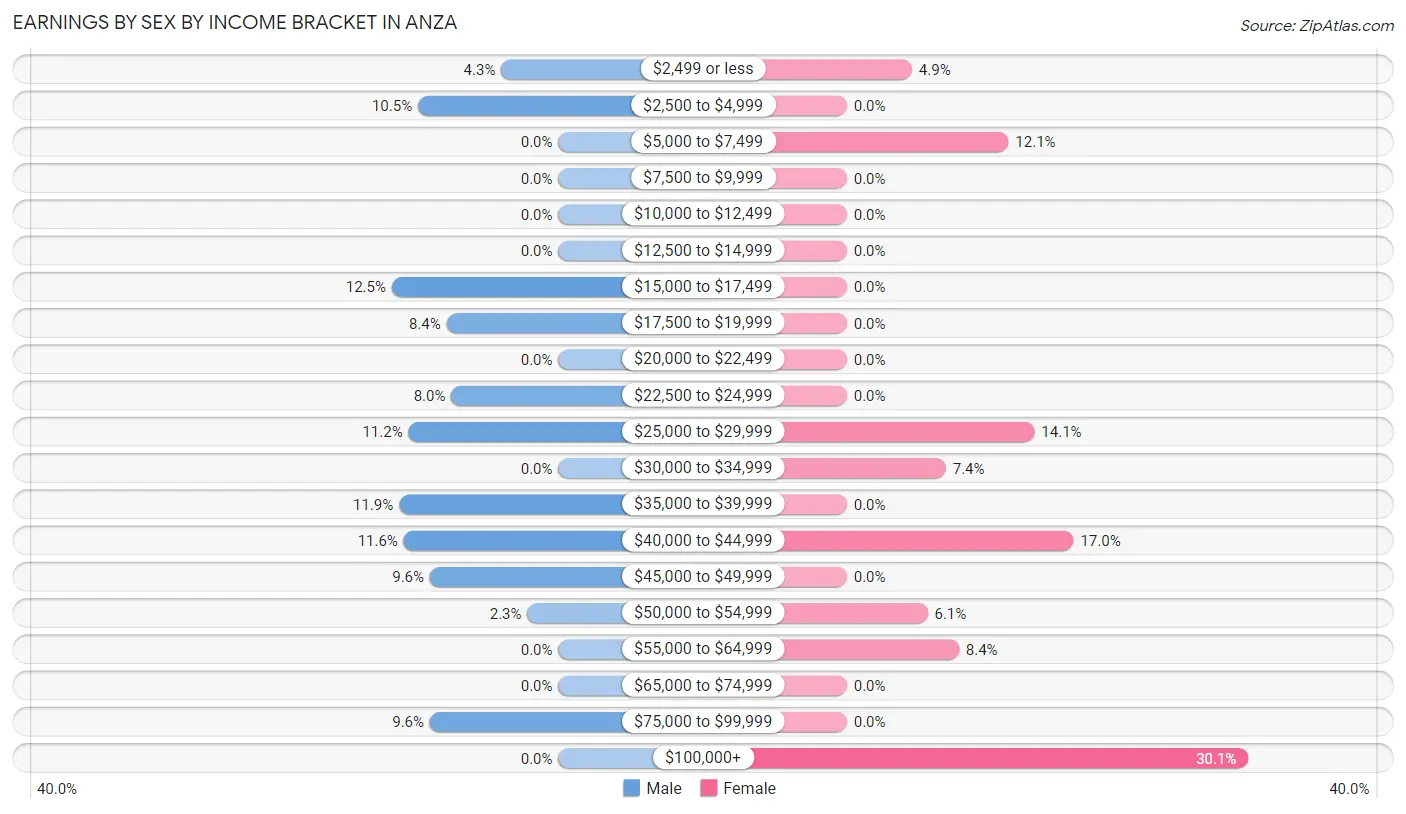
Earnings by Sex by Income Bracket in Anza
The most common earnings brackets in Anza are $15,000 to $17,499 for men (70 | 12.5%) and $100,000+ for women (154 | 30.1%).
| Income | Male | Female |
| $2,499 or less | 24 (4.3%) | 25 (4.9%) |
| $2,500 to $4,999 | 59 (10.5%) | 0 (0.0%) |
| $5,000 to $7,499 | 0 (0.0%) | 62 (12.1%) |
| $7,500 to $9,999 | 0 (0.0%) | 0 (0.0%) |
| $10,000 to $12,499 | 0 (0.0%) | 0 (0.0%) |
| $12,500 to $14,999 | 0 (0.0%) | 0 (0.0%) |
| $15,000 to $17,499 | 70 (12.5%) | 0 (0.0%) |
| $17,500 to $19,999 | 47 (8.4%) | 0 (0.0%) |
| $20,000 to $22,499 | 0 (0.0%) | 0 (0.0%) |
| $22,500 to $24,999 | 45 (8.0%) | 0 (0.0%) |
| $25,000 to $29,999 | 63 (11.2%) | 72 (14.1%) |
| $30,000 to $34,999 | 0 (0.0%) | 38 (7.4%) |
| $35,000 to $39,999 | 67 (11.9%) | 0 (0.0%) |
| $40,000 to $44,999 | 65 (11.6%) | 87 (17.0%) |
| $45,000 to $49,999 | 54 (9.6%) | 0 (0.0%) |
| $50,000 to $54,999 | 13 (2.3%) | 31 (6.0%) |
| $55,000 to $64,999 | 0 (0.0%) | 43 (8.4%) |
| $65,000 to $74,999 | 0 (0.0%) | 0 (0.0%) |
| $75,000 to $99,999 | 54 (9.6%) | 0 (0.0%) |
| $100,000+ | 0 (0.0%) | 154 (30.1%) |
| Total | 561 (100.0%) | 512 (100.0%) |
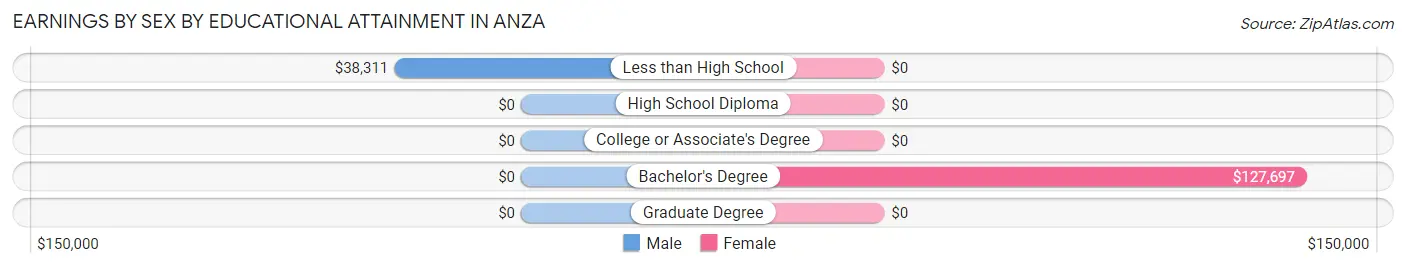
Earnings by Sex by Educational Attainment in Anza
| Educational Attainment | Male Income | Female Income |
| Less than High School | $38,311 | $0 |
| High School Diploma | - | - |
| College or Associate's Degree | - | - |
| Bachelor's Degree | - | - |
| Graduate Degree | - | - |
| Total | $29,187 | $0 |
Family Income in Anza
Family Income Brackets in Anza
According to the Anza family income data, there are 147 families falling into the $75,000 to $99,999 income range, which is the most common income bracket and makes up 39.6% of all families.
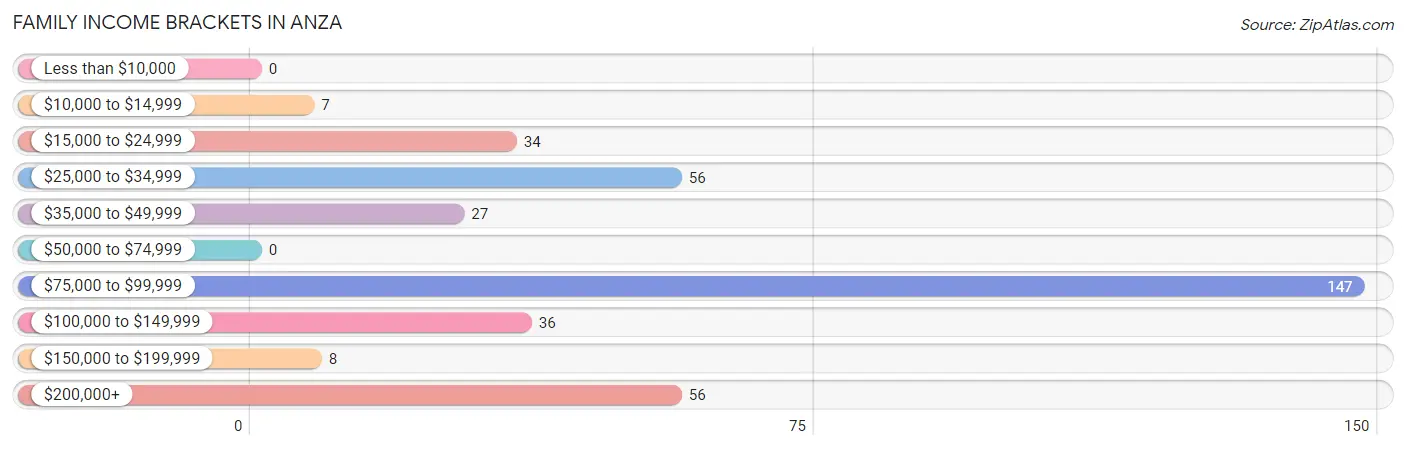
| Income Bracket | # Families | % Families |
| Less than $10,000 | 0 | 0.0% |
| $10,000 to $14,999 | 7 | 1.9% |
| $15,000 to $24,999 | 34 | 9.2% |
| $25,000 to $34,999 | 56 | 15.1% |
| $35,000 to $49,999 | 27 | 7.3% |
| $50,000 to $74,999 | 0 | 0.0% |
| $75,000 to $99,999 | 147 | 39.6% |
| $100,000 to $149,999 | 36 | 9.7% |
| $150,000 to $199,999 | 8 | 2.2% |
| $200,000+ | 56 | 15.1% |
Family Income by Famaliy Size in Anza
2-person families (132 | 35.6%) account for the highest median family income in Anza with $40,648 per family, while 2-person families (132 | 35.6%) have the highest median income of $20,324 per family member.
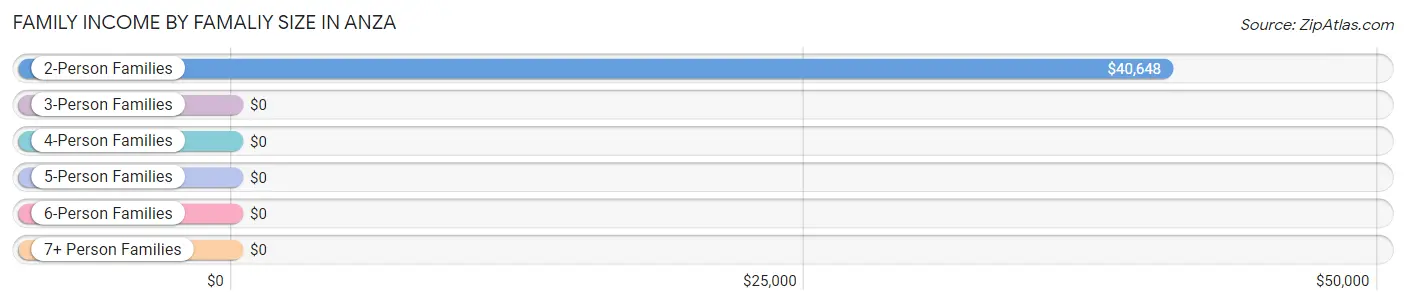
| Income Bracket | # Families | Median Income |
| 2-Person Families | 132 (35.6%) | $40,648 |
| 3-Person Families | 93 (25.1%) | $0 |
| 4-Person Families | 93 (25.1%) | $0 |
| 5-Person Families | 0 (0.0%) | $0 |
| 6-Person Families | 53 (14.3%) | $0 |
| 7+ Person Families | 0 (0.0%) | $0 |
| Total | 371 (100.0%) | $90,986 |
Family Income by Number of Earners in Anza
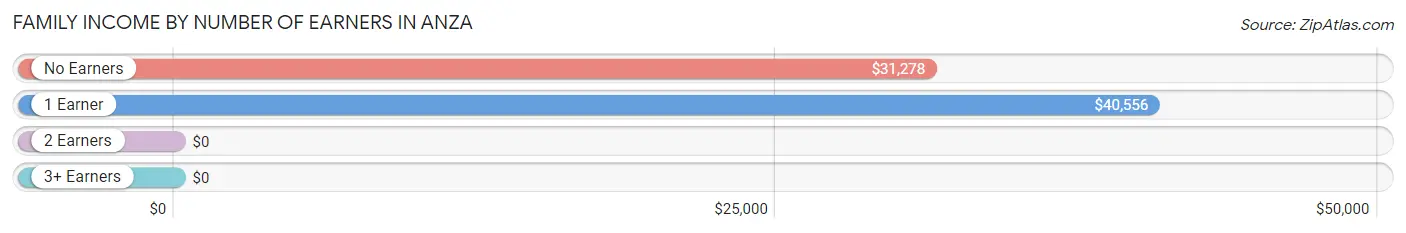
| Number of Earners | # Families | Median Income |
| No Earners | 60 (16.2%) | $31,278 |
| 1 Earner | 102 (27.5%) | $40,556 |
| 2 Earners | 148 (39.9%) | $0 |
| 3+ Earners | 61 (16.4%) | $0 |
| Total | 371 (100.0%) | $90,986 |
Household Income in Anza
Household Income Brackets in Anza
With 129 households falling in the category, the $75,000 to $99,999 income range is the most frequent in Anza, accounting for 17.2% of all households. In contrast, only 7 households (0.9%) fall into the $10,000 to $14,999 income bracket, making it the least populous group.
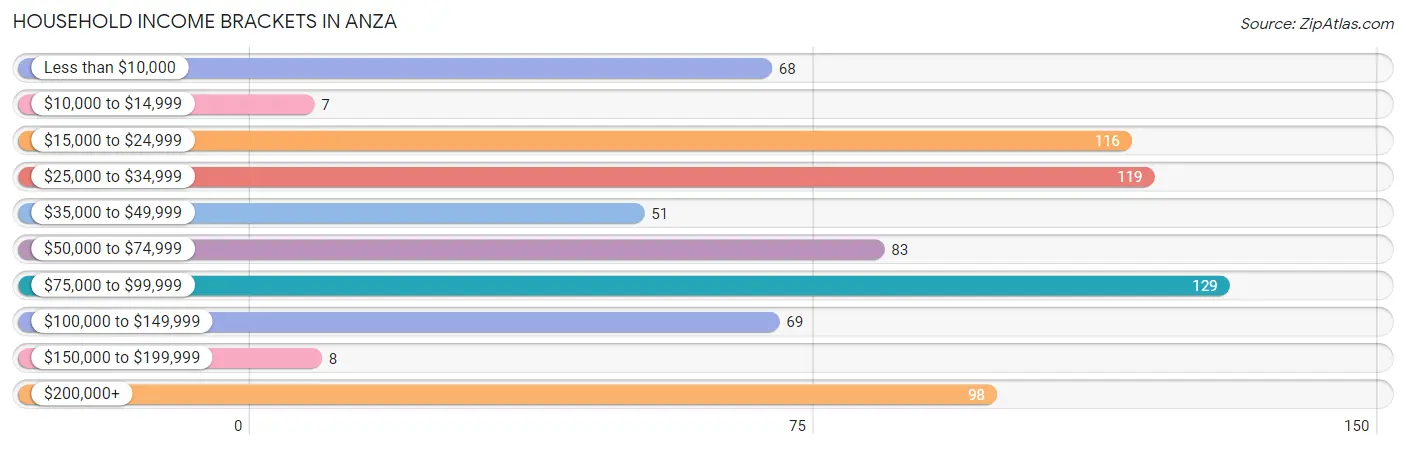
| Income Bracket | # Households | % Households |
| Less than $10,000 | 68 | 9.1% |
| $10,000 to $14,999 | 7 | 0.9% |
| $15,000 to $24,999 | 116 | 15.5% |
| $25,000 to $34,999 | 119 | 15.9% |
| $35,000 to $49,999 | 51 | 6.8% |
| $50,000 to $74,999 | 83 | 11.1% |
| $75,000 to $99,999 | 129 | 17.2% |
| $100,000 to $149,999 | 69 | 9.2% |
| $150,000 to $199,999 | 8 | 1.1% |
| $200,000+ | 98 | 13.1% |
Household Income by Householder Age in Anza
The median household income in Anza is $50,956, with the highest median household income of $41,852 found in the 65+ years age bracket for the primary householder. A total of 204 households (27.3%) fall into this category. Meanwhile, the 15 to 24 years age bracket for the primary householder has the lowest median household income of $0, with 31 households (4.1%) in this group.
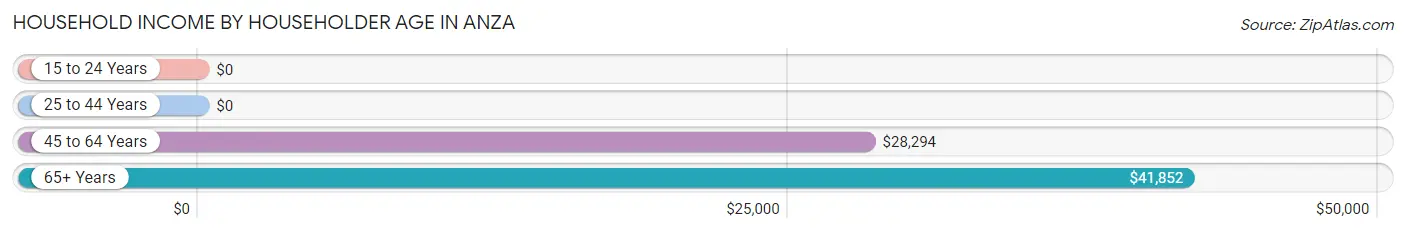
| Income Bracket | # Households | Median Income |
| 15 to 24 Years | 31 (4.1%) | $0 |
| 25 to 44 Years | 143 (19.1%) | $0 |
| 45 to 64 Years | 370 (49.5%) | $28,294 |
| 65+ Years | 204 (27.3%) | $41,852 |
| Total | 748 (100.0%) | $50,956 |
Poverty in Anza
Income Below Poverty by Sex and Age in Anza
With 6.9% poverty level for males and 9.6% for females among the residents of Anza, 75 year old and over males and 45 to 54 year old females are the most vulnerable to poverty, with 9 males (19.2%) and 49 females (49.5%) in their respective age groups living below the poverty level.
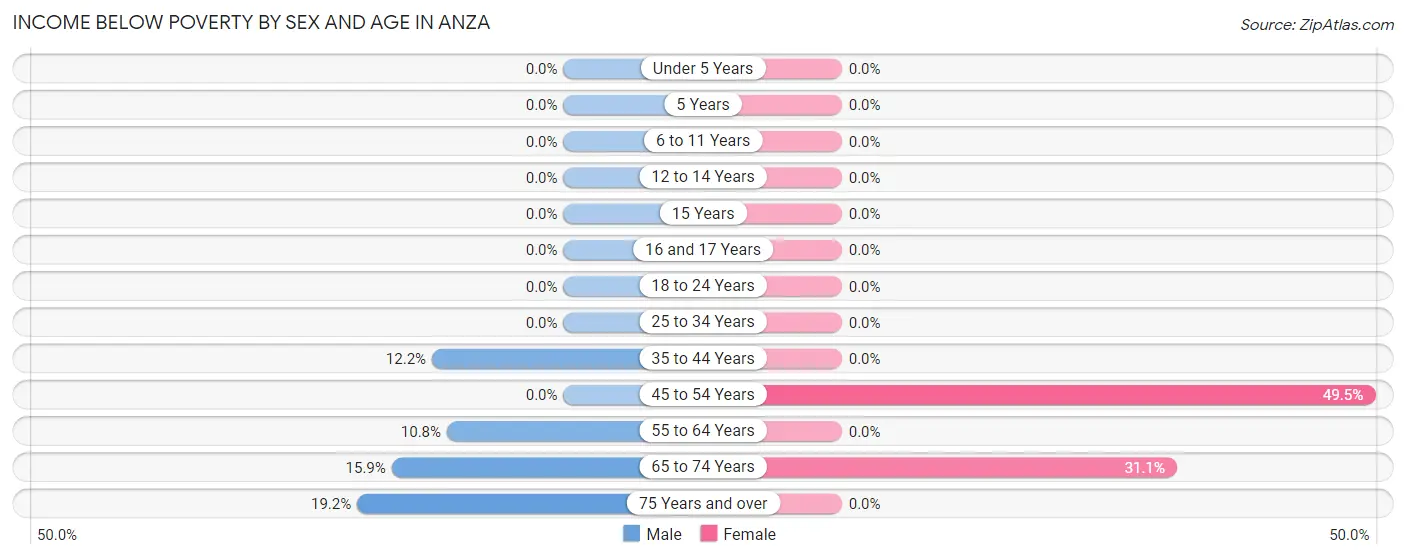
| Age Bracket | Male | Female |
| Under 5 Years | 0 (0.0%) | 0 (0.0%) |
| 5 Years | 0 (0.0%) | 0 (0.0%) |
| 6 to 11 Years | 0 (0.0%) | 0 (0.0%) |
| 12 to 14 Years | 0 (0.0%) | 0 (0.0%) |
| 15 Years | 0 (0.0%) | 0 (0.0%) |
| 16 and 17 Years | 0 (0.0%) | 0 (0.0%) |
| 18 to 24 Years | 0 (0.0%) | 0 (0.0%) |
| 25 to 34 Years | 0 (0.0%) | 0 (0.0%) |
| 35 to 44 Years | 15 (12.2%) | 0 (0.0%) |
| 45 to 54 Years | 0 (0.0%) | 49 (49.5%) |
| 55 to 64 Years | 32 (10.8%) | 0 (0.0%) |
| 65 to 74 Years | 11 (15.9%) | 46 (31.1%) |
| 75 Years and over | 9 (19.2%) | 0 (0.0%) |
| Total | 67 (6.9%) | 95 (9.6%) |
Income Above Poverty by Sex and Age in Anza
According to the poverty statistics in Anza, males aged under 5 years and females aged 6 to 11 years are the age groups that are most secure financially, with 100.0% of males and 100.0% of females in these age groups living above the poverty line.
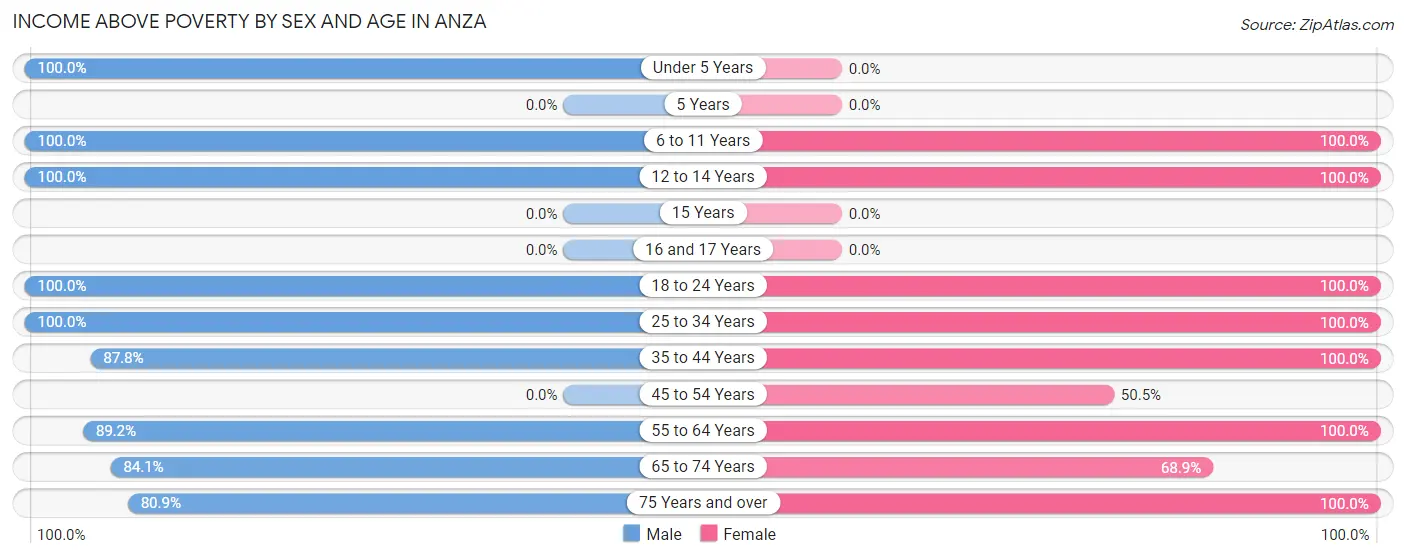
| Age Bracket | Male | Female |
| Under 5 Years | 99 (100.0%) | 0 (0.0%) |
| 5 Years | 0 (0.0%) | 0 (0.0%) |
| 6 to 11 Years | 152 (100.0%) | 118 (100.0%) |
| 12 to 14 Years | 12 (100.0%) | 58 (100.0%) |
| 15 Years | 0 (0.0%) | 0 (0.0%) |
| 16 and 17 Years | 0 (0.0%) | 0 (0.0%) |
| 18 to 24 Years | 93 (100.0%) | 145 (100.0%) |
| 25 to 34 Years | 79 (100.0%) | 87 (100.0%) |
| 35 to 44 Years | 108 (87.8%) | 97 (100.0%) |
| 45 to 54 Years | 0 (0.0%) | 50 (50.5%) |
| 55 to 64 Years | 264 (89.2%) | 113 (100.0%) |
| 65 to 74 Years | 58 (84.1%) | 102 (68.9%) |
| 75 Years and over | 38 (80.8%) | 124 (100.0%) |
| Total | 903 (93.1%) | 894 (90.4%) |
Income Below Poverty Among Married-Couple Families in Anza
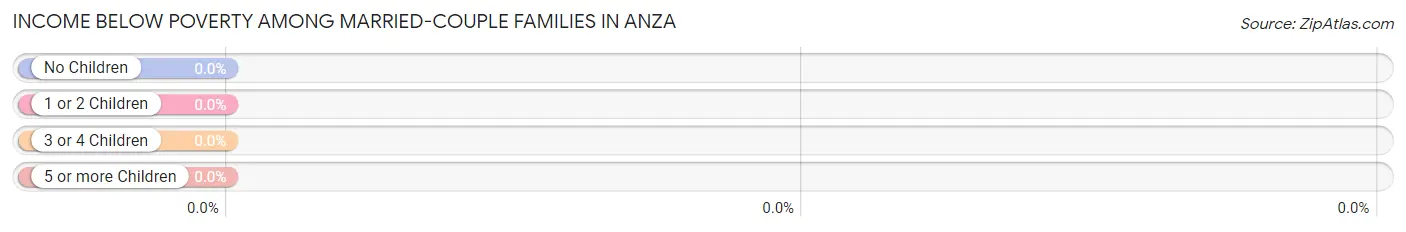
| Children | Above Poverty | Below Poverty |
| No Children | 128 (100.0%) | 0 (0.0%) |
| 1 or 2 Children | 87 (100.0%) | 0 (0.0%) |
| 3 or 4 Children | 53 (100.0%) | 0 (0.0%) |
| 5 or more Children | 0 (0.0%) | 0 (0.0%) |
| Total | 268 (100.0%) | 0 (0.0%) |
Income Below Poverty Among Single-Parent Households in Anza
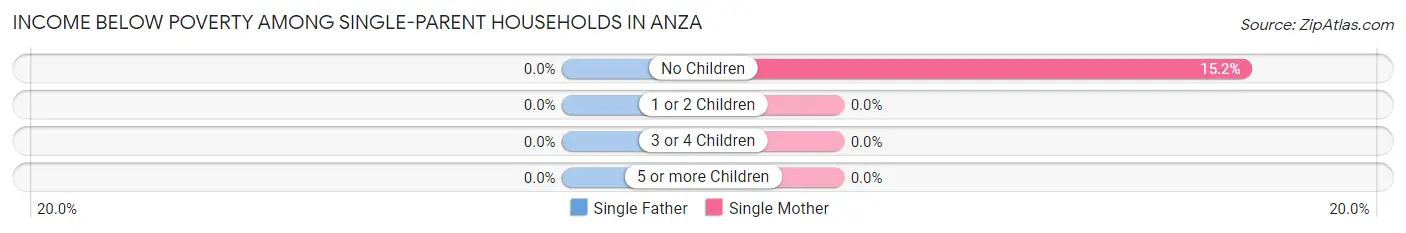
| Children | Single Father | Single Mother |
| No Children | 0 (0.0%) | 7 (15.2%) |
| 1 or 2 Children | 0 (0.0%) | 0 (0.0%) |
| 3 or 4 Children | 0 (0.0%) | 0 (0.0%) |
| 5 or more Children | 0 (0.0%) | 0 (0.0%) |
| Total | 0 (0.0%) | 7 (12.1%) |
Income Below Poverty Among Married-Couple vs Single-Parent Households in Anza
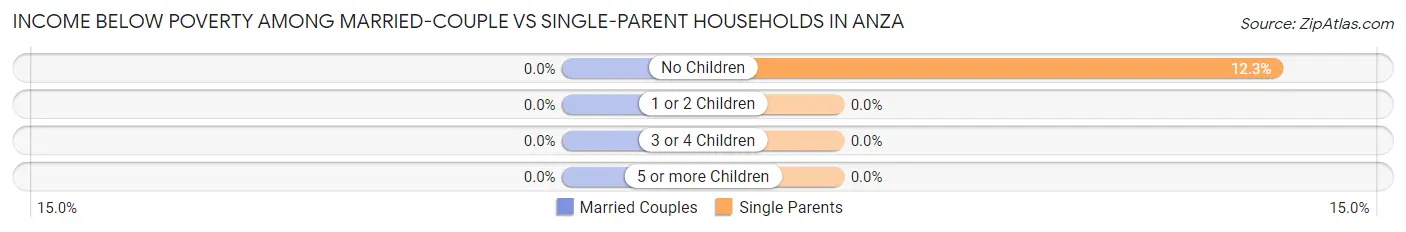
| Children | Married-Couple Families | Single-Parent Households |
| No Children | 0 (0.0%) | 7 (12.3%) |
| 1 or 2 Children | 0 (0.0%) | 0 (0.0%) |
| 3 or 4 Children | 0 (0.0%) | 0 (0.0%) |
| 5 or more Children | 0 (0.0%) | 0 (0.0%) |
| Total | 0 (0.0%) | 7 (6.8%) |
Race in Anza
The most populous races in Anza are White / Caucasian (1,466 | 74.8%), Hispanic or Latino (361 | 18.4%), and Asian (275 | 14.0%).
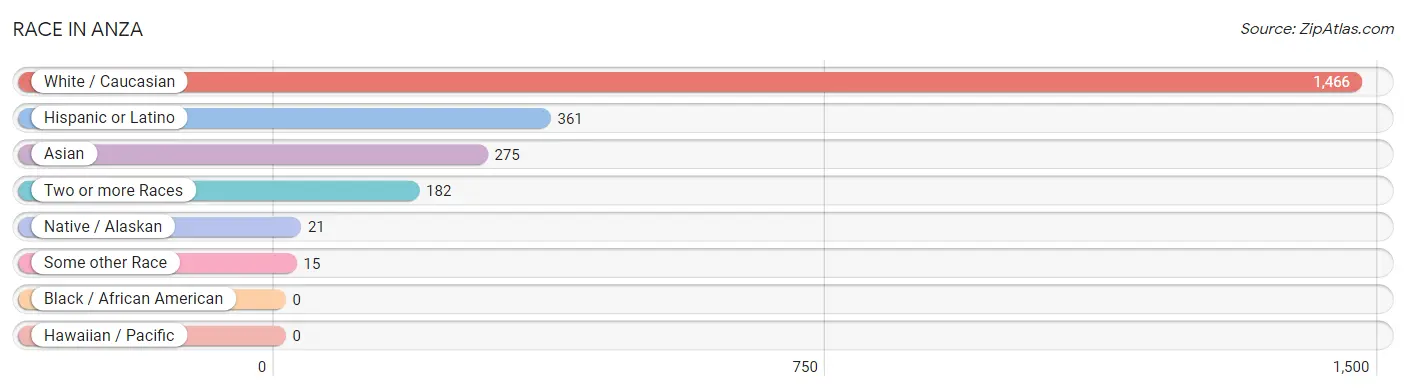
| Race | # Population | % Population |
| Asian | 275 | 14.0% |
| Black / African American | 0 | 0.0% |
| Hawaiian / Pacific | 0 | 0.0% |
| Hispanic or Latino | 361 | 18.4% |
| Native / Alaskan | 21 | 1.1% |
| White / Caucasian | 1,466 | 74.8% |
| Two or more Races | 182 | 9.3% |
| Some other Race | 15 | 0.8% |
| Total | 1,959 | 100.0% |
Ancestry in Anza
The most populous ancestries reported in Anza are Mexican (361 | 18.4%), Norwegian (283 | 14.4%), German (230 | 11.7%), French (169 | 8.6%), and Sri Lankan (164 | 8.4%), together accounting for 61.6% of all Anza residents.
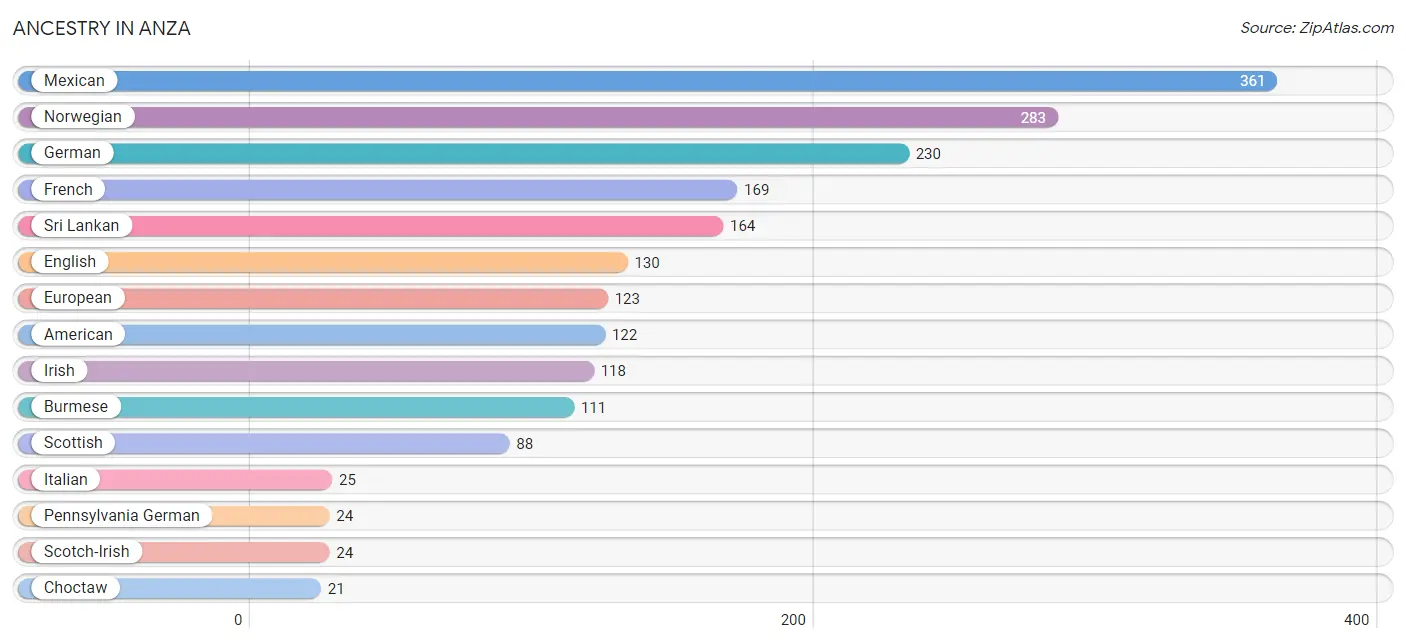
| Ancestry | # Population | % Population |
| American | 122 | 6.2% |
| British | 19 | 1.0% |
| Burmese | 111 | 5.7% |
| Choctaw | 21 | 1.1% |
| Danish | 11 | 0.6% |
| Dutch | 16 | 0.8% |
| English | 130 | 6.6% |
| European | 123 | 6.3% |
| French | 169 | 8.6% |
| German | 230 | 11.7% |
| Irish | 118 | 6.0% |
| Italian | 25 | 1.3% |
| Mexican | 361 | 18.4% |
| Norwegian | 283 | 14.4% |
| Pennsylvania German | 24 | 1.2% |
| Scotch-Irish | 24 | 1.2% |
| Scottish | 88 | 4.5% |
| Sri Lankan | 164 | 8.4% | View All 18 Rows |
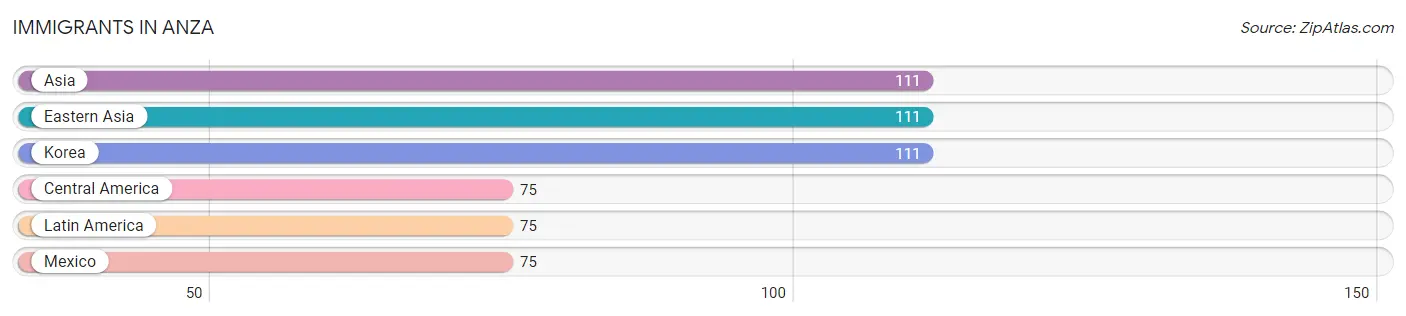
Immigrants in Anza
The most numerous immigrant groups reported in Anza came from Asia (111 | 5.7%), Eastern Asia (111 | 5.7%), Korea (111 | 5.7%), Central America (75 | 3.8%), and Latin America (75 | 3.8%), together accounting for 24.7% of all Anza residents.
| Immigration Origin | # Population | % Population |
| Asia | 111 | 5.7% |
| Central America | 75 | 3.8% |
| Eastern Asia | 111 | 5.7% |
| Korea | 111 | 5.7% |
| Latin America | 75 | 3.8% |
| Mexico | 75 | 3.8% | View All 6 Rows |
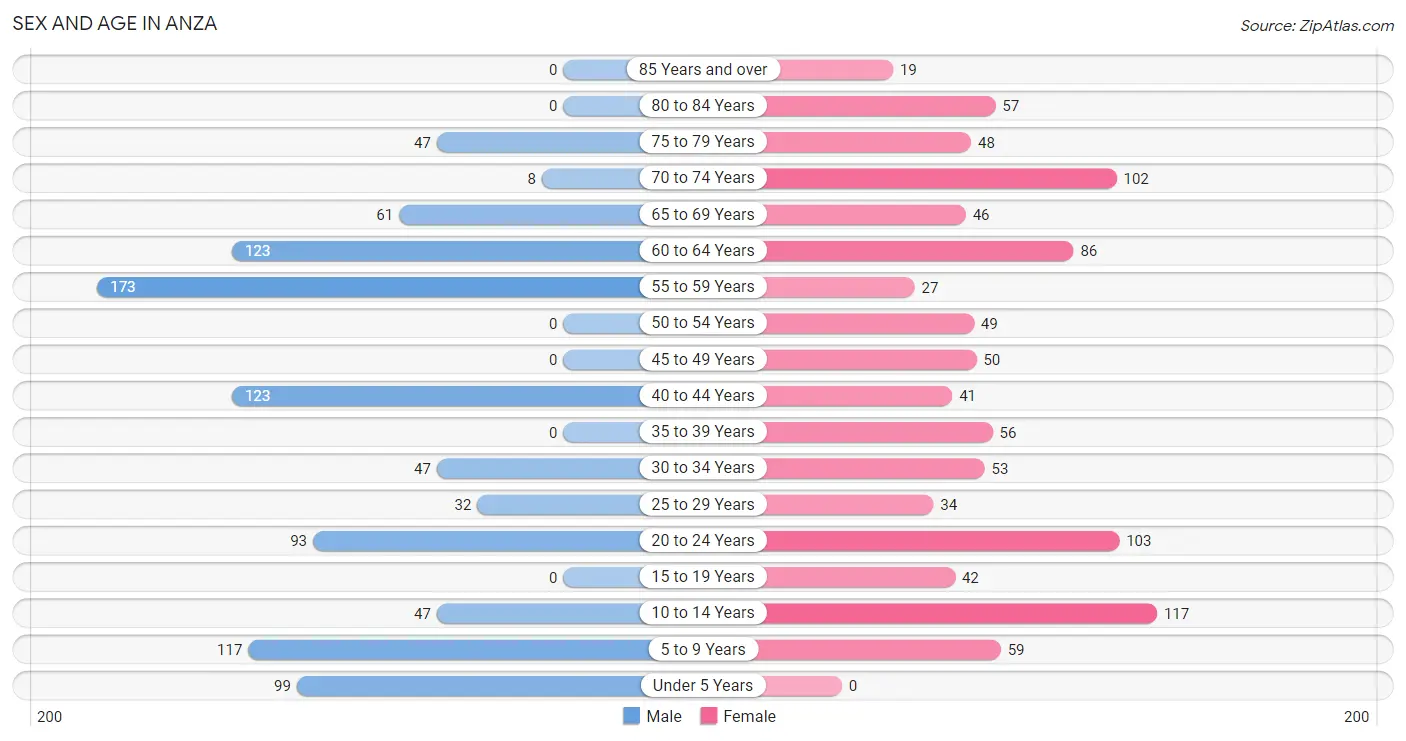
Sex and Age in Anza
Sex and Age in Anza
The most populous age groups in Anza are 55 to 59 Years (173 | 17.8%) for men and 10 to 14 Years (117 | 11.8%) for women.
| Age Bracket | Male | Female |
| Under 5 Years | 99 (10.2%) | 0 (0.0%) |
| 5 to 9 Years | 117 (12.1%) | 59 (6.0%) |
| 10 to 14 Years | 47 (4.9%) | 117 (11.8%) |
| 15 to 19 Years | 0 (0.0%) | 42 (4.3%) |
| 20 to 24 Years | 93 (9.6%) | 103 (10.4%) |
| 25 to 29 Years | 32 (3.3%) | 34 (3.4%) |
| 30 to 34 Years | 47 (4.9%) | 53 (5.4%) |
| 35 to 39 Years | 0 (0.0%) | 56 (5.7%) |
| 40 to 44 Years | 123 (12.7%) | 41 (4.2%) |
| 45 to 49 Years | 0 (0.0%) | 50 (5.1%) |
| 50 to 54 Years | 0 (0.0%) | 49 (5.0%) |
| 55 to 59 Years | 173 (17.8%) | 27 (2.7%) |
| 60 to 64 Years | 123 (12.7%) | 86 (8.7%) |
| 65 to 69 Years | 61 (6.3%) | 46 (4.6%) |
| 70 to 74 Years | 8 (0.8%) | 102 (10.3%) |
| 75 to 79 Years | 47 (4.9%) | 48 (4.9%) |
| 80 to 84 Years | 0 (0.0%) | 57 (5.8%) |
| 85 Years and over | 0 (0.0%) | 19 (1.9%) |
| Total | 970 (100.0%) | 989 (100.0%) |
Families and Households in Anza
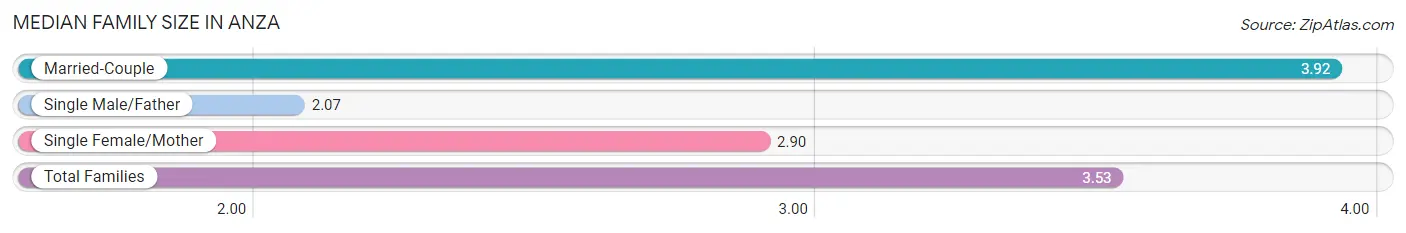
Median Family Size in Anza
The median family size in Anza is 3.53 persons per family, with married-couple families (268 | 72.2%) accounting for the largest median family size of 3.92 persons per family. On the other hand, single male/father families (45 | 12.1%) represent the smallest median family size with 2.07 persons per family.
| Family Type | # Families | Family Size |
| Married-Couple | 268 (72.2%) | 3.92 |
| Single Male/Father | 45 (12.1%) | 2.07 |
| Single Female/Mother | 58 (15.6%) | 2.90 |
| Total Families | 371 (100.0%) | 3.53 |
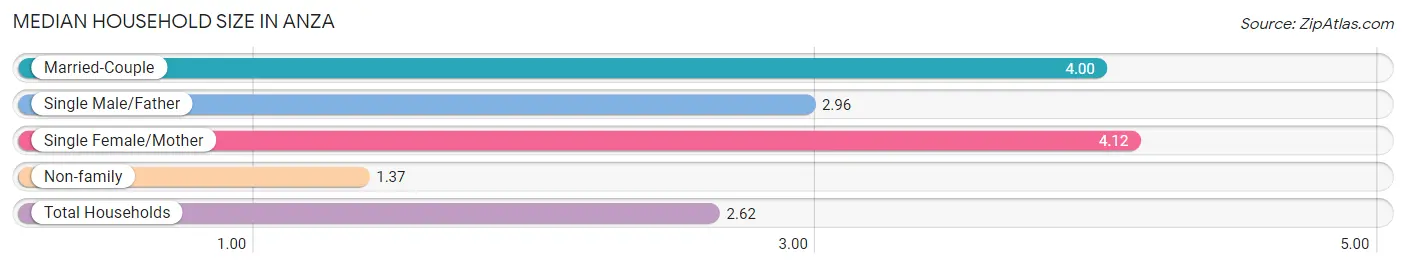
Median Household Size in Anza
The median household size in Anza is 2.62 persons per household, with single female/mother households (58 | 7.7%) accounting for the largest median household size of 4.12 persons per household. non-family households (377 | 50.4%) represent the smallest median household size with 1.37 persons per household.
| Household Type | # Households | Household Size |
| Married-Couple | 268 (35.8%) | 4.00 |
| Single Male/Father | 45 (6.0%) | 2.96 |
| Single Female/Mother | 58 (7.7%) | 4.12 |
| Non-family | 377 (50.4%) | 1.37 |
| Total Households | 748 (100.0%) | 2.62 |
Household Size by Marriage Status in Anza
Out of a total of 748 households in Anza, 371 (49.6%) are family households, while 377 (50.4%) are nonfamily households. The most numerous type of family households are 3-person households, comprising 133, and the most common type of nonfamily households are 1-person households, comprising 261.
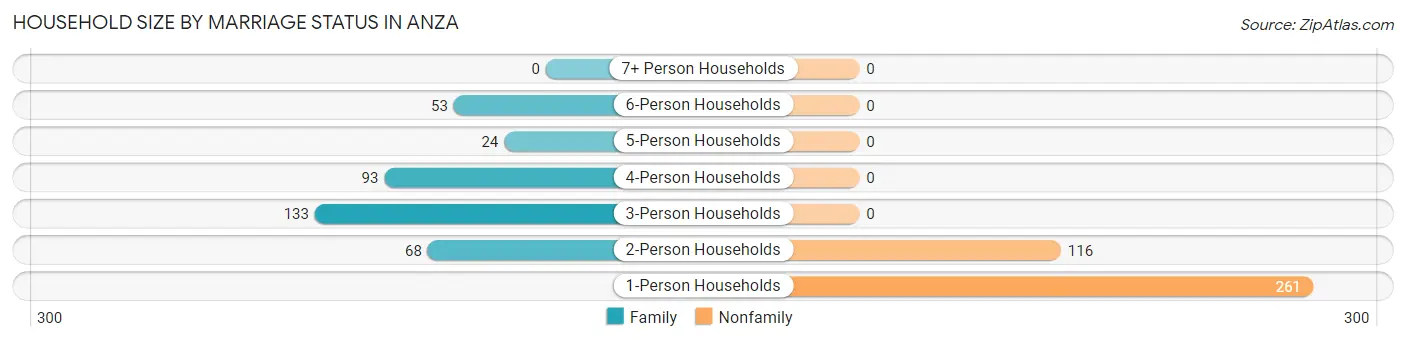
| Household Size | Family Households | Nonfamily Households |
| 1-Person Households | - | 261 (34.9%) |
| 2-Person Households | 68 (9.1%) | 116 (15.5%) |
| 3-Person Households | 133 (17.8%) | 0 (0.0%) |
| 4-Person Households | 93 (12.4%) | 0 (0.0%) |
| 5-Person Households | 24 (3.2%) | 0 (0.0%) |
| 6-Person Households | 53 (7.1%) | 0 (0.0%) |
| 7+ Person Households | 0 (0.0%) | 0 (0.0%) |
| Total | 371 (49.6%) | 377 (50.4%) |
Female Fertility in Anza
Fertility by Age in Anza
Average fertility rate in Anza is 82.0 births per 1,000 women. Women in the age bracket of 20 to 34 years have the highest fertility rate with 163.0 births per 1,000 women. Women in the age bracket of 20 to 34 years acount for 100.0% of all women with births.
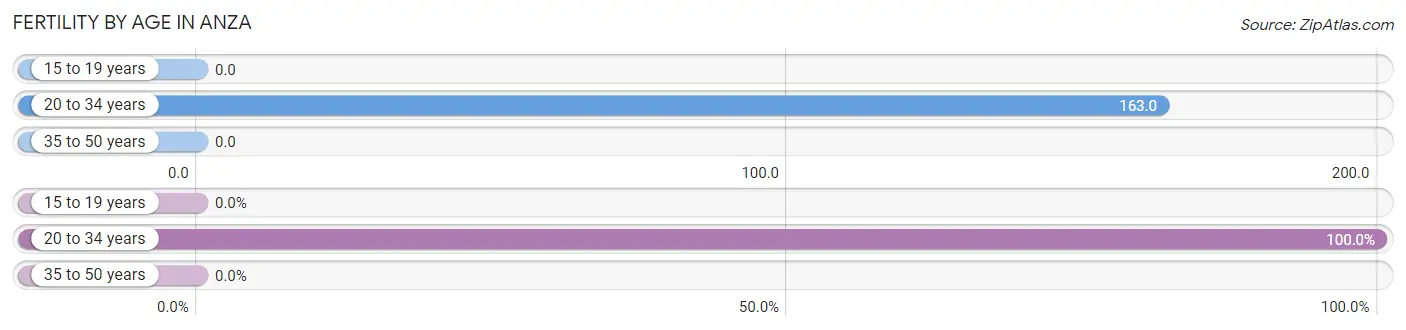
| Age Bracket | Women with Births | Births / 1,000 Women |
| 15 to 19 years | 0 (0.0%) | 0.0 |
| 20 to 34 years | 31 (100.0%) | 163.0 |
| 35 to 50 years | 0 (0.0%) | 0.0 |
| Total | 31 (100.0%) | 82.0 |
Fertility by Age by Marriage Status in Anza
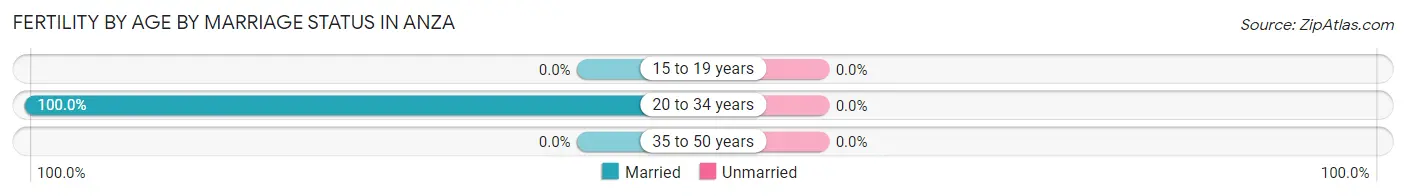
| Age Bracket | Married | Unmarried |
| 15 to 19 years | 0 (0.0%) | 0 (0.0%) |
| 20 to 34 years | 31 (100.0%) | 0 (0.0%) |
| 35 to 50 years | 0 (0.0%) | 0 (0.0%) |
| Total | 31 (100.0%) | 0 (0.0%) |
Fertility by Education in Anza
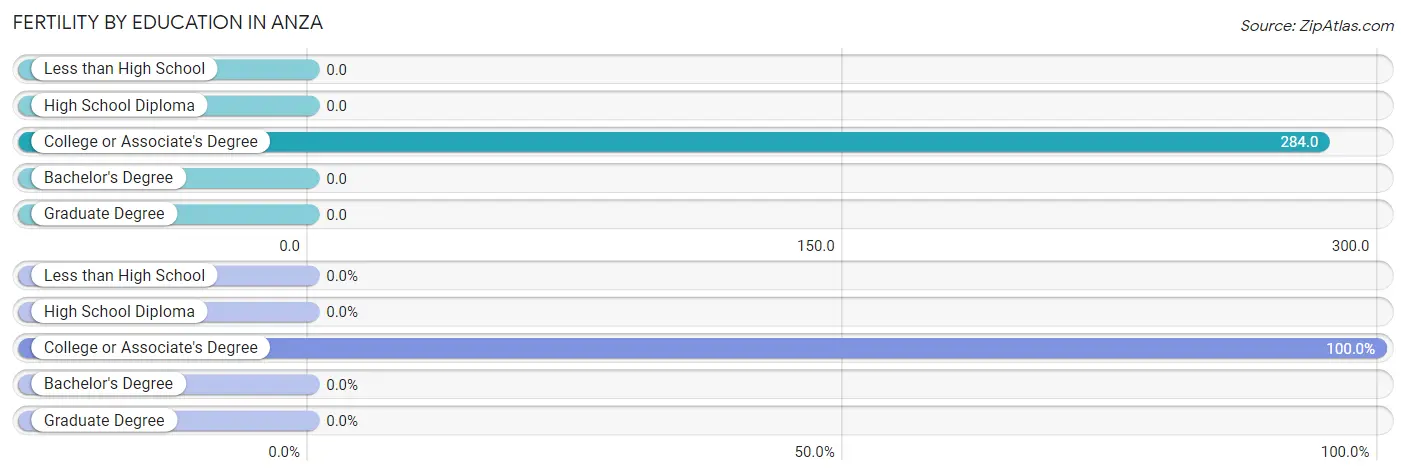
| Educational Attainment | Women with Births | Births / 1,000 Women |
| Less than High School | 0 (0.0%) | 0.0 |
| High School Diploma | 0 (0.0%) | 0.0 |
| College or Associate's Degree | 31 (100.0%) | 284.0 |
| Bachelor's Degree | 0 (0.0%) | 0.0 |
| Graduate Degree | 0 (0.0%) | 0.0 |
| Total | 31 (100.0%) | 82.0 |
Fertility by Education by Marriage Status in Anza
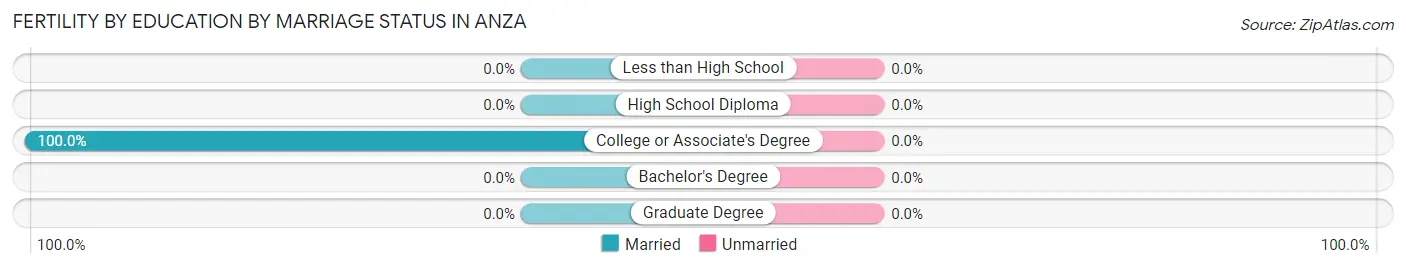
| Educational Attainment | Married | Unmarried |
| Less than High School | 0 (0.0%) | 0 (0.0%) |
| High School Diploma | 0 (0.0%) | 0 (0.0%) |
| College or Associate's Degree | 31 (100.0%) | 0 (0.0%) |
| Bachelor's Degree | 0 (0.0%) | 0 (0.0%) |
| Graduate Degree | 0 (0.0%) | 0 (0.0%) |
| Total | 31 (100.0%) | 0 (0.0%) |
Employment Characteristics in Anza
Employment by Class of Employer in Anza
Among the 887 employed individuals in Anza, private company employees (527 | 59.4%), self-employed (not incorporated) (220 | 24.8%), and not-for-profit organizations (71 | 8.0%) make up the most common classes of employment.
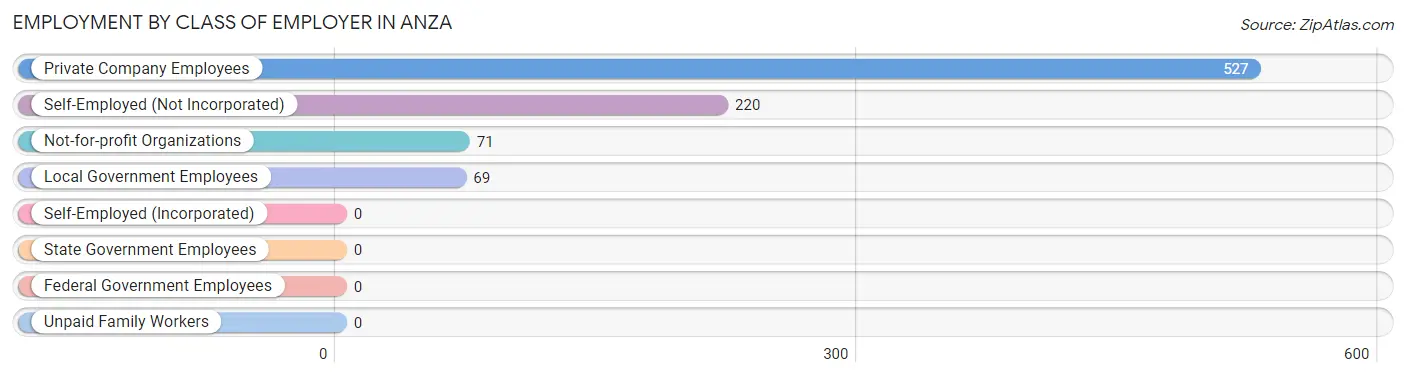
| Employer Class | # Employees | % Employees |
| Private Company Employees | 527 | 59.4% |
| Self-Employed (Incorporated) | 0 | 0.0% |
| Self-Employed (Not Incorporated) | 220 | 24.8% |
| Not-for-profit Organizations | 71 | 8.0% |
| Local Government Employees | 69 | 7.8% |
| State Government Employees | 0 | 0.0% |
| Federal Government Employees | 0 | 0.0% |
| Unpaid Family Workers | 0 | 0.0% |
| Total | 887 | 100.0% |
Employment Status by Age in Anza
According to the labor force statistics for Anza, out of the total population over 16 years of age (1,520), 65.1% or 990 individuals are in the labor force, with 10.3% or 102 of them unemployed. The age group with the highest labor force participation rate is 16 to 19 years, with 100.0% or 42 individuals in the labor force. Within the labor force, the 16 to 19 years age range has the highest percentage of unemployed individuals, with 100.0% or 42 of them being unemployed.
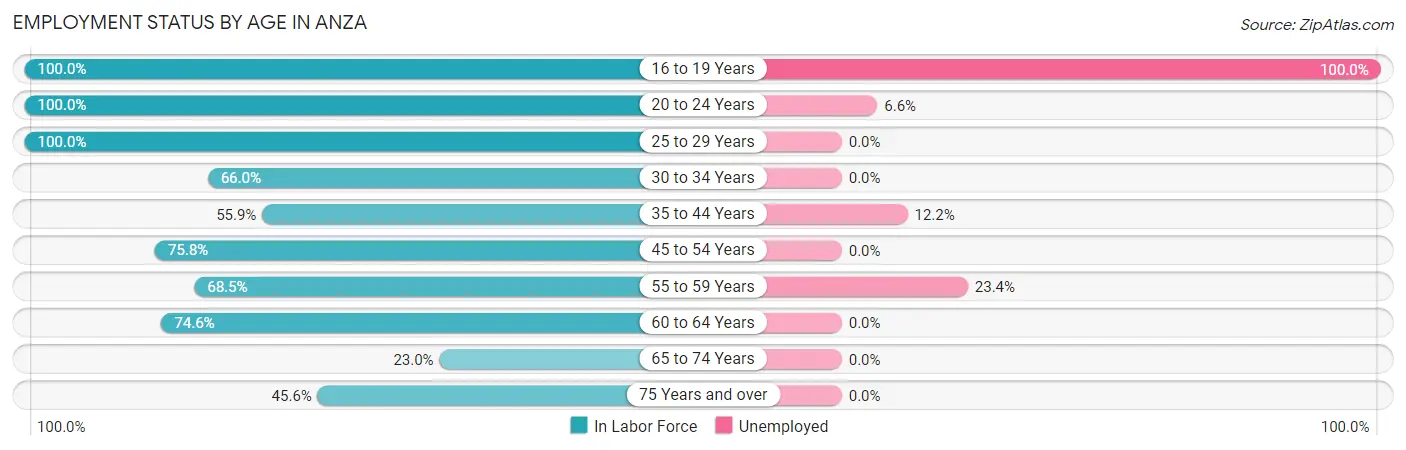
| Age Bracket | In Labor Force | Unemployed |
| 16 to 19 Years | 42 (100.0%) | 42 (100.0%) |
| 20 to 24 Years | 196 (100.0%) | 13 (6.6%) |
| 25 to 29 Years | 66 (100.0%) | 0 (0.0%) |
| 30 to 34 Years | 66 (66.0%) | 0 (0.0%) |
| 35 to 44 Years | 123 (55.9%) | 15 (12.2%) |
| 45 to 54 Years | 75 (75.8%) | 0 (0.0%) |
| 55 to 59 Years | 137 (68.5%) | 32 (23.4%) |
| 60 to 64 Years | 156 (74.6%) | 0 (0.0%) |
| 65 to 74 Years | 50 (23.0%) | 0 (0.0%) |
| 75 Years and over | 78 (45.6%) | 0 (0.0%) |
| Total | 990 (65.1%) | 102 (10.3%) |
Employment Status by Educational Attainment in Anza
According to labor force statistics for Anza, 69.7% of individuals (623) out of the total population between 25 and 64 years of age (894) are in the labor force, with 7.5% or 47 of them being unemployed. The group with the highest labor force participation rate are those with the educational attainment of high school diploma, with 100.0% or 186 individuals in the labor force. Within the labor force, individuals with high school diploma education have the highest percentage of unemployment, with 17.2% or 32 of them being unemployed.
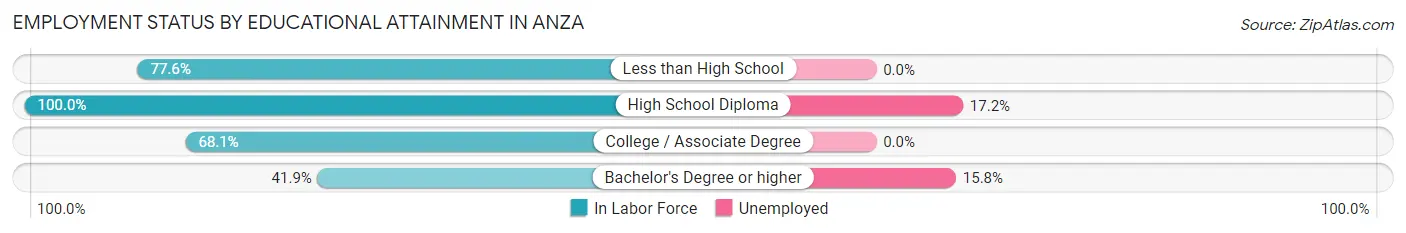
| Educational Attainment | In Labor Force | Unemployed |
| Less than High School | 118 (77.6%) | 0 (0.0%) |
| High School Diploma | 186 (100.0%) | 32 (17.2%) |
| College / Associate Degree | 224 (68.1%) | 0 (0.0%) |
| Bachelor's Degree or higher | 95 (41.9%) | 36 (15.8%) |
| Total | 623 (69.7%) | 67 (7.5%) |
Employment Occupations by Sex in Anza
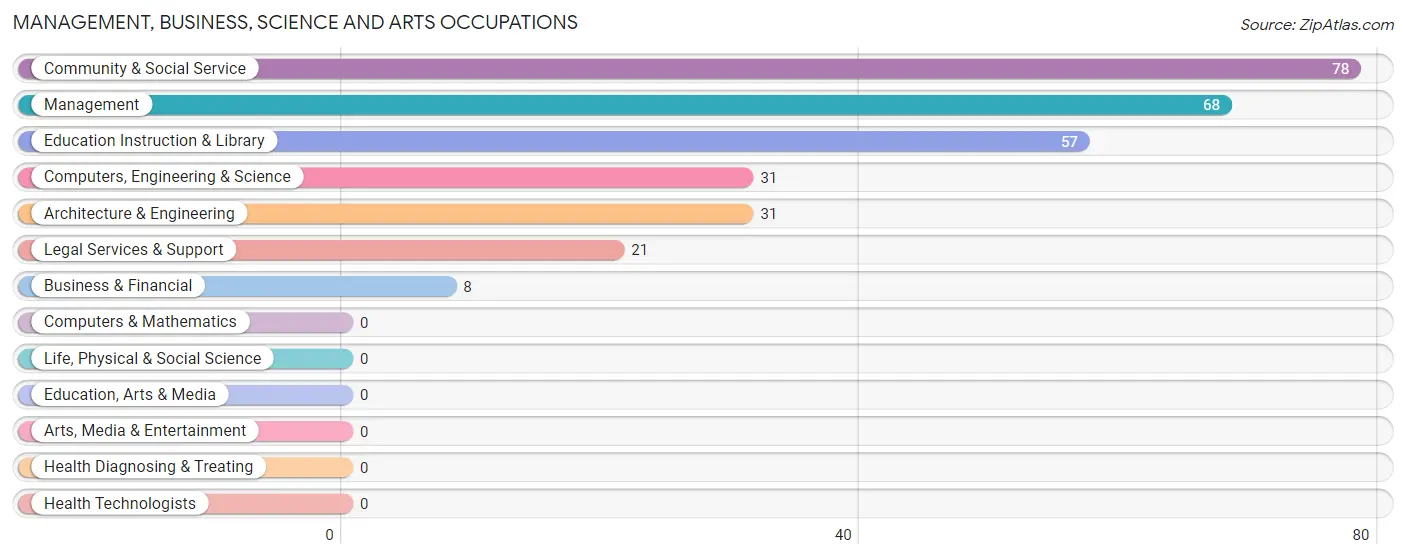
Management, Business, Science and Arts Occupations
The most common Management, Business, Science and Arts occupations in Anza are Community & Social Service (78 | 8.8%), Management (68 | 7.7%), Education Instruction & Library (57 | 6.4%), Computers, Engineering & Science (31 | 3.5%), and Architecture & Engineering (31 | 3.5%).
Management, Business, Science and Arts Occupations by Sex
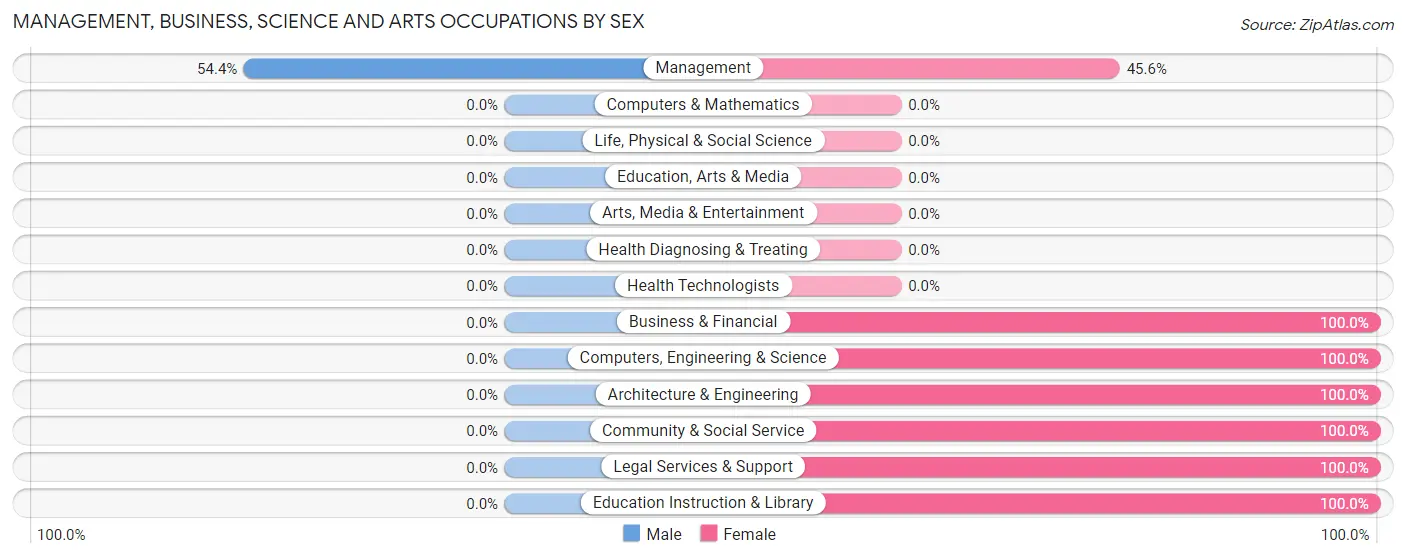
| Occupation | Male | Female |
| Management | 37 (54.4%) | 31 (45.6%) |
| Business & Financial | 0 (0.0%) | 8 (100.0%) |
| Computers, Engineering & Science | 0 (0.0%) | 31 (100.0%) |
| Computers & Mathematics | 0 (0.0%) | 0 (0.0%) |
| Architecture & Engineering | 0 (0.0%) | 31 (100.0%) |
| Life, Physical & Social Science | 0 (0.0%) | 0 (0.0%) |
| Community & Social Service | 0 (0.0%) | 78 (100.0%) |
| Education, Arts & Media | 0 (0.0%) | 0 (0.0%) |
| Legal Services & Support | 0 (0.0%) | 21 (100.0%) |
| Education Instruction & Library | 0 (0.0%) | 57 (100.0%) |
| Arts, Media & Entertainment | 0 (0.0%) | 0 (0.0%) |
| Health Diagnosing & Treating | 0 (0.0%) | 0 (0.0%) |
| Health Technologists | 0 (0.0%) | 0 (0.0%) |
| Total (Category) | 37 (20.0%) | 148 (80.0%) |
| Total (Overall) | 431 (48.6%) | 456 (51.4%) |
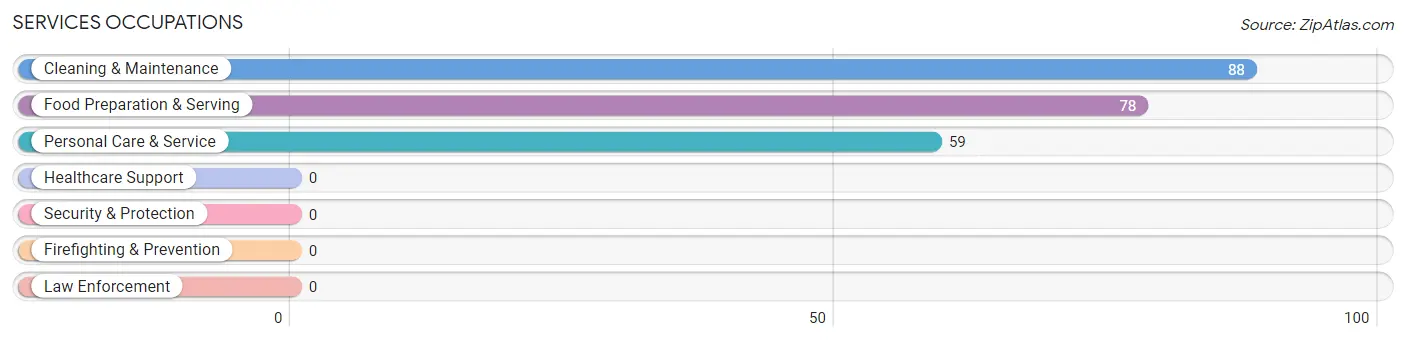
Services Occupations
The most common Services occupations in Anza are Cleaning & Maintenance (88 | 9.9%), Food Preparation & Serving (78 | 8.8%), and Personal Care & Service (59 | 6.7%).
Services Occupations by Sex
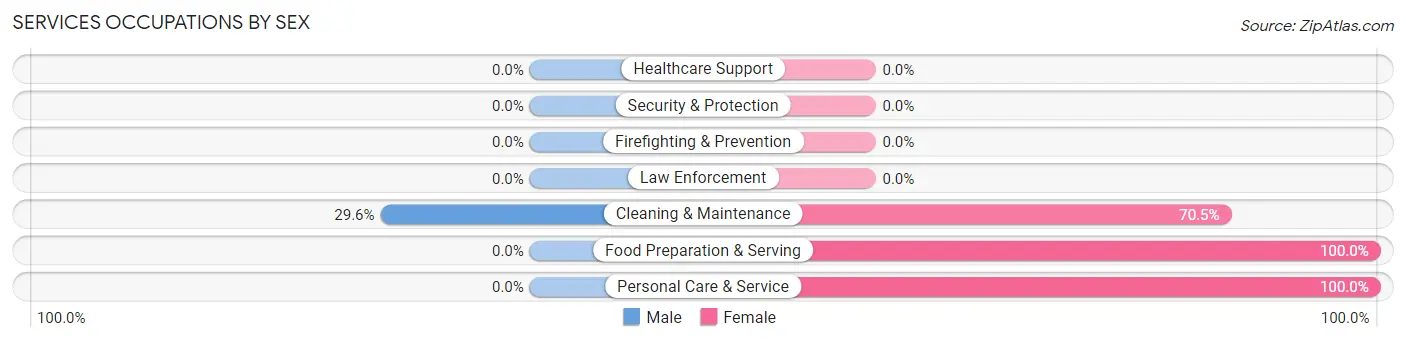
| Occupation | Male | Female |
| Healthcare Support | 0 (0.0%) | 0 (0.0%) |
| Security & Protection | 0 (0.0%) | 0 (0.0%) |
| Firefighting & Prevention | 0 (0.0%) | 0 (0.0%) |
| Law Enforcement | 0 (0.0%) | 0 (0.0%) |
| Food Preparation & Serving | 0 (0.0%) | 78 (100.0%) |
| Cleaning & Maintenance | 26 (29.5%) | 62 (70.5%) |
| Personal Care & Service | 0 (0.0%) | 59 (100.0%) |
| Total (Category) | 26 (11.6%) | 199 (88.4%) |
| Total (Overall) | 431 (48.6%) | 456 (51.4%) |
Sales and Office Occupations
The most common Sales and Office occupations in Anza are Sales & Related (180 | 20.3%), and Office & Administration (53 | 6.0%).
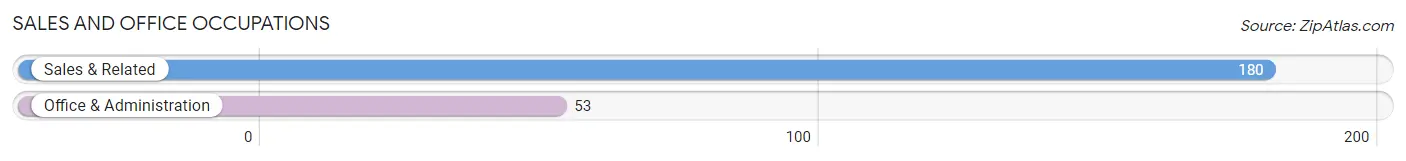
Sales and Office Occupations by Sex
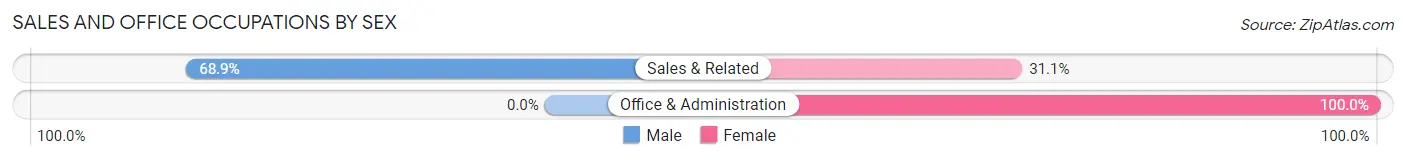
| Occupation | Male | Female |
| Sales & Related | 124 (68.9%) | 56 (31.1%) |
| Office & Administration | 0 (0.0%) | 53 (100.0%) |
| Total (Category) | 124 (53.2%) | 109 (46.8%) |
| Total (Overall) | 431 (48.6%) | 456 (51.4%) |
Natural Resources, Construction and Maintenance Occupations
The most common Natural Resources, Construction and Maintenance occupations in Anza are Installation, Maintenance & Repair (134 | 15.1%), and Construction & Extraction (78 | 8.8%).
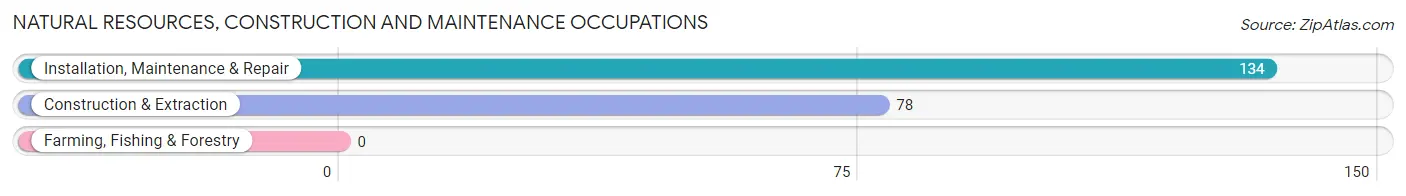
Natural Resources, Construction and Maintenance Occupations by Sex
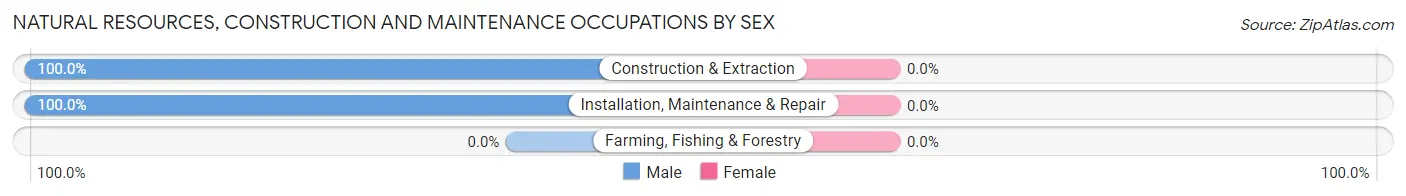
| Occupation | Male | Female |
| Farming, Fishing & Forestry | 0 (0.0%) | 0 (0.0%) |
| Construction & Extraction | 78 (100.0%) | 0 (0.0%) |
| Installation, Maintenance & Repair | 134 (100.0%) | 0 (0.0%) |
| Total (Category) | 212 (100.0%) | 0 (0.0%) |
| Total (Overall) | 431 (48.6%) | 456 (51.4%) |
Production, Transportation and Moving Occupations
The most common Production, Transportation and Moving occupations in Anza are , and Transportation (32 | 3.6%).
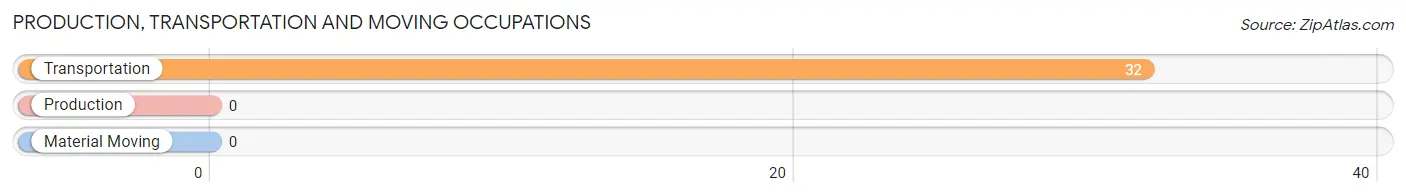
Production, Transportation and Moving Occupations by Sex
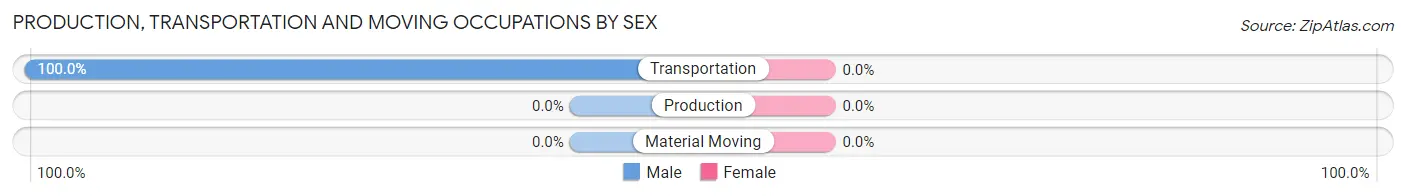
| Occupation | Male | Female |
| Production | 0 (0.0%) | 0 (0.0%) |
| Transportation | 32 (100.0%) | 0 (0.0%) |
| Material Moving | 0 (0.0%) | 0 (0.0%) |
| Total (Category) | 32 (100.0%) | 0 (0.0%) |
| Total (Overall) | 431 (48.6%) | 456 (51.4%) |
Employment Industries by Sex in Anza
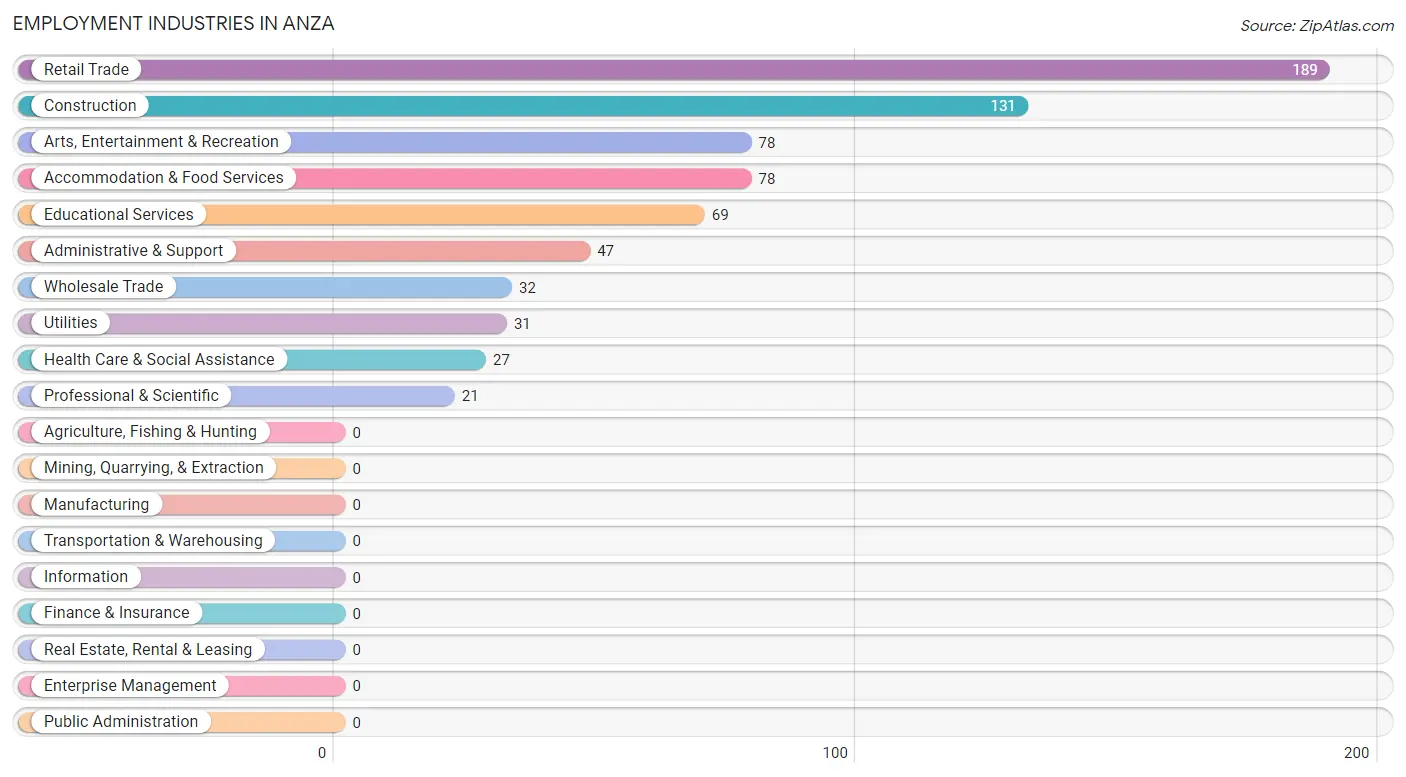
Employment Industries in Anza
The major employment industries in Anza include Retail Trade (189 | 21.3%), Construction (131 | 14.8%), Arts, Entertainment & Recreation (78 | 8.8%), Accommodation & Food Services (78 | 8.8%), and Educational Services (69 | 7.8%).
Employment Industries by Sex in Anza
The Anza industries that see more men than women are Wholesale Trade (100.0%), Administrative & Support (100.0%), and Retail Trade (83.1%), whereas the industries that tend to have a higher number of women are Utilities (100.0%), Professional & Scientific (100.0%), and Educational Services (100.0%).
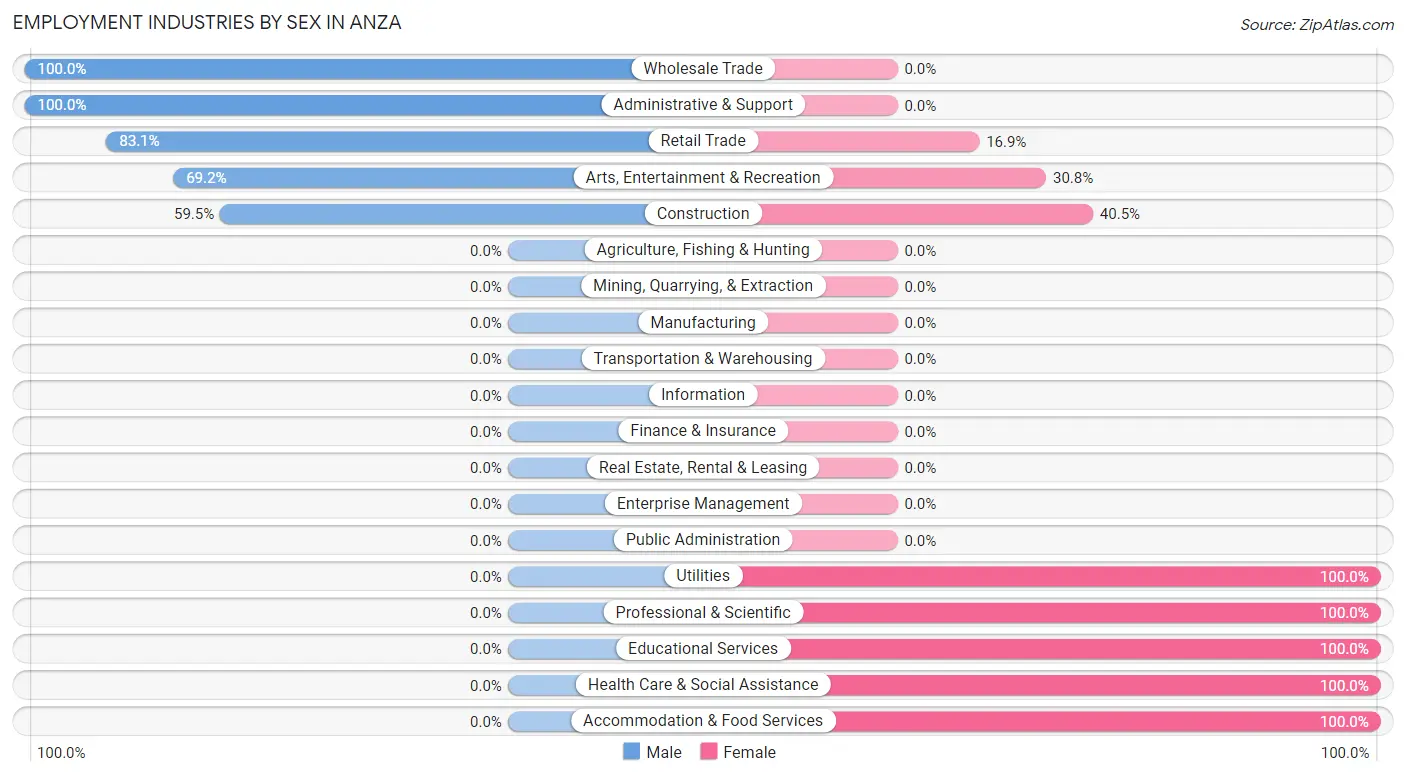
| Industry | Male | Female |
| Agriculture, Fishing & Hunting | 0 (0.0%) | 0 (0.0%) |
| Mining, Quarrying, & Extraction | 0 (0.0%) | 0 (0.0%) |
| Construction | 78 (59.5%) | 53 (40.5%) |
| Manufacturing | 0 (0.0%) | 0 (0.0%) |
| Wholesale Trade | 32 (100.0%) | 0 (0.0%) |
| Retail Trade | 157 (83.1%) | 32 (16.9%) |
| Transportation & Warehousing | 0 (0.0%) | 0 (0.0%) |
| Utilities | 0 (0.0%) | 31 (100.0%) |
| Information | 0 (0.0%) | 0 (0.0%) |
| Finance & Insurance | 0 (0.0%) | 0 (0.0%) |
| Real Estate, Rental & Leasing | 0 (0.0%) | 0 (0.0%) |
| Professional & Scientific | 0 (0.0%) | 21 (100.0%) |
| Enterprise Management | 0 (0.0%) | 0 (0.0%) |
| Administrative & Support | 47 (100.0%) | 0 (0.0%) |
| Educational Services | 0 (0.0%) | 69 (100.0%) |
| Health Care & Social Assistance | 0 (0.0%) | 27 (100.0%) |
| Arts, Entertainment & Recreation | 54 (69.2%) | 24 (30.8%) |
| Accommodation & Food Services | 0 (0.0%) | 78 (100.0%) |
| Public Administration | 0 (0.0%) | 0 (0.0%) |
| Total | 431 (48.6%) | 456 (51.4%) |
Education in Anza
School Enrollment in Anza
The most common levels of schooling among the 512 students in Anza are middle school (164 | 32.0%), elementary school (118 | 23.1%), and nursery / preschool (67 | 13.1%).
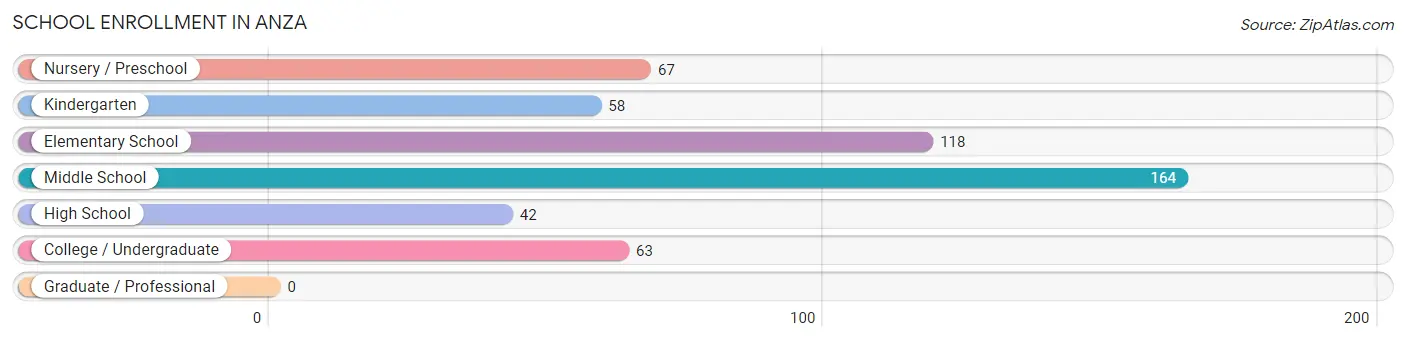
| School Level | # Students | % Students |
| Nursery / Preschool | 67 | 13.1% |
| Kindergarten | 58 | 11.3% |
| Elementary School | 118 | 23.1% |
| Middle School | 164 | 32.0% |
| High School | 42 | 8.2% |
| College / Undergraduate | 63 | 12.3% |
| Graduate / Professional | 0 | 0.0% |
| Total | 512 | 100.0% |
School Enrollment by Age by Funding Source in Anza
Out of a total of 512 students who are enrolled in schools in Anza, 31 (6.1%) attend a private institution, while the remaining 481 (93.9%) are enrolled in public schools. The age group of 20 to 24 year olds has the highest likelihood of being enrolled in private schools, with 31 (49.2% in the age bracket) enrolled. Conversely, the age group of 3 to 4 year olds has the lowest likelihood of being enrolled in a private school, with 67 (100.0% in the age bracket) attending a public institution.
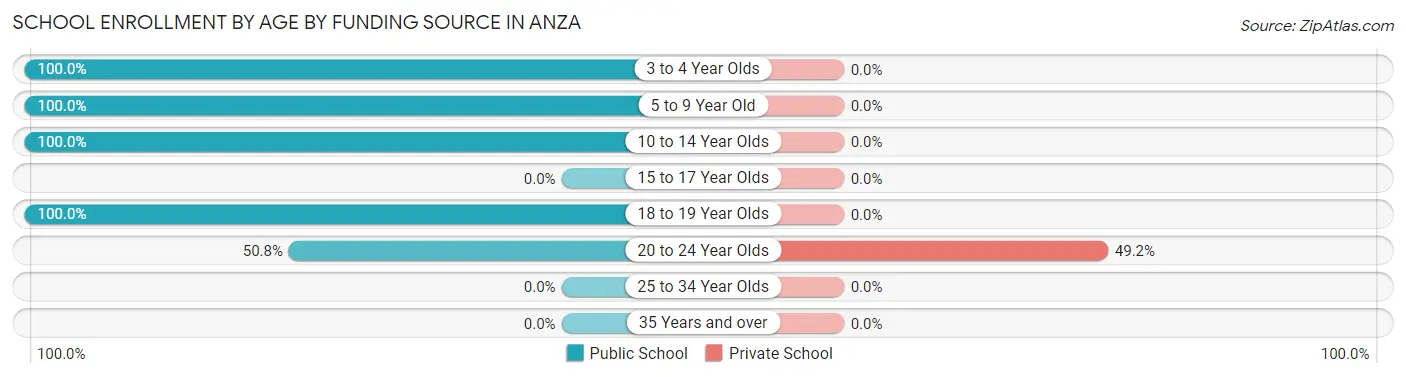
| Age Bracket | Public School | Private School |
| 3 to 4 Year Olds | 67 (100.0%) | 0 (0.0%) |
| 5 to 9 Year Old | 176 (100.0%) | 0 (0.0%) |
| 10 to 14 Year Olds | 164 (100.0%) | 0 (0.0%) |
| 15 to 17 Year Olds | 0 (0.0%) | 0 (0.0%) |
| 18 to 19 Year Olds | 42 (100.0%) | 0 (0.0%) |
| 20 to 24 Year Olds | 32 (50.8%) | 31 (49.2%) |
| 25 to 34 Year Olds | 0 (0.0%) | 0 (0.0%) |
| 35 Years and over | 0 (0.0%) | 0 (0.0%) |
| Total | 481 (93.9%) | 31 (6.1%) |
Educational Attainment by Field of Study in Anza
Business (95 | 24.9%), social sciences (83 | 21.8%), arts & humanities (68 | 17.8%), psychology (56 | 14.7%), and visual & performing arts (41 | 10.8%) are the most common fields of study among 381 individuals in Anza who have obtained a bachelor's degree or higher.
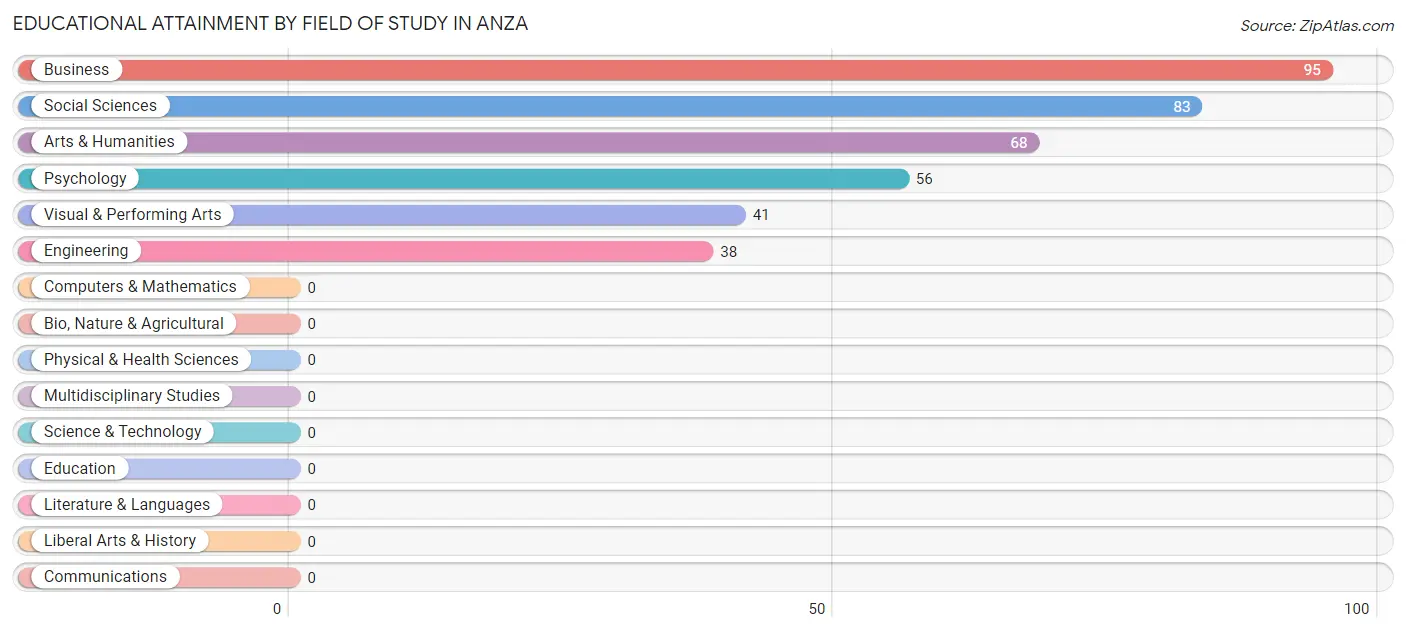
| Field of Study | # Graduates | % Graduates |
| Computers & Mathematics | 0 | 0.0% |
| Bio, Nature & Agricultural | 0 | 0.0% |
| Physical & Health Sciences | 0 | 0.0% |
| Psychology | 56 | 14.7% |
| Social Sciences | 83 | 21.8% |
| Engineering | 38 | 10.0% |
| Multidisciplinary Studies | 0 | 0.0% |
| Science & Technology | 0 | 0.0% |
| Business | 95 | 24.9% |
| Education | 0 | 0.0% |
| Literature & Languages | 0 | 0.0% |
| Liberal Arts & History | 0 | 0.0% |
| Visual & Performing Arts | 41 | 10.8% |
| Communications | 0 | 0.0% |
| Arts & Humanities | 68 | 17.8% |
| Total | 381 | 100.0% |
Transportation & Commute in Anza
Vehicle Availability by Sex in Anza
The most prevalent vehicle ownership categories in Anza are males with 4 vehicles (167, accounting for 38.8%) and females with 4 vehicles (103, making up 36.6%).
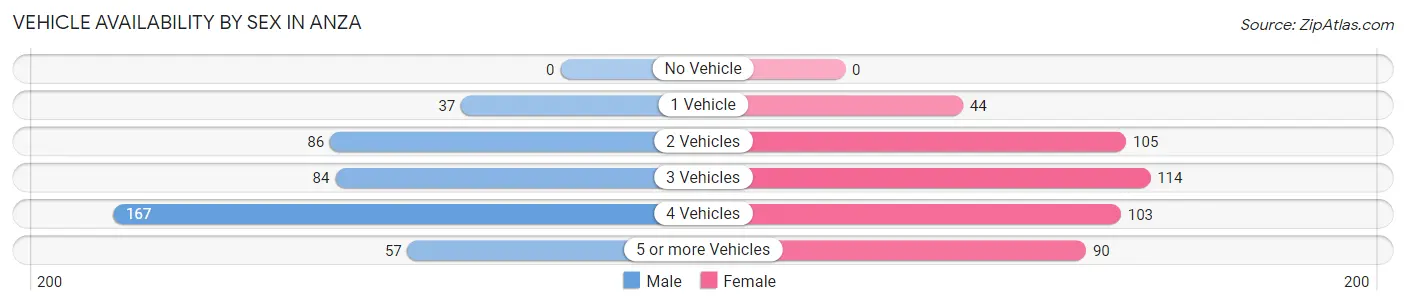
| Vehicles Available | Male | Female |
| No Vehicle | 0 (0.0%) | 0 (0.0%) |
| 1 Vehicle | 37 (8.6%) | 44 (9.7%) |
| 2 Vehicles | 86 (20.0%) | 105 (23.0%) |
| 3 Vehicles | 84 (19.5%) | 114 (25.0%) |
| 4 Vehicles | 167 (38.8%) | 103 (22.6%) |
| 5 or more Vehicles | 57 (13.2%) | 90 (19.7%) |
| Total | 431 (100.0%) | 456 (100.0%) |
Commute Time in Anza
The most frequently occuring commute durations in Anza are 25 to 29 minutes (211 commuters, 25.0%), 45 to 59 minutes (194 commuters, 23.0%), and 15 to 19 minutes (114 commuters, 13.5%).
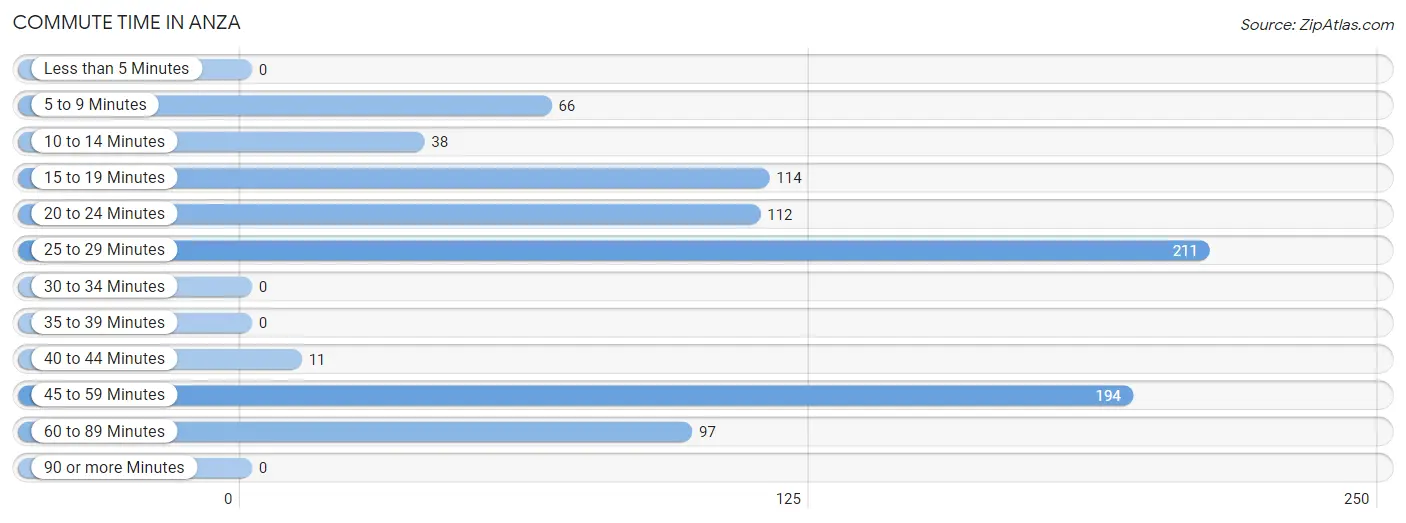
| Commute Time | # Commuters | % Commuters |
| Less than 5 Minutes | 0 | 0.0% |
| 5 to 9 Minutes | 66 | 7.8% |
| 10 to 14 Minutes | 38 | 4.5% |
| 15 to 19 Minutes | 114 | 13.5% |
| 20 to 24 Minutes | 112 | 13.3% |
| 25 to 29 Minutes | 211 | 25.0% |
| 30 to 34 Minutes | 0 | 0.0% |
| 35 to 39 Minutes | 0 | 0.0% |
| 40 to 44 Minutes | 11 | 1.3% |
| 45 to 59 Minutes | 194 | 23.0% |
| 60 to 89 Minutes | 97 | 11.5% |
| 90 or more Minutes | 0 | 0.0% |
Commute Time by Sex in Anza
The most common commute times in Anza are 25 to 29 minutes (154 commuters, 35.7%) for males and 15 to 19 minutes (114 commuters, 27.7%) for females.
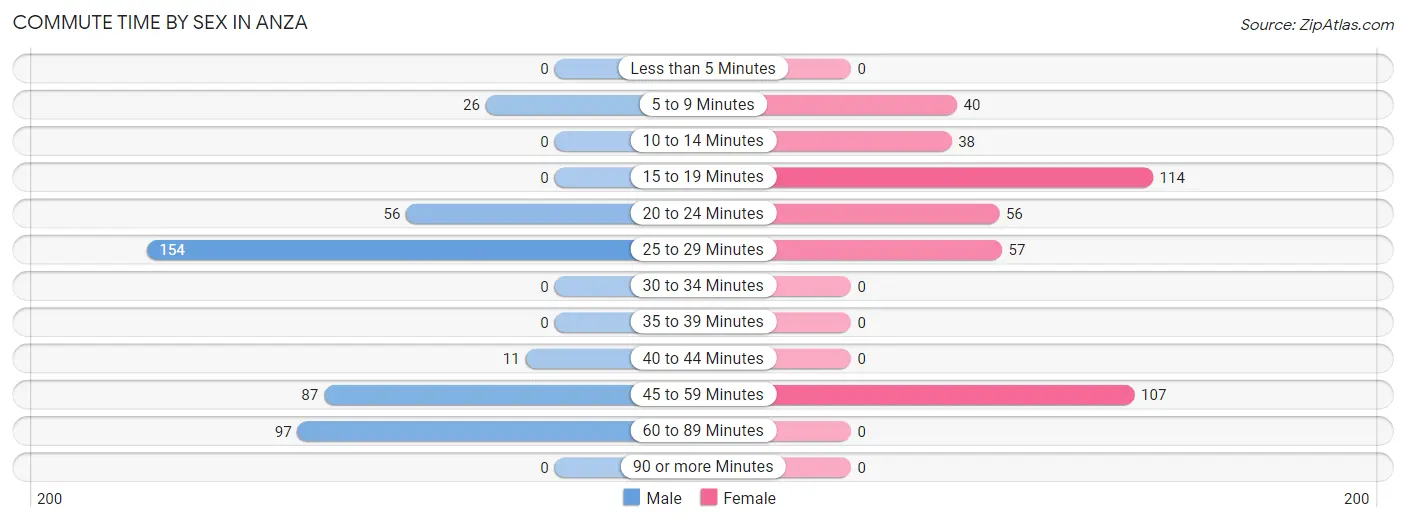
| Commute Time | Male | Female |
| Less than 5 Minutes | 0 (0.0%) | 0 (0.0%) |
| 5 to 9 Minutes | 26 (6.0%) | 40 (9.7%) |
| 10 to 14 Minutes | 0 (0.0%) | 38 (9.2%) |
| 15 to 19 Minutes | 0 (0.0%) | 114 (27.7%) |
| 20 to 24 Minutes | 56 (13.0%) | 56 (13.6%) |
| 25 to 29 Minutes | 154 (35.7%) | 57 (13.8%) |
| 30 to 34 Minutes | 0 (0.0%) | 0 (0.0%) |
| 35 to 39 Minutes | 0 (0.0%) | 0 (0.0%) |
| 40 to 44 Minutes | 11 (2.5%) | 0 (0.0%) |
| 45 to 59 Minutes | 87 (20.2%) | 107 (26.0%) |
| 60 to 89 Minutes | 97 (22.5%) | 0 (0.0%) |
| 90 or more Minutes | 0 (0.0%) | 0 (0.0%) |
Time of Departure to Work by Sex in Anza
The most frequent times of departure to work in Anza are 7:30 AM to 7:59 AM (147, 34.1%) for males and 9:00 AM to 9:59 AM (83, 20.2%) for females.
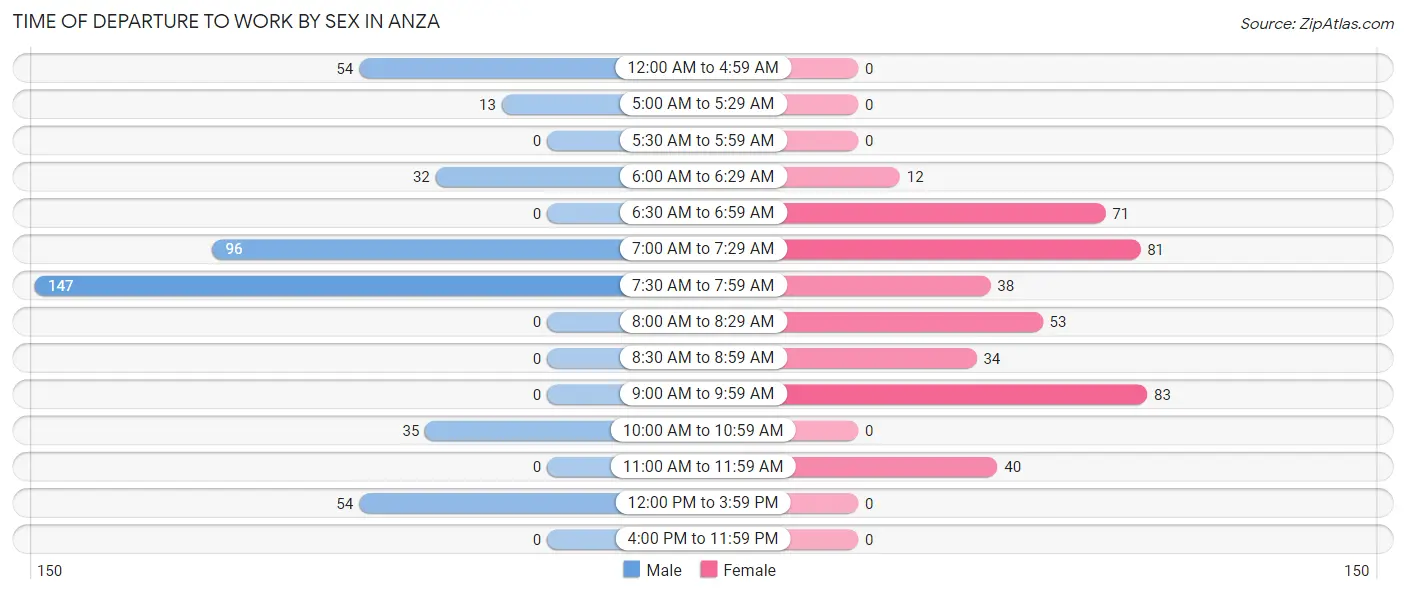
| Time of Departure | Male | Female |
| 12:00 AM to 4:59 AM | 54 (12.5%) | 0 (0.0%) |
| 5:00 AM to 5:29 AM | 13 (3.0%) | 0 (0.0%) |
| 5:30 AM to 5:59 AM | 0 (0.0%) | 0 (0.0%) |
| 6:00 AM to 6:29 AM | 32 (7.4%) | 12 (2.9%) |
| 6:30 AM to 6:59 AM | 0 (0.0%) | 71 (17.2%) |
| 7:00 AM to 7:29 AM | 96 (22.3%) | 81 (19.7%) |
| 7:30 AM to 7:59 AM | 147 (34.1%) | 38 (9.2%) |
| 8:00 AM to 8:29 AM | 0 (0.0%) | 53 (12.9%) |
| 8:30 AM to 8:59 AM | 0 (0.0%) | 34 (8.3%) |
| 9:00 AM to 9:59 AM | 0 (0.0%) | 83 (20.2%) |
| 10:00 AM to 10:59 AM | 35 (8.1%) | 0 (0.0%) |
| 11:00 AM to 11:59 AM | 0 (0.0%) | 40 (9.7%) |
| 12:00 PM to 3:59 PM | 54 (12.5%) | 0 (0.0%) |
| 4:00 PM to 11:59 PM | 0 (0.0%) | 0 (0.0%) |
| Total | 431 (100.0%) | 412 (100.0%) |
Housing Occupancy in Anza
Occupancy by Ownership in Anza
Of the total 748 dwellings in Anza, owner-occupied units account for 589 (78.7%), while renter-occupied units make up 159 (21.3%).
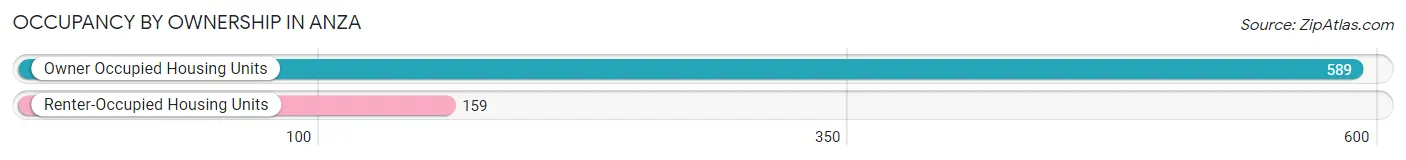
| Occupancy | # Housing Units | % Housing Units |
| Owner Occupied Housing Units | 589 | 78.7% |
| Renter-Occupied Housing Units | 159 | 21.3% |
| Total Occupied Housing Units | 748 | 100.0% |
Occupancy by Household Size in Anza
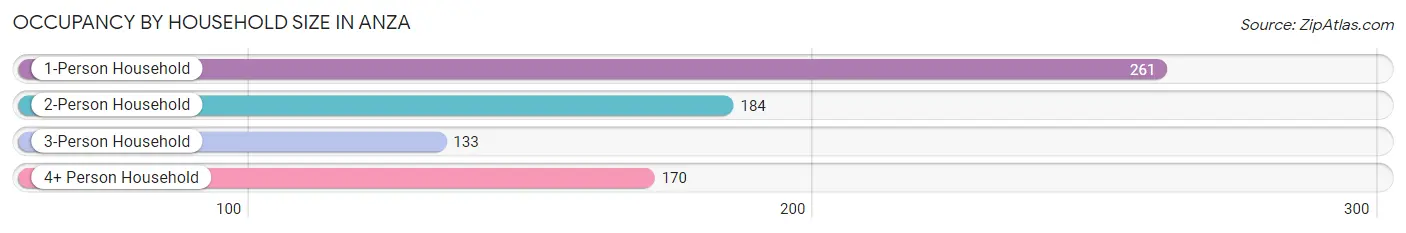
| Household Size | # Housing Units | % Housing Units |
| 1-Person Household | 261 | 34.9% |
| 2-Person Household | 184 | 24.6% |
| 3-Person Household | 133 | 17.8% |
| 4+ Person Household | 170 | 22.7% |
| Total Housing Units | 748 | 100.0% |
Occupancy by Ownership by Household Size in Anza
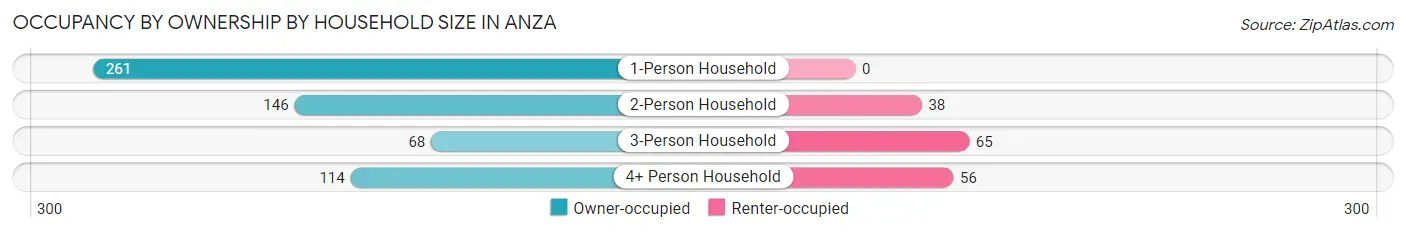
| Household Size | Owner-occupied | Renter-occupied |
| 1-Person Household | 261 (100.0%) | 0 (0.0%) |
| 2-Person Household | 146 (79.3%) | 38 (20.6%) |
| 3-Person Household | 68 (51.1%) | 65 (48.9%) |
| 4+ Person Household | 114 (67.1%) | 56 (32.9%) |
| Total Housing Units | 589 (78.7%) | 159 (21.3%) |
Occupancy by Educational Attainment in Anza
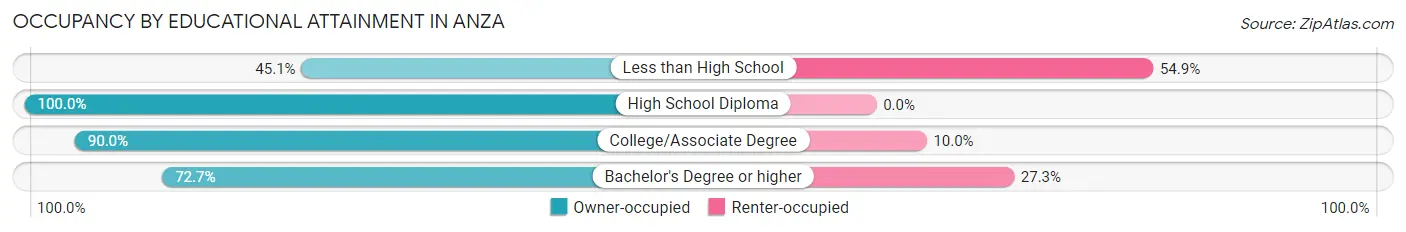
| Household Size | Owner-occupied | Renter-occupied |
| Less than High School | 37 (45.1%) | 45 (54.9%) |
| High School Diploma | 51 (100.0%) | 0 (0.0%) |
| College/Associate Degree | 280 (90.0%) | 31 (10.0%) |
| Bachelor's Degree or higher | 221 (72.7%) | 83 (27.3%) |
Occupancy by Age of Householder in Anza
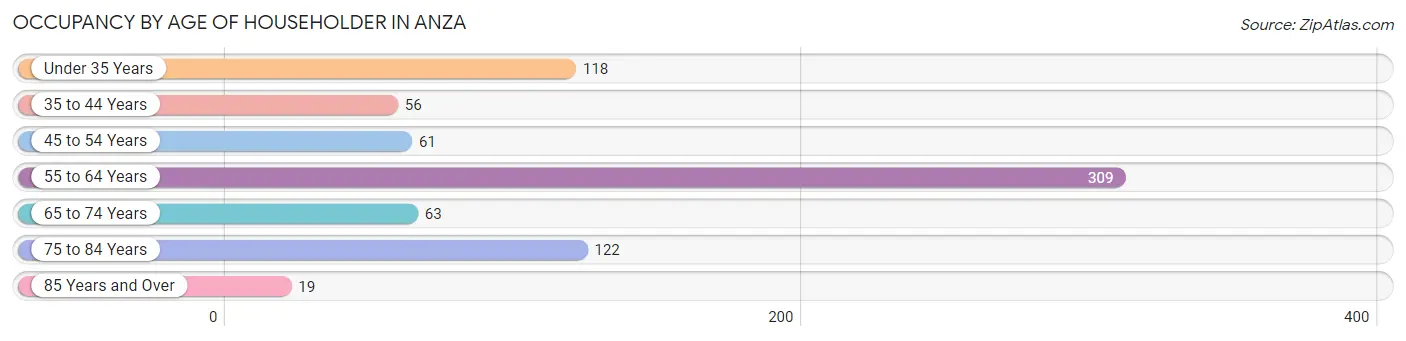
| Age Bracket | # Households | % Households |
| Under 35 Years | 118 | 15.8% |
| 35 to 44 Years | 56 | 7.5% |
| 45 to 54 Years | 61 | 8.2% |
| 55 to 64 Years | 309 | 41.3% |
| 65 to 74 Years | 63 | 8.4% |
| 75 to 84 Years | 122 | 16.3% |
| 85 Years and Over | 19 | 2.5% |
| Total | 748 | 100.0% |
Housing Finances in Anza
Median Income by Occupancy in Anza
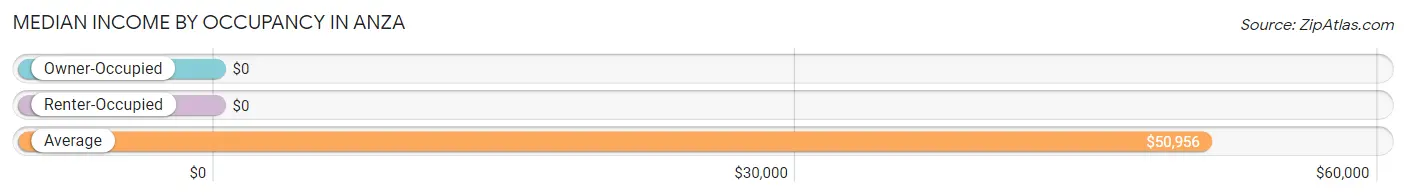
| Occupancy Type | # Households | Median Income |
| Owner-Occupied | 589 (78.7%) | $0 |
| Renter-Occupied | 159 (21.3%) | $0 |
| Average | 748 (100.0%) | $50,956 |
Occupancy by Householder Income Bracket in Anza
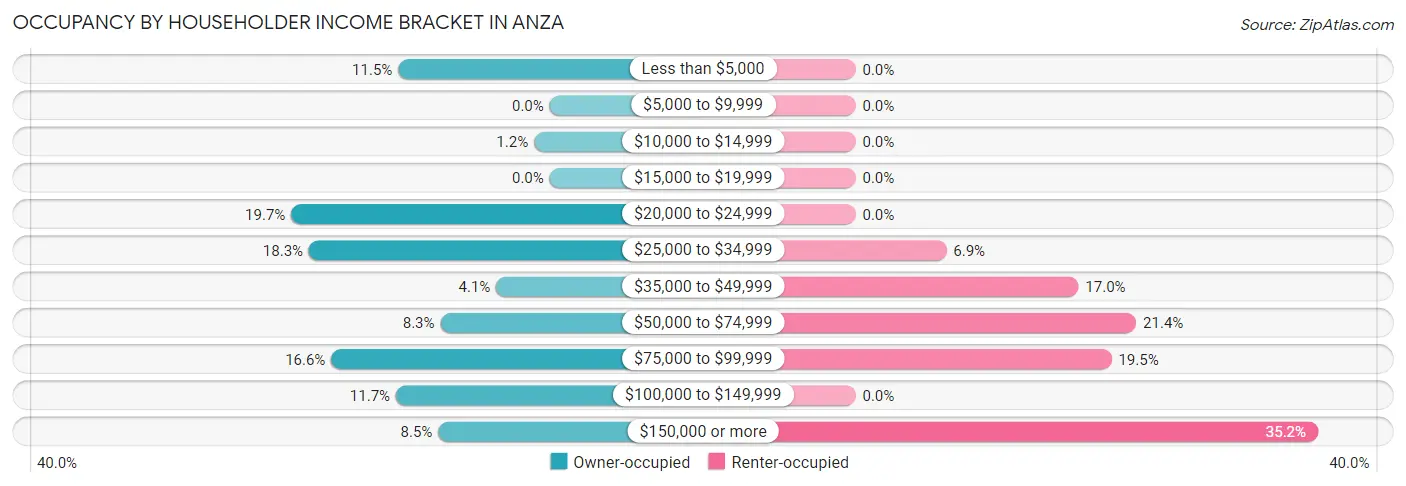
| Income Bracket | Owner-occupied | Renter-occupied |
| Less than $5,000 | 68 (11.5%) | 0 (0.0%) |
| $5,000 to $9,999 | 0 (0.0%) | 0 (0.0%) |
| $10,000 to $14,999 | 7 (1.2%) | 0 (0.0%) |
| $15,000 to $19,999 | 0 (0.0%) | 0 (0.0%) |
| $20,000 to $24,999 | 116 (19.7%) | 0 (0.0%) |
| $25,000 to $34,999 | 108 (18.3%) | 11 (6.9%) |
| $35,000 to $49,999 | 24 (4.1%) | 27 (17.0%) |
| $50,000 to $74,999 | 49 (8.3%) | 34 (21.4%) |
| $75,000 to $99,999 | 98 (16.6%) | 31 (19.5%) |
| $100,000 to $149,999 | 69 (11.7%) | 0 (0.0%) |
| $150,000 or more | 50 (8.5%) | 56 (35.2%) |
| Total | 589 (100.0%) | 159 (100.0%) |
Monthly Housing Cost Tiers in Anza
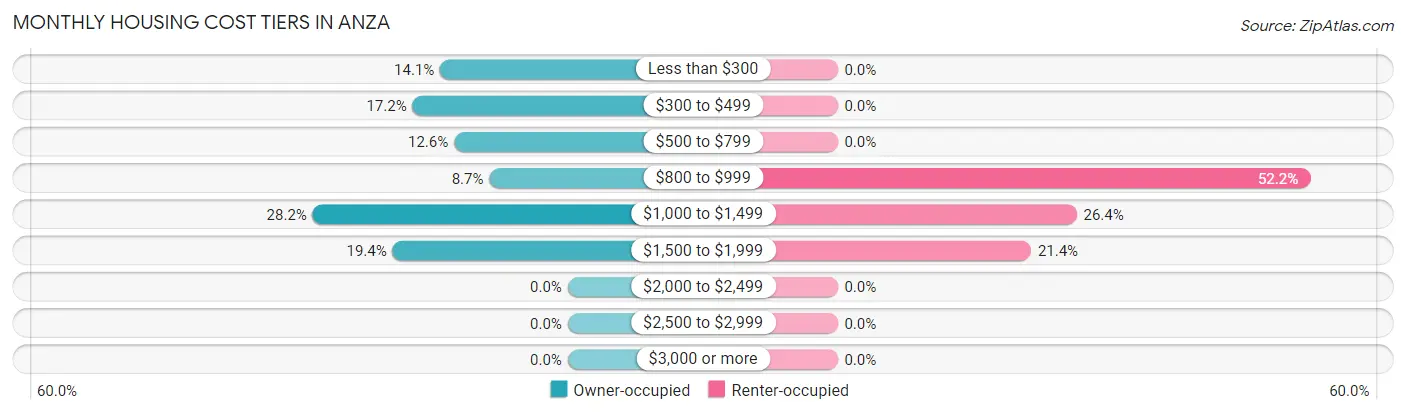
| Monthly Cost | Owner-occupied | Renter-occupied |
| Less than $300 | 83 (14.1%) | 0 (0.0%) |
| $300 to $499 | 101 (17.2%) | 0 (0.0%) |
| $500 to $799 | 74 (12.6%) | 0 (0.0%) |
| $800 to $999 | 51 (8.7%) | 83 (52.2%) |
| $1,000 to $1,499 | 166 (28.2%) | 42 (26.4%) |
| $1,500 to $1,999 | 114 (19.4%) | 34 (21.4%) |
| $2,000 to $2,499 | 0 (0.0%) | 0 (0.0%) |
| $2,500 to $2,999 | 0 (0.0%) | 0 (0.0%) |
| $3,000 or more | 0 (0.0%) | 0 (0.0%) |
| Total | 589 (100.0%) | 159 (100.0%) |
Physical Housing Characteristics in Anza
Housing Structures in Anza
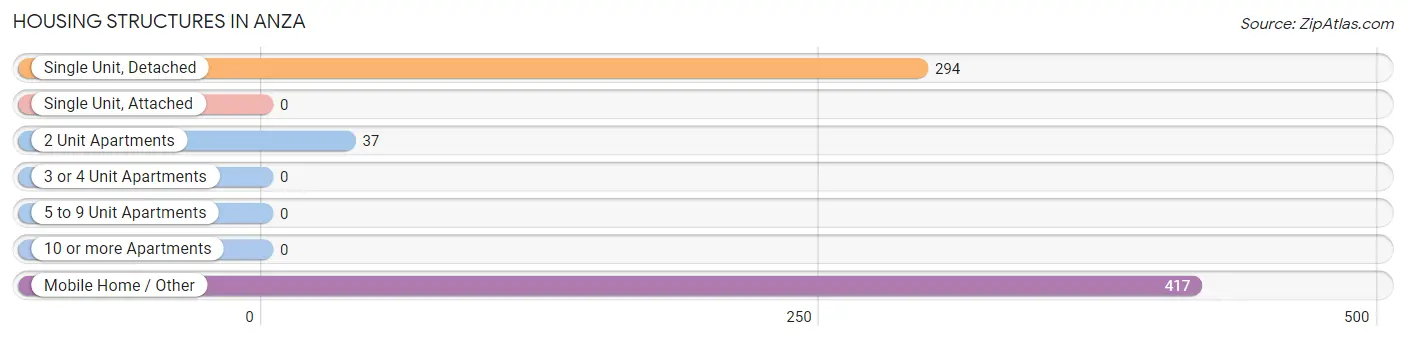
| Structure Type | # Housing Units | % Housing Units |
| Single Unit, Detached | 294 | 39.3% |
| Single Unit, Attached | 0 | 0.0% |
| 2 Unit Apartments | 37 | 5.0% |
| 3 or 4 Unit Apartments | 0 | 0.0% |
| 5 to 9 Unit Apartments | 0 | 0.0% |
| 10 or more Apartments | 0 | 0.0% |
| Mobile Home / Other | 417 | 55.7% |
| Total | 748 | 100.0% |
Housing Structures by Occupancy in Anza
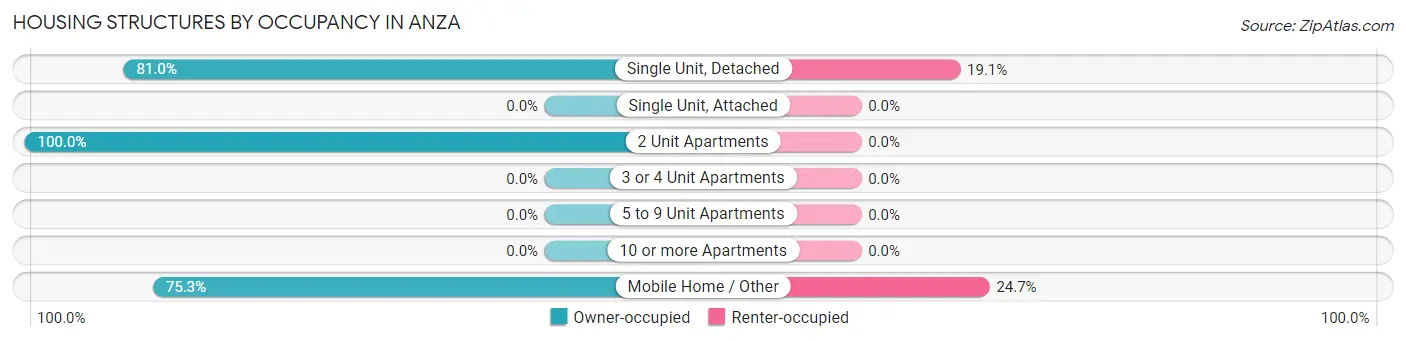
| Structure Type | Owner-occupied | Renter-occupied |
| Single Unit, Detached | 238 (80.9%) | 56 (19.1%) |
| Single Unit, Attached | 0 (0.0%) | 0 (0.0%) |
| 2 Unit Apartments | 37 (100.0%) | 0 (0.0%) |
| 3 or 4 Unit Apartments | 0 (0.0%) | 0 (0.0%) |
| 5 to 9 Unit Apartments | 0 (0.0%) | 0 (0.0%) |
| 10 or more Apartments | 0 (0.0%) | 0 (0.0%) |
| Mobile Home / Other | 314 (75.3%) | 103 (24.7%) |
| Total | 589 (78.7%) | 159 (21.3%) |
Housing Structures by Number of Rooms in Anza
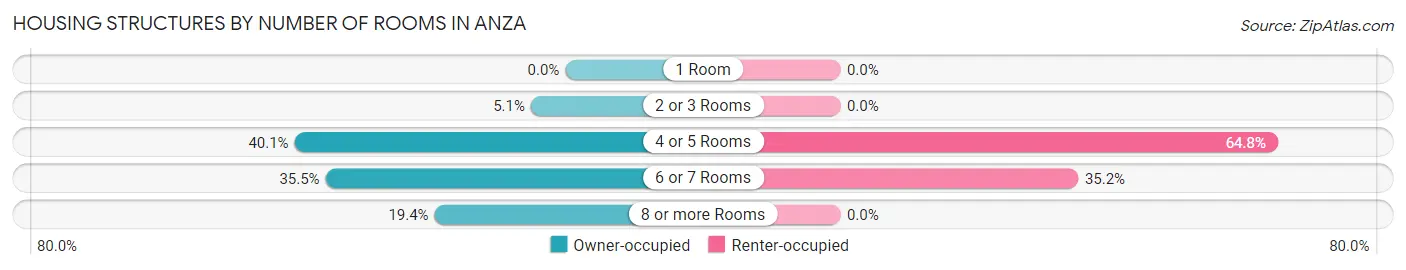
| Number of Rooms | Owner-occupied | Renter-occupied |
| 1 Room | 0 (0.0%) | 0 (0.0%) |
| 2 or 3 Rooms | 30 (5.1%) | 0 (0.0%) |
| 4 or 5 Rooms | 236 (40.1%) | 103 (64.8%) |
| 6 or 7 Rooms | 209 (35.5%) | 56 (35.2%) |
| 8 or more Rooms | 114 (19.4%) | 0 (0.0%) |
| Total | 589 (100.0%) | 159 (100.0%) |
Housing Structure by Heating Type in Anza
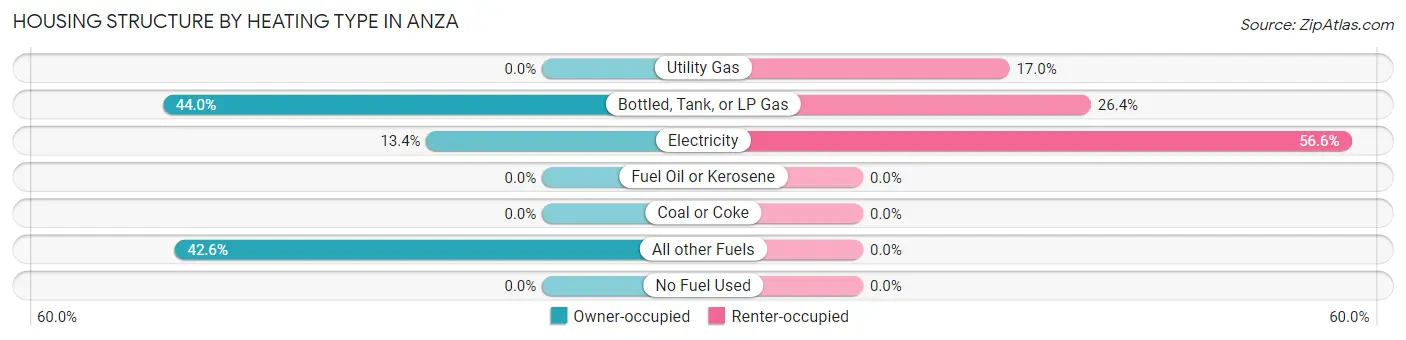
| Heating Type | Owner-occupied | Renter-occupied |
| Utility Gas | 0 (0.0%) | 27 (17.0%) |
| Bottled, Tank, or LP Gas | 259 (44.0%) | 42 (26.4%) |
| Electricity | 79 (13.4%) | 90 (56.6%) |
| Fuel Oil or Kerosene | 0 (0.0%) | 0 (0.0%) |
| Coal or Coke | 0 (0.0%) | 0 (0.0%) |
| All other Fuels | 251 (42.6%) | 0 (0.0%) |
| No Fuel Used | 0 (0.0%) | 0 (0.0%) |
| Total | 589 (100.0%) | 159 (100.0%) |
Household Vehicle Usage in Anza
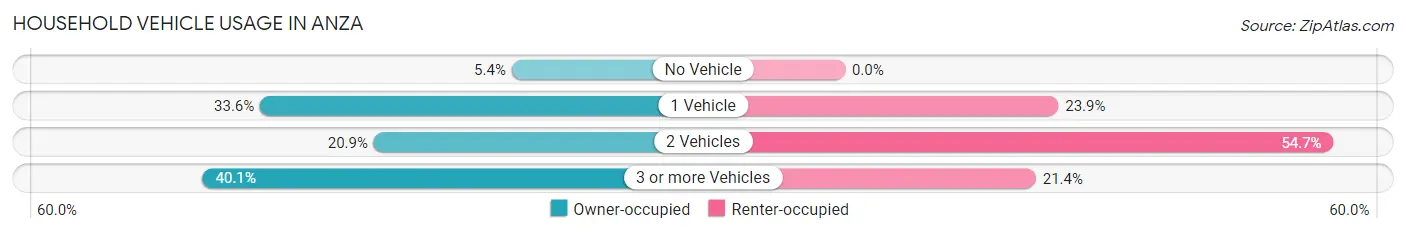
| Vehicles per Household | Owner-occupied | Renter-occupied |
| No Vehicle | 32 (5.4%) | 0 (0.0%) |
| 1 Vehicle | 198 (33.6%) | 38 (23.9%) |
| 2 Vehicles | 123 (20.9%) | 87 (54.7%) |
| 3 or more Vehicles | 236 (40.1%) | 34 (21.4%) |
| Total | 589 (100.0%) | 159 (100.0%) |
Real Estate & Mortgages in Anza
Real Estate and Mortgage Overview in Anza
| Characteristic | Without Mortgage | With Mortgage |
| Housing Units | 440 | 149 |
| Median Property Value | $295,900 | $326,600 |
| Median Household Income | $30,056 | $42 |
| Monthly Housing Costs | $700 | $0 |
| Real Estate Taxes | $1,438 | $0 |
Property Value by Mortgage Status in Anza
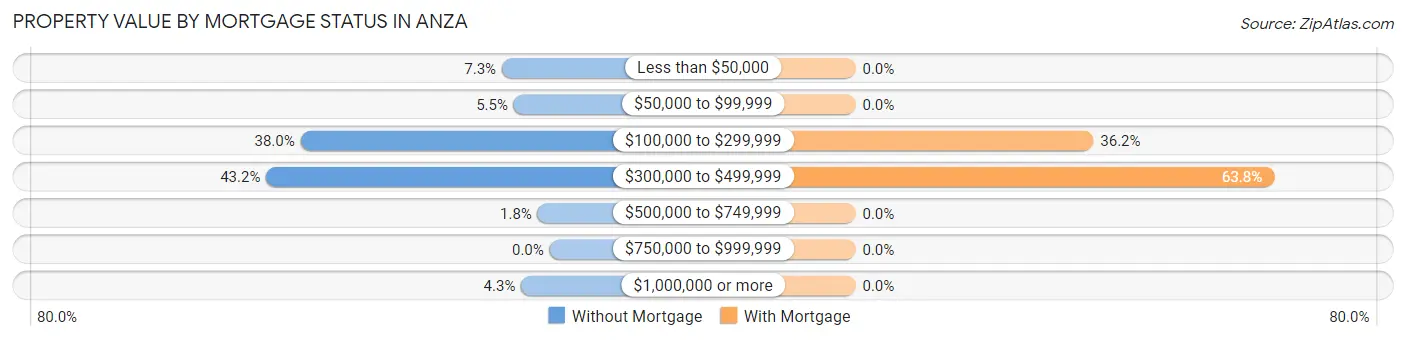
| Property Value | Without Mortgage | With Mortgage |
| Less than $50,000 | 32 (7.3%) | 0 (0.0%) |
| $50,000 to $99,999 | 24 (5.4%) | 0 (0.0%) |
| $100,000 to $299,999 | 167 (38.0%) | 54 (36.2%) |
| $300,000 to $499,999 | 190 (43.2%) | 95 (63.8%) |
| $500,000 to $749,999 | 8 (1.8%) | 0 (0.0%) |
| $750,000 to $999,999 | 0 (0.0%) | 0 (0.0%) |
| $1,000,000 or more | 19 (4.3%) | 0 (0.0%) |
| Total | 440 (100.0%) | 149 (100.0%) |
Household Income by Mortgage Status in Anza
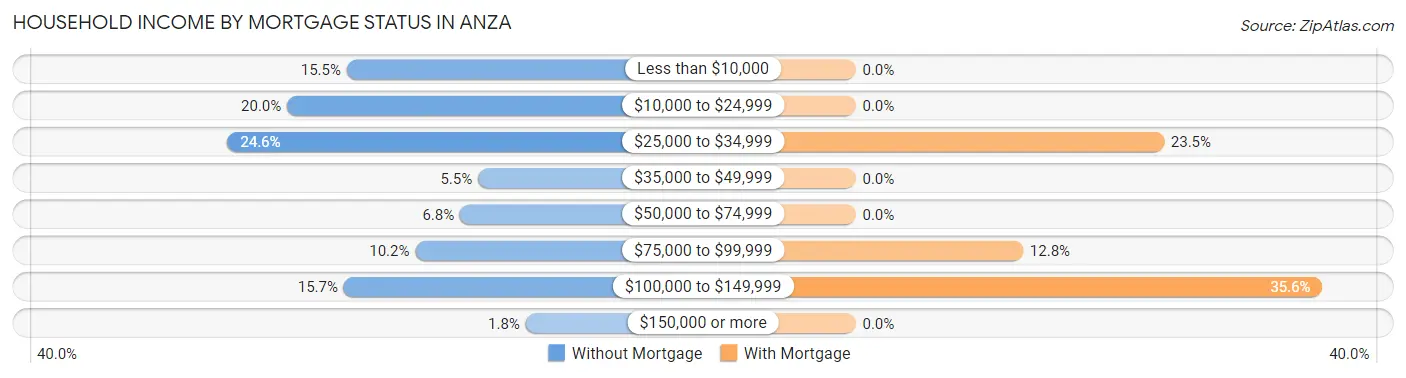
| Household Income | Without Mortgage | With Mortgage |
| Less than $10,000 | 68 (15.4%) | 0 (0.0%) |
| $10,000 to $24,999 | 88 (20.0%) | 0 (0.0%) |
| $25,000 to $34,999 | 108 (24.5%) | 35 (23.5%) |
| $35,000 to $49,999 | 24 (5.4%) | 0 (0.0%) |
| $50,000 to $74,999 | 30 (6.8%) | 0 (0.0%) |
| $75,000 to $99,999 | 45 (10.2%) | 19 (12.8%) |
| $100,000 to $149,999 | 69 (15.7%) | 53 (35.6%) |
| $150,000 or more | 8 (1.8%) | 0 (0.0%) |
| Total | 440 (100.0%) | 149 (100.0%) |
Property Value to Household Income Ratio in Anza
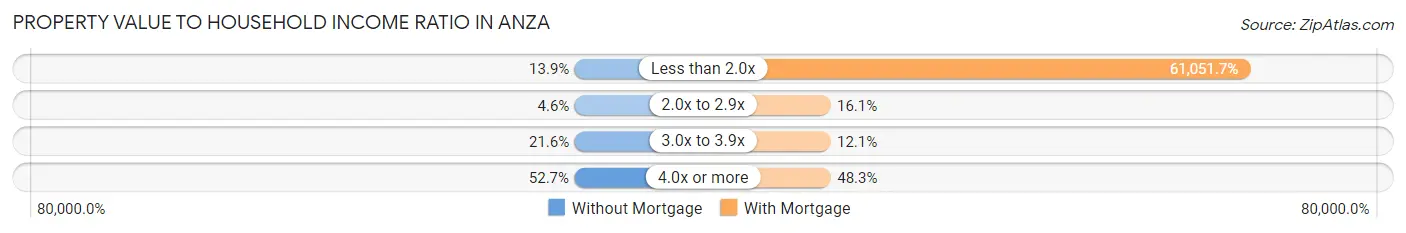
| Value-to-Income Ratio | Without Mortgage | With Mortgage |
| Less than 2.0x | 61 (13.9%) | 90,967 (61,051.7%) |
| 2.0x to 2.9x | 20 (4.5%) | 24 (16.1%) |
| 3.0x to 3.9x | 95 (21.6%) | 18 (12.1%) |
| 4.0x or more | 232 (52.7%) | 72 (48.3%) |
| Total | 440 (100.0%) | 149 (100.0%) |
Real Estate Taxes by Mortgage Status in Anza
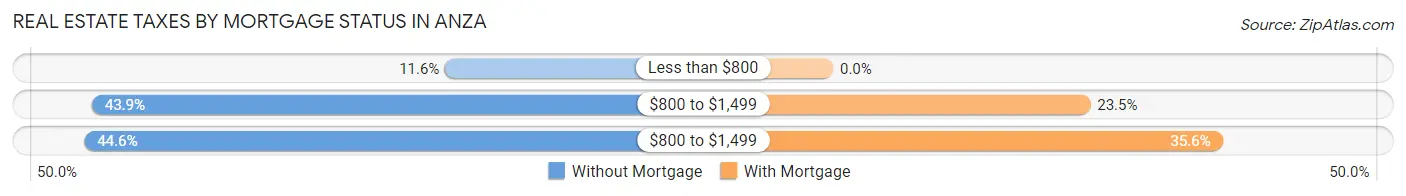
| Property Taxes | Without Mortgage | With Mortgage |
| Less than $800 | 51 (11.6%) | 0 (0.0%) |
| $800 to $1,499 | 193 (43.9%) | 35 (23.5%) |
| $800 to $1,499 | 196 (44.6%) | 53 (35.6%) |
| Total | 440 (100.0%) | 149 (100.0%) |
Health & Disability in Anza
Health Insurance Coverage by Age in Anza
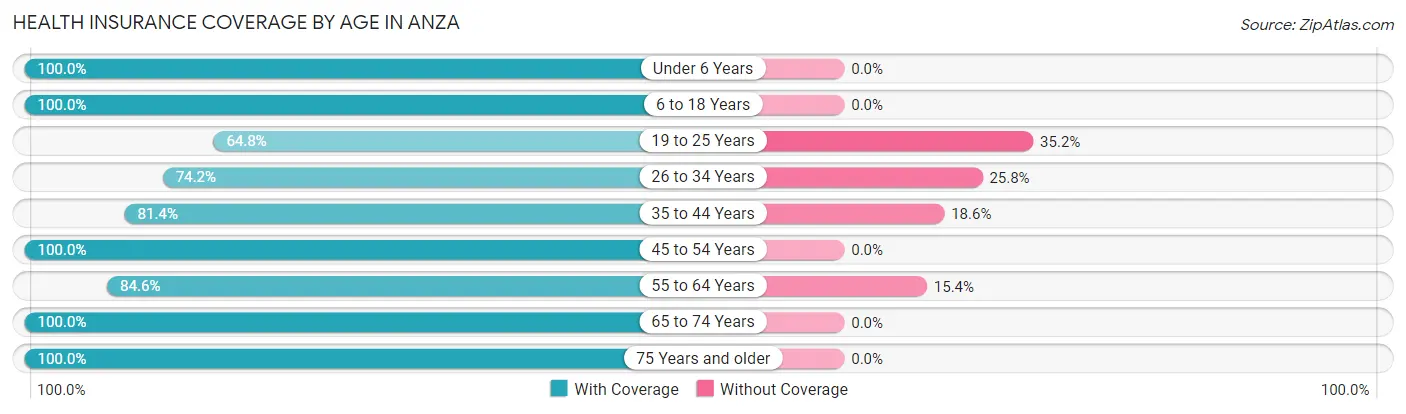
| Age Bracket | With Coverage | Without Coverage |
| Under 6 Years | 99 (100.0%) | 0 (0.0%) |
| 6 to 18 Years | 382 (100.0%) | 0 (0.0%) |
| 19 to 25 Years | 149 (64.8%) | 81 (35.2%) |
| 26 to 34 Years | 98 (74.2%) | 34 (25.8%) |
| 35 to 44 Years | 179 (81.4%) | 41 (18.6%) |
| 45 to 54 Years | 99 (100.0%) | 0 (0.0%) |
| 55 to 64 Years | 346 (84.6%) | 63 (15.4%) |
| 65 to 74 Years | 217 (100.0%) | 0 (0.0%) |
| 75 Years and older | 171 (100.0%) | 0 (0.0%) |
| Total | 1,740 (88.8%) | 219 (11.2%) |
Health Insurance Coverage by Citizenship Status in Anza
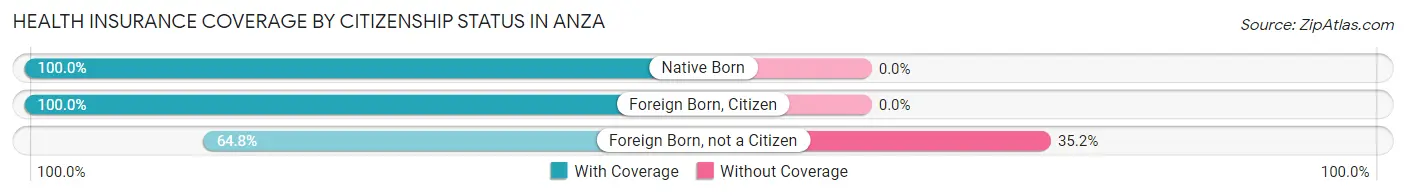
| Citizenship Status | With Coverage | Without Coverage |
| Native Born | 99 (100.0%) | 0 (0.0%) |
| Foreign Born, Citizen | 382 (100.0%) | 0 (0.0%) |
| Foreign Born, not a Citizen | 149 (64.8%) | 81 (35.2%) |
Health Insurance Coverage by Household Income in Anza
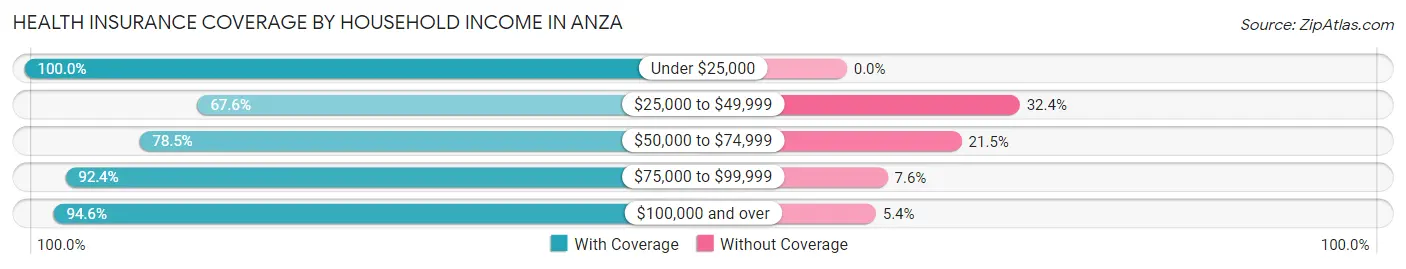
| Household Income | With Coverage | Without Coverage |
| Under $25,000 | 239 (100.0%) | 0 (0.0%) |
| $25,000 to $49,999 | 217 (67.6%) | 104 (32.4%) |
| $50,000 to $74,999 | 124 (78.5%) | 34 (21.5%) |
| $75,000 to $99,999 | 568 (92.4%) | 47 (7.6%) |
| $100,000 and over | 592 (94.6%) | 34 (5.4%) |
Public vs Private Health Insurance Coverage by Age in Anza
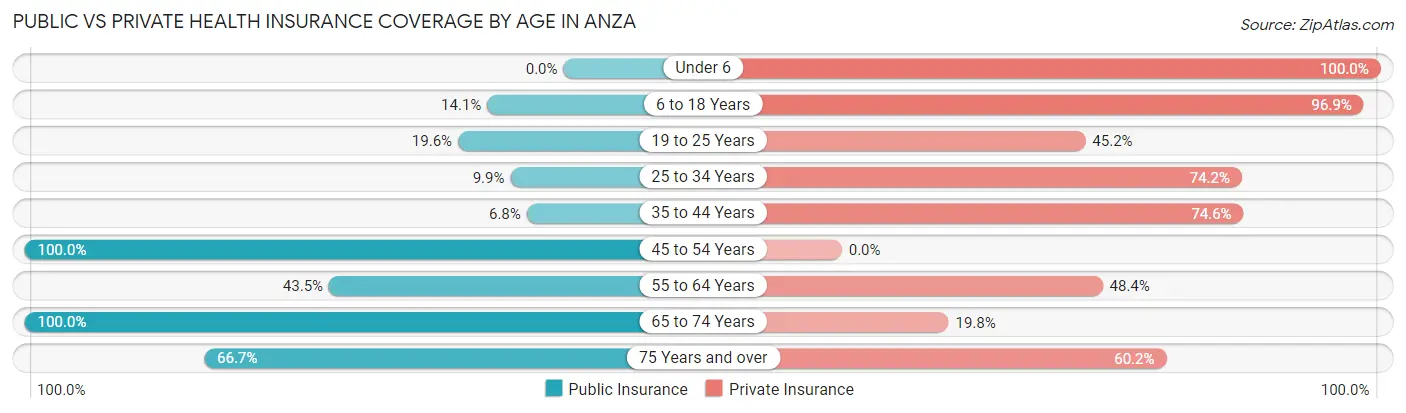
| Age Bracket | Public Insurance | Private Insurance |
| Under 6 | 0 (0.0%) | 99 (100.0%) |
| 6 to 18 Years | 54 (14.1%) | 370 (96.9%) |
| 19 to 25 Years | 45 (19.6%) | 104 (45.2%) |
| 25 to 34 Years | 13 (9.9%) | 98 (74.2%) |
| 35 to 44 Years | 15 (6.8%) | 164 (74.6%) |
| 45 to 54 Years | 99 (100.0%) | 0 (0.0%) |
| 55 to 64 Years | 178 (43.5%) | 198 (48.4%) |
| 65 to 74 Years | 217 (100.0%) | 43 (19.8%) |
| 75 Years and over | 114 (66.7%) | 103 (60.2%) |
| Total | 735 (37.5%) | 1,179 (60.2%) |
Disability Status by Sex by Age in Anza
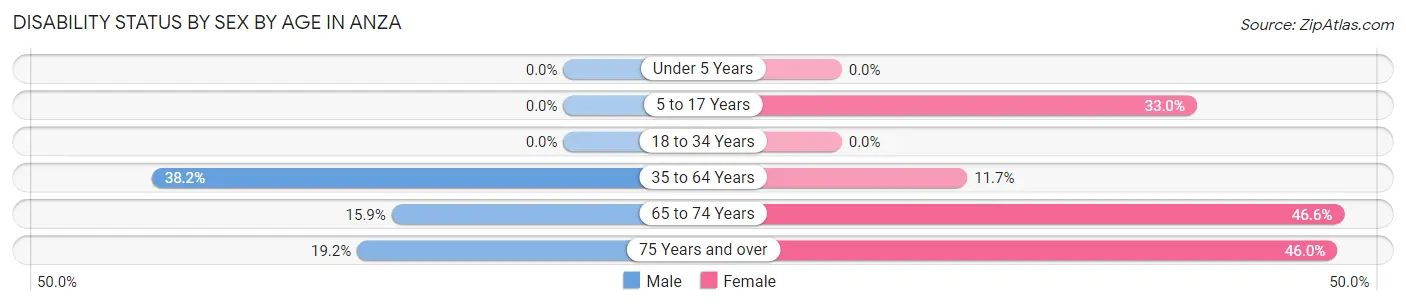
| Age Bracket | Male | Female |
| Under 5 Years | 0 (0.0%) | 0 (0.0%) |
| 5 to 17 Years | 0 (0.0%) | 58 (33.0%) |
| 18 to 34 Years | 0 (0.0%) | 0 (0.0%) |
| 35 to 64 Years | 160 (38.2%) | 36 (11.7%) |
| 65 to 74 Years | 11 (15.9%) | 69 (46.6%) |
| 75 Years and over | 9 (19.2%) | 57 (46.0%) |
Disability Class by Sex by Age in Anza
Disability Class: Hearing Difficulty
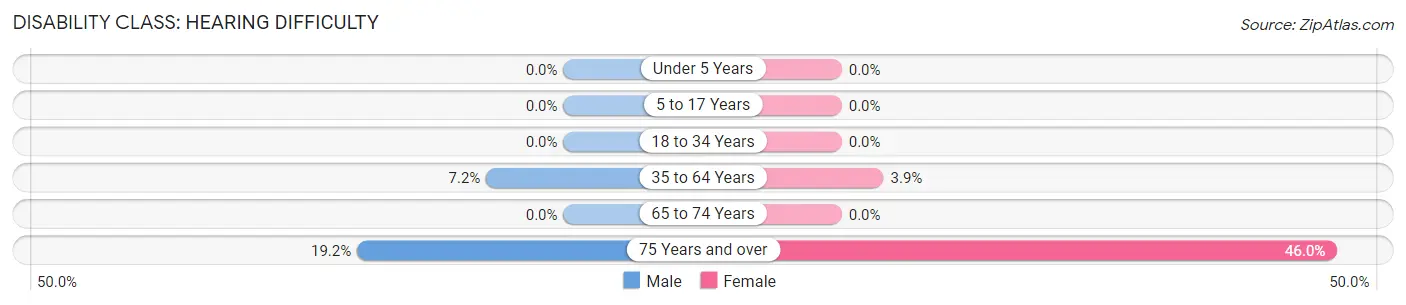
| Age Bracket | Male | Female |
| Under 5 Years | 0 (0.0%) | 0 (0.0%) |
| 5 to 17 Years | 0 (0.0%) | 0 (0.0%) |
| 18 to 34 Years | 0 (0.0%) | 0 (0.0%) |
| 35 to 64 Years | 30 (7.2%) | 12 (3.9%) |
| 65 to 74 Years | 0 (0.0%) | 0 (0.0%) |
| 75 Years and over | 9 (19.2%) | 57 (46.0%) |
Disability Class: Vision Difficulty
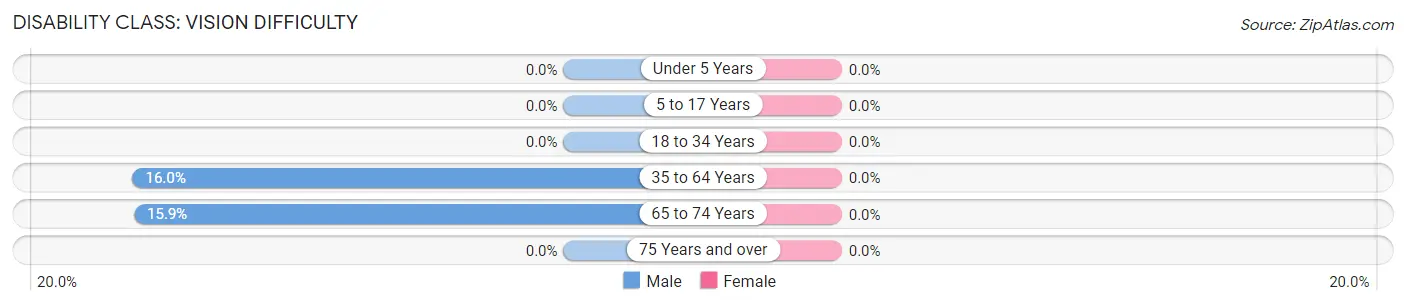
| Age Bracket | Male | Female |
| Under 5 Years | 0 (0.0%) | 0 (0.0%) |
| 5 to 17 Years | 0 (0.0%) | 0 (0.0%) |
| 18 to 34 Years | 0 (0.0%) | 0 (0.0%) |
| 35 to 64 Years | 67 (16.0%) | 0 (0.0%) |
| 65 to 74 Years | 11 (15.9%) | 0 (0.0%) |
| 75 Years and over | 0 (0.0%) | 0 (0.0%) |
Disability Class: Cognitive Difficulty
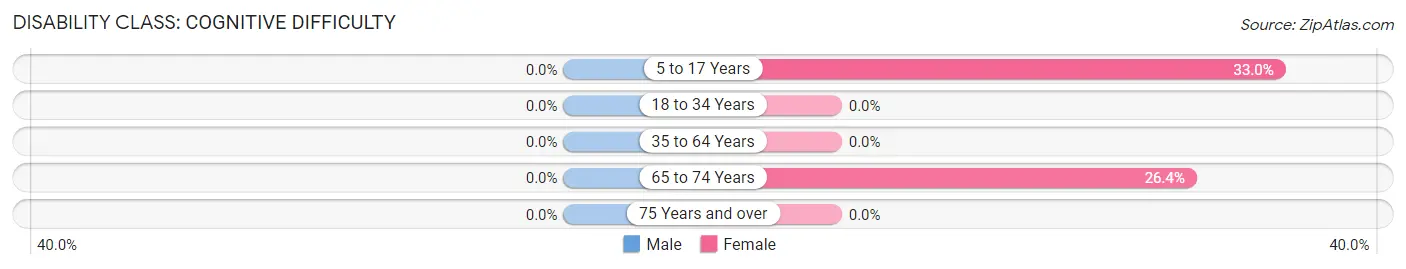
| Age Bracket | Male | Female |
| 5 to 17 Years | 0 (0.0%) | 58 (33.0%) |
| 18 to 34 Years | 0 (0.0%) | 0 (0.0%) |
| 35 to 64 Years | 0 (0.0%) | 0 (0.0%) |
| 65 to 74 Years | 0 (0.0%) | 39 (26.4%) |
| 75 Years and over | 0 (0.0%) | 0 (0.0%) |
Disability Class: Ambulatory Difficulty
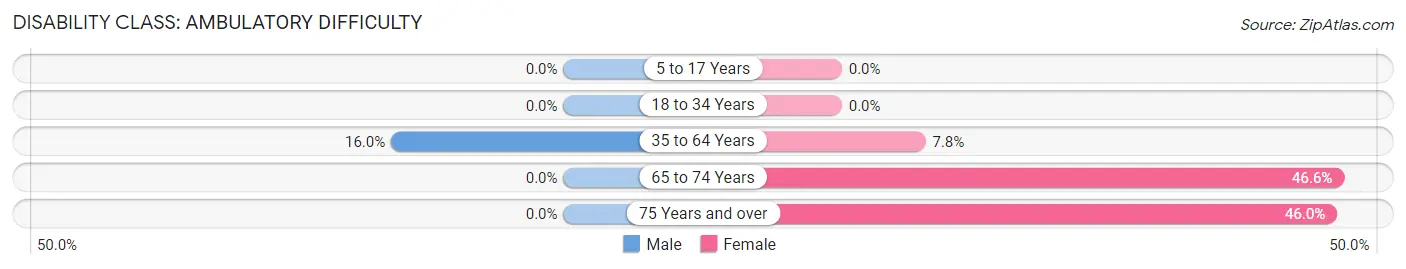
| Age Bracket | Male | Female |
| 5 to 17 Years | 0 (0.0%) | 0 (0.0%) |
| 18 to 34 Years | 0 (0.0%) | 0 (0.0%) |
| 35 to 64 Years | 67 (16.0%) | 24 (7.8%) |
| 65 to 74 Years | 0 (0.0%) | 69 (46.6%) |
| 75 Years and over | 0 (0.0%) | 57 (46.0%) |
Disability Class: Self-Care Difficulty
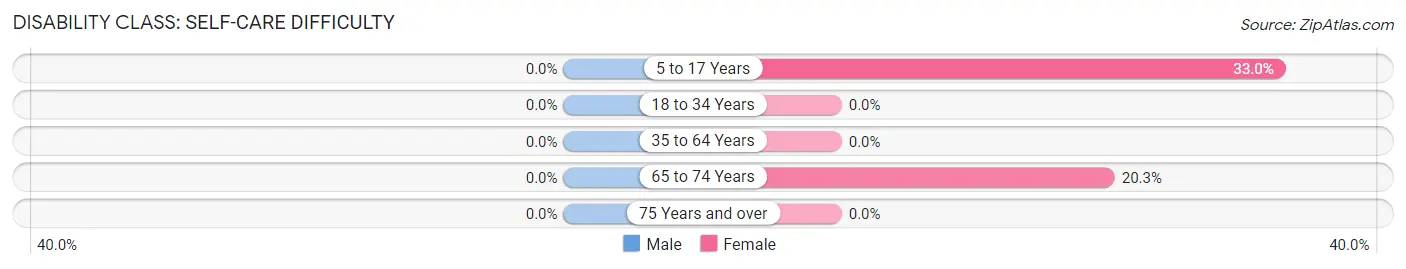
| Age Bracket | Male | Female |
| 5 to 17 Years | 0 (0.0%) | 58 (33.0%) |
| 18 to 34 Years | 0 (0.0%) | 0 (0.0%) |
| 35 to 64 Years | 0 (0.0%) | 0 (0.0%) |
| 65 to 74 Years | 0 (0.0%) | 30 (20.3%) |
| 75 Years and over | 0 (0.0%) | 0 (0.0%) |
Technology Access in Anza
Computing Device Access in Anza
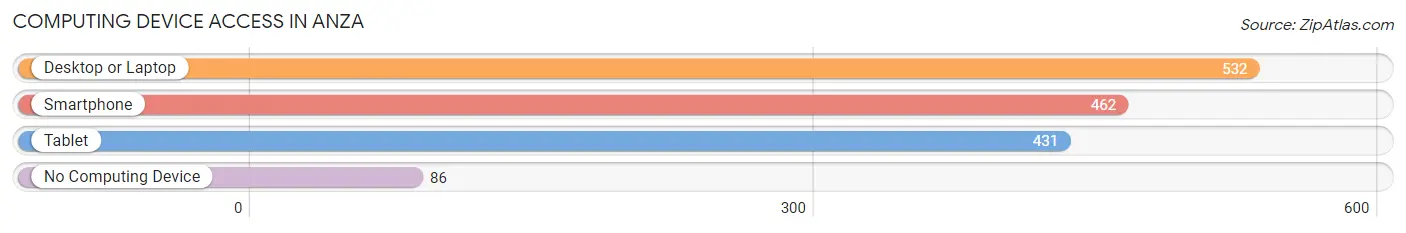
| Device Type | # Households | % Households |
| Desktop or Laptop | 532 | 71.1% |
| Smartphone | 462 | 61.8% |
| Tablet | 431 | 57.6% |
| No Computing Device | 86 | 11.5% |
| Total | 748 | 100.0% |
Internet Access in Anza
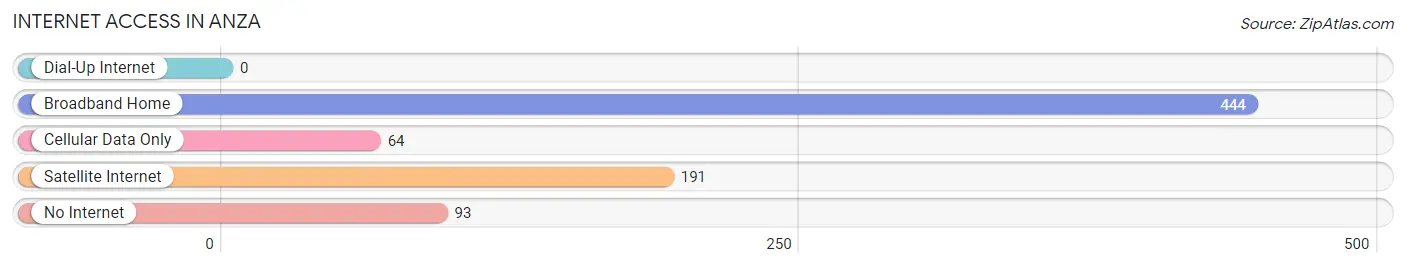
| Internet Type | # Households | % Households |
| Dial-Up Internet | 0 | 0.0% |
| Broadband Home | 444 | 59.4% |
| Cellular Data Only | 64 | 8.6% |
| Satellite Internet | 191 | 25.5% |
| No Internet | 93 | 12.4% |
| Total | 748 | 100.0% |
Anza Summary
Anza is a small unincorporated community located in Riverside County, California. It is situated in the foothills of the Santa Rosa Mountains, approximately 40 miles southeast of Temecula and 80 miles northeast of San Diego. The population of Anza was estimated to be 3,845 in 2019.
History
Anza was first settled in the late 1700s by Spanish explorers and missionaries. The area was originally known as San Juan de Anza, named after Juan Bautista de Anza, a Spanish explorer who led an expedition to the area in 1774. The expedition was part of a larger effort to establish a Spanish presence in California. The expedition established a presidio (fort) and mission in the area, which were both named after Anza.
In the early 1800s, the area was settled by ranchers and farmers, who established the first permanent settlement in the area. The settlement was known as Anza Valley, and it was the first non-Native American settlement in Riverside County.
In the late 1800s, the area was developed as a stagecoach stop and trading post. The stagecoach stop was located at the intersection of what is now Highway 371 and Highway 74. The trading post was located at the intersection of what is now Highway 371 and Highway 79.
In the early 1900s, the area was developed as an agricultural center. The area was known for its citrus and avocado groves, as well as its vineyards.
In the late 1900s, the area was developed as a residential community. The population of Anza has grown steadily since then, and the area is now home to a variety of businesses and services.
Geography
Anza is located in the foothills of the Santa Rosa Mountains, approximately 40 miles southeast of Temecula and 80 miles northeast of San Diego. The area is characterized by rolling hills and valleys, with elevations ranging from 1,000 to 4,000 feet.
The climate in Anza is semi-arid, with hot summers and mild winters. The average annual temperature is 68°F, and the average annual precipitation is 8.5 inches.
Economy
The economy of Anza is largely based on agriculture and tourism. The area is known for its citrus and avocado groves, as well as its vineyards. The area is also home to a variety of businesses and services, including restaurants, retail stores, and lodging.
The area is also home to a number of recreational activities, including hiking, camping, and horseback riding. The area is also home to a number of wineries, which attract visitors from all over the world.
Demographics
As of 2019, the population of Anza was estimated to be 3,845. The population is largely white (83.3%), with smaller percentages of Hispanic (9.2%), African American (2.2%), and Asian (2.1%) residents. The median household income in Anza is $50,945, and the median home value is $279,000.
Conclusion
Anza is a small unincorporated community located in Riverside County, California. It is situated in the foothills of the Santa Rosa Mountains, approximately 40 miles southeast of Temecula and 80 miles northeast of San Diego. The area was first settled in the late 1700s by Spanish explorers and missionaries, and it has since developed into an agricultural center and residential community. The economy of Anza is largely based on agriculture and tourism, and the area is home to a variety of businesses and services. The population of Anza was estimated to be 3,845 in 2019, and the population is largely white.
Common Questions
What is Per Capita Income in Anza?
Per Capita income in Anza is $31,096.
What is the Median Family Income in Anza?
Median Family Income in Anza is $90,986.
What is the Median Household income in Anza?
Median Household Income in Anza is $50,956.
What is Income or Wage Gap in Anza?
Income or Wage Gap in Anza is 30.7%.
Women in Anza earn 69.3 cents for every dollar earned by a man.
What is Inequality or Gini Index in Anza?
Inequality or Gini Index in Anza is 0.48.
What is the Total Population of Anza?
Total Population of Anza is 1,959.
What is the Total Male Population of Anza?
Total Male Population of Anza is 970.
What is the Total Female Population of Anza?
Total Female Population of Anza is 989.
What is the Ratio of Males per 100 Females in Anza?
There are 98.08 Males per 100 Females in Anza.
What is the Ratio of Females per 100 Males in Anza?
There are 101.96 Females per 100 Males in Anza.
What is the Median Population Age in Anza?
Median Population Age in Anza is 43.3 Years.
What is the Average Family Size in Anza
Average Family Size in Anza is 3.5 People.
What is the Average Household Size in Anza
Average Household Size in Anza is 2.6 People.
How Large is the Labor Force in Anza?
There are 990 People in the Labor Forcein in Anza.
What is the Percentage of People in the Labor Force in Anza?
65.1% of People are in the Labor Force in Anza.
What is the Unemployment Rate in Anza?
Unemployment Rate in Anza is 10.3%.