Texas Map & Demographics
Texas Map
Texas Overview
Dec 29, 1845
INCORPORATED
268,597
TOTAL AREA [ SQ MI ]
261,226
LAND AREA [ SQ MI ]
7,371
WATER AREA [ SQ MI ]
1,700
ELEVATION AVG [ FT ]
8,749
ELEVATION HIGH [ FT ]
Sea Level
ELEVATION LOW [ FT ]
112.0
POP DENSITY [ PPL / SQ MI ]
$37,514
PER CAPITA INCOME
$87,594
AVG FAMILY INCOME
$73,035
AVG HOUSEHOLD INCOME
29.4%
WAGE / INCOME GAP [ % ]
70.6¢/ $1
WAGE / INCOME GAP [ $ ]
$11,331
FAMILY INCOME DEFICIT
0.48
INEQUALITY / GINI INDEX
77494
LARGEST ZIP CODE
Houston
LARGEST CITY
Harris County
LARGEST COUNTY
29,243,342
TOTAL POPULATION
14,624,638
MALE POPULATION
14,618,704
FEMALE POPULATION
100.04
MALES / 100 FEMALES
99.96
FEMALES / 100 MALES
35.2
MEDIAN AGE
3.3
AVG FAMILY SIZE
2.7
AVG HOUSEHOLD SIZE
14,776,656
LABOR FORCE [ PEOPLE ]
65.1%
PERCENT IN LABOR FORCE
5.2%
UNEMPLOYMENT RATE
Texas Area Codes
Income in Texas
Income Overview in Texas
Per Capita Income in Texas is $37,514, while median incomes of families and households are $87,594 and $73,035 respectively.
| Characteristic | Number | Measure |
| Per Capita Income | 29,243,342 | $37,514 |
| Median Family Income | 7,173,843 | $87,594 |
| Mean Family Income | 7,173,843 | $117,528 |
| Median Household Income | 10,490,553 | $73,035 |
| Mean Household Income | 10,490,553 | $102,197 |
| Income Deficit | 7,173,843 | $11,331 |
| Wage / Income Gap (%) | 29,243,342 | 29.37% |
| Wage / Income Gap ($) | 29,243,342 | 70.63¢ per $1 |
| Gini / Inequality Index | 29,243,342 | 0.48 |
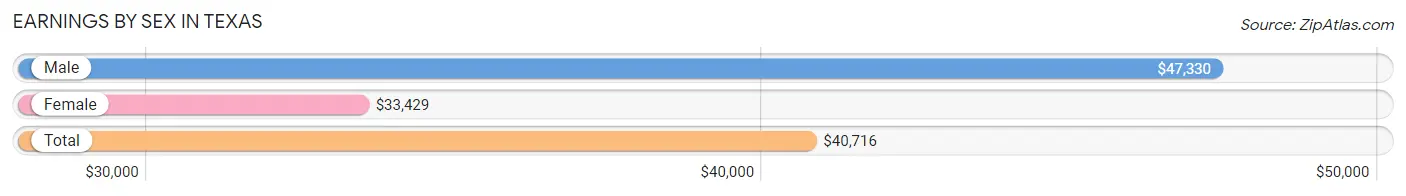
Earnings by Sex in Texas
Average Earnings in Texas are $40,716, $47,330 for men and $33,429 for women, a difference of 29.4%.
| Sex | Number | Average Earnings |
| Male | 8,323,715 (54.3%) | $47,330 |
| Female | 6,996,604 (45.7%) | $33,429 |
| Total | 15,320,319 (100.0%) | $40,716 |
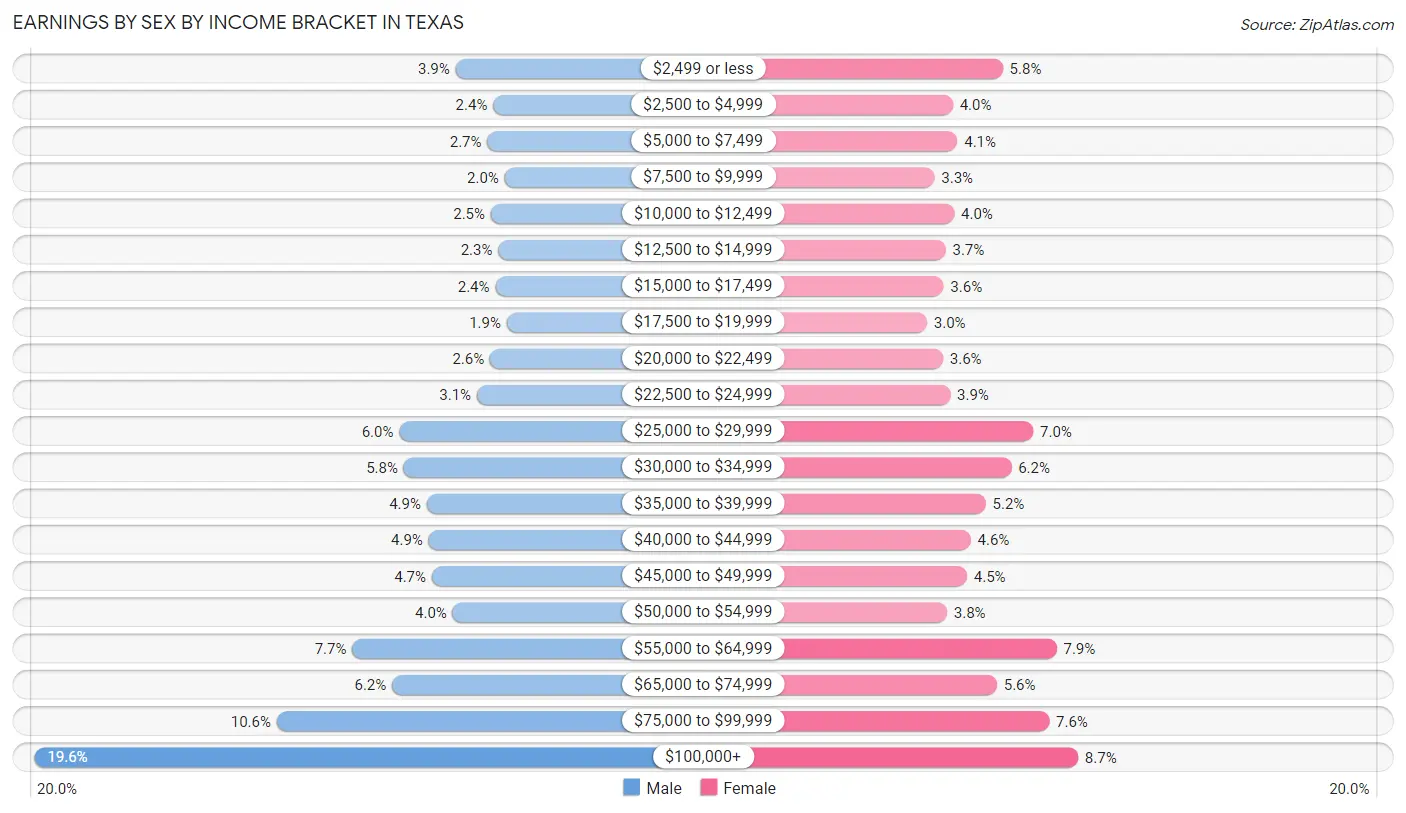
Earnings by Sex by Income Bracket in Texas
The most common earnings brackets in Texas are $100,000+ for men (1,633,831 | 19.6%) and $100,000+ for women (606,160 | 8.7%).
| Income | Male | Female |
| $2,499 or less | 320,394 (3.8%) | 408,459 (5.8%) |
| $2,500 to $4,999 | 202,752 (2.4%) | 277,916 (4.0%) |
| $5,000 to $7,499 | 221,822 (2.7%) | 289,414 (4.1%) |
| $7,500 to $9,999 | 167,618 (2.0%) | 229,149 (3.3%) |
| $10,000 to $12,499 | 210,958 (2.5%) | 281,496 (4.0%) |
| $12,500 to $14,999 | 187,100 (2.2%) | 259,188 (3.7%) |
| $15,000 to $17,499 | 196,485 (2.4%) | 253,412 (3.6%) |
| $17,500 to $19,999 | 160,335 (1.9%) | 209,747 (3.0%) |
| $20,000 to $22,499 | 212,806 (2.6%) | 252,111 (3.6%) |
| $22,500 to $24,999 | 253,656 (3.0%) | 271,074 (3.9%) |
| $25,000 to $29,999 | 495,809 (6.0%) | 488,087 (7.0%) |
| $30,000 to $34,999 | 481,969 (5.8%) | 431,014 (6.2%) |
| $35,000 to $39,999 | 410,609 (4.9%) | 363,817 (5.2%) |
| $40,000 to $44,999 | 404,565 (4.9%) | 324,632 (4.6%) |
| $45,000 to $49,999 | 394,196 (4.7%) | 314,637 (4.5%) |
| $50,000 to $54,999 | 329,404 (4.0%) | 262,578 (3.7%) |
| $55,000 to $64,999 | 642,708 (7.7%) | 549,634 (7.9%) |
| $65,000 to $74,999 | 518,912 (6.2%) | 393,532 (5.6%) |
| $75,000 to $99,999 | 877,786 (10.5%) | 530,547 (7.6%) |
| $100,000+ | 1,633,831 (19.6%) | 606,160 (8.7%) |
| Total | 8,323,715 (100.0%) | 6,996,604 (100.0%) |
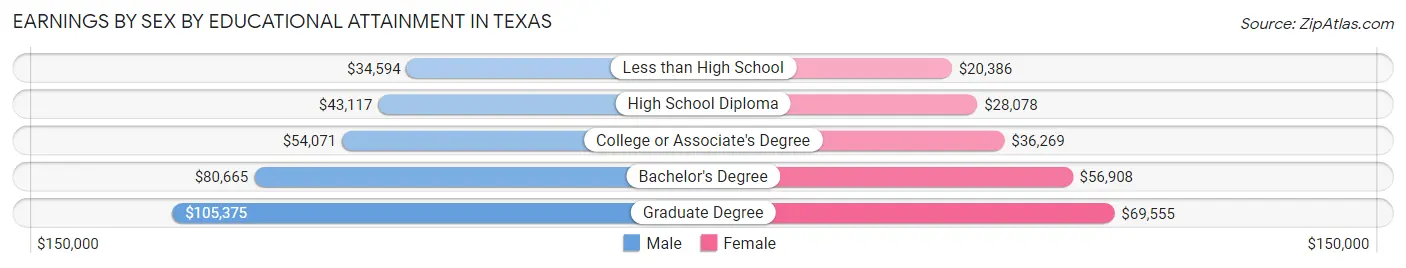
Earnings by Sex by Educational Attainment in Texas
Average earnings in Texas are $55,591 for men and $39,180 for women, a difference of 29.5%. Men with an educational attainment of graduate degree enjoy the highest average annual earnings of $105,375, while those with less than high school education earn the least with $34,594. Women with an educational attainment of graduate degree earn the most with the average annual earnings of $69,555, while those with less than high school education have the smallest earnings of $20,386.
| Educational Attainment | Male Income | Female Income |
| Less than High School | $34,594 | $20,386 |
| High School Diploma | $43,117 | $28,078 |
| College or Associate's Degree | $54,071 | $36,269 |
| Bachelor's Degree | $80,665 | $56,908 |
| Graduate Degree | $105,375 | $69,555 |
| Total | $55,591 | $39,180 |
Family Income in Texas
Family Income Brackets in Texas
According to the Texas family income data, there are 1,398,899 families falling into the $100,000 to $149,999 income range, which is the most common income bracket and makes up 19.5% of all families. Conversely, the $10,000 to $14,999 income bracket is the least frequent group with only 150,651 families (2.1%) belonging to this category.
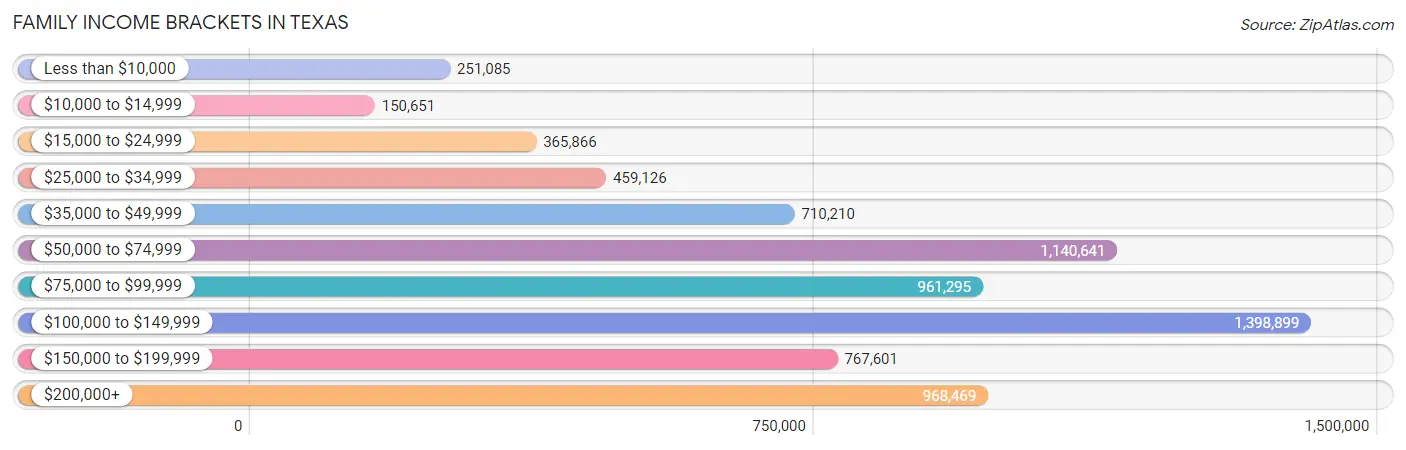
| Income Bracket | # Families | % Families |
| Less than $10,000 | 251,085 | 3.5% |
| $10,000 to $14,999 | 150,651 | 2.1% |
| $15,000 to $24,999 | 365,866 | 5.1% |
| $25,000 to $34,999 | 459,126 | 6.4% |
| $35,000 to $49,999 | 710,210 | 9.9% |
| $50,000 to $74,999 | 1,140,641 | 15.9% |
| $75,000 to $99,999 | 961,295 | 13.4% |
| $100,000 to $149,999 | 1,398,899 | 19.5% |
| $150,000 to $199,999 | 767,601 | 10.7% |
| $200,000+ | 968,469 | 13.5% |
Family Income by Famaliy Size in Texas
4-person families (1,421,206 | 19.8%) account for the highest median family income in Texas with $103,213 per family, while 2-person families (2,964,091 | 41.3%) have the highest median income of $39,322 per family member.
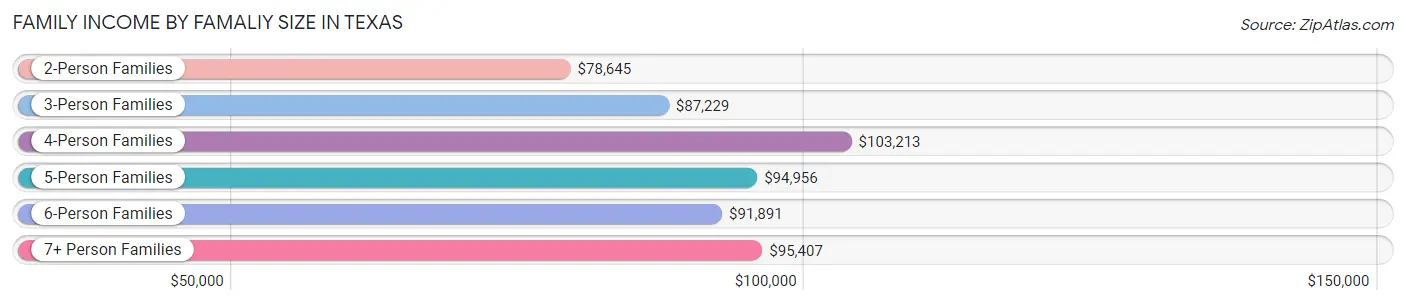
| Income Bracket | # Families | Median Income |
| 2-Person Families | 2,964,091 (41.3%) | $78,645 |
| 3-Person Families | 1,626,249 (22.7%) | $87,229 |
| 4-Person Families | 1,421,206 (19.8%) | $103,213 |
| 5-Person Families | 725,066 (10.1%) | $94,956 |
| 6-Person Families | 279,021 (3.9%) | $91,891 |
| 7+ Person Families | 158,210 (2.2%) | $95,407 |
| Total | 7,173,843 (100.0%) | $87,594 |
Family Income by Number of Earners in Texas
The median family income in Texas is $87,594, with families comprising 3+ earners (872,901) having the highest median family income of $131,791, while families with no earners (846,169) have the lowest median family income of $42,064, accounting for 12.2% and 11.8% of families, respectively.
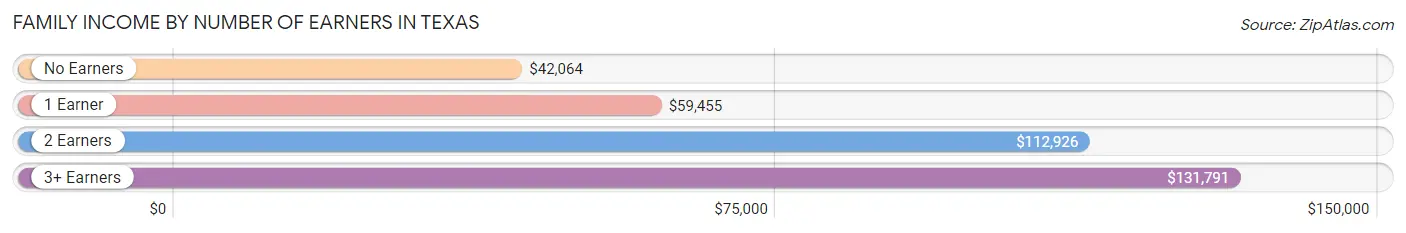
| Number of Earners | # Families | Median Income |
| No Earners | 846,169 (11.8%) | $42,064 |
| 1 Earner | 2,445,632 (34.1%) | $59,455 |
| 2 Earners | 3,009,141 (41.9%) | $112,926 |
| 3+ Earners | 872,901 (12.2%) | $131,791 |
| Total | 7,173,843 (100.0%) | $87,594 |
Household Income in Texas
Household Income Brackets in Texas
With 1,772,903 households falling in the category, the $100,000 to $149,999 income range is the most frequent in Texas, accounting for 16.9% of all households. In contrast, only 377,660 households (3.6%) fall into the $10,000 to $14,999 income bracket, making it the least populous group.
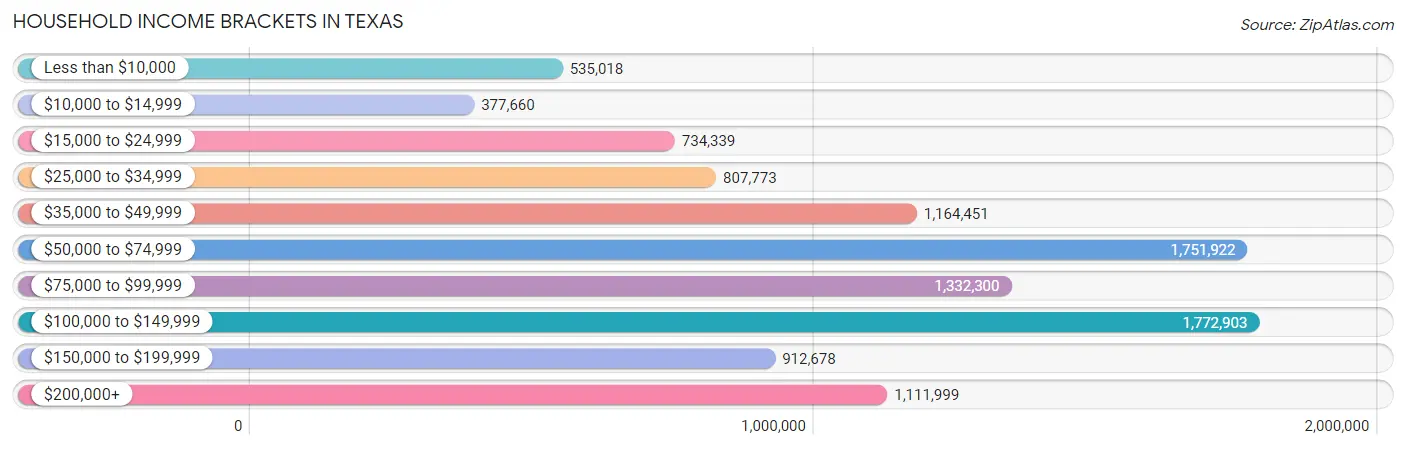
| Income Bracket | # Households | % Households |
| Less than $10,000 | 535,018 | 5.1% |
| $10,000 to $14,999 | 377,660 | 3.6% |
| $15,000 to $24,999 | 734,339 | 7.0% |
| $25,000 to $34,999 | 807,773 | 7.7% |
| $35,000 to $49,999 | 1,164,451 | 11.1% |
| $50,000 to $74,999 | 1,751,922 | 16.7% |
| $75,000 to $99,999 | 1,332,300 | 12.7% |
| $100,000 to $149,999 | 1,772,903 | 16.9% |
| $150,000 to $199,999 | 912,678 | 8.7% |
| $200,000+ | 1,111,999 | 10.6% |
Household Income by Householder Age in Texas
The median household income in Texas is $73,035, with the highest median household income of $88,127 found in the 45 to 64 years age bracket for the primary householder. A total of 3,795,454 households (36.2%) fall into this category. Meanwhile, the 15 to 24 years age bracket for the primary householder has the lowest median household income of $38,830, with 500,562 households (4.8%) in this group.
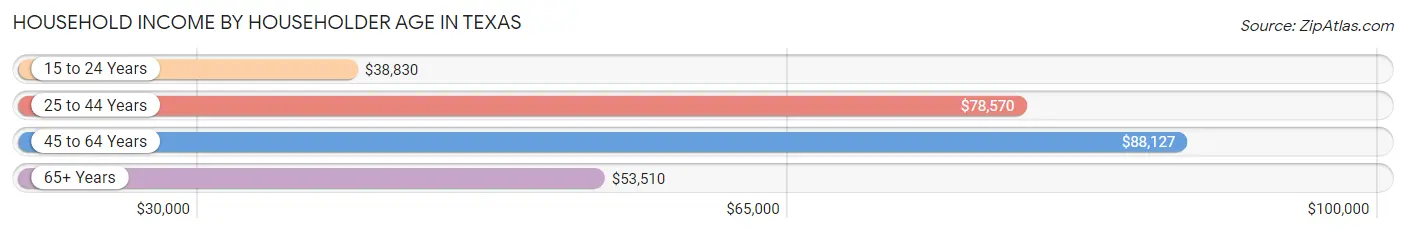
| Income Bracket | # Households | Median Income |
| 15 to 24 Years | 500,562 (4.8%) | $38,830 |
| 25 to 44 Years | 3,930,970 (37.5%) | $78,570 |
| 45 to 64 Years | 3,795,454 (36.2%) | $88,127 |
| 65+ Years | 2,263,567 (21.6%) | $53,510 |
| Total | 10,490,553 (100.0%) | $73,035 |
Poverty in Texas
Income Below Poverty by Sex and Age in Texas
With 12.6% poverty level for males and 15.3% for females among the residents of Texas, under 5 year old males and 18 to 24 year old females are the most vulnerable to poverty, with 203,250 males (21.0%) and 301,146 females (22.6%) in their respective age groups living below the poverty level.
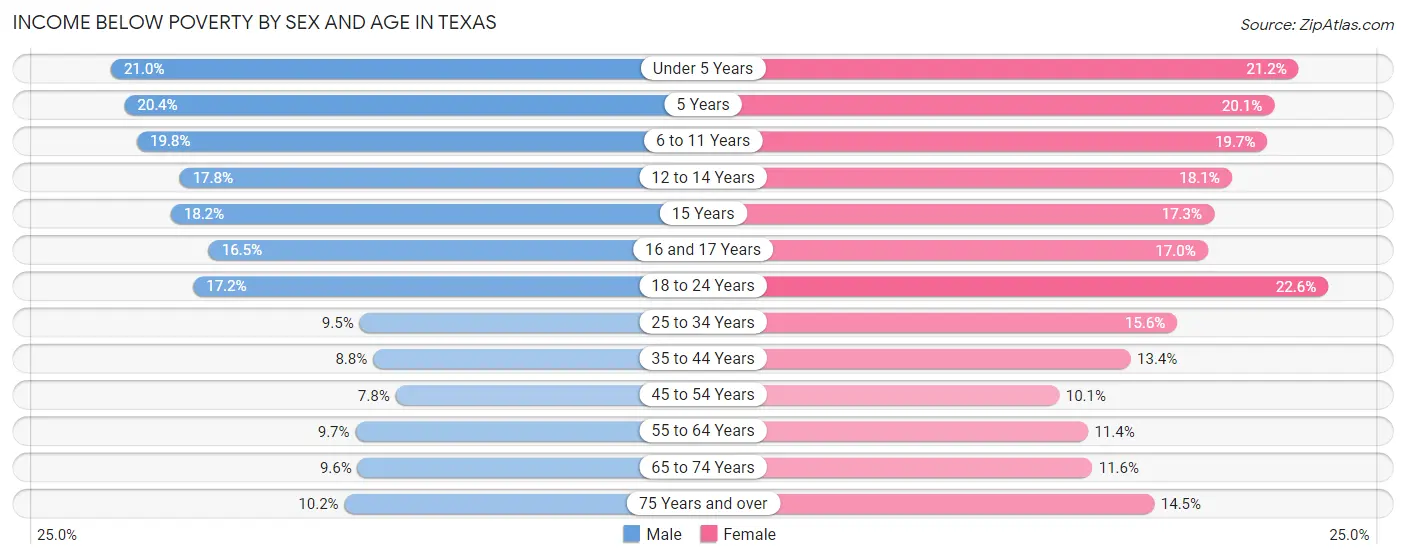
| Age Bracket | Male | Female |
| Under 5 Years | 203,250 (21.0%) | 196,385 (21.2%) |
| 5 Years | 41,359 (20.4%) | 38,287 (20.1%) |
| 6 to 11 Years | 249,367 (19.8%) | 238,036 (19.7%) |
| 12 to 14 Years | 116,185 (17.8%) | 114,097 (18.1%) |
| 15 Years | 38,980 (18.2%) | 35,971 (17.3%) |
| 16 and 17 Years | 71,186 (16.5%) | 69,910 (17.0%) |
| 18 to 24 Years | 240,586 (17.2%) | 301,146 (22.6%) |
| 25 to 34 Years | 197,122 (9.5%) | 319,810 (15.6%) |
| 35 to 44 Years | 175,929 (8.8%) | 264,772 (13.4%) |
| 45 to 54 Years | 137,770 (7.8%) | 179,050 (10.1%) |
| 55 to 64 Years | 152,979 (9.7%) | 188,234 (11.4%) |
| 65 to 74 Years | 101,604 (9.6%) | 139,583 (11.6%) |
| 75 Years and over | 60,096 (10.2%) | 118,632 (14.5%) |
| Total | 1,786,413 (12.6%) | 2,203,913 (15.3%) |
Income Above Poverty by Sex and Age in Texas
According to the poverty statistics in Texas, males aged 45 to 54 years and females aged 45 to 54 years are the age groups that are most secure financially, with 92.2% of males and 89.9% of females in these age groups living above the poverty line.
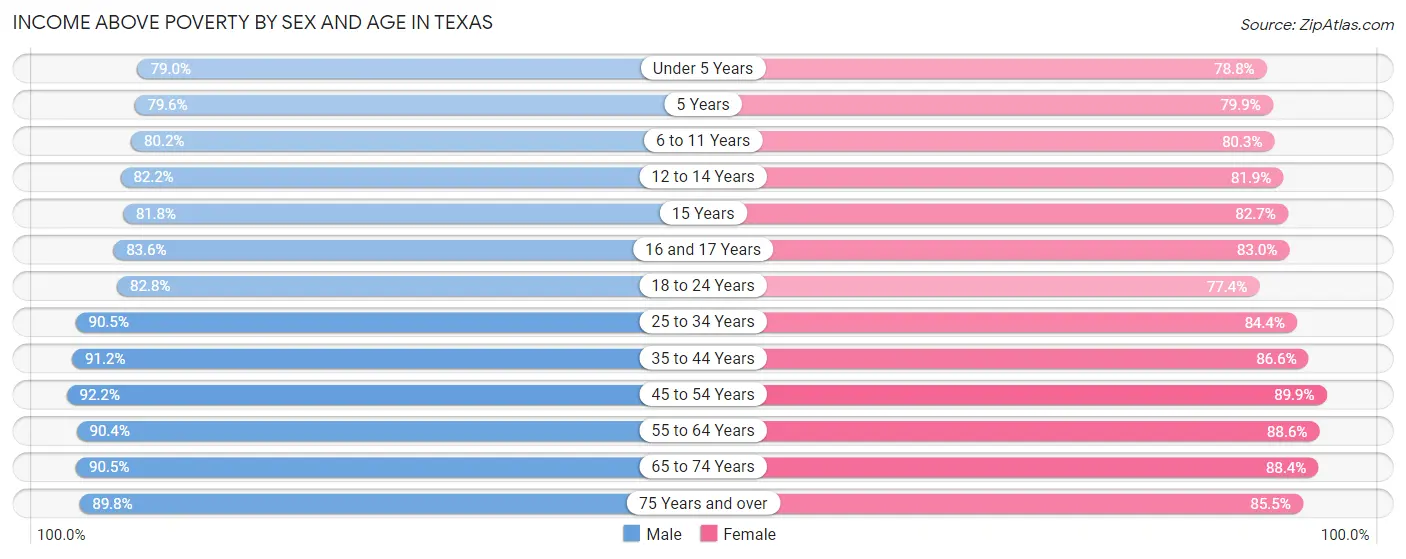
| Age Bracket | Male | Female |
| Under 5 Years | 765,147 (79.0%) | 730,446 (78.8%) |
| 5 Years | 161,683 (79.6%) | 152,583 (79.9%) |
| 6 to 11 Years | 1,011,128 (80.2%) | 967,671 (80.3%) |
| 12 to 14 Years | 536,590 (82.2%) | 516,683 (81.9%) |
| 15 Years | 175,071 (81.8%) | 172,476 (82.7%) |
| 16 and 17 Years | 361,490 (83.6%) | 342,030 (83.0%) |
| 18 to 24 Years | 1,160,659 (82.8%) | 1,033,749 (77.4%) |
| 25 to 34 Years | 1,887,441 (90.5%) | 1,735,359 (84.4%) |
| 35 to 44 Years | 1,816,510 (91.2%) | 1,714,379 (86.6%) |
| 45 to 54 Years | 1,631,126 (92.2%) | 1,599,657 (89.9%) |
| 55 to 64 Years | 1,432,203 (90.3%) | 1,462,602 (88.6%) |
| 65 to 74 Years | 962,857 (90.4%) | 1,064,048 (88.4%) |
| 75 Years and over | 531,412 (89.8%) | 700,605 (85.5%) |
| Total | 12,433,317 (87.4%) | 12,192,288 (84.7%) |
Income Below Poverty Among Married-Couple Families in Texas
The poverty statistics for married-couple families in Texas show that 5.9% or 308,422 of the total 5,200,043 families live below the poverty line. Families with 5 or more children have the highest poverty rate of 28.4%, comprising of 12,305 families. On the other hand, families with no children have the lowest poverty rate of 4.3%, which includes 116,938 families.
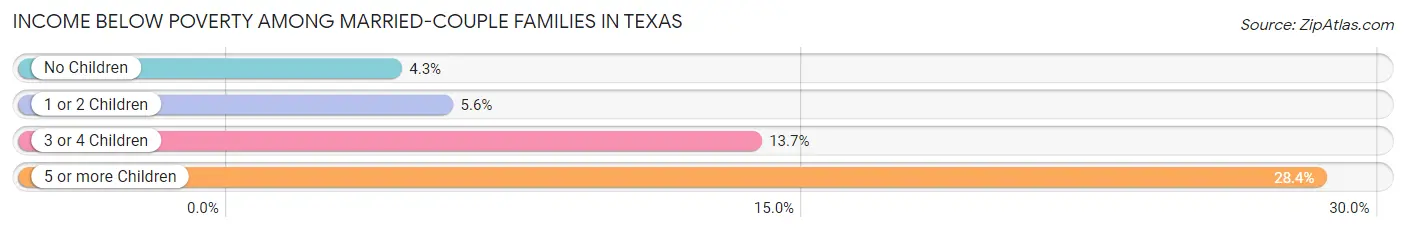
| Children | Above Poverty | Below Poverty |
| No Children | 2,611,584 (95.7%) | 116,938 (4.3%) |
| 1 or 2 Children | 1,794,311 (94.4%) | 107,056 (5.6%) |
| 3 or 4 Children | 454,727 (86.3%) | 72,123 (13.7%) |
| 5 or more Children | 30,999 (71.6%) | 12,305 (28.4%) |
| Total | 4,891,621 (94.1%) | 308,422 (5.9%) |
Income Below Poverty Among Single-Parent Households in Texas
According to the poverty data in Texas, 12.9% or 71,232 single-father households and 27.2% or 385,783 single-mother households are living below the poverty line. Among single-father households, those with 5 or more children have the highest poverty rate, with 2,309 households (48.1%) experiencing poverty. Likewise, among single-mother households, those with 5 or more children have the highest poverty rate, with 15,283 households (73.1%) falling below the poverty line.
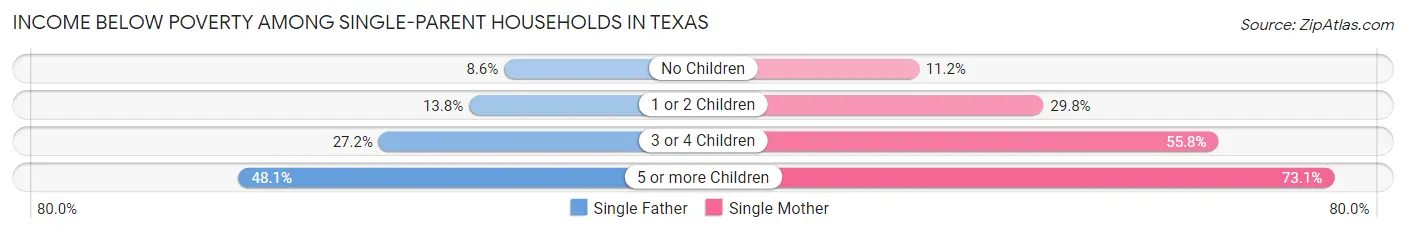
| Children | Single Father | Single Mother |
| No Children | 21,498 (8.6%) | 55,651 (11.2%) |
| 1 or 2 Children | 34,436 (13.8%) | 215,017 (29.8%) |
| 3 or 4 Children | 12,989 (27.2%) | 99,832 (55.8%) |
| 5 or more Children | 2,309 (48.1%) | 15,283 (73.1%) |
| Total | 71,232 (12.9%) | 385,783 (27.2%) |
Income Below Poverty Among Married-Couple vs Single-Parent Households in Texas
The poverty data for Texas shows that 308,422 of the married-couple family households (5.9%) and 457,015 of the single-parent households (23.2%) are living below the poverty level. Within the married-couple family households, those with 5 or more children have the highest poverty rate, with 12,305 households (28.4%) falling below the poverty line. Among the single-parent households, those with 5 or more children have the highest poverty rate, with 17,592 household (68.4%) living below poverty.
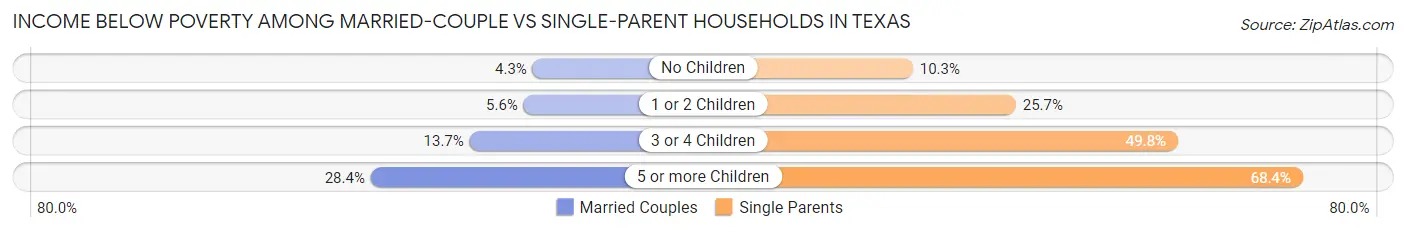
| Children | Married-Couple Families | Single-Parent Households |
| No Children | 116,938 (4.3%) | 77,149 (10.3%) |
| 1 or 2 Children | 107,056 (5.6%) | 249,453 (25.7%) |
| 3 or 4 Children | 72,123 (13.7%) | 112,821 (49.8%) |
| 5 or more Children | 12,305 (28.4%) | 17,592 (68.4%) |
| Total | 308,422 (5.9%) | 457,015 (23.2%) |
Largest Zip Codes by Population in Texas
The largest zip codes in Texas by population are 77494 (130,920), 77449 (122,098), 78660 (113,386), 77084 (108,557), and 77433 (107,887).
1.77494
130,920 (0.45%)
2.77449
122,098 (0.42%)
3.78660
113,386 (0.39%)
4.77084
108,557 (0.37%)
5.77433
107,887 (0.37%)
6.79936
107,512 (0.37%)
7.77573
95,704 (0.33%)
8.79938
95,452 (0.33%)
9.75052
94,636 (0.32%)
10.78245
92,770 (0.32%)
11.77479
91,618 (0.31%)
12.78130
91,275 (0.31%)
13.77429
90,790 (0.31%)
14.77584
90,364 (0.31%)
15.78613
88,189 (0.30%)
16.75217
87,154 (0.30%)
17.78641
87,106 (0.30%)
18.78521
87,040 (0.30%)
19.78666
86,530 (0.30%)
20.75035
83,930 (0.29%)
21.78542
83,925 (0.29%)
22.77379
83,247 (0.28%)
23.76063
80,101 (0.27%)
24.77459
79,937 (0.27%)
25.78577
79,496 (0.27%)
26.79928
79,330 (0.27%)
27.78254
76,945 (0.26%)
28.79912
76,890 (0.26%)
29.78572
76,753 (0.26%)
30.77407
76,600 (0.26%)
Largest Cities by Population in Texas
The largest cities in Texas by population are Houston (2,296,253), San Antonio (1,445,662), Dallas (1,300,642), Austin (958,202), and Fort Worth (924,663).
1.Houston
2,296,253 (7.85%)
1,445,662 (4.94%)
3.Dallas
1,300,642 (4.45%)
4.Austin
958,202 (3.28%)
924,663 (3.16%)
6.El Paso
677,181 (2.32%)
393,469 (1.35%)
317,804 (1.09%)
9.Plano
284,948 (0.97%)
10.Lubbock
258,190 (0.88%)
11.Laredo
255,293 (0.87%)
12.Irving
254,962 (0.87%)
13.Garland
244,026 (0.83%)
14.Frisco
202,075 (0.69%)
15.Amarillo
200,360 (0.69%)
197,279 (0.67%)
17.Mckinney
196,160 (0.67%)
18.Brownsville
186,999 (0.64%)
19.Killeen
153,708 (0.53%)
20.Pasadena
150,620 (0.52%)
21.Mcallen
142,722 (0.49%)
22.Denton
142,262 (0.49%)
23.Waco
140,545 (0.48%)
24.Midland
132,490 (0.45%)
25.Carrollton
132,284 (0.45%)
26.Abilene
126,356 (0.43%)
27.Lewisville
125,028 (0.43%)
28.Pearland
124,478 (0.43%)
29.Round Rock
120,465 (0.41%)
120,451 (0.41%)
Largest Counties by Population in Texas
The largest counties in Texas by population are Harris County (4,726,177), Dallas County (2,604,053), Tarrant County (2,113,854), Bexar County (2,014,059), and Travis County (1,289,054).
4,726,177 (16.16%)
2,604,053 (8.90%)
2,113,854 (7.23%)
2,014,059 (6.89%)
1,289,054 (4.41%)
1,079,153 (3.69%)
914,870 (3.13%)
873,167 (2.99%)
863,832 (2.95%)
832,607 (2.85%)
629,989 (2.15%)
617,396 (2.11%)
421,854 (1.44%)
374,600 (1.28%)
15.Bell County
372,821 (1.27%)
353,245 (1.21%)
350,801 (1.20%)
311,509 (1.07%)
19.Webb County
267,282 (0.91%)
261,090 (0.89%)
254,942 (0.87%)
22.Hays County
245,351 (0.84%)
23.Smith County
234,667 (0.80%)
234,548 (0.80%)
25.Ellis County
195,509 (0.67%)
182,690 (0.62%)
173,828 (0.59%)
169,393 (0.58%)
29.Comal County
165,201 (0.56%)
30.Ector County
162,300 (0.55%)
Race in Texas
The most populous races in Texas are White / Caucasian (17,293,460 | 59.1%), Hispanic or Latino (11,665,280 | 39.9%), and Two or more Races (4,407,783 | 15.1%).
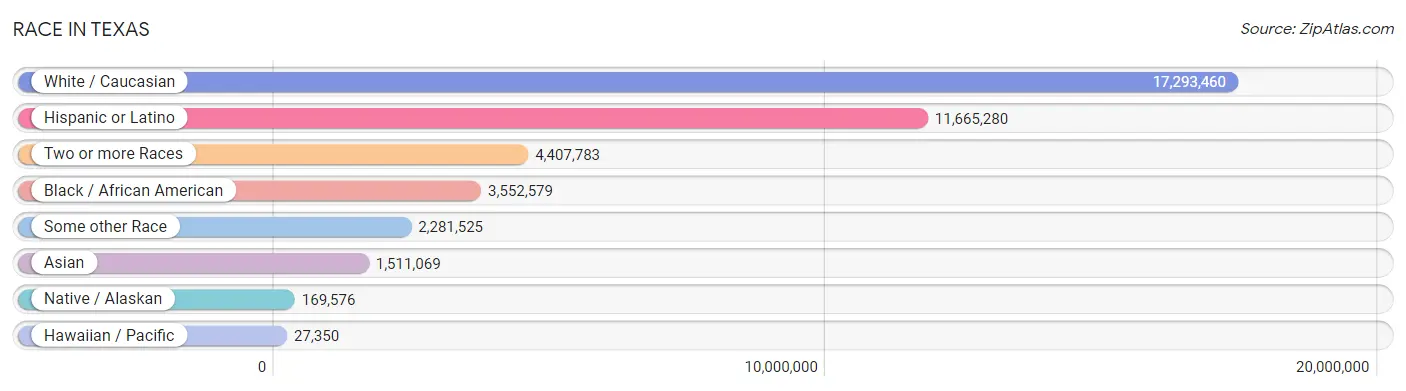
| Race | # Population | % Population |
| Asian | 1,511,069 | 5.2% |
| Black / African American | 3,552,579 | 12.1% |
| Hawaiian / Pacific | 27,350 | 0.1% |
| Hispanic or Latino | 11,665,280 | 39.9% |
| Native / Alaskan | 169,576 | 0.6% |
| White / Caucasian | 17,293,460 | 59.1% |
| Two or more Races | 4,407,783 | 15.1% |
| Some other Race | 2,281,525 | 7.8% |
| Total | 29,243,342 | 100.0% |
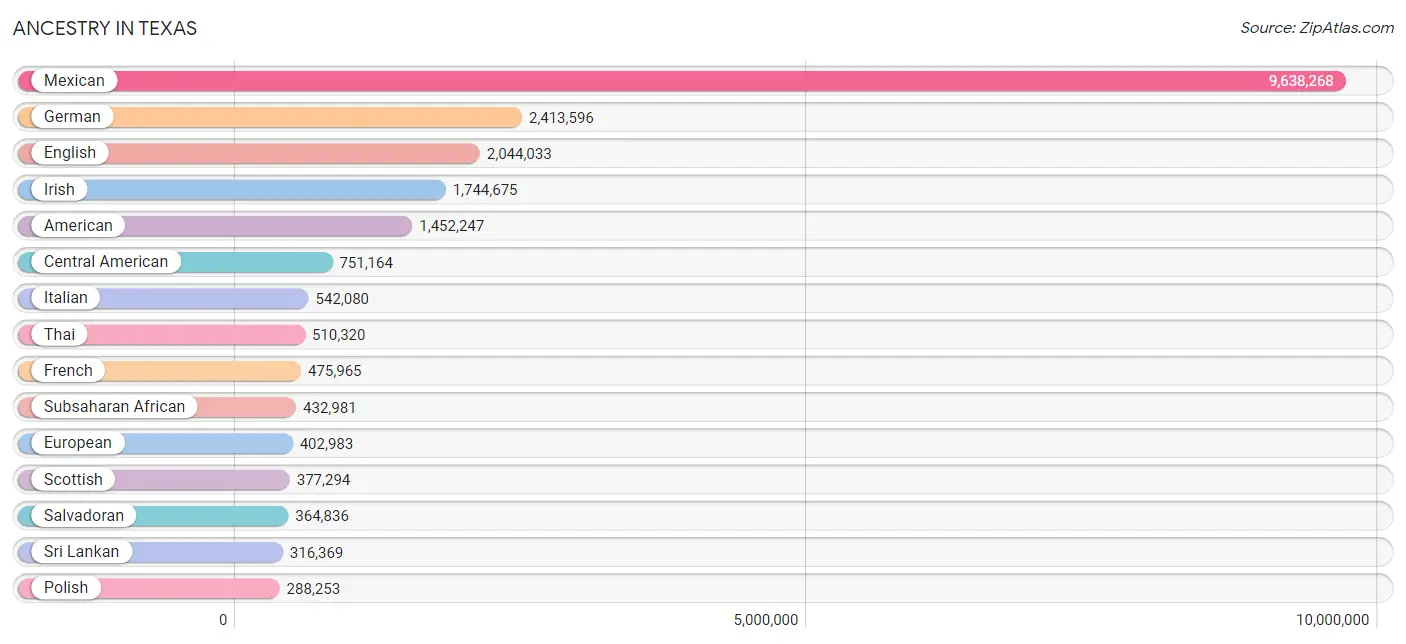
Ancestry in Texas
The most populous ancestries reported in Texas are Mexican (9,638,268 | 33.0%), German (2,413,596 | 8.3%), English (2,044,033 | 7.0%), Irish (1,744,675 | 6.0%), and American (1,452,247 | 5.0%), together accounting for 59.1% of all Texas residents.
| Ancestry | # Population | % Population |
| Afghan | 12,941 | 0.0% |
| African | 195,696 | 0.7% |
| Alaska Native | 981 | 0.0% |
| Alaskan Athabascan | 225 | 0.0% |
| Albanian | 5,370 | 0.0% |
| Aleut | 401 | 0.0% |
| Alsatian | 2,284 | 0.0% |
| American | 1,452,247 | 5.0% |
| Apache | 17,630 | 0.1% |
| Arab | 165,625 | 0.6% |
| Arapaho | 302 | 0.0% |
| Argentinean | 19,729 | 0.1% |
| Armenian | 6,530 | 0.0% |
| Assyrian / Chaldean / Syriac | 1,029 | 0.0% |
| Australian | 6,100 | 0.0% |
| Austrian | 27,160 | 0.1% |
| Bahamian | 3,376 | 0.0% |
| Bangladeshi | 3,288 | 0.0% |
| Barbadian | 2,665 | 0.0% |
| Basque | 3,203 | 0.0% |
| Belgian | 14,123 | 0.1% |
| Belizean | 5,434 | 0.0% |
| Bermudan | 281 | 0.0% |
| Bhutanese | 68,134 | 0.2% |
| Blackfeet | 11,607 | 0.0% |
| Bolivian | 6,872 | 0.0% |
| Brazilian | 23,366 | 0.1% |
| British | 145,103 | 0.5% |
| British West Indian | 4,328 | 0.0% |
| Bulgarian | 4,287 | 0.0% |
| Burmese | 118,109 | 0.4% |
| Cajun | 17,430 | 0.1% |
| Cambodian | 1,061 | 0.0% |
| Canadian | 32,388 | 0.1% |
| Cape Verdean | 557 | 0.0% |
| Carpatho Rusyn | 190 | 0.0% |
| Celtic | 3,826 | 0.0% |
| Central American | 751,164 | 2.6% |
| Central American Indian | 35,710 | 0.1% |
| Cherokee | 86,585 | 0.3% |
| Cheyenne | 878 | 0.0% |
| Chickasaw | 9,051 | 0.0% |
| Chilean | 11,632 | 0.0% |
| Chinese | 672 | 0.0% |
| Chippewa | 2,633 | 0.0% |
| Choctaw | 30,877 | 0.1% |
| Colombian | 96,015 | 0.3% |
| Colville | 92 | 0.0% |
| Comanche | 7,371 | 0.0% |
| Costa Rican | 11,344 | 0.0% |
| Cree | 335 | 0.0% |
| Creek | 5,595 | 0.0% |
| Croatian | 11,684 | 0.0% |
| Crow | 700 | 0.0% |
| Cuban | 112,743 | 0.4% |
| Cypriot | 302 | 0.0% |
| Czech | 185,504 | 0.6% |
| Czechoslovakian | 20,216 | 0.1% |
| Danish | 46,496 | 0.2% |
| Delaware | 1,198 | 0.0% |
| Dominican | 31,703 | 0.1% |
| Dutch | 160,302 | 0.5% |
| Dutch West Indian | 6,005 | 0.0% |
| Eastern European | 34,818 | 0.1% |
| Ecuadorian | 21,592 | 0.1% |
| Egyptian | 19,434 | 0.1% |
| English | 2,044,033 | 7.0% |
| Estonian | 1,088 | 0.0% |
| Ethiopian | 29,054 | 0.1% |
| European | 402,983 | 1.4% |
| Fijian | 1,203 | 0.0% |
| Filipino | 21,789 | 0.1% |
| Finnish | 17,261 | 0.1% |
| French | 475,965 | 1.6% |
| French American Indian | 1,877 | 0.0% |
| French Canadian | 62,269 | 0.2% |
| German | 2,413,596 | 8.3% |
| German Russian | 1,850 | 0.0% |
| Ghanaian | 10,798 | 0.0% |
| Greek | 47,108 | 0.2% |
| Guamanian / Chamorro | 14,862 | 0.1% |
| Guatemalan | 125,510 | 0.4% |
| Guyanese | 2,893 | 0.0% |
| Haitian | 13,077 | 0.0% |
| Hmong | 188 | 0.0% |
| Honduran | 196,323 | 0.7% |
| Hopi | 680 | 0.0% |
| Houma | 351 | 0.0% |
| Hungarian | 34,970 | 0.1% |
| Icelander | 2,540 | 0.0% |
| Indian (Asian) | 270,337 | 0.9% |
| Indonesian | 17,492 | 0.1% |
| Inupiat | 1,345 | 0.0% |
| Iranian | 38,783 | 0.1% |
| Iraqi | 19,107 | 0.1% |
| Irish | 1,744,675 | 6.0% |
| Iroquois | 2,822 | 0.0% |
| Israeli | 6,347 | 0.0% |
| Italian | 542,080 | 1.8% |
| Jamaican | 35,083 | 0.1% |
| Japanese | 22,458 | 0.1% |
| Jordanian | 12,000 | 0.0% |
| Kenyan | 14,373 | 0.1% |
| Kiowa | 680 | 0.0% |
| Korean | 214,854 | 0.7% |
| Laotian | 11,304 | 0.0% |
| Latvian | 2,500 | 0.0% |
| Lebanese | 36,524 | 0.1% |
| Liberian | 5,749 | 0.0% |
| Lithuanian | 16,437 | 0.1% |
| Lumbee | 767 | 0.0% |
| Luxembourger | 1,015 | 0.0% |
| Macedonian | 1,881 | 0.0% |
| Malaysian | 18,854 | 0.1% |
| Maltese | 1,343 | 0.0% |
| Marshallese | 67 | 0.0% |
| Menominee | 232 | 0.0% |
| Mexican | 9,638,268 | 33.0% |
| Mexican American Indian | 67,933 | 0.2% |
| Mongolian | 4,170 | 0.0% |
| Moroccan | 6,884 | 0.0% |
| Native Hawaiian | 22,684 | 0.1% |
| Navajo | 10,553 | 0.0% |
| Nepalese | 60 | 0.0% |
| New Zealander | 1,510 | 0.0% |
| Nicaraguan | 29,806 | 0.1% |
| Nigerian | 113,765 | 0.4% |
| Northern European | 29,137 | 0.1% |
| Norwegian | 143,246 | 0.5% |
| Okinawan | 1,025 | 0.0% |
| Osage | 2,344 | 0.0% |
| Ottawa | 851 | 0.0% |
| Paiute | 416 | 0.0% |
| Pakistani | 22,773 | 0.1% |
| Palestinian | 13,555 | 0.1% |
| Panamanian | 21,184 | 0.1% |
| Paraguayan | 1,578 | 0.0% |
| Pennsylvania German | 4,930 | 0.0% |
| Peruvian | 36,801 | 0.1% |
| Pima | 288 | 0.0% |
| Polish | 288,253 | 1.0% |
| Portuguese | 43,751 | 0.2% |
| Potawatomi | 1,997 | 0.0% |
| Pueblo | 5,378 | 0.0% |
| Puerto Rican | 244,719 | 0.8% |
| Puget Sound Salish | 70 | 0.0% |
| Romanian | 17,828 | 0.1% |
| Russian | 76,029 | 0.3% |
| Salvadoran | 364,836 | 1.3% |
| Samoan | 9,981 | 0.0% |
| Scandinavian | 52,695 | 0.2% |
| Scotch-Irish | 229,867 | 0.8% |
| Scottish | 377,294 | 1.3% |
| Seminole | 2,234 | 0.0% |
| Senegalese | 1,406 | 0.0% |
| Serbian | 7,253 | 0.0% |
| Shoshone | 381 | 0.0% |
| Sierra Leonean | 2,392 | 0.0% |
| Sioux | 5,401 | 0.0% |
| Slavic | 4,953 | 0.0% |
| Slovak | 12,004 | 0.0% |
| Slovene | 6,547 | 0.0% |
| Somali | 3,177 | 0.0% |
| South African | 7,704 | 0.0% |
| South American | 282,498 | 1.0% |
| South American Indian | 2,765 | 0.0% |
| Soviet Union | 215 | 0.0% |
| Spaniard | 109,964 | 0.4% |
| Spanish | 71,672 | 0.3% |
| Spanish American | 2,942 | 0.0% |
| Spanish American Indian | 1,051 | 0.0% |
| Sri Lankan | 316,369 | 1.1% |
| Subsaharan African | 432,981 | 1.5% |
| Sudanese | 6,506 | 0.0% |
| Swedish | 138,812 | 0.5% |
| Swiss | 32,658 | 0.1% |
| Syrian | 11,084 | 0.0% |
| Taiwanese | 178 | 0.0% |
| Thai | 510,320 | 1.8% |
| Tlingit-Haida | 232 | 0.0% |
| Tohono O'Odham | 368 | 0.0% |
| Tongan | 2,671 | 0.0% |
| Trinidadian and Tobagonian | 8,874 | 0.0% |
| Turkish | 17,668 | 0.1% |
| U.S. Virgin Islander | 1,437 | 0.0% |
| Ugandan | 1,950 | 0.0% |
| Ukrainian | 27,658 | 0.1% |
| Uruguayan | 3,484 | 0.0% |
| Ute | 530 | 0.0% |
| Venezuelan | 83,318 | 0.3% |
| Vietnamese | 13,488 | 0.1% |
| Welsh | 108,465 | 0.4% |
| West Indian | 11,580 | 0.0% |
| Yakama | 201 | 0.0% |
| Yaqui | 2,398 | 0.0% |
| Yugoslavian | 8,344 | 0.0% |
| Yuman | 113 | 0.0% |
| Yup'ik | 293 | 0.0% |
| Zimbabwean | 2,216 | 0.0% | View All 199 Rows |
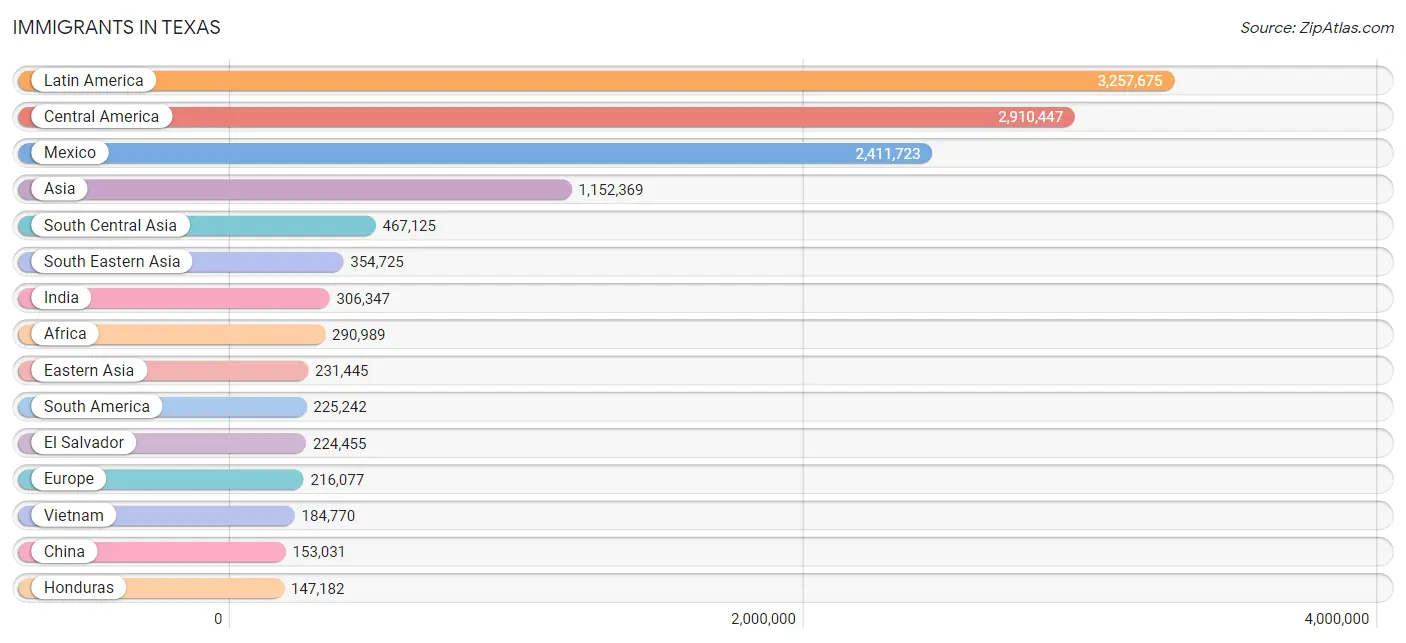
Immigrants in Texas
The most numerous immigrant groups reported in Texas came from Latin America (3,257,675 | 11.1%), Central America (2,910,447 | 10.0%), Mexico (2,411,723 | 8.3%), Asia (1,152,369 | 3.9%), and South Central Asia (467,125 | 1.6%), together accounting for 34.9% of all Texas residents.
| Immigration Origin | # Population | % Population |
| Afghanistan | 13,197 | 0.1% |
| Africa | 290,989 | 1.0% |
| Albania | 1,967 | 0.0% |
| Argentina | 13,034 | 0.0% |
| Armenia | 910 | 0.0% |
| Asia | 1,152,369 | 3.9% |
| Australia | 7,179 | 0.0% |
| Austria | 1,284 | 0.0% |
| Azores | 63 | 0.0% |
| Bahamas | 1,963 | 0.0% |
| Bangladesh | 16,549 | 0.1% |
| Barbados | 1,820 | 0.0% |
| Belarus | 1,251 | 0.0% |
| Belgium | 1,892 | 0.0% |
| Belize | 4,295 | 0.0% |
| Bolivia | 4,409 | 0.0% |
| Bosnia and Herzegovina | 4,252 | 0.0% |
| Brazil | 24,723 | 0.1% |
| Bulgaria | 2,220 | 0.0% |
| Cabo Verde | 120 | 0.0% |
| Cambodia | 9,997 | 0.0% |
| Cameroon | 15,833 | 0.1% |
| Canada | 55,371 | 0.2% |
| Caribbean | 121,986 | 0.4% |
| Central America | 2,910,447 | 10.0% |
| Chile | 7,230 | 0.0% |
| China | 153,031 | 0.5% |
| Colombia | 61,555 | 0.2% |
| Congo | 6,376 | 0.0% |
| Costa Rica | 6,336 | 0.0% |
| Croatia | 816 | 0.0% |
| Cuba | 62,978 | 0.2% |
| Czechoslovakia | 2,130 | 0.0% |
| Denmark | 1,930 | 0.0% |
| Dominica | 2,295 | 0.0% |
| Dominican Republic | 13,763 | 0.1% |
| Eastern Africa | 75,503 | 0.3% |
| Eastern Asia | 231,445 | 0.8% |
| Eastern Europe | 65,032 | 0.2% |
| Ecuador | 12,456 | 0.0% |
| Egypt | 14,588 | 0.1% |
| El Salvador | 224,455 | 0.8% |
| England | 20,885 | 0.1% |
| Eritrea | 6,728 | 0.0% |
| Ethiopia | 24,705 | 0.1% |
| Europe | 216,077 | 0.7% |
| Fiji | 573 | 0.0% |
| France | 12,168 | 0.0% |
| Germany | 37,989 | 0.1% |
| Ghana | 12,580 | 0.0% |
| Greece | 3,811 | 0.0% |
| Grenada | 621 | 0.0% |
| Guatemala | 87,382 | 0.3% |
| Guyana | 2,928 | 0.0% |
| Haiti | 4,598 | 0.0% |
| Honduras | 147,182 | 0.5% |
| Hong Kong | 9,629 | 0.0% |
| Hungary | 2,637 | 0.0% |
| India | 306,347 | 1.1% |
| Indonesia | 8,808 | 0.0% |
| Iran | 28,963 | 0.1% |
| Iraq | 26,598 | 0.1% |
| Ireland | 4,334 | 0.0% |
| Israel | 5,041 | 0.0% |
| Italy | 7,705 | 0.0% |
| Jamaica | 17,748 | 0.1% |
| Japan | 17,796 | 0.1% |
| Jordan | 8,922 | 0.0% |
| Kazakhstan | 2,502 | 0.0% |
| Kenya | 20,458 | 0.1% |
| Korea | 60,172 | 0.2% |
| Kuwait | 4,349 | 0.0% |
| Laos | 9,141 | 0.0% |
| Latin America | 3,257,675 | 11.1% |
| Latvia | 646 | 0.0% |
| Lebanon | 9,332 | 0.0% |
| Liberia | 5,906 | 0.0% |
| Lithuania | 642 | 0.0% |
| Malaysia | 8,227 | 0.0% |
| Mexico | 2,411,723 | 8.3% |
| Micronesia | 1,934 | 0.0% |
| Middle Africa | 30,968 | 0.1% |
| Moldova | 996 | 0.0% |
| Morocco | 4,509 | 0.0% |
| Nepal | 27,480 | 0.1% |
| Netherlands | 5,793 | 0.0% |
| Nicaragua | 18,642 | 0.1% |
| Nigeria | 96,110 | 0.3% |
| North Macedonia | 1,086 | 0.0% |
| Northern Africa | 30,660 | 0.1% |
| Northern Europe | 66,462 | 0.2% |
| Norway | 1,899 | 0.0% |
| Oceania | 14,629 | 0.1% |
| Pakistan | 62,159 | 0.2% |
| Panama | 9,838 | 0.0% |
| Peru | 21,746 | 0.1% |
| Philippines | 103,148 | 0.4% |
| Poland | 7,897 | 0.0% |
| Portugal | 1,905 | 0.0% |
| Romania | 6,849 | 0.0% |
| Russia | 16,984 | 0.1% |
| Saudi Arabia | 9,294 | 0.0% |
| Scotland | 5,917 | 0.0% |
| Senegal | 1,960 | 0.0% |
| Serbia | 2,124 | 0.0% |
| Sierra Leone | 3,468 | 0.0% |
| Singapore | 2,961 | 0.0% |
| Somalia | 2,614 | 0.0% |
| South Africa | 11,402 | 0.0% |
| South America | 225,242 | 0.8% |
| South Central Asia | 467,125 | 1.6% |
| South Eastern Asia | 354,725 | 1.2% |
| Southern Europe | 22,897 | 0.1% |
| Spain | 9,236 | 0.0% |
| Sri Lanka | 5,523 | 0.0% |
| St. Vincent and the Grenadines | 385 | 0.0% |
| Sudan | 5,241 | 0.0% |
| Sweden | 2,851 | 0.0% |
| Switzerland | 1,871 | 0.0% |
| Syria | 6,586 | 0.0% |
| Taiwan | 27,844 | 0.1% |
| Thailand | 15,368 | 0.1% |
| Trinidad and Tobago | 9,664 | 0.0% |
| Turkey | 13,298 | 0.1% |
| Uganda | 3,573 | 0.0% |
| Ukraine | 8,866 | 0.0% |
| Uruguay | 2,774 | 0.0% |
| Uzbekistan | 1,508 | 0.0% |
| Venezuela | 72,413 | 0.3% |
| Vietnam | 184,770 | 0.6% |
| West Indies | 962 | 0.0% |
| Western Africa | 130,638 | 0.4% |
| Western Asia | 94,436 | 0.3% |
| Western Europe | 61,150 | 0.2% |
| Yemen | 755 | 0.0% |
| Zaire | 5,522 | 0.0% |
| Zimbabwe | 4,593 | 0.0% | View All 137 Rows |
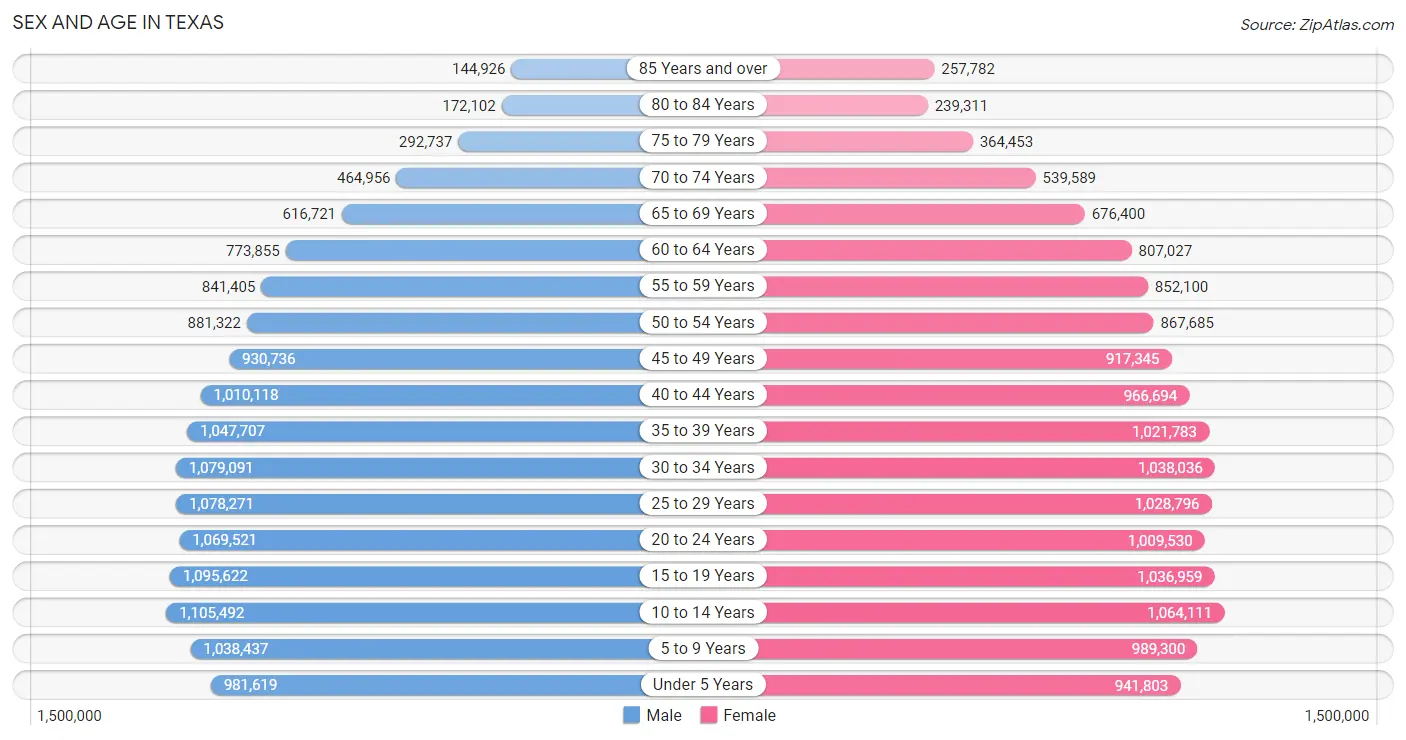
Sex and Age in Texas
Sex and Age in Texas
The most populous age groups in Texas are 10 to 14 Years (1,105,492 | 7.6%) for men and 10 to 14 Years (1,064,111 | 7.3%) for women.
| Age Bracket | Male | Female |
| Under 5 Years | 981,619 (6.7%) | 941,803 (6.4%) |
| 5 to 9 Years | 1,038,437 (7.1%) | 989,300 (6.8%) |
| 10 to 14 Years | 1,105,492 (7.6%) | 1,064,111 (7.3%) |
| 15 to 19 Years | 1,095,622 (7.5%) | 1,036,959 (7.1%) |
| 20 to 24 Years | 1,069,521 (7.3%) | 1,009,530 (6.9%) |
| 25 to 29 Years | 1,078,271 (7.4%) | 1,028,796 (7.0%) |
| 30 to 34 Years | 1,079,091 (7.4%) | 1,038,036 (7.1%) |
| 35 to 39 Years | 1,047,707 (7.2%) | 1,021,783 (7.0%) |
| 40 to 44 Years | 1,010,118 (6.9%) | 966,694 (6.6%) |
| 45 to 49 Years | 930,736 (6.4%) | 917,345 (6.3%) |
| 50 to 54 Years | 881,322 (6.0%) | 867,685 (5.9%) |
| 55 to 59 Years | 841,405 (5.8%) | 852,100 (5.8%) |
| 60 to 64 Years | 773,855 (5.3%) | 807,027 (5.5%) |
| 65 to 69 Years | 616,721 (4.2%) | 676,400 (4.6%) |
| 70 to 74 Years | 464,956 (3.2%) | 539,589 (3.7%) |
| 75 to 79 Years | 292,737 (2.0%) | 364,453 (2.5%) |
| 80 to 84 Years | 172,102 (1.2%) | 239,311 (1.6%) |
| 85 Years and over | 144,926 (1.0%) | 257,782 (1.8%) |
| Total | 14,624,638 (100.0%) | 14,618,704 (100.0%) |
Families and Households in Texas
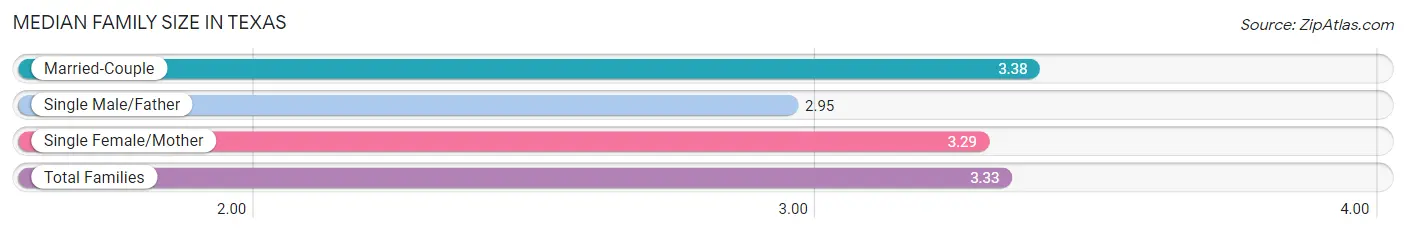
Median Family Size in Texas
The median family size in Texas is 3.33 persons per family, with married-couple families (5,200,043 | 72.5%) accounting for the largest median family size of 3.38 persons per family. On the other hand, single male/father families (553,575 | 7.7%) represent the smallest median family size with 2.95 persons per family.
| Family Type | # Families | Family Size |
| Married-Couple | 5,200,043 (72.5%) | 3.38 |
| Single Male/Father | 553,575 (7.7%) | 2.95 |
| Single Female/Mother | 1,420,225 (19.8%) | 3.29 |
| Total Families | 7,173,843 (100.0%) | 3.33 |
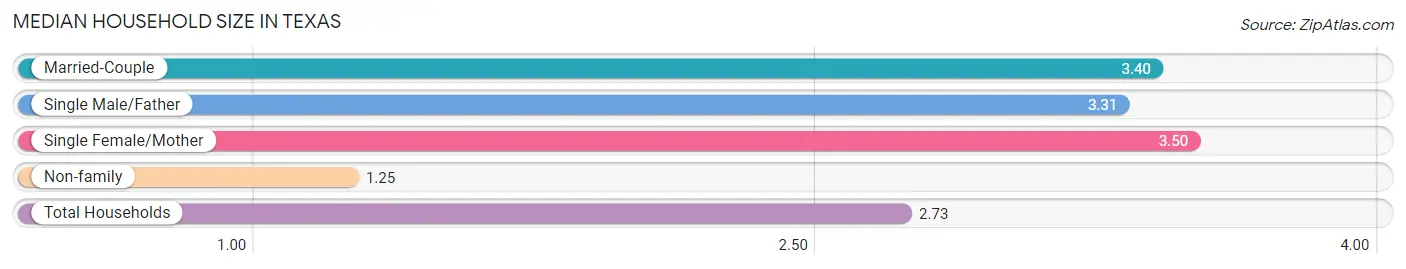
Median Household Size in Texas
The median household size in Texas is 2.73 persons per household, with single female/mother households (1,420,225 | 13.5%) accounting for the largest median household size of 3.5 persons per household. non-family households (3,316,710 | 31.6%) represent the smallest median household size with 1.25 persons per household.
| Household Type | # Households | Household Size |
| Married-Couple | 5,200,043 (49.6%) | 3.40 |
| Single Male/Father | 553,575 (5.3%) | 3.31 |
| Single Female/Mother | 1,420,225 (13.5%) | 3.50 |
| Non-family | 3,316,710 (31.6%) | 1.25 |
| Total Households | 10,490,553 (100.0%) | 2.73 |
Household Size by Marriage Status in Texas
Out of a total of 10,490,553 households in Texas, 7,173,843 (68.4%) are family households, while 3,316,710 (31.6%) are nonfamily households. The most numerous type of family households are 2-person households, comprising 2,768,302, and the most common type of nonfamily households are 1-person households, comprising 2,693,313.
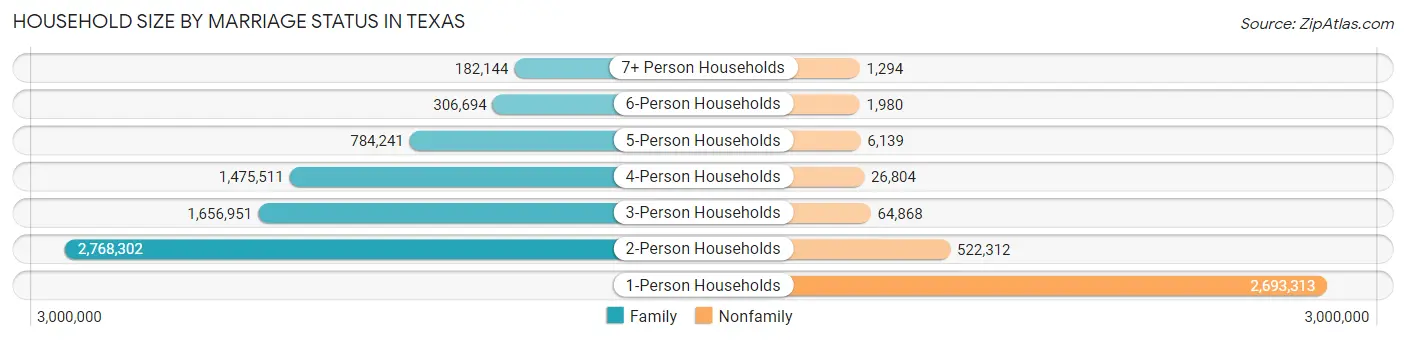
| Household Size | Family Households | Nonfamily Households |
| 1-Person Households | - | 2,693,313 (25.7%) |
| 2-Person Households | 2,768,302 (26.4%) | 522,312 (5.0%) |
| 3-Person Households | 1,656,951 (15.8%) | 64,868 (0.6%) |
| 4-Person Households | 1,475,511 (14.1%) | 26,804 (0.3%) |
| 5-Person Households | 784,241 (7.5%) | 6,139 (0.1%) |
| 6-Person Households | 306,694 (2.9%) | 1,980 (0.0%) |
| 7+ Person Households | 182,144 (1.7%) | 1,294 (0.0%) |
| Total | 7,173,843 (68.4%) | 3,316,710 (31.6%) |
Female Fertility in Texas
Fertility by Age in Texas
Average fertility rate in Texas is 56.0 births per 1,000 women. Women in the age bracket of 20 to 34 years have the highest fertility rate with 94.0 births per 1,000 women. Women in the age bracket of 20 to 34 years acount for 71.4% of all women with births.
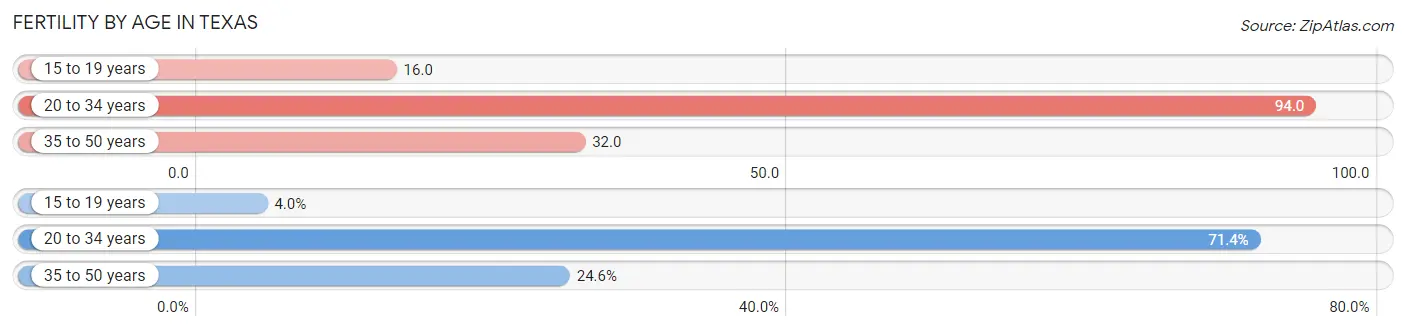
| Age Bracket | Women with Births | Births / 1,000 Women |
| 15 to 19 years | 16,400 (4.0%) | 16.0 |
| 20 to 34 years | 290,419 (71.4%) | 94.0 |
| 35 to 50 years | 99,842 (24.5%) | 32.0 |
| Total | 406,661 (100.0%) | 56.0 |
Fertility by Age by Marriage Status in Texas
67.7% of women with births (406,661) in Texas are married. The highest percentage of unmarried women with births falls into 15 to 19 years age bracket with 81.3% of them unmarried at the time of birth, while the lowest percentage of unmarried women with births belong to 35 to 50 years age bracket with 19.4% of them unmarried.
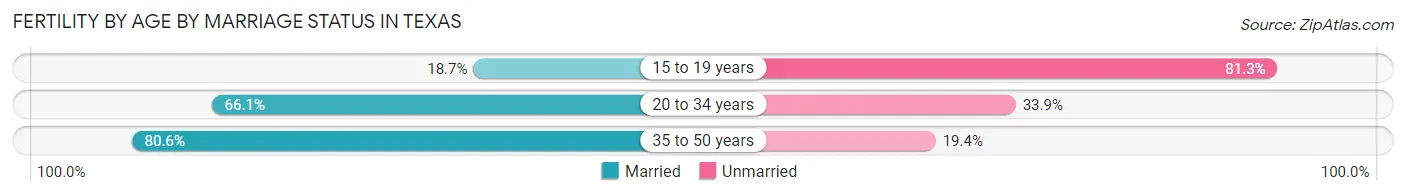
| Age Bracket | Married | Unmarried |
| 15 to 19 years | 3,067 (18.7%) | 13,333 (81.3%) |
| 20 to 34 years | 191,967 (66.1%) | 98,452 (33.9%) |
| 35 to 50 years | 80,473 (80.6%) | 19,369 (19.4%) |
| Total | 275,309 (67.7%) | 131,352 (32.3%) |
Fertility by Education in Texas
Average fertility rate in Texas is 56.0 births per 1,000 women. Women with the education attainment of high school diploma have the highest fertility rate of 65.0 births per 1,000 women, while women with the education attainment of less than high school have the lowest fertility at 38.0 births per 1,000 women. Women with the education attainment of college or associate's degree represent 30.2% of all women with births.
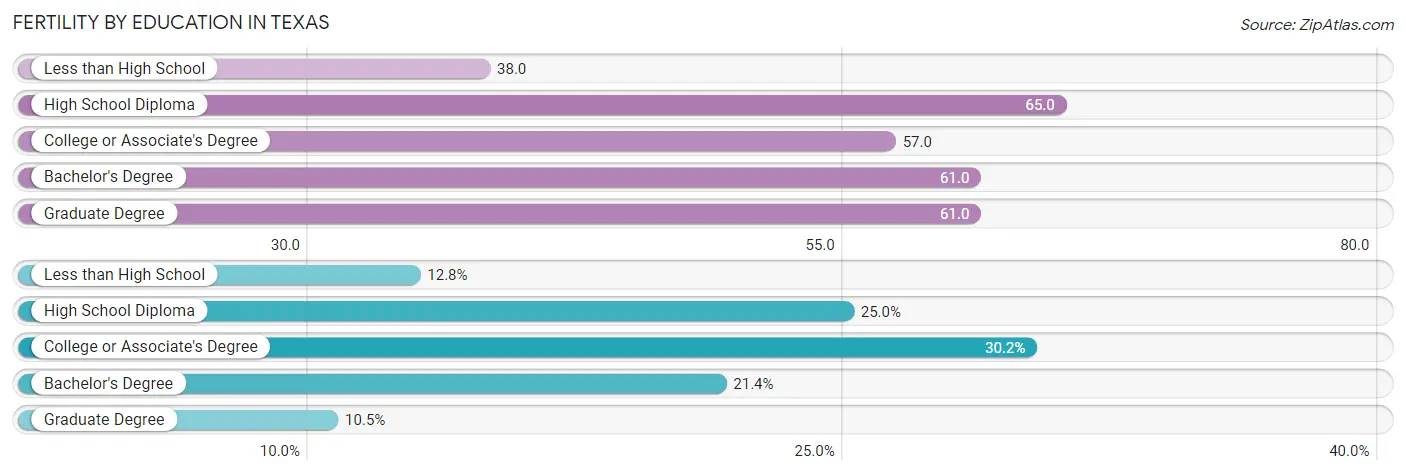
| Educational Attainment | Women with Births | Births / 1,000 Women |
| Less than High School | 52,210 (12.8%) | 38.0 |
| High School Diploma | 101,728 (25.0%) | 65.0 |
| College or Associate's Degree | 122,696 (30.2%) | 57.0 |
| Bachelor's Degree | 87,198 (21.4%) | 61.0 |
| Graduate Degree | 42,829 (10.5%) | 61.0 |
| Total | 406,661 (100.0%) | 56.0 |
Fertility by Education by Marriage Status in Texas
32.3% of women with births in Texas are unmarried. Women with the educational attainment of graduate degree are most likely to be married with 92.9% of them married at childbirth, while women with the educational attainment of less than high school are least likely to be married with 47.6% of them unmarried at childbirth.
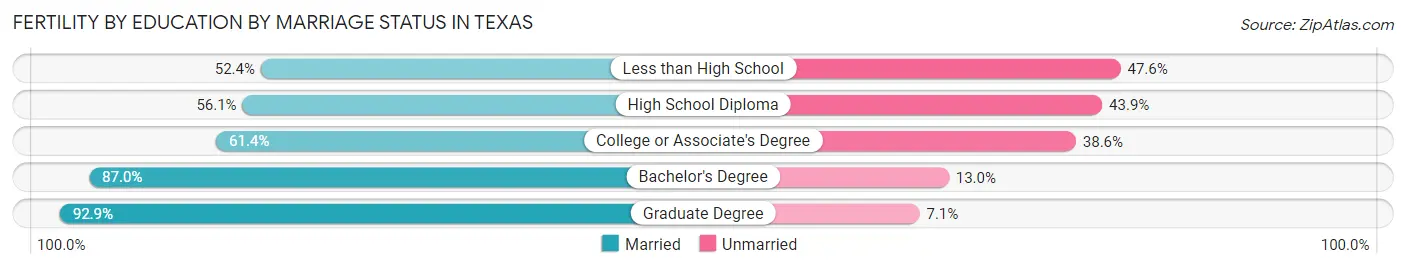
| Educational Attainment | Married | Unmarried |
| Less than High School | 27,358 (52.4%) | 24,852 (47.6%) |
| High School Diploma | 57,069 (56.1%) | 44,659 (43.9%) |
| College or Associate's Degree | 75,335 (61.4%) | 47,361 (38.6%) |
| Bachelor's Degree | 75,862 (87.0%) | 11,336 (13.0%) |
| Graduate Degree | 39,788 (92.9%) | 3,041 (7.1%) |
| Total | 275,309 (67.7%) | 131,352 (32.3%) |
Employment Characteristics in Texas
Employment by Class of Employer in Texas
Among the 13,755,352 employed individuals in Texas, private company employees (9,568,582 | 69.6%), local government employees (996,857 | 7.2%), and self-employed (not incorporated) (926,088 | 6.7%) make up the most common classes of employment.
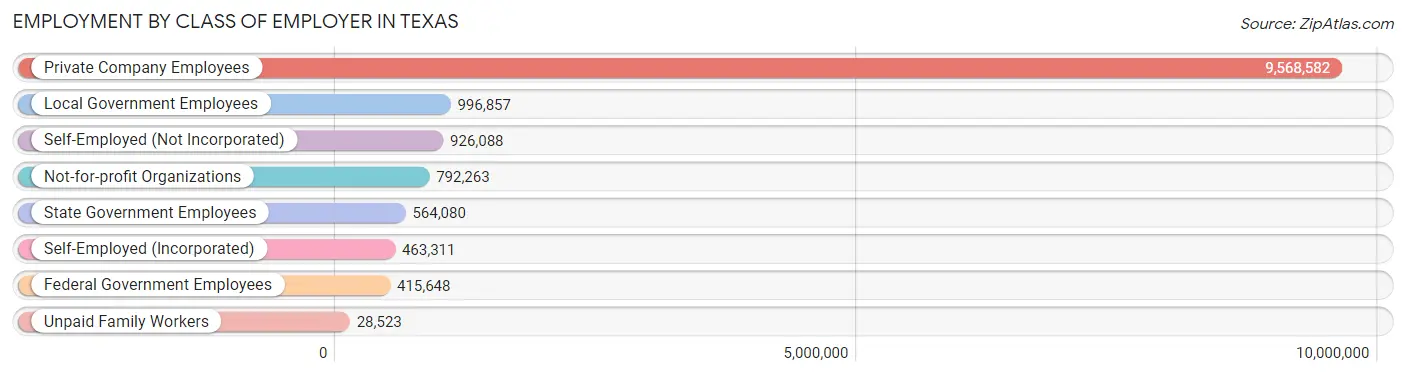
| Employer Class | # Employees | % Employees |
| Private Company Employees | 9,568,582 | 69.6% |
| Self-Employed (Incorporated) | 463,311 | 3.4% |
| Self-Employed (Not Incorporated) | 926,088 | 6.7% |
| Not-for-profit Organizations | 792,263 | 5.8% |
| Local Government Employees | 996,857 | 7.2% |
| State Government Employees | 564,080 | 4.1% |
| Federal Government Employees | 415,648 | 3.0% |
| Unpaid Family Workers | 28,523 | 0.2% |
| Total | 13,755,352 | 100.0% |
Employment Status by Age in Texas
According to the labor force statistics for Texas, out of the total population over 16 years of age (22,698,396), 65.1% or 14,776,656 individuals are in the labor force, with 5.2% or 768,386 of them unemployed. The age group with the highest labor force participation rate is 30 to 34 years, with 82.1% or 1,738,161 individuals in the labor force. Within the labor force, the 16 to 19 years age range has the highest percentage of unemployed individuals, with 15.0% or 90,460 of them being unemployed.
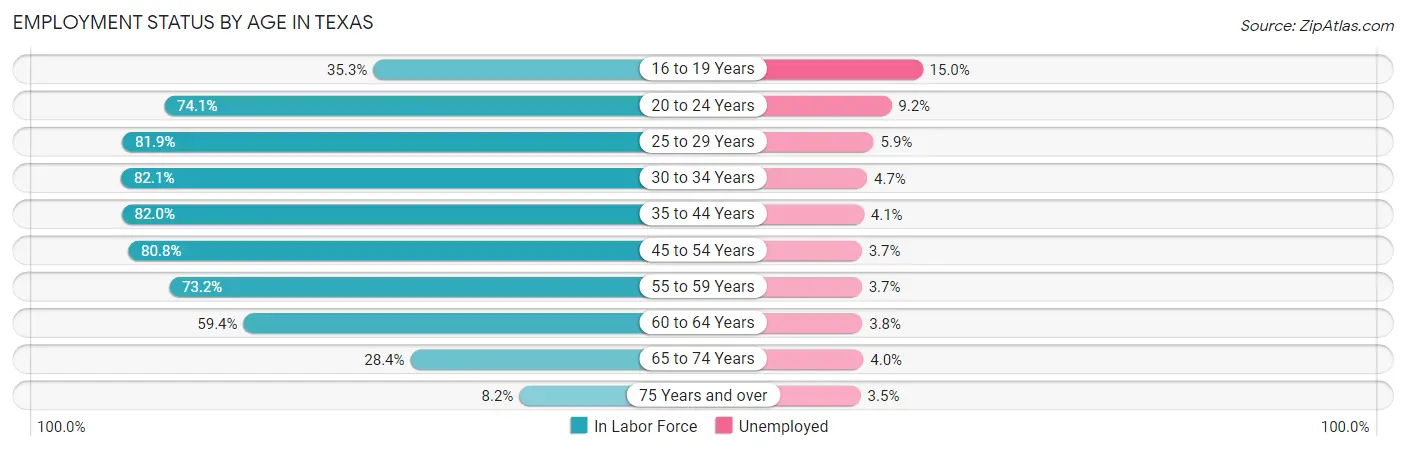
| Age Bracket | In Labor Force | Unemployed |
| 16 to 19 Years | 603,064 (35.3%) | 90,460 (15.0%) |
| 20 to 24 Years | 1,540,577 (74.1%) | 141,733 (9.2%) |
| 25 to 29 Years | 1,725,688 (81.9%) | 101,816 (5.9%) |
| 30 to 34 Years | 1,738,161 (82.1%) | 81,694 (4.7%) |
| 35 to 44 Years | 3,317,968 (82.0%) | 136,037 (4.1%) |
| 45 to 54 Years | 2,906,447 (80.8%) | 107,539 (3.7%) |
| 55 to 59 Years | 1,239,646 (73.2%) | 45,867 (3.7%) |
| 60 to 64 Years | 939,044 (59.4%) | 35,684 (3.8%) |
| 65 to 74 Years | 652,537 (28.4%) | 26,101 (4.0%) |
| 75 Years and over | 120,648 (8.2%) | 4,223 (3.5%) |
| Total | 14,776,656 (65.1%) | 768,386 (5.2%) |
Employment Status by Educational Attainment in Texas
According to labor force statistics for Texas, 78.4% of individuals (11,871,305) out of the total population between 25 and 64 years of age (15,141,971) are in the labor force, with 4.3% or 510,466 of them being unemployed. The group with the highest labor force participation rate are those with the educational attainment of bachelor's degree or higher, with 86.5% or 4,349,130 individuals in the labor force. Within the labor force, individuals with less than high school education have the highest percentage of unemployment, with 5.5% or 75,776 of them being unemployed.
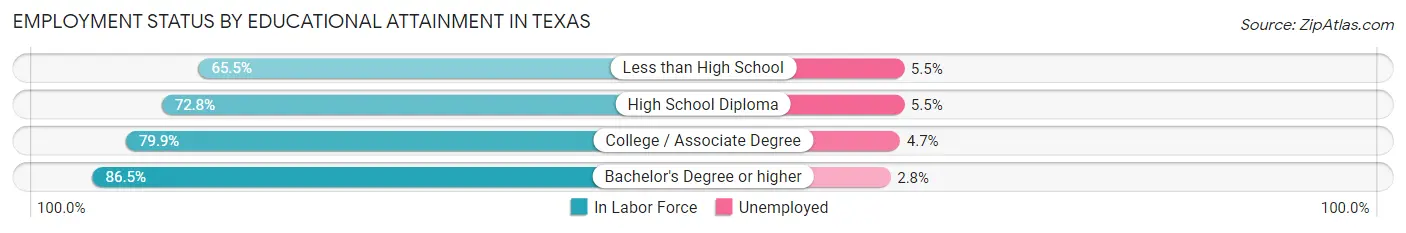
| Educational Attainment | In Labor Force | Unemployed |
| Less than High School | 1,377,741 (65.5%) | 115,688 (5.5%) |
| High School Diploma | 2,659,550 (72.8%) | 200,928 (5.5%) |
| College / Associate Degree | 3,481,583 (79.9%) | 204,799 (4.7%) |
| Bachelor's Degree or higher | 4,349,130 (86.5%) | 140,781 (2.8%) |
| Total | 11,871,305 (78.4%) | 651,105 (4.3%) |
Employment Occupations by Sex in Texas
Management, Business, Science and Arts Occupations
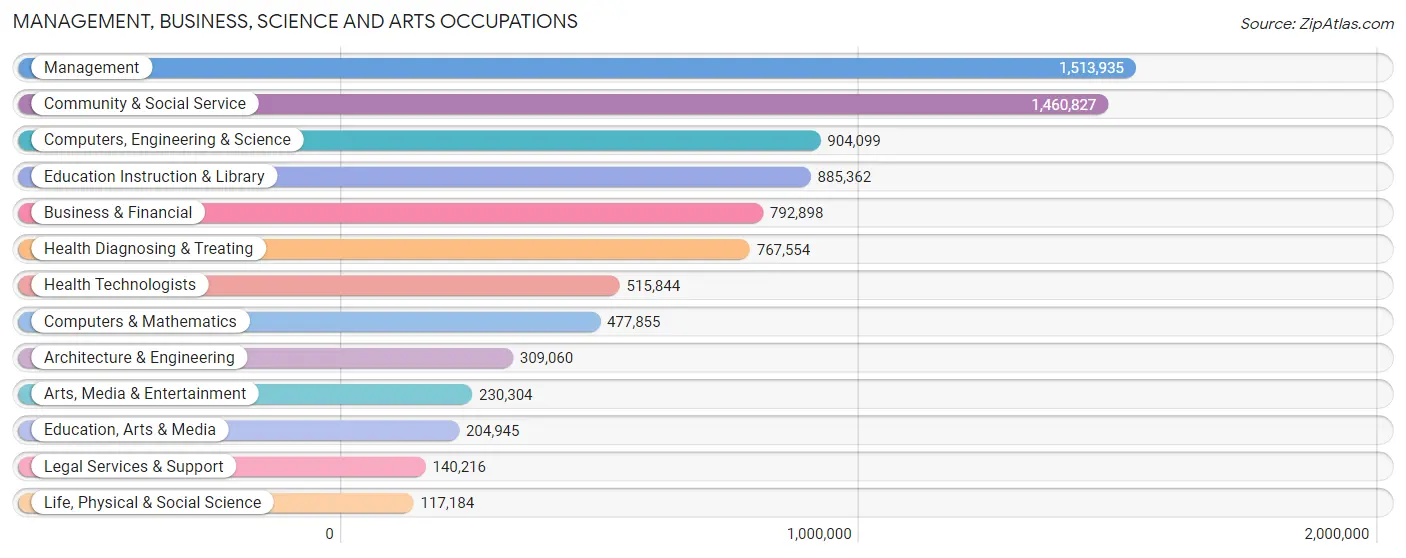
The most common Management, Business, Science and Arts occupations in Texas are Management (1,513,935 | 10.9%), Community & Social Service (1,460,827 | 10.5%), Computers, Engineering & Science (904,099 | 6.5%), Education Instruction & Library (885,362 | 6.4%), and Business & Financial (792,898 | 5.7%).
Management, Business, Science and Arts Occupations by Sex
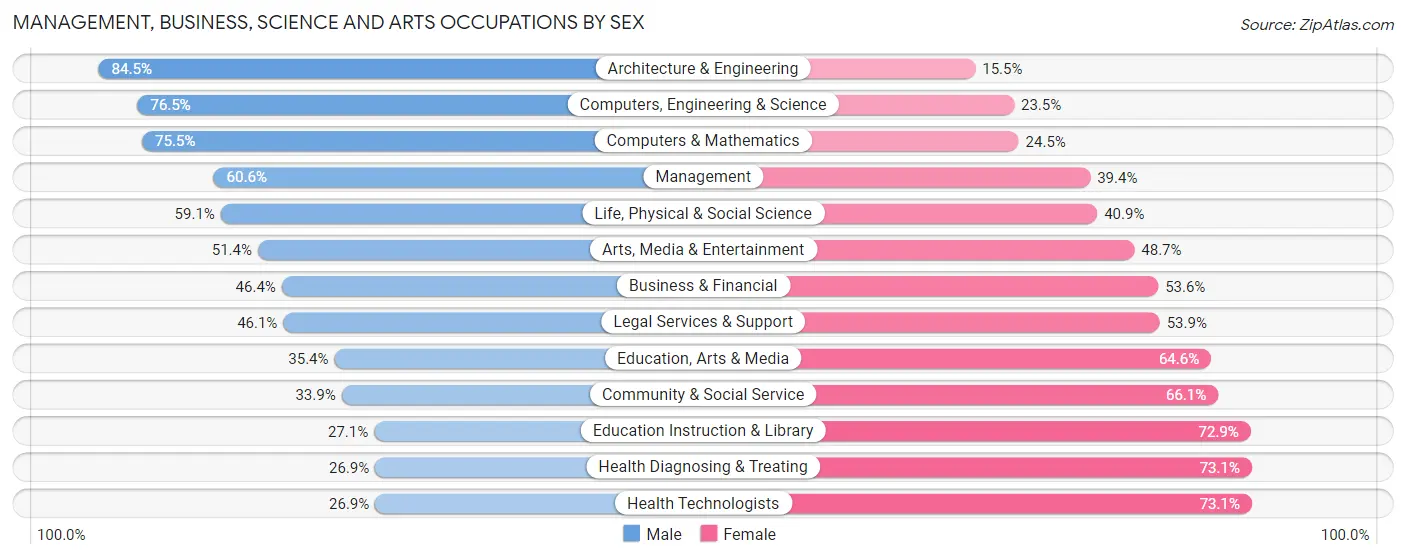
Within the Management, Business, Science and Arts occupations in Texas, the most male-oriented occupations are Architecture & Engineering (84.5%), Computers, Engineering & Science (76.5%), and Computers & Mathematics (75.5%), while the most female-oriented occupations are Health Diagnosing & Treating (73.1%), Health Technologists (73.1%), and Education Instruction & Library (72.9%).
| Occupation | Male | Female |
| Management | 916,886 (60.6%) | 597,049 (39.4%) |
| Business & Financial | 367,707 (46.4%) | 425,191 (53.6%) |
| Computers, Engineering & Science | 691,254 (76.5%) | 212,845 (23.5%) |
| Computers & Mathematics | 360,730 (75.5%) | 117,125 (24.5%) |
| Architecture & Engineering | 261,270 (84.5%) | 47,790 (15.5%) |
| Life, Physical & Social Science | 69,254 (59.1%) | 47,930 (40.9%) |
| Community & Social Service | 495,269 (33.9%) | 965,558 (66.1%) |
| Education, Arts & Media | 72,515 (35.4%) | 132,430 (64.6%) |
| Legal Services & Support | 64,581 (46.1%) | 75,635 (53.9%) |
| Education Instruction & Library | 239,919 (27.1%) | 645,443 (72.9%) |
| Arts, Media & Entertainment | 118,254 (51.3%) | 112,050 (48.6%) |
| Health Diagnosing & Treating | 206,342 (26.9%) | 561,212 (73.1%) |
| Health Technologists | 138,670 (26.9%) | 377,174 (73.1%) |
| Total (Category) | 2,677,458 (49.2%) | 2,761,855 (50.8%) |
| Total (Overall) | 7,591,584 (54.6%) | 6,316,544 (45.4%) |
Services Occupations
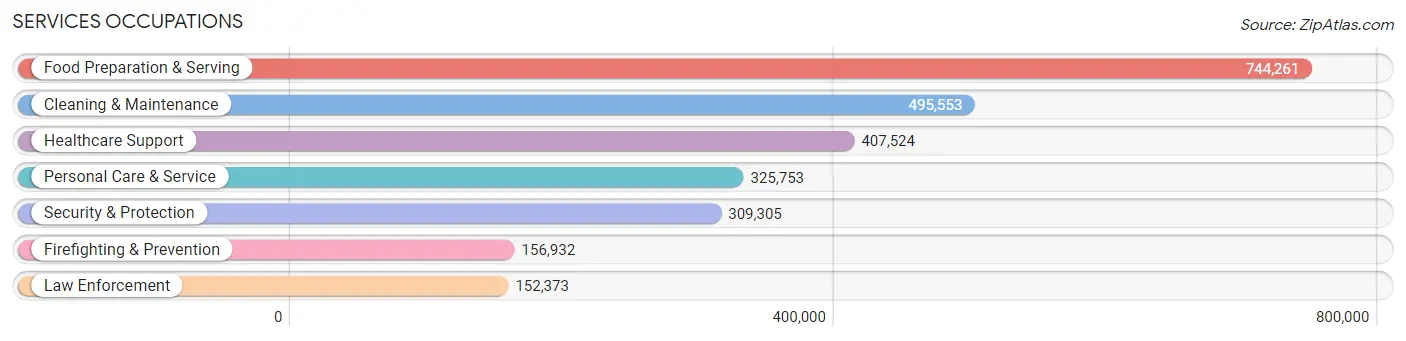
The most common Services occupations in Texas are Food Preparation & Serving (744,261 | 5.3%), Cleaning & Maintenance (495,553 | 3.6%), Healthcare Support (407,524 | 2.9%), Personal Care & Service (325,753 | 2.3%), and Security & Protection (309,305 | 2.2%).
Services Occupations by Sex
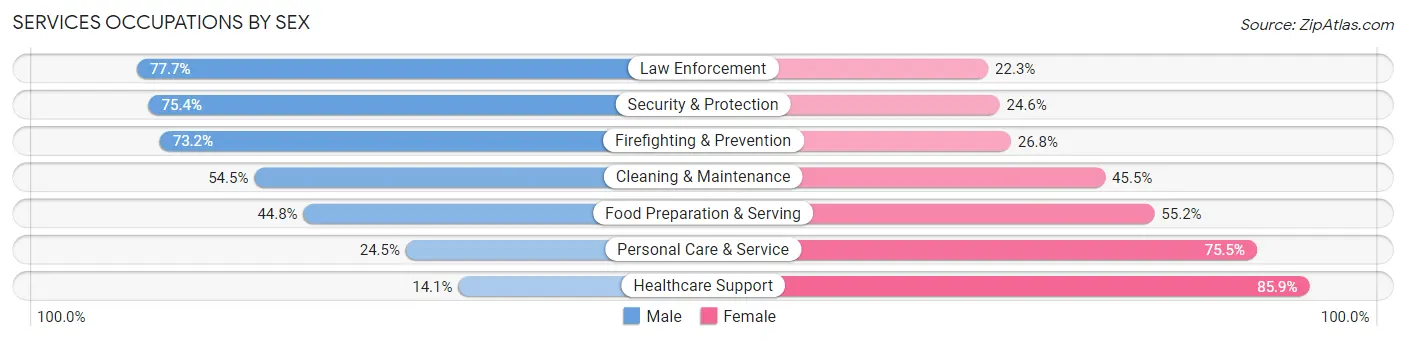
Within the Services occupations in Texas, the most male-oriented occupations are Law Enforcement (77.7%), Security & Protection (75.4%), and Firefighting & Prevention (73.2%), while the most female-oriented occupations are Healthcare Support (85.9%), Personal Care & Service (75.5%), and Food Preparation & Serving (55.2%).
| Occupation | Male | Female |
| Healthcare Support | 57,526 (14.1%) | 349,998 (85.9%) |
| Security & Protection | 233,301 (75.4%) | 76,004 (24.6%) |
| Firefighting & Prevention | 114,907 (73.2%) | 42,025 (26.8%) |
| Law Enforcement | 118,394 (77.7%) | 33,979 (22.3%) |
| Food Preparation & Serving | 333,262 (44.8%) | 410,999 (55.2%) |
| Cleaning & Maintenance | 270,205 (54.5%) | 225,348 (45.5%) |
| Personal Care & Service | 79,848 (24.5%) | 245,905 (75.5%) |
| Total (Category) | 974,142 (42.7%) | 1,308,254 (57.3%) |
| Total (Overall) | 7,591,584 (54.6%) | 6,316,544 (45.4%) |
Sales and Office Occupations
The most common Sales and Office occupations in Texas are Office & Administration (1,525,938 | 11.0%), and Sales & Related (1,421,990 | 10.2%).

Sales and Office Occupations by Sex
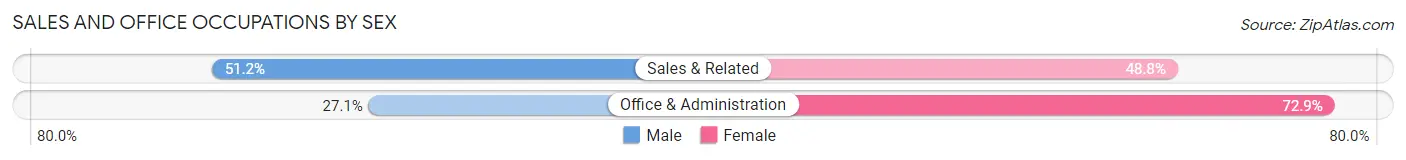
| Occupation | Male | Female |
| Sales & Related | 728,242 (51.2%) | 693,748 (48.8%) |
| Office & Administration | 413,113 (27.1%) | 1,112,825 (72.9%) |
| Total (Category) | 1,141,355 (38.7%) | 1,806,573 (61.3%) |
| Total (Overall) | 7,591,584 (54.6%) | 6,316,544 (45.4%) |
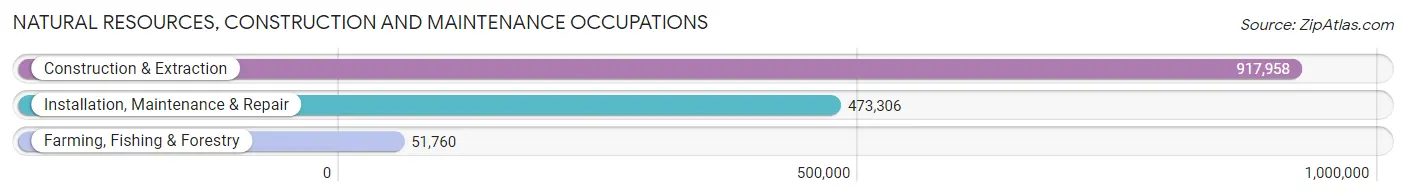
Natural Resources, Construction and Maintenance Occupations
The most common Natural Resources, Construction and Maintenance occupations in Texas are Construction & Extraction (917,958 | 6.6%), Installation, Maintenance & Repair (473,306 | 3.4%), and Farming, Fishing & Forestry (51,760 | 0.4%).
Natural Resources, Construction and Maintenance Occupations by Sex
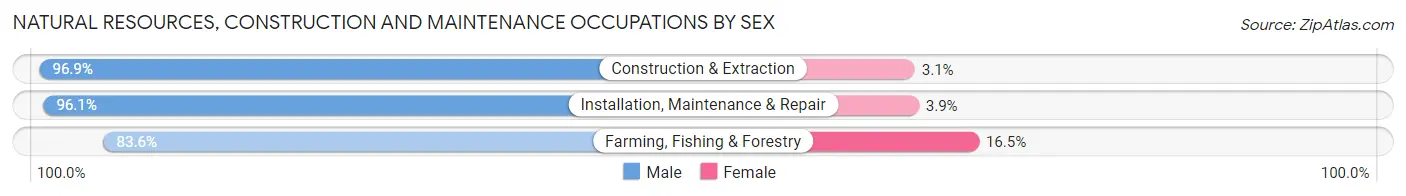
| Occupation | Male | Female |
| Farming, Fishing & Forestry | 43,248 (83.6%) | 8,512 (16.5%) |
| Construction & Extraction | 889,449 (96.9%) | 28,509 (3.1%) |
| Installation, Maintenance & Repair | 454,664 (96.1%) | 18,642 (3.9%) |
| Total (Category) | 1,387,361 (96.1%) | 55,663 (3.9%) |
| Total (Overall) | 7,591,584 (54.6%) | 6,316,544 (45.4%) |
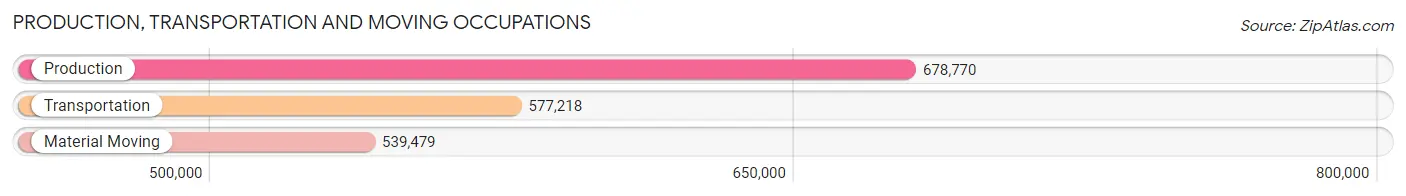
Production, Transportation and Moving Occupations
The most common Production, Transportation and Moving occupations in Texas are Production (678,770 | 4.9%), Transportation (577,218 | 4.2%), and Material Moving (539,479 | 3.9%).
Production, Transportation and Moving Occupations by Sex
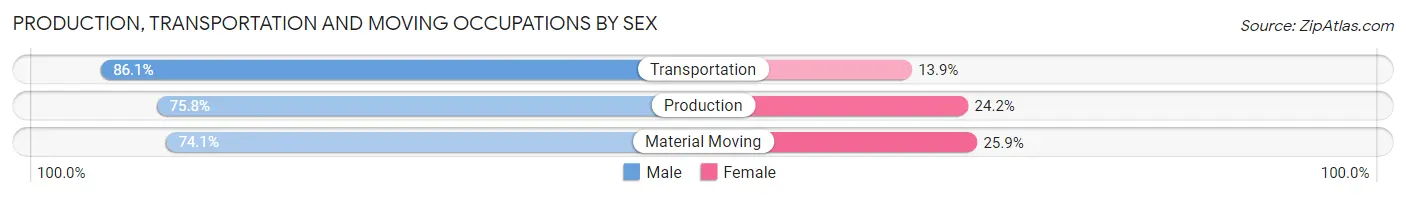
| Occupation | Male | Female |
| Production | 514,223 (75.8%) | 164,547 (24.2%) |
| Transportation | 497,074 (86.1%) | 80,144 (13.9%) |
| Material Moving | 399,971 (74.1%) | 139,508 (25.9%) |
| Total (Category) | 1,411,268 (78.6%) | 384,199 (21.4%) |
| Total (Overall) | 7,591,584 (54.6%) | 6,316,544 (45.4%) |
Employment Industries by Sex in Texas
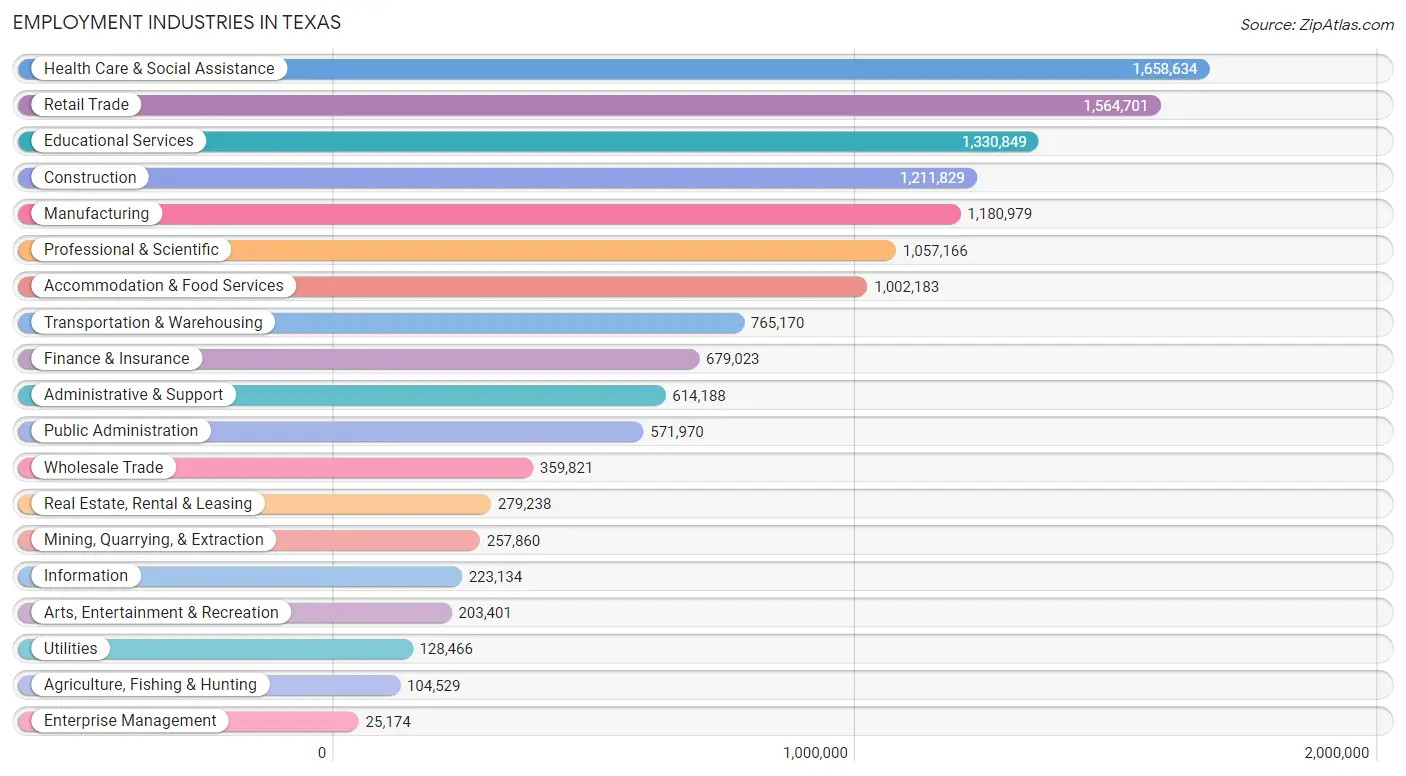
Employment Industries in Texas
The major employment industries in Texas include Health Care & Social Assistance (1,658,634 | 11.9%), Retail Trade (1,564,701 | 11.3%), Educational Services (1,330,849 | 9.6%), Construction (1,211,829 | 8.7%), and Manufacturing (1,180,979 | 8.5%).
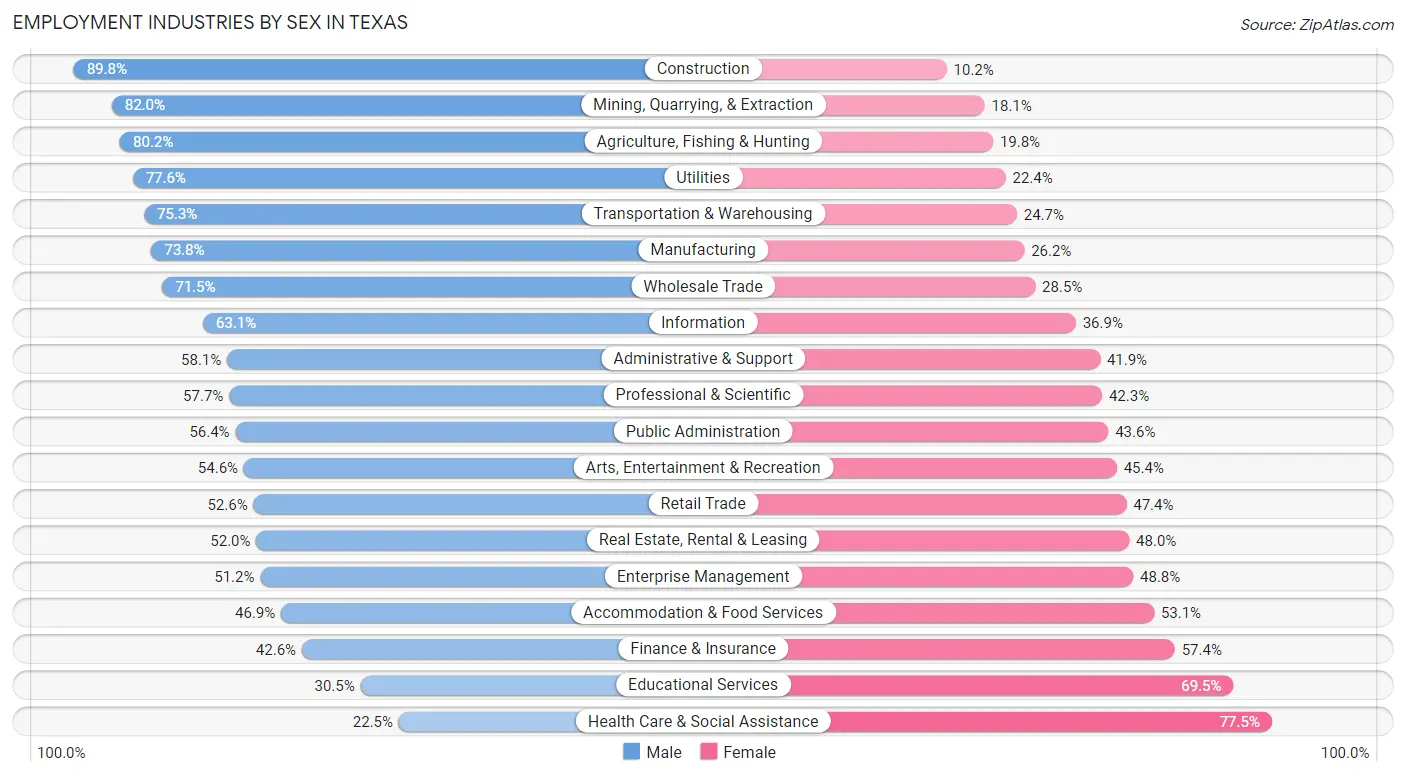
Employment Industries by Sex in Texas
The Texas industries that see more men than women are Construction (89.8%), Mining, Quarrying, & Extraction (82.0%), and Agriculture, Fishing & Hunting (80.2%), whereas the industries that tend to have a higher number of women are Health Care & Social Assistance (77.5%), Educational Services (69.5%), and Finance & Insurance (57.4%).
| Industry | Male | Female |
| Agriculture, Fishing & Hunting | 83,868 (80.2%) | 20,661 (19.8%) |
| Mining, Quarrying, & Extraction | 211,308 (82.0%) | 46,552 (18.0%) |
| Construction | 1,088,503 (89.8%) | 123,326 (10.2%) |
| Manufacturing | 871,090 (73.8%) | 309,889 (26.2%) |
| Wholesale Trade | 257,232 (71.5%) | 102,589 (28.5%) |
| Retail Trade | 823,321 (52.6%) | 741,380 (47.4%) |
| Transportation & Warehousing | 576,064 (75.3%) | 189,106 (24.7%) |
| Utilities | 99,713 (77.6%) | 28,753 (22.4%) |
| Information | 140,765 (63.1%) | 82,369 (36.9%) |
| Finance & Insurance | 289,251 (42.6%) | 389,772 (57.4%) |
| Real Estate, Rental & Leasing | 145,293 (52.0%) | 133,945 (48.0%) |
| Professional & Scientific | 609,540 (57.7%) | 447,626 (42.3%) |
| Enterprise Management | 12,891 (51.2%) | 12,283 (48.8%) |
| Administrative & Support | 356,718 (58.1%) | 257,470 (41.9%) |
| Educational Services | 405,575 (30.5%) | 925,274 (69.5%) |
| Health Care & Social Assistance | 373,667 (22.5%) | 1,284,967 (77.5%) |
| Arts, Entertainment & Recreation | 111,079 (54.6%) | 92,322 (45.4%) |
| Accommodation & Food Services | 470,038 (46.9%) | 532,145 (53.1%) |
| Public Administration | 322,344 (56.4%) | 249,626 (43.6%) |
| Total | 7,591,584 (54.6%) | 6,316,544 (45.4%) |
Education in Texas
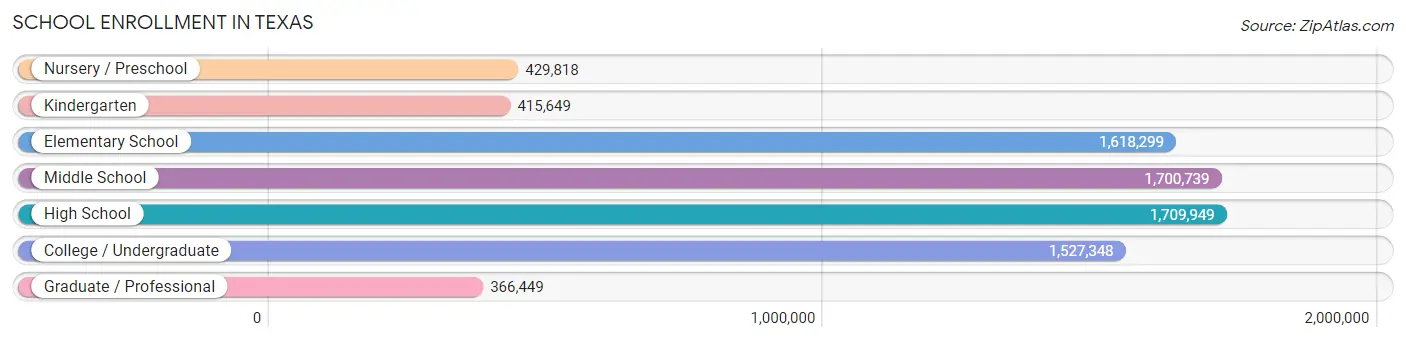
School Enrollment in Texas
The most common levels of schooling among the 7,768,251 students in Texas are high school (1,709,949 | 22.0%), middle school (1,700,739 | 21.9%), and elementary school (1,618,299 | 20.8%).
| School Level | # Students | % Students |
| Nursery / Preschool | 429,818 | 5.5% |
| Kindergarten | 415,649 | 5.3% |
| Elementary School | 1,618,299 | 20.8% |
| Middle School | 1,700,739 | 21.9% |
| High School | 1,709,949 | 22.0% |
| College / Undergraduate | 1,527,348 | 19.7% |
| Graduate / Professional | 366,449 | 4.7% |
| Total | 7,768,251 | 100.0% |
School Enrollment by Age by Funding Source in Texas
Out of a total of 7,768,251 students who are enrolled in schools in Texas, 947,727 (12.2%) attend a private institution, while the remaining 6,820,524 (87.8%) are enrolled in public schools. The age group of 3 to 4 year olds has the highest likelihood of being enrolled in private schools, with 123,895 (36.8% in the age bracket) enrolled. Conversely, the age group of 15 to 17 year olds has the lowest likelihood of being enrolled in a private school, with 1,133,958 (92.6% in the age bracket) attending a public institution.
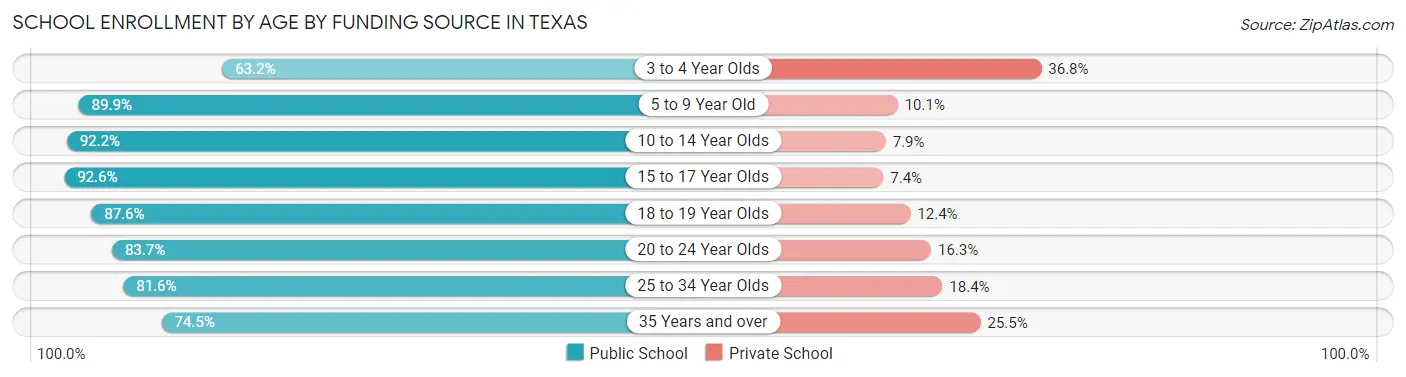
| Age Bracket | Public School | Private School |
| 3 to 4 Year Olds | 212,602 (63.2%) | 123,895 (36.8%) |
| 5 to 9 Year Old | 1,714,755 (89.9%) | 191,977 (10.1%) |
| 10 to 14 Year Olds | 1,945,943 (92.1%) | 165,768 (7.9%) |
| 15 to 17 Year Olds | 1,133,958 (92.6%) | 90,442 (7.4%) |
| 18 to 19 Year Olds | 525,350 (87.6%) | 74,536 (12.4%) |
| 20 to 24 Year Olds | 644,615 (83.7%) | 125,315 (16.3%) |
| 25 to 34 Year Olds | 365,341 (81.6%) | 82,329 (18.4%) |
| 35 Years and over | 276,729 (74.5%) | 94,696 (25.5%) |
| Total | 6,820,524 (87.8%) | 947,727 (12.2%) |
Educational Attainment by Field of Study in Texas
Business (1,468,333 | 22.5%), education (709,878 | 10.9%), engineering (621,446 | 9.5%), science & technology (620,242 | 9.5%), and arts & humanities (411,202 | 6.3%) are the most common fields of study among 6,513,899 individuals in Texas who have obtained a bachelor's degree or higher.
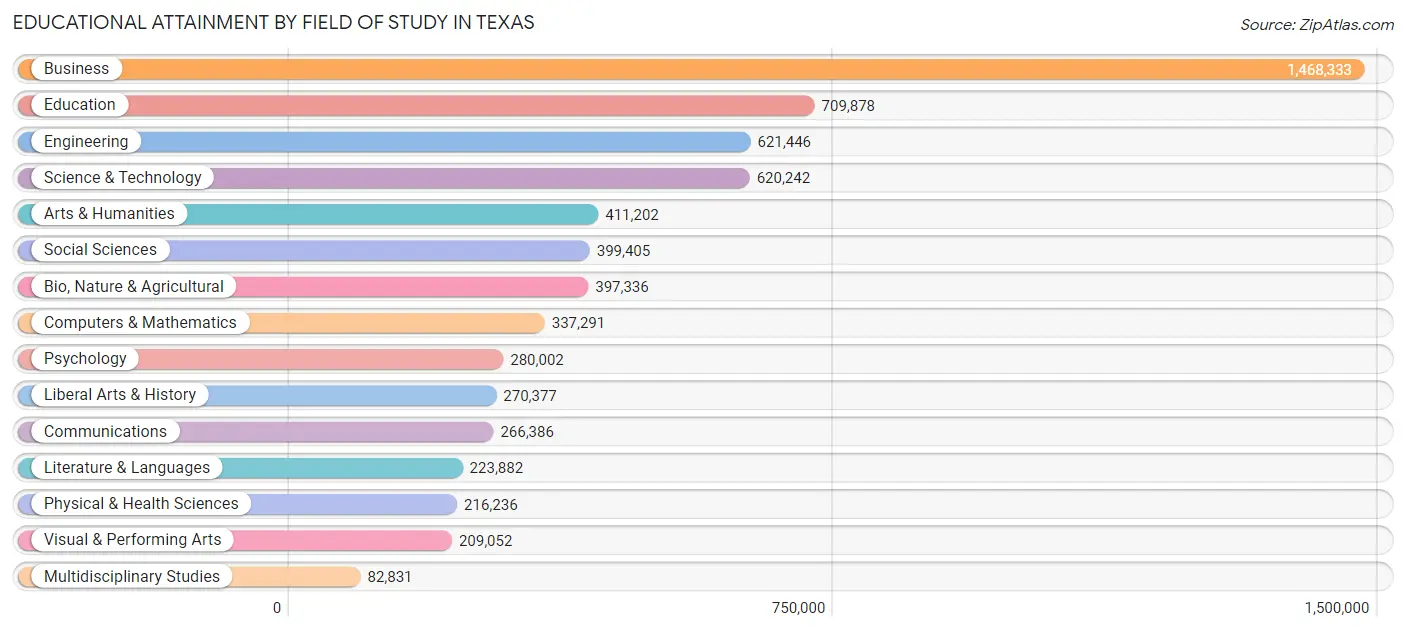
| Field of Study | # Graduates | % Graduates |
| Computers & Mathematics | 337,291 | 5.2% |
| Bio, Nature & Agricultural | 397,336 | 6.1% |
| Physical & Health Sciences | 216,236 | 3.3% |
| Psychology | 280,002 | 4.3% |
| Social Sciences | 399,405 | 6.1% |
| Engineering | 621,446 | 9.5% |
| Multidisciplinary Studies | 82,831 | 1.3% |
| Science & Technology | 620,242 | 9.5% |
| Business | 1,468,333 | 22.5% |
| Education | 709,878 | 10.9% |
| Literature & Languages | 223,882 | 3.4% |
| Liberal Arts & History | 270,377 | 4.2% |
| Visual & Performing Arts | 209,052 | 3.2% |
| Communications | 266,386 | 4.1% |
| Arts & Humanities | 411,202 | 6.3% |
| Total | 6,513,899 | 100.0% |
Transportation & Commute in Texas
Vehicle Availability by Sex in Texas
The most prevalent vehicle ownership categories in Texas are males with 2 vehicles (3,281,757, accounting for 43.7%) and females with 2 vehicles (2,560,486, making up 53.3%).
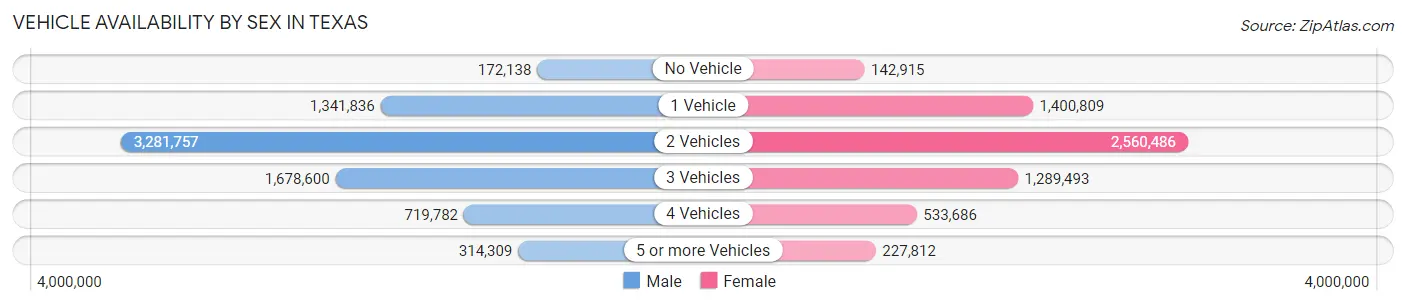
| Vehicles Available | Male | Female |
| No Vehicle | 172,138 (2.3%) | 142,915 (2.3%) |
| 1 Vehicle | 1,341,836 (17.9%) | 1,400,809 (22.8%) |
| 2 Vehicles | 3,281,757 (43.7%) | 2,560,486 (41.6%) |
| 3 Vehicles | 1,678,600 (22.4%) | 1,289,493 (20.9%) |
| 4 Vehicles | 719,782 (9.6%) | 533,686 (8.7%) |
| 5 or more Vehicles | 314,309 (4.2%) | 227,812 (3.7%) |
| Total | 7,508,422 (100.0%) | 6,155,201 (100.0%) |
Commute Time in Texas
The most frequently occuring commute durations in Texas are 15 to 19 minutes (1,904,211 commuters, 15.5%), 30 to 34 minutes (1,844,223 commuters, 15.1%), and 20 to 24 minutes (1,761,469 commuters, 14.4%).
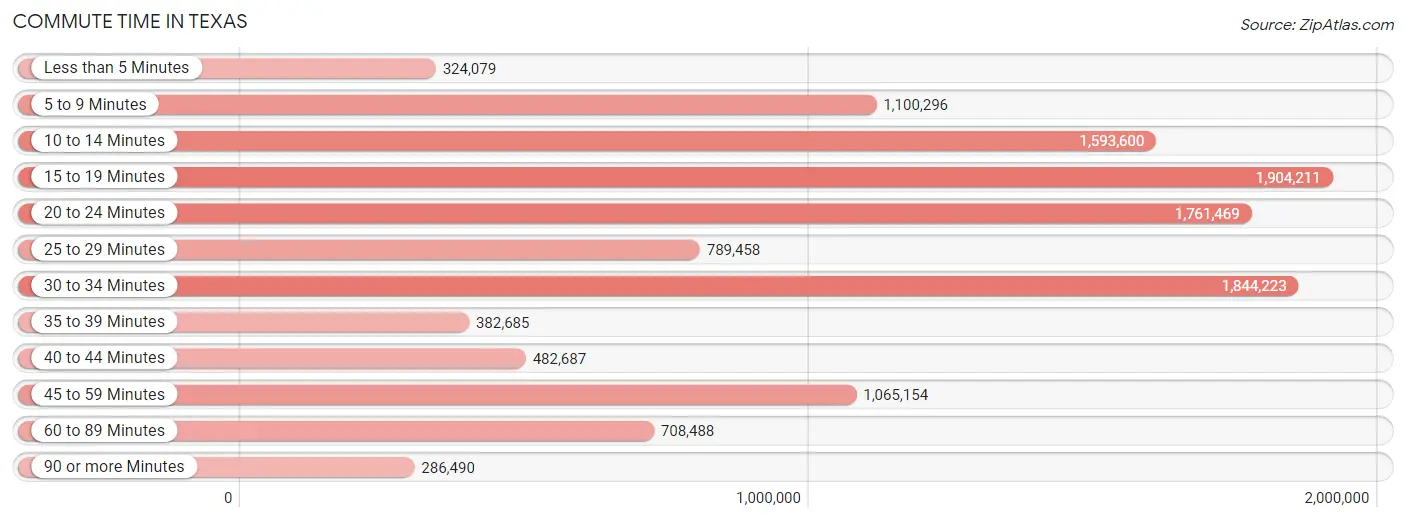
| Commute Time | # Commuters | % Commuters |
| Less than 5 Minutes | 324,079 | 2.6% |
| 5 to 9 Minutes | 1,100,296 | 9.0% |
| 10 to 14 Minutes | 1,593,600 | 13.0% |
| 15 to 19 Minutes | 1,904,211 | 15.5% |
| 20 to 24 Minutes | 1,761,469 | 14.4% |
| 25 to 29 Minutes | 789,458 | 6.5% |
| 30 to 34 Minutes | 1,844,223 | 15.1% |
| 35 to 39 Minutes | 382,685 | 3.1% |
| 40 to 44 Minutes | 482,687 | 3.9% |
| 45 to 59 Minutes | 1,065,154 | 8.7% |
| 60 to 89 Minutes | 708,488 | 5.8% |
| 90 or more Minutes | 286,490 | 2.3% |
Commute Time by Sex in Texas
The most common commute times in Texas are 30 to 34 minutes (1,083,874 commuters, 15.9%) for males and 15 to 19 minutes (907,997 commuters, 16.7%) for females.
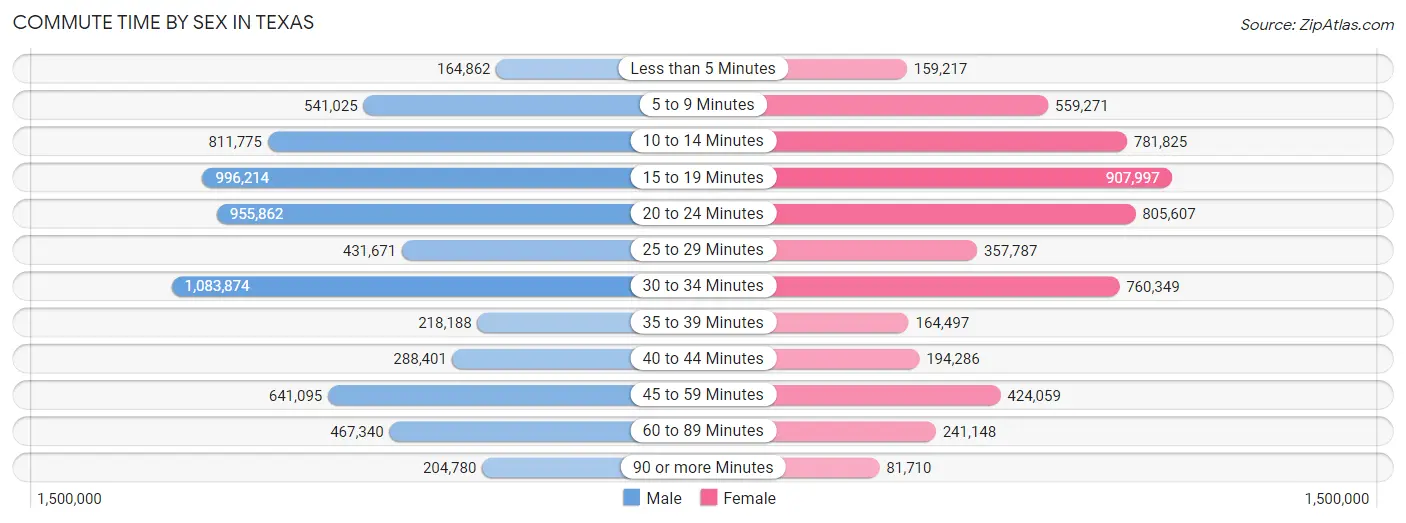
| Commute Time | Male | Female |
| Less than 5 Minutes | 164,862 (2.4%) | 159,217 (2.9%) |
| 5 to 9 Minutes | 541,025 (8.0%) | 559,271 (10.3%) |
| 10 to 14 Minutes | 811,775 (11.9%) | 781,825 (14.4%) |
| 15 to 19 Minutes | 996,214 (14.6%) | 907,997 (16.7%) |
| 20 to 24 Minutes | 955,862 (14.1%) | 805,607 (14.8%) |
| 25 to 29 Minutes | 431,671 (6.3%) | 357,787 (6.6%) |
| 30 to 34 Minutes | 1,083,874 (15.9%) | 760,349 (14.0%) |
| 35 to 39 Minutes | 218,188 (3.2%) | 164,497 (3.0%) |
| 40 to 44 Minutes | 288,401 (4.2%) | 194,286 (3.6%) |
| 45 to 59 Minutes | 641,095 (9.4%) | 424,059 (7.8%) |
| 60 to 89 Minutes | 467,340 (6.9%) | 241,148 (4.4%) |
| 90 or more Minutes | 204,780 (3.0%) | 81,710 (1.5%) |
Time of Departure to Work by Sex in Texas
The most frequent times of departure to work in Texas are 7:00 AM to 7:29 AM (998,449, 14.7%) for males and 7:00 AM to 7:29 AM (905,299, 16.7%) for females.
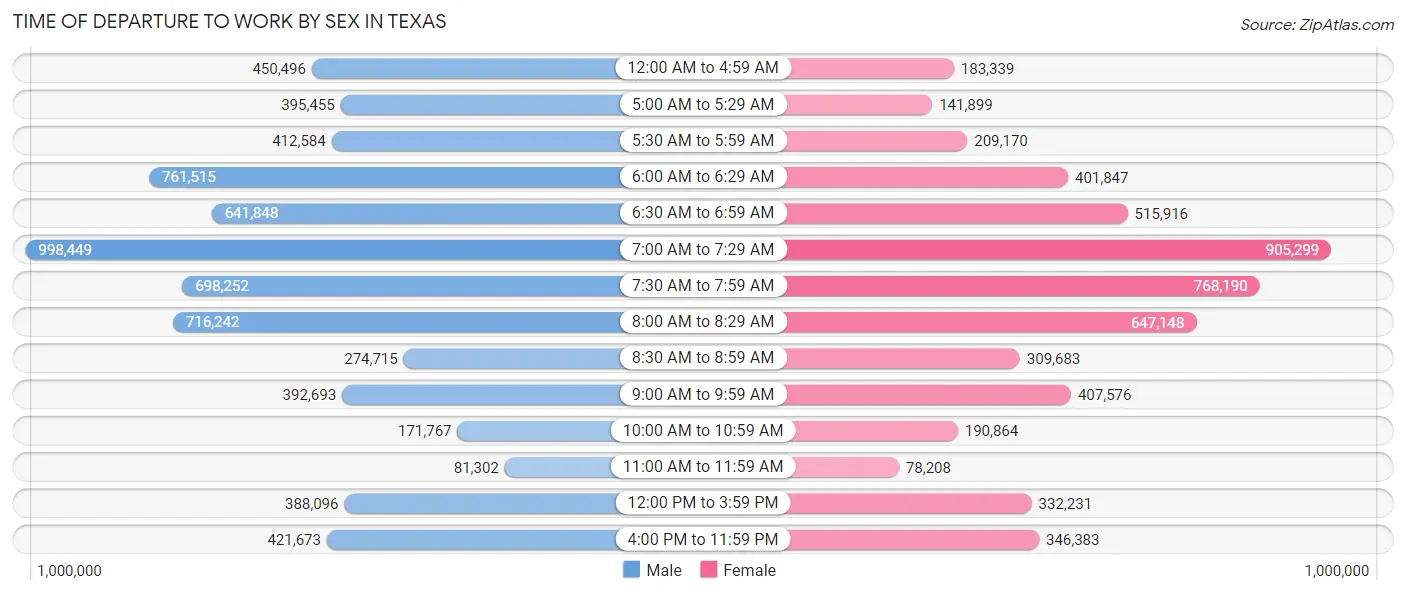
| Time of Departure | Male | Female |
| 12:00 AM to 4:59 AM | 450,496 (6.6%) | 183,339 (3.4%) |
| 5:00 AM to 5:29 AM | 395,455 (5.8%) | 141,899 (2.6%) |
| 5:30 AM to 5:59 AM | 412,584 (6.1%) | 209,170 (3.8%) |
| 6:00 AM to 6:29 AM | 761,515 (11.2%) | 401,847 (7.4%) |
| 6:30 AM to 6:59 AM | 641,848 (9.4%) | 515,916 (9.5%) |
| 7:00 AM to 7:29 AM | 998,449 (14.7%) | 905,299 (16.7%) |
| 7:30 AM to 7:59 AM | 698,252 (10.3%) | 768,190 (14.1%) |
| 8:00 AM to 8:29 AM | 716,242 (10.5%) | 647,148 (11.9%) |
| 8:30 AM to 8:59 AM | 274,715 (4.0%) | 309,683 (5.7%) |
| 9:00 AM to 9:59 AM | 392,693 (5.8%) | 407,576 (7.5%) |
| 10:00 AM to 10:59 AM | 171,767 (2.5%) | 190,864 (3.5%) |
| 11:00 AM to 11:59 AM | 81,302 (1.2%) | 78,208 (1.4%) |
| 12:00 PM to 3:59 PM | 388,096 (5.7%) | 332,231 (6.1%) |
| 4:00 PM to 11:59 PM | 421,673 (6.2%) | 346,383 (6.4%) |
| Total | 6,805,087 (100.0%) | 5,437,753 (100.0%) |
Housing Occupancy in Texas
Occupancy by Ownership in Texas
Of the total 10,490,553 dwellings in Texas, owner-occupied units account for 6,545,727 (62.4%), while renter-occupied units make up 3,944,826 (37.6%).
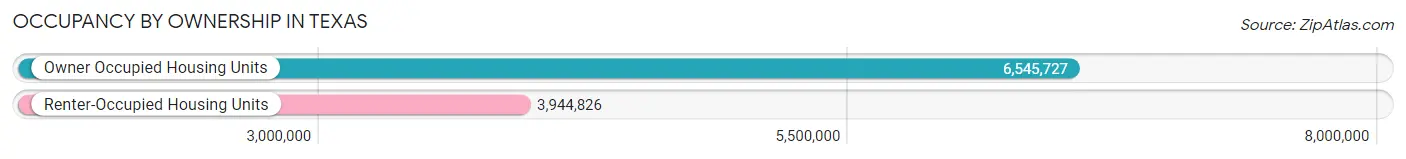
| Occupancy | # Housing Units | % Housing Units |
| Owner Occupied Housing Units | 6,545,727 | 62.4% |
| Renter-Occupied Housing Units | 3,944,826 | 37.6% |
| Total Occupied Housing Units | 10,490,553 | 100.0% |
Occupancy by Household Size in Texas
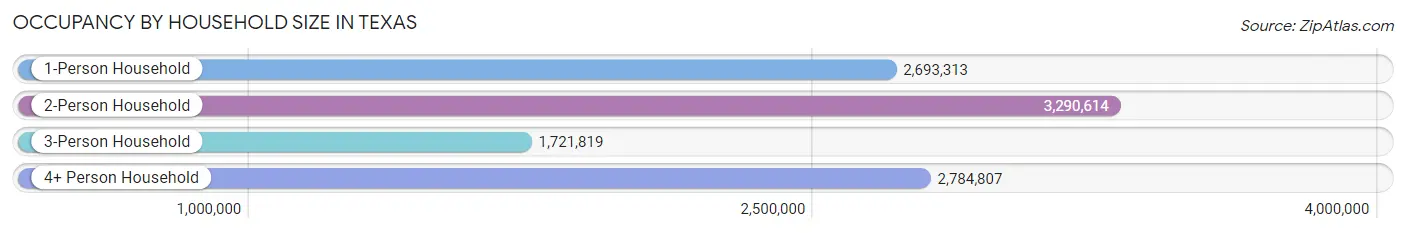
| Household Size | # Housing Units | % Housing Units |
| 1-Person Household | 2,693,313 | 25.7% |
| 2-Person Household | 3,290,614 | 31.4% |
| 3-Person Household | 1,721,819 | 16.4% |
| 4+ Person Household | 2,784,807 | 26.6% |
| Total Housing Units | 10,490,553 | 100.0% |
Occupancy by Ownership by Household Size in Texas
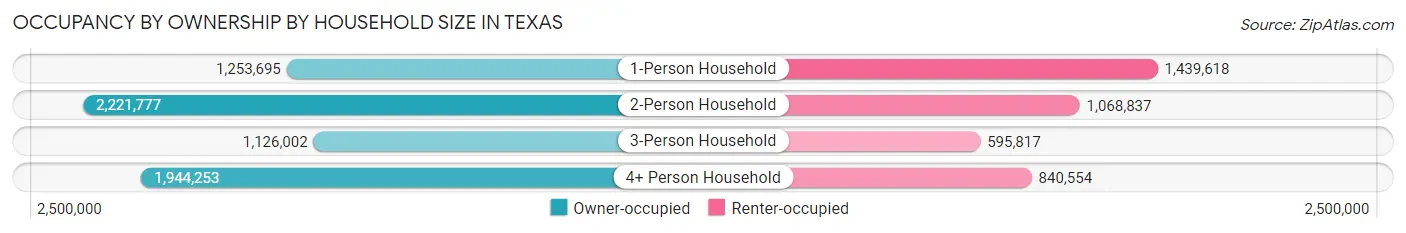
| Household Size | Owner-occupied | Renter-occupied |
| 1-Person Household | 1,253,695 (46.6%) | 1,439,618 (53.4%) |
| 2-Person Household | 2,221,777 (67.5%) | 1,068,837 (32.5%) |
| 3-Person Household | 1,126,002 (65.4%) | 595,817 (34.6%) |
| 4+ Person Household | 1,944,253 (69.8%) | 840,554 (30.2%) |
| Total Housing Units | 6,545,727 (62.4%) | 3,944,826 (37.6%) |
Occupancy by Educational Attainment in Texas
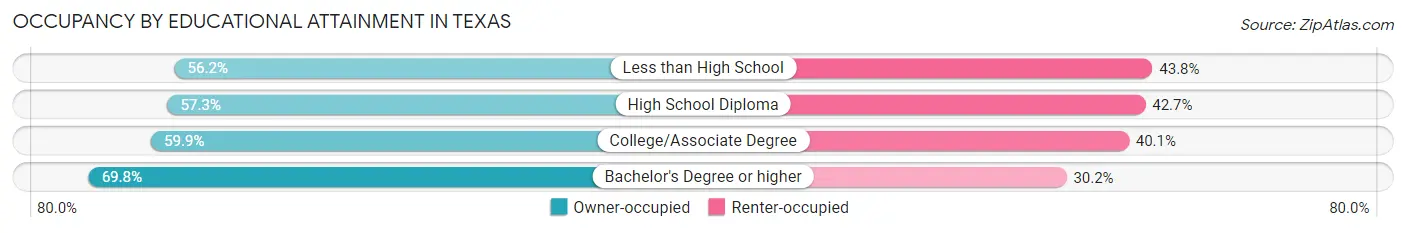
| Household Size | Owner-occupied | Renter-occupied |
| Less than High School | 745,109 (56.2%) | 580,840 (43.8%) |
| High School Diploma | 1,299,605 (57.3%) | 967,604 (42.7%) |
| College/Associate Degree | 1,907,417 (59.9%) | 1,275,435 (40.1%) |
| Bachelor's Degree or higher | 2,593,596 (69.8%) | 1,120,947 (30.2%) |
Occupancy by Age of Householder in Texas
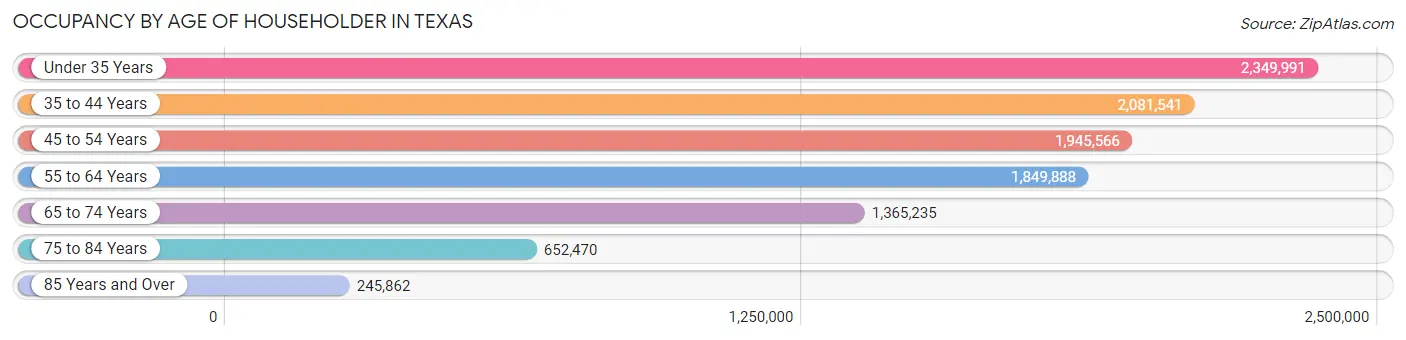
| Age Bracket | # Households | % Households |
| Under 35 Years | 2,349,991 | 22.4% |
| 35 to 44 Years | 2,081,541 | 19.8% |
| 45 to 54 Years | 1,945,566 | 18.5% |
| 55 to 64 Years | 1,849,888 | 17.6% |
| 65 to 74 Years | 1,365,235 | 13.0% |
| 75 to 84 Years | 652,470 | 6.2% |
| 85 Years and Over | 245,862 | 2.3% |
| Total | 10,490,553 | 100.0% |
Housing Finances in Texas
Median Income by Occupancy in Texas
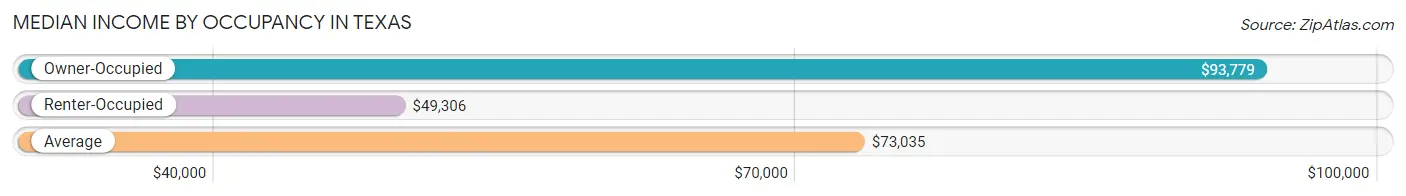
| Occupancy Type | # Households | Median Income |
| Owner-Occupied | 6,545,727 (62.4%) | $93,779 |
| Renter-Occupied | 3,944,826 (37.6%) | $49,306 |
| Average | 10,490,553 (100.0%) | $73,035 |
Occupancy by Householder Income Bracket in Texas

| Income Bracket | Owner-occupied | Renter-occupied |
| Less than $5,000 | 124,823 (1.9%) | 198,424 (5.0%) |
| $5,000 to $9,999 | 80,009 (1.2%) | 129,682 (3.3%) |
| $10,000 to $14,999 | 147,024 (2.2%) | 233,375 (5.9%) |
| $15,000 to $19,999 | 152,847 (2.3%) | 192,987 (4.9%) |
| $20,000 to $24,999 | 169,302 (2.6%) | 214,776 (5.4%) |
| $25,000 to $34,999 | 369,634 (5.7%) | 440,319 (11.2%) |
| $35,000 to $49,999 | 575,078 (8.8%) | 585,890 (14.8%) |
| $50,000 to $74,999 | 985,295 (15.0%) | 766,649 (19.4%) |
| $75,000 to $99,999 | 868,209 (13.3%) | 466,410 (11.8%) |
| $100,000 to $149,999 | 1,324,386 (20.2%) | 443,653 (11.3%) |
| $150,000 or more | 1,749,120 (26.7%) | 272,661 (6.9%) |
| Total | 6,545,727 (100.0%) | 3,944,826 (100.0%) |
Monthly Housing Cost Tiers in Texas
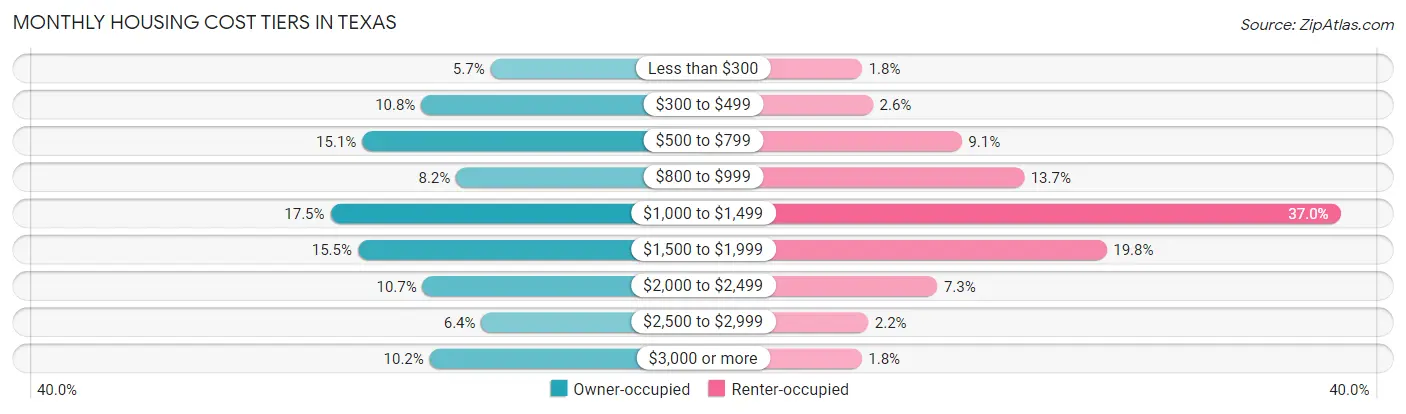
| Monthly Cost | Owner-occupied | Renter-occupied |
| Less than $300 | 372,776 (5.7%) | 70,760 (1.8%) |
| $300 to $499 | 706,194 (10.8%) | 102,215 (2.6%) |
| $500 to $799 | 991,025 (15.1%) | 360,267 (9.1%) |
| $800 to $999 | 538,216 (8.2%) | 541,294 (13.7%) |
| $1,000 to $1,499 | 1,144,494 (17.5%) | 1,461,219 (37.0%) |
| $1,500 to $1,999 | 1,012,131 (15.5%) | 781,204 (19.8%) |
| $2,000 to $2,499 | 699,420 (10.7%) | 289,201 (7.3%) |
| $2,500 to $2,999 | 416,054 (6.4%) | 88,284 (2.2%) |
| $3,000 or more | 665,417 (10.2%) | 69,511 (1.8%) |
| Total | 6,545,727 (100.0%) | 3,944,826 (100.0%) |
Physical Housing Characteristics in Texas
Housing Structures in Texas
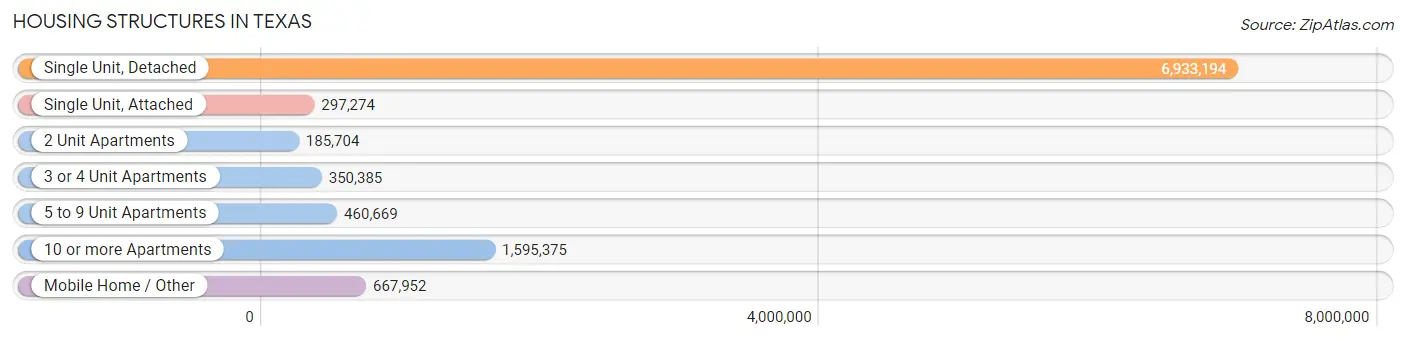
| Structure Type | # Housing Units | % Housing Units |
| Single Unit, Detached | 6,933,194 | 66.1% |
| Single Unit, Attached | 297,274 | 2.8% |
| 2 Unit Apartments | 185,704 | 1.8% |
| 3 or 4 Unit Apartments | 350,385 | 3.3% |
| 5 to 9 Unit Apartments | 460,669 | 4.4% |
| 10 or more Apartments | 1,595,375 | 15.2% |
| Mobile Home / Other | 667,952 | 6.4% |
| Total | 10,490,553 | 100.0% |
Housing Structures by Occupancy in Texas
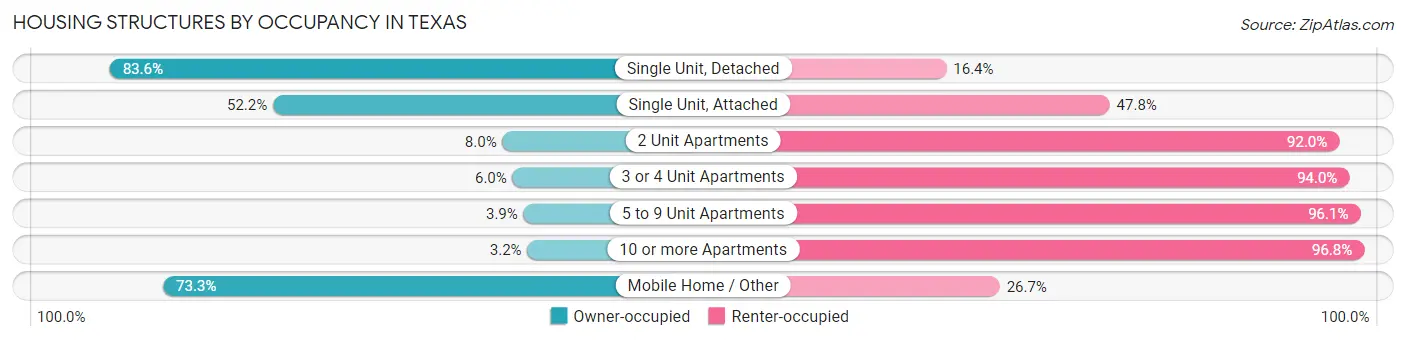
| Structure Type | Owner-occupied | Renter-occupied |
| Single Unit, Detached | 5,796,049 (83.6%) | 1,137,145 (16.4%) |
| Single Unit, Attached | 155,071 (52.2%) | 142,203 (47.8%) |
| 2 Unit Apartments | 14,845 (8.0%) | 170,859 (92.0%) |
| 3 or 4 Unit Apartments | 21,148 (6.0%) | 329,237 (94.0%) |
| 5 to 9 Unit Apartments | 18,044 (3.9%) | 442,625 (96.1%) |
| 10 or more Apartments | 50,754 (3.2%) | 1,544,621 (96.8%) |
| Mobile Home / Other | 489,816 (73.3%) | 178,136 (26.7%) |
| Total | 6,545,727 (62.4%) | 3,944,826 (37.6%) |
Housing Structures by Number of Rooms in Texas
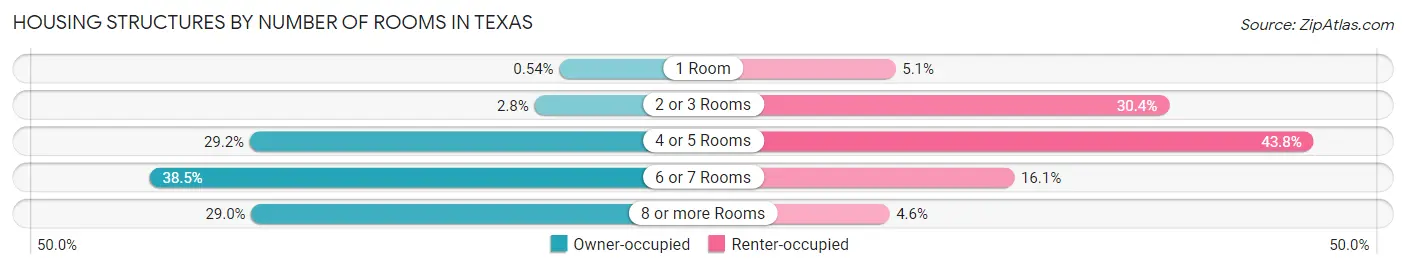
| Number of Rooms | Owner-occupied | Renter-occupied |
| 1 Room | 35,053 (0.5%) | 202,041 (5.1%) |
| 2 or 3 Rooms | 185,396 (2.8%) | 1,200,297 (30.4%) |
| 4 or 5 Rooms | 1,908,655 (29.2%) | 1,727,649 (43.8%) |
| 6 or 7 Rooms | 2,516,905 (38.5%) | 635,050 (16.1%) |
| 8 or more Rooms | 1,899,718 (29.0%) | 179,789 (4.6%) |
| Total | 6,545,727 (100.0%) | 3,944,826 (100.0%) |
Housing Structure by Heating Type in Texas
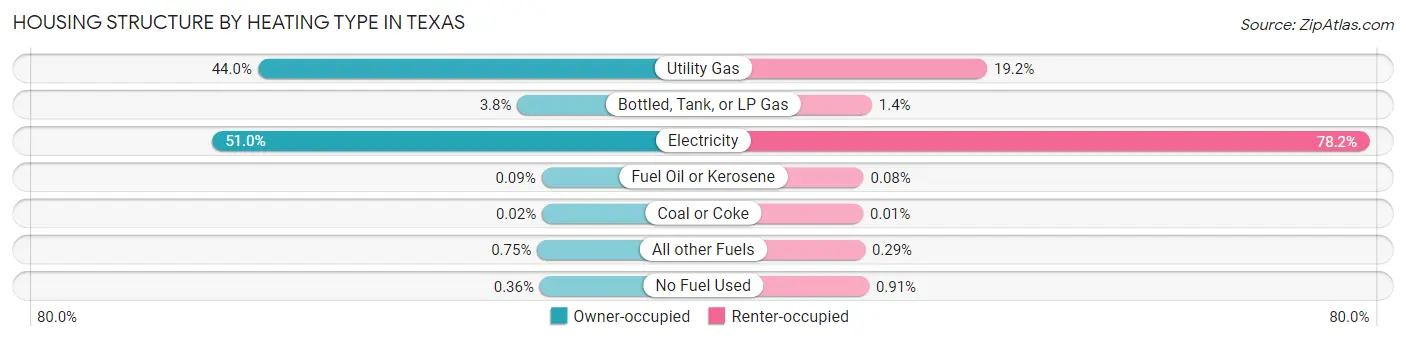
| Heating Type | Owner-occupied | Renter-occupied |
| Utility Gas | 2,877,380 (44.0%) | 756,177 (19.2%) |
| Bottled, Tank, or LP Gas | 251,583 (3.8%) | 53,575 (1.4%) |
| Electricity | 3,337,471 (51.0%) | 3,084,299 (78.2%) |
| Fuel Oil or Kerosene | 5,908 (0.1%) | 3,097 (0.1%) |
| Coal or Coke | 986 (0.0%) | 506 (0.0%) |
| All other Fuels | 48,882 (0.7%) | 11,255 (0.3%) |
| No Fuel Used | 23,517 (0.4%) | 35,917 (0.9%) |
| Total | 6,545,727 (100.0%) | 3,944,826 (100.0%) |
Household Vehicle Usage in Texas
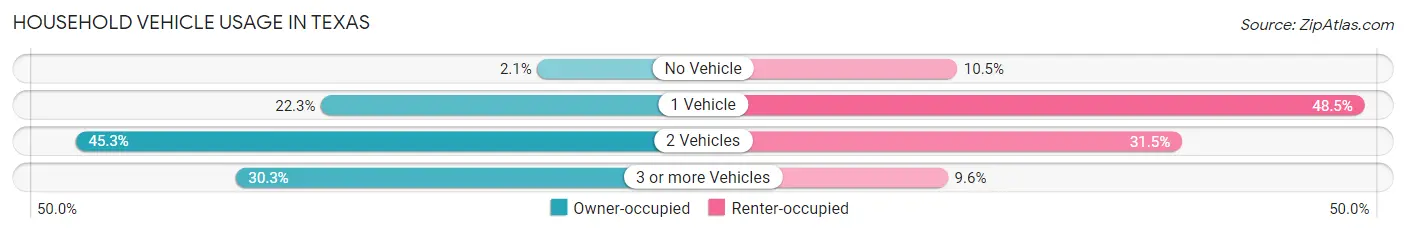
| Vehicles per Household | Owner-occupied | Renter-occupied |
| No Vehicle | 138,749 (2.1%) | 412,351 (10.4%) |
| 1 Vehicle | 1,459,933 (22.3%) | 1,913,469 (48.5%) |
| 2 Vehicles | 2,962,111 (45.3%) | 1,240,847 (31.5%) |
| 3 or more Vehicles | 1,984,934 (30.3%) | 378,159 (9.6%) |
| Total | 6,545,727 (100.0%) | 3,944,826 (100.0%) |
Real Estate & Mortgages in Texas
Real Estate and Mortgage Overview in Texas
| Characteristic | Without Mortgage | With Mortgage |
| Housing Units | 2,846,211 | 3,699,516 |
| Median Property Value | $187,300 | $271,700 |
| Median Household Income | $68,703 | $1,252,140 |
| Monthly Housing Costs | $611 | $637,777 |
| Real Estate Taxes | $2,574 | $144,435 |
Property Value by Mortgage Status in Texas
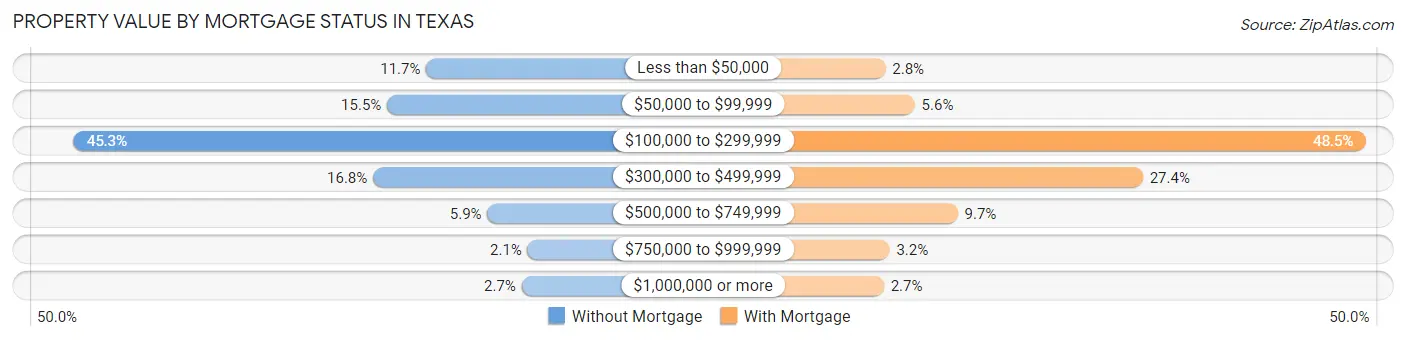
| Property Value | Without Mortgage | With Mortgage |
| Less than $50,000 | 334,198 (11.7%) | 105,084 (2.8%) |
| $50,000 to $99,999 | 440,388 (15.5%) | 208,389 (5.6%) |
| $100,000 to $299,999 | 1,289,719 (45.3%) | 1,795,877 (48.5%) |
| $300,000 to $499,999 | 478,444 (16.8%) | 1,011,977 (27.4%) |
| $500,000 to $749,999 | 168,375 (5.9%) | 359,435 (9.7%) |
| $750,000 to $999,999 | 59,520 (2.1%) | 119,486 (3.2%) |
| $1,000,000 or more | 75,567 (2.7%) | 99,268 (2.7%) |
| Total | 2,846,211 (100.0%) | 3,699,516 (100.0%) |
Household Income by Mortgage Status in Texas
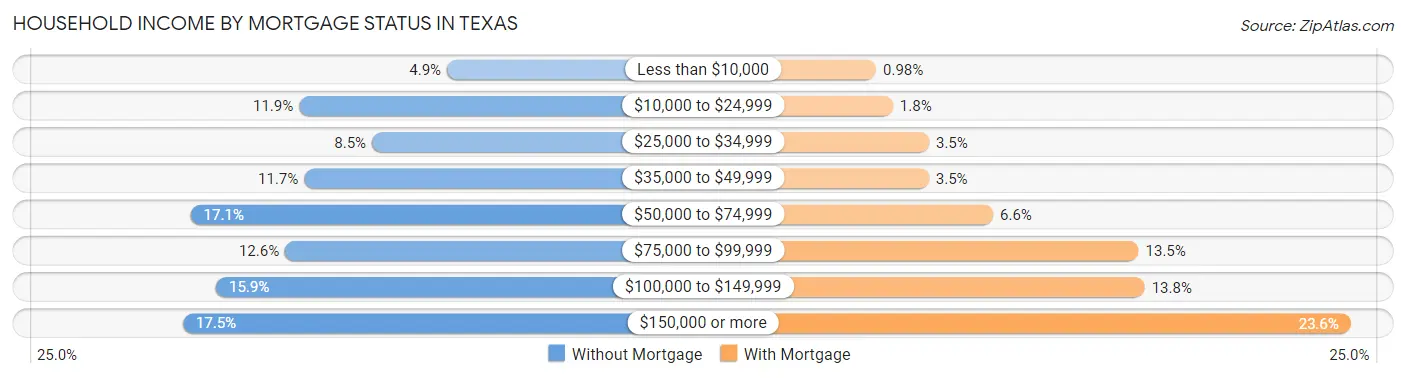
| Household Income | Without Mortgage | With Mortgage |
| Less than $10,000 | 139,082 (4.9%) | 36,400 (1.0%) |
| $10,000 to $24,999 | 339,579 (11.9%) | 65,750 (1.8%) |
| $25,000 to $34,999 | 240,687 (8.5%) | 129,594 (3.5%) |
| $35,000 to $49,999 | 332,580 (11.7%) | 128,947 (3.5%) |
| $50,000 to $74,999 | 486,529 (17.1%) | 242,498 (6.6%) |
| $75,000 to $99,999 | 358,703 (12.6%) | 498,766 (13.5%) |
| $100,000 to $149,999 | 452,071 (15.9%) | 509,506 (13.8%) |
| $150,000 or more | 496,980 (17.5%) | 872,315 (23.6%) |
| Total | 2,846,211 (100.0%) | 3,699,516 (100.0%) |
Property Value to Household Income Ratio in Texas
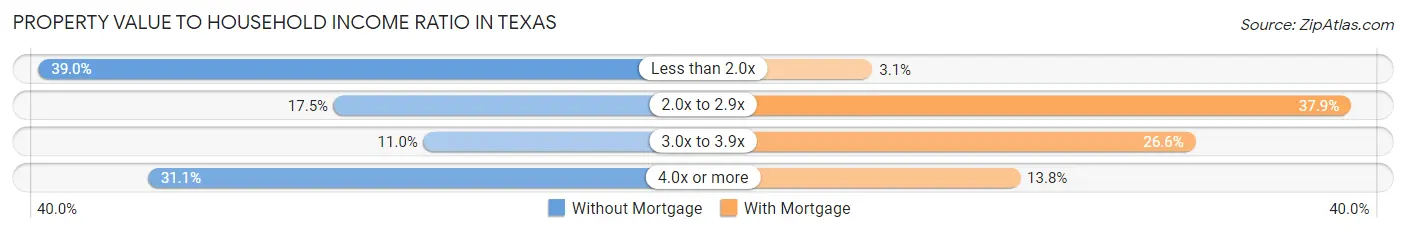
| Value-to-Income Ratio | Without Mortgage | With Mortgage |
| Less than 2.0x | 1,110,077 (39.0%) | 113,935 (3.1%) |
| 2.0x to 2.9x | 498,933 (17.5%) | 1,400,655 (37.9%) |
| 3.0x to 3.9x | 313,447 (11.0%) | 982,549 (26.6%) |
| 4.0x or more | 883,851 (31.0%) | 511,303 (13.8%) |
| Total | 2,846,211 (100.0%) | 3,699,516 (100.0%) |
Real Estate Taxes by Mortgage Status in Texas
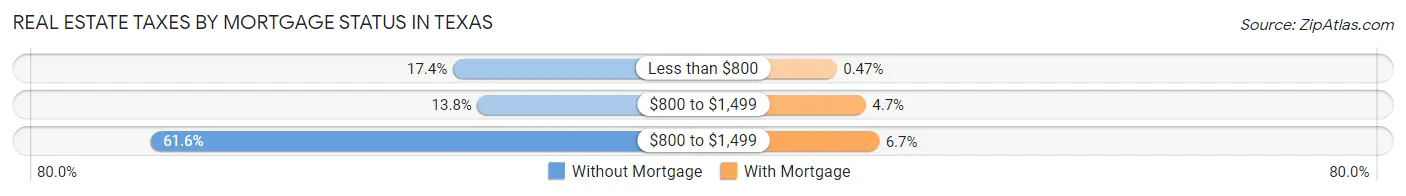
| Property Taxes | Without Mortgage | With Mortgage |
| Less than $800 | 495,158 (17.4%) | 17,294 (0.5%) |
| $800 to $1,499 | 392,916 (13.8%) | 174,675 (4.7%) |
| $800 to $1,499 | 1,754,404 (61.6%) | 246,932 (6.7%) |
| Total | 2,846,211 (100.0%) | 3,699,516 (100.0%) |
Health & Disability in Texas
Health Insurance Coverage by Age in Texas
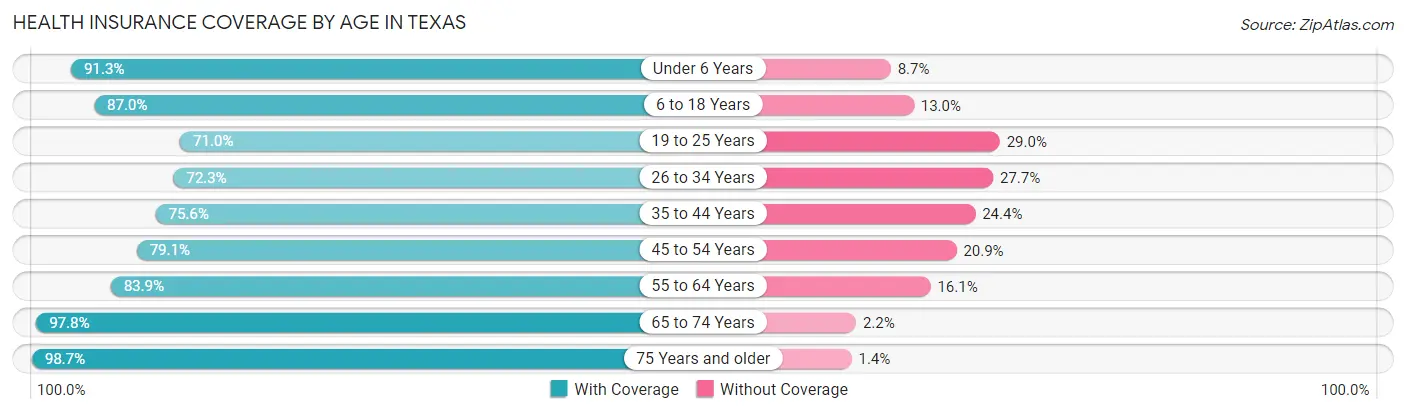
| Age Bracket | With Coverage | Without Coverage |
| Under 6 Years | 2,120,909 (91.3%) | 201,069 (8.7%) |
| 6 to 18 Years | 4,789,571 (87.0%) | 713,357 (13.0%) |
| 19 to 25 Years | 2,010,839 (71.0%) | 820,931 (29.0%) |
| 26 to 34 Years | 2,674,836 (72.3%) | 1,026,907 (27.7%) |
| 35 to 44 Years | 2,986,103 (75.6%) | 964,957 (24.4%) |
| 45 to 54 Years | 2,800,341 (79.1%) | 740,452 (20.9%) |
| 55 to 64 Years | 2,715,361 (83.9%) | 519,937 (16.1%) |
| 65 to 74 Years | 2,218,746 (97.8%) | 49,346 (2.2%) |
| 75 Years and older | 1,391,693 (98.7%) | 19,052 (1.3%) |
| Total | 23,708,399 (82.4%) | 5,056,008 (17.6%) |
Health Insurance Coverage by Citizenship Status in Texas
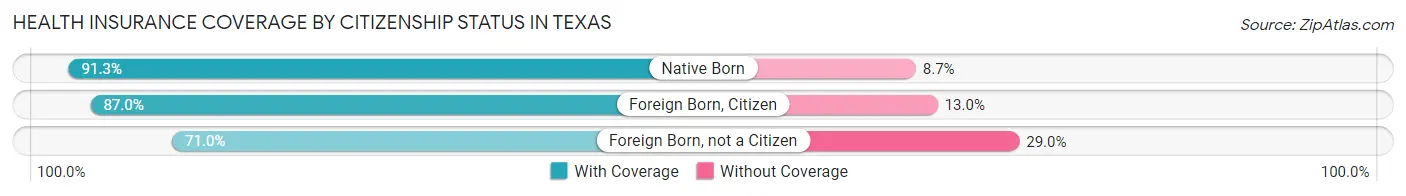
| Citizenship Status | With Coverage | Without Coverage |
| Native Born | 2,120,909 (91.3%) | 201,069 (8.7%) |
| Foreign Born, Citizen | 4,789,571 (87.0%) | 713,357 (13.0%) |
| Foreign Born, not a Citizen | 2,010,839 (71.0%) | 820,931 (29.0%) |
Health Insurance Coverage by Household Income in Texas
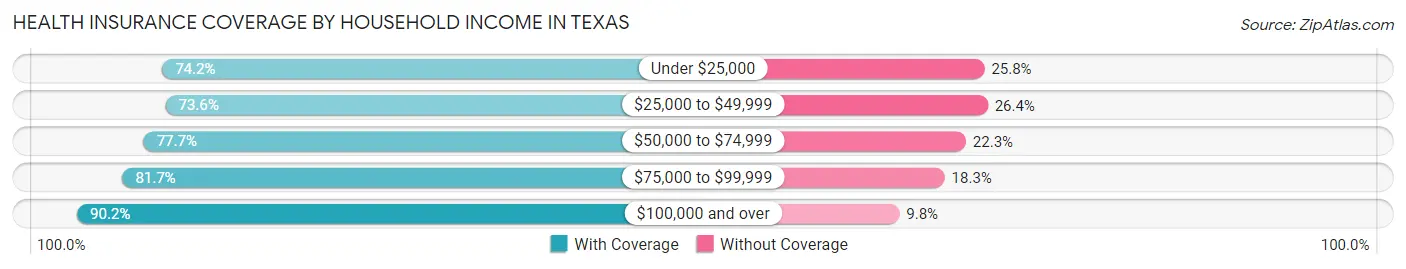
| Household Income | With Coverage | Without Coverage |
| Under $25,000 | 2,430,092 (74.2%) | 844,496 (25.8%) |
| $25,000 to $49,999 | 3,487,681 (73.6%) | 1,251,059 (26.4%) |
| $50,000 to $74,999 | 3,572,050 (77.7%) | 1,026,596 (22.3%) |
| $75,000 to $99,999 | 3,147,274 (81.7%) | 706,854 (18.3%) |
| $100,000 and over | 10,898,016 (90.2%) | 1,189,914 (9.8%) |
Public vs Private Health Insurance Coverage by Age in Texas
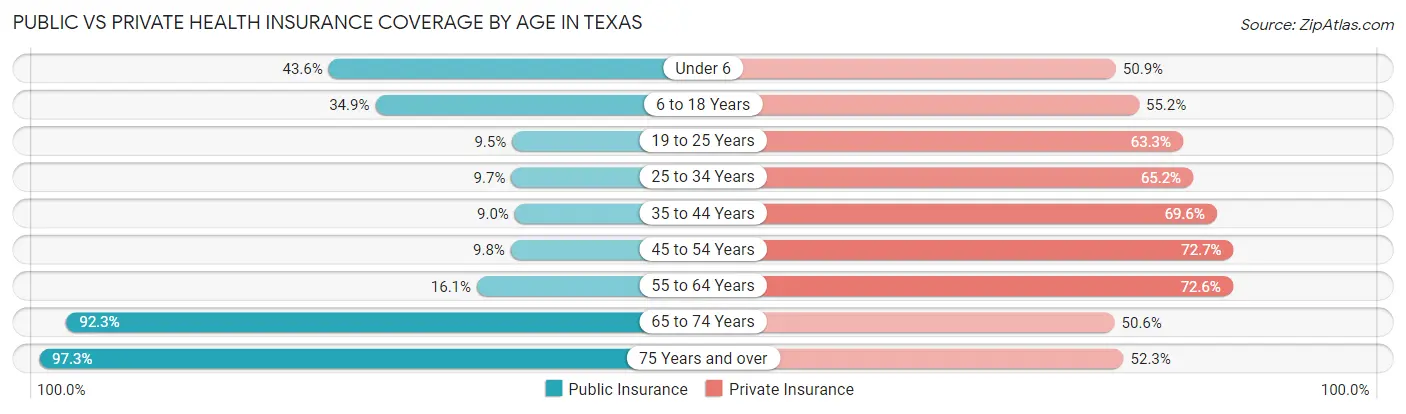
| Age Bracket | Public Insurance | Private Insurance |
| Under 6 | 1,011,944 (43.6%) | 1,181,521 (50.9%) |
| 6 to 18 Years | 1,921,461 (34.9%) | 3,036,787 (55.2%) |
| 19 to 25 Years | 269,692 (9.5%) | 1,792,385 (63.3%) |
| 25 to 34 Years | 357,950 (9.7%) | 2,412,324 (65.2%) |
| 35 to 44 Years | 357,151 (9.0%) | 2,749,366 (69.6%) |
| 45 to 54 Years | 346,198 (9.8%) | 2,573,309 (72.7%) |
| 55 to 64 Years | 519,247 (16.1%) | 2,347,186 (72.6%) |
| 65 to 74 Years | 2,092,398 (92.2%) | 1,148,614 (50.6%) |
| 75 Years and over | 1,372,627 (97.3%) | 737,928 (52.3%) |
| Total | 8,248,668 (28.7%) | 17,979,420 (62.5%) |
Disability Status by Sex by Age in Texas
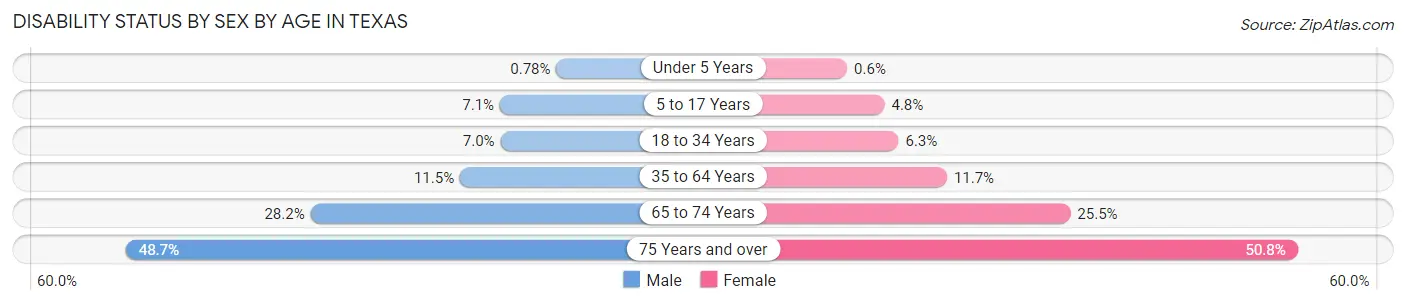
| Age Bracket | Male | Female |
| Under 5 Years | 7,691 (0.8%) | 5,648 (0.6%) |
| 5 to 17 Years | 196,968 (7.1%) | 127,349 (4.8%) |
| 18 to 34 Years | 246,060 (7.0%) | 218,997 (6.3%) |
| 35 to 64 Years | 612,766 (11.5%) | 632,699 (11.7%) |
| 65 to 74 Years | 299,726 (28.2%) | 306,424 (25.5%) |
| 75 Years and over | 288,258 (48.7%) | 415,796 (50.7%) |
Disability Class by Sex by Age in Texas
Disability Class: Hearing Difficulty
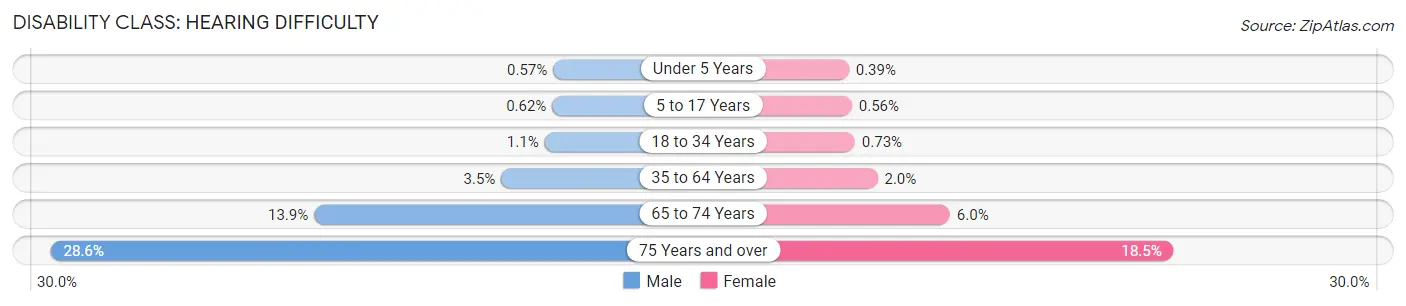
| Age Bracket | Male | Female |
| Under 5 Years | 5,619 (0.6%) | 3,662 (0.4%) |
| 5 to 17 Years | 17,399 (0.6%) | 14,959 (0.6%) |
| 18 to 34 Years | 36,672 (1.1%) | 25,330 (0.7%) |
| 35 to 64 Years | 184,419 (3.5%) | 107,717 (2.0%) |
| 65 to 74 Years | 147,716 (13.9%) | 72,499 (6.0%) |
| 75 Years and over | 168,865 (28.5%) | 151,276 (18.5%) |
Disability Class: Vision Difficulty
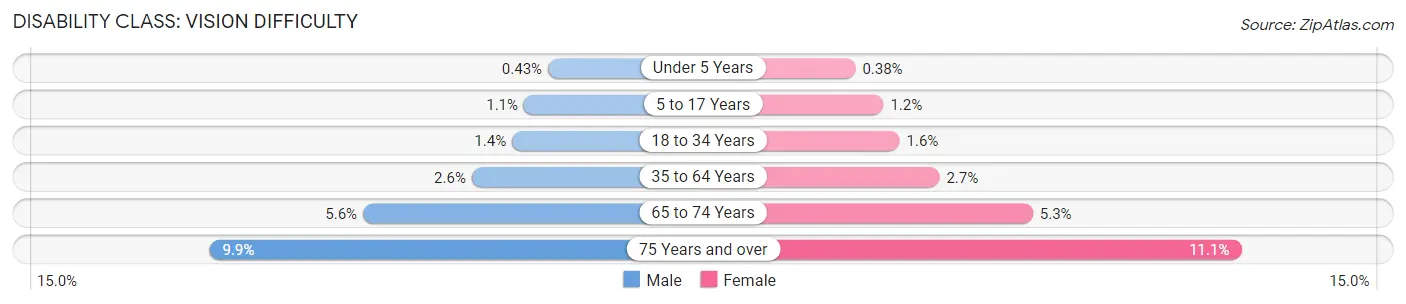
| Age Bracket | Male | Female |
| Under 5 Years | 4,269 (0.4%) | 3,619 (0.4%) |
| 5 to 17 Years | 30,760 (1.1%) | 31,106 (1.2%) |
| 18 to 34 Years | 50,023 (1.4%) | 55,820 (1.6%) |
| 35 to 64 Years | 135,871 (2.5%) | 147,021 (2.7%) |
| 65 to 74 Years | 59,405 (5.6%) | 63,977 (5.3%) |
| 75 Years and over | 58,276 (9.9%) | 91,059 (11.1%) |
Disability Class: Cognitive Difficulty
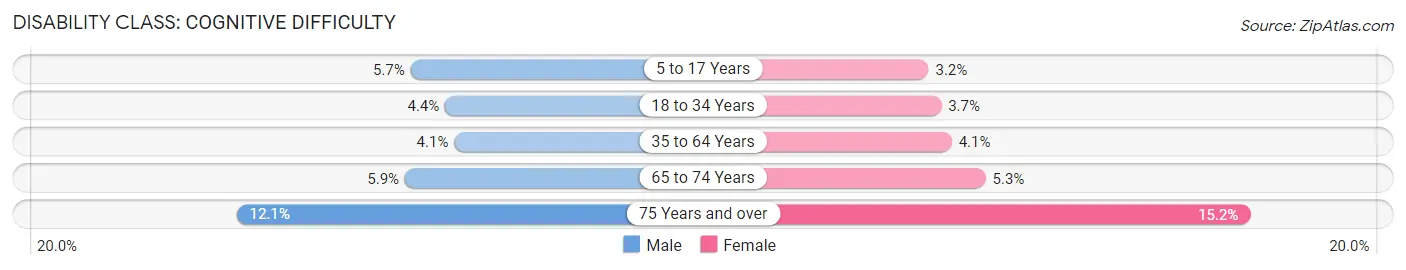
| Age Bracket | Male | Female |
| 5 to 17 Years | 158,059 (5.7%) | 86,150 (3.2%) |
| 18 to 34 Years | 154,162 (4.4%) | 127,764 (3.7%) |
| 35 to 64 Years | 215,581 (4.1%) | 220,564 (4.1%) |
| 65 to 74 Years | 62,591 (5.9%) | 64,283 (5.3%) |
| 75 Years and over | 71,724 (12.1%) | 124,204 (15.2%) |
Disability Class: Ambulatory Difficulty
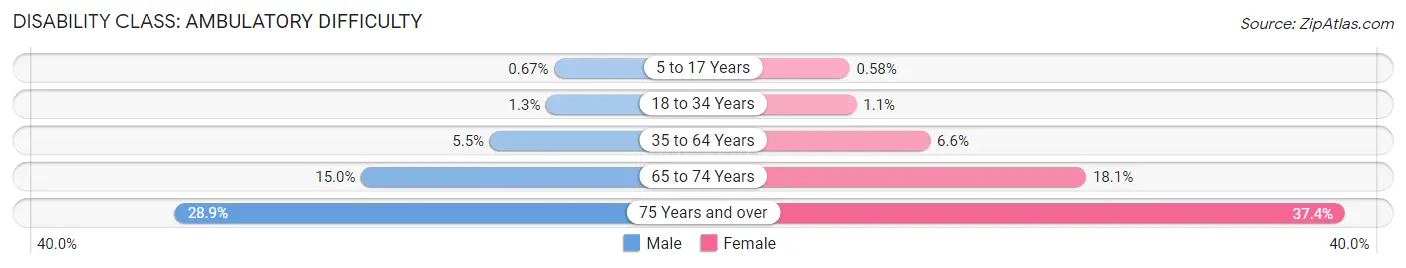
| Age Bracket | Male | Female |
| 5 to 17 Years | 18,821 (0.7%) | 15,534 (0.6%) |
| 18 to 34 Years | 44,501 (1.3%) | 37,253 (1.1%) |
| 35 to 64 Years | 290,326 (5.4%) | 354,327 (6.6%) |
| 65 to 74 Years | 159,670 (15.0%) | 218,225 (18.1%) |
| 75 Years and over | 170,660 (28.8%) | 305,980 (37.3%) |
Disability Class: Self-Care Difficulty
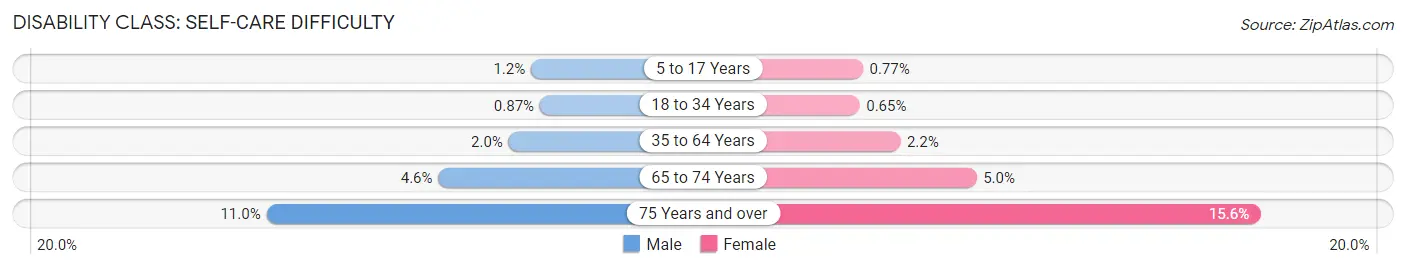
| Age Bracket | Male | Female |
| 5 to 17 Years | 33,360 (1.2%) | 20,641 (0.8%) |
| 18 to 34 Years | 30,429 (0.9%) | 22,621 (0.6%) |
| 35 to 64 Years | 108,322 (2.0%) | 116,732 (2.2%) |
| 65 to 74 Years | 49,350 (4.6%) | 60,067 (5.0%) |
| 75 Years and over | 65,189 (11.0%) | 127,455 (15.6%) |
Technology Access in Texas
Computing Device Access in Texas
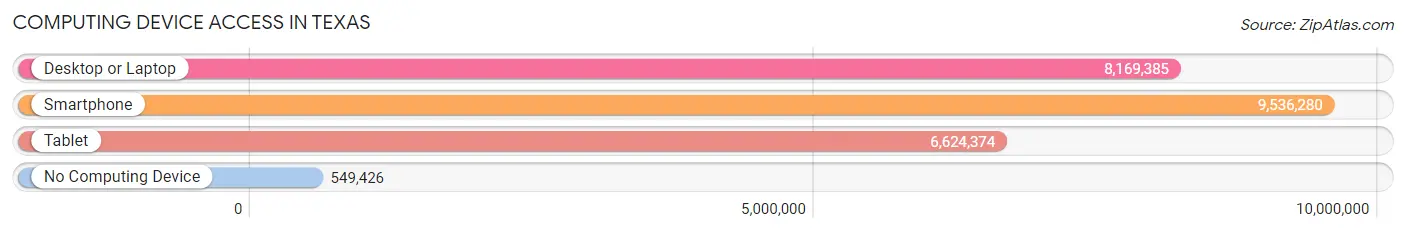
| Device Type | # Households | % Households |
| Desktop or Laptop | 8,169,385 | 77.9% |
| Smartphone | 9,536,280 | 90.9% |
| Tablet | 6,624,374 | 63.1% |
| No Computing Device | 549,426 | 5.2% |
| Total | 10,490,553 | 100.0% |
Internet Access in Texas
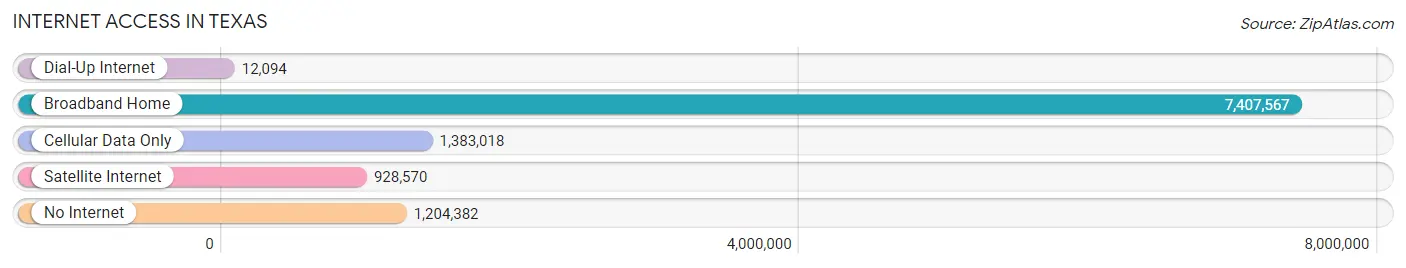
| Internet Type | # Households | % Households |
| Dial-Up Internet | 12,094 | 0.1% |
| Broadband Home | 7,407,567 | 70.6% |
| Cellular Data Only | 1,383,018 | 13.2% |
| Satellite Internet | 928,570 | 8.8% |
| No Internet | 1,204,382 | 11.5% |
| Total | 10,490,553 | 100.0% |
Texas Summary
Texas is a state located in the south-central region of the United States. It is the second largest state in the country, both in terms of population and land area. Texas is known for its diverse culture, its vibrant economy, and its rich history.
Geography
Texas is bordered by the states of Oklahoma to the north, Arkansas to the northeast, Louisiana to the east, New Mexico to the west, and Mexico to the south. The state is divided into four distinct geographic regions: the Gulf Coastal Plains, the Great Plains, the Edwards Plateau, and the Basin and Range Province. The Gulf Coastal Plains region is located along the Gulf of Mexico and is characterized by flat terrain and sandy beaches. The Great Plains region is located in the northern part of the state and is characterized by rolling hills and grasslands. The Edwards Plateau is located in the central part of the state and is characterized by limestone hills and canyons. The Basin and Range Province is located in the western part of the state and is characterized by mountains and desert.
History
Texas has a long and rich history. The area was first inhabited by Native American tribes, including the Apache, Comanche, and Caddo. In 1519, Spanish explorer Alonso Alvarez de Pineda became the first European to explore the area. In 1685, the Spanish established a mission in the area, which eventually led to the establishment of the city of San Antonio. In 1821, Mexico gained independence from Spain and Texas became part of the Mexican state of Coahuila y Tejas. In 1836, Texas declared its independence from Mexico and became the Republic of Texas. In 1845, Texas was annexed by the United States and became the 28th state.
Economy
Texas has a vibrant and diverse economy. The state is a major producer of oil and natural gas, and is home to some of the largest oil and gas companies in the world. The state is also a major producer of agricultural products, including cotton, cattle, and wheat. Texas is also a major producer of industrial products, including chemicals, electronics, and machinery. Additionally, the state is home to a large number of technology companies, including Dell, Texas Instruments, and Samsung.
Demographics
As of 2020, the population of Texas was estimated to be 29.1 million. The state is home to a diverse population, with the largest ethnic groups being White (43.8%), Hispanic or Latino (40.5%), and Black or African American (12.2%). The largest cities in the state are Houston, San Antonio, Dallas, and Austin. The state is also home to a large number of immigrants, with the largest groups being from Mexico, India, and El Salvador.
In conclusion, Texas is a state with a rich history, diverse culture, and vibrant economy. The state is home to a diverse population and is a major producer of oil and natural gas, agricultural products, and industrial products. Texas is also home to a large number of technology companies and is a major destination for immigrants.
Common Questions
When was Texas Incorporated?
Texas was Incorporated into the Union on Dec 29, 1845.
What is the Total Area of Texas?
Total Area of Texas is 268,597 Square Miles.
What is the Total Land Area of Texas?
Total Land Area of Texas is 261,226 Square Miles.
What is the Total Water Area of Texas?
Total Water Area of Texas is 7,371 Square Miles.
What is the Average Elevation in Texas?
Average Elevation in Texas is 1,700 Feet.
What is the Highest Elevation in Texas?
Highest Elevation in Texas is 8,749 Feet.
What is the Lowest Elevation in Texas?
Lowest Elevation in Texas is 0 Feet.
What is the Population Density in Texas?
Population Density in Texas is 112.0 People per Square Mile.
What is Per Capita Income in Texas?
Per Capita income in Texas is $37,514.
What is the Median Family Income in Texas?
Median Family Income in Texas is $87,594.
What is the Median Household income in Texas?
Median Household Income in Texas is $73,035.
What is Income or Wage Gap in Texas?
Income or Wage Gap in Texas is 29.4%.
Women in Texas earn 70.6 cents for every dollar earned by a man.
What is Family Income Deficit in Texas?
Family Income Deficit in Texas is $11,331.
Families that are below poverty line in Texas earn $11,331 less on average than the poverty threshold level.
What is Inequality or Gini Index in Texas?
Inequality or Gini Index in Texas is 0.48.
What is the Total Population of Texas?
Total Population of Texas is 29,243,342.
What is the Total Male Population of Texas?
Total Male Population of Texas is 14,624,638.
What is the Total Female Population of Texas?
Total Female Population of Texas is 14,618,704.
What is the Ratio of Males per 100 Females in Texas?
There are 100.04 Males per 100 Females in Texas.
What is the Ratio of Females per 100 Males in Texas?
There are 99.96 Females per 100 Males in Texas.
What is the Median Population Age in Texas?
Median Population Age in Texas is 35.2 Years.
What is the Average Family Size in Texas
Average Family Size in Texas is 3.3 People.
What is the Average Household Size in Texas
Average Household Size in Texas is 2.7 People.
How Large is the Labor Force in Texas?
There are 14,776,656 People in the Labor Forcein in Texas.
What is the Percentage of People in the Labor Force in Texas?
65.1% of People are in the Labor Force in Texas.
What is the Unemployment Rate in Texas?
Unemployment Rate in Texas is 5.2%.