Cohasset, CA Map & Demographics
Cohasset Map
Cohasset Overview
$92,896
PER CAPITA INCOME
$78,491
AVG FAMILY INCOME
$76,696
AVG HOUSEHOLD INCOME
0.68
INEQUALITY / GINI INDEX
392
TOTAL POPULATION
241
MALE POPULATION
151
FEMALE POPULATION
159.60
MALES / 100 FEMALES
62.66
FEMALES / 100 MALES
50.9
MEDIAN AGE
2.5
AVG FAMILY SIZE
2.0
AVG HOUSEHOLD SIZE
245
LABOR FORCE [ PEOPLE ]
74.2%
PERCENT IN LABOR FORCE
9.4%
UNEMPLOYMENT RATE
Income in Cohasset
Income Overview in Cohasset
Per Capita Income in Cohasset is $92,896, while median incomes of families and households are $78,491 and $76,696 respectively.
| Characteristic | Number | Measure |
| Per Capita Income | 392 | $92,896 |
| Median Family Income | 103 | $78,491 |
| Mean Family Income | 103 | $97,150 |
| Median Household Income | 197 | $76,696 |
| Mean Household Income | 197 | $186,635 |
| Income Deficit | 103 | $0 |
| Wage / Income Gap (%) | 392 | 0.00% |
| Wage / Income Gap ($) | 392 | 100.00¢ per $1 |
| Gini / Inequality Index | 392 | 0.68 |
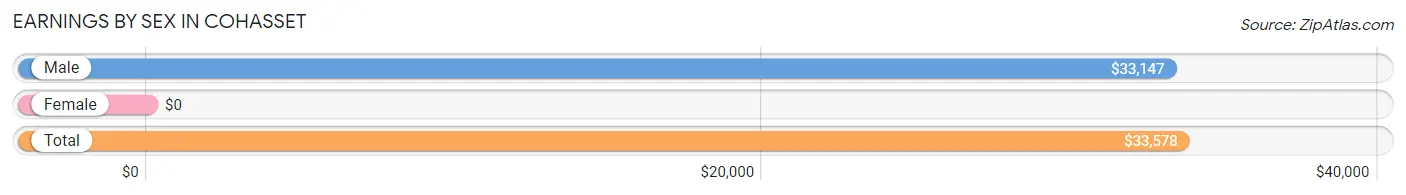
Earnings by Sex in Cohasset
| Sex | Number | Average Earnings |
| Male | 151 (58.3%) | $33,147 |
| Female | 108 (41.7%) | $0 |
| Total | 259 (100.0%) | $33,578 |
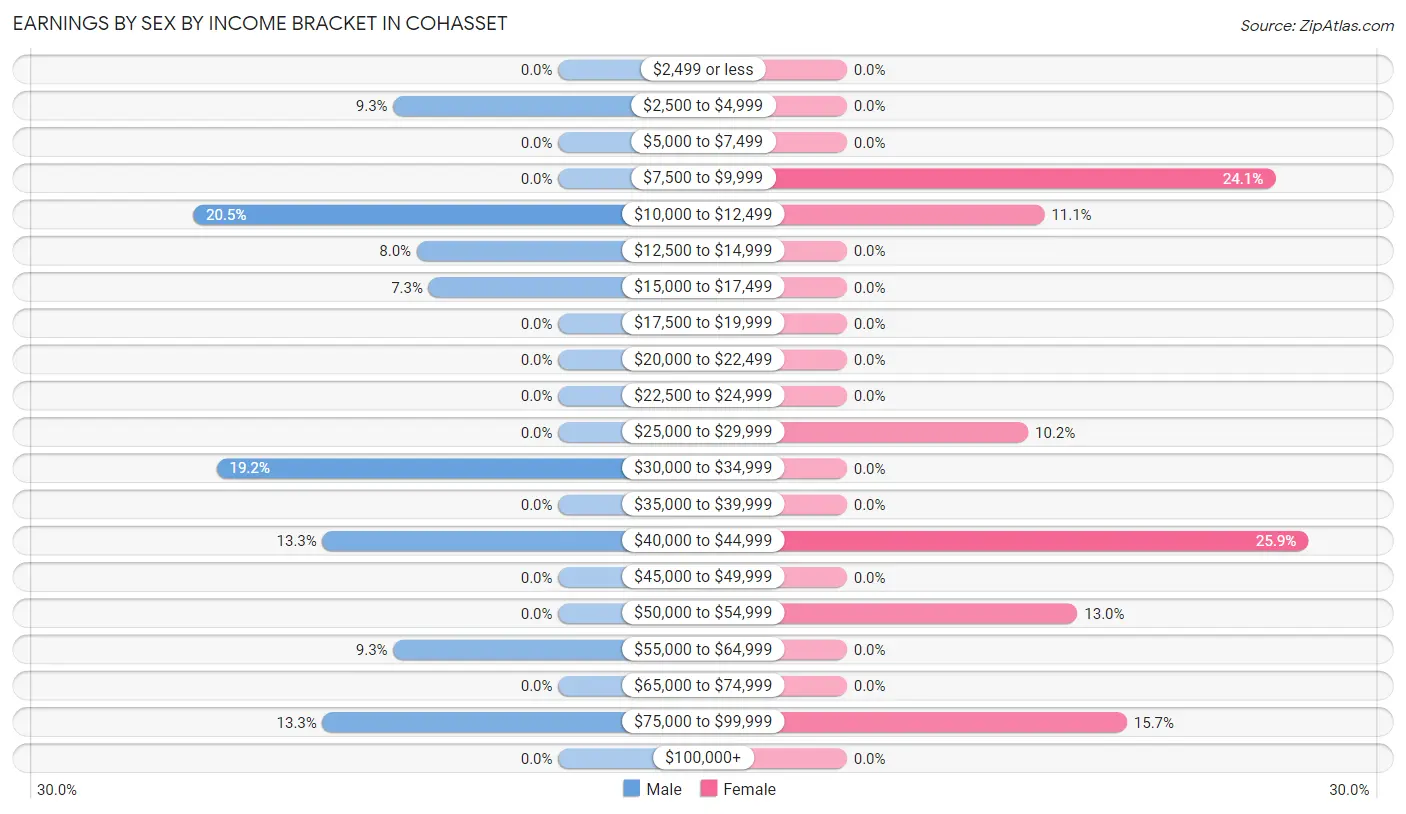
Earnings by Sex by Income Bracket in Cohasset
The most common earnings brackets in Cohasset are $10,000 to $12,499 for men (31 | 20.5%) and $40,000 to $44,999 for women (28 | 25.9%).
| Income | Male | Female |
| $2,499 or less | 0 (0.0%) | 0 (0.0%) |
| $2,500 to $4,999 | 14 (9.3%) | 0 (0.0%) |
| $5,000 to $7,499 | 0 (0.0%) | 0 (0.0%) |
| $7,500 to $9,999 | 0 (0.0%) | 26 (24.1%) |
| $10,000 to $12,499 | 31 (20.5%) | 12 (11.1%) |
| $12,500 to $14,999 | 12 (8.0%) | 0 (0.0%) |
| $15,000 to $17,499 | 11 (7.3%) | 0 (0.0%) |
| $17,500 to $19,999 | 0 (0.0%) | 0 (0.0%) |
| $20,000 to $22,499 | 0 (0.0%) | 0 (0.0%) |
| $22,500 to $24,999 | 0 (0.0%) | 0 (0.0%) |
| $25,000 to $29,999 | 0 (0.0%) | 11 (10.2%) |
| $30,000 to $34,999 | 29 (19.2%) | 0 (0.0%) |
| $35,000 to $39,999 | 0 (0.0%) | 0 (0.0%) |
| $40,000 to $44,999 | 20 (13.3%) | 28 (25.9%) |
| $45,000 to $49,999 | 0 (0.0%) | 0 (0.0%) |
| $50,000 to $54,999 | 0 (0.0%) | 14 (13.0%) |
| $55,000 to $64,999 | 14 (9.3%) | 0 (0.0%) |
| $65,000 to $74,999 | 0 (0.0%) | 0 (0.0%) |
| $75,000 to $99,999 | 20 (13.3%) | 17 (15.7%) |
| $100,000+ | 0 (0.0%) | 0 (0.0%) |
| Total | 151 (100.0%) | 108 (100.0%) |
Earnings by Sex by Educational Attainment in Cohasset
| Educational Attainment | Male Income | Female Income |
| Less than High School | - | - |
| High School Diploma | - | - |
| College or Associate's Degree | - | - |
| Bachelor's Degree | - | - |
| Graduate Degree | - | - |
| Total | $33,147 | $0 |
Family Income in Cohasset
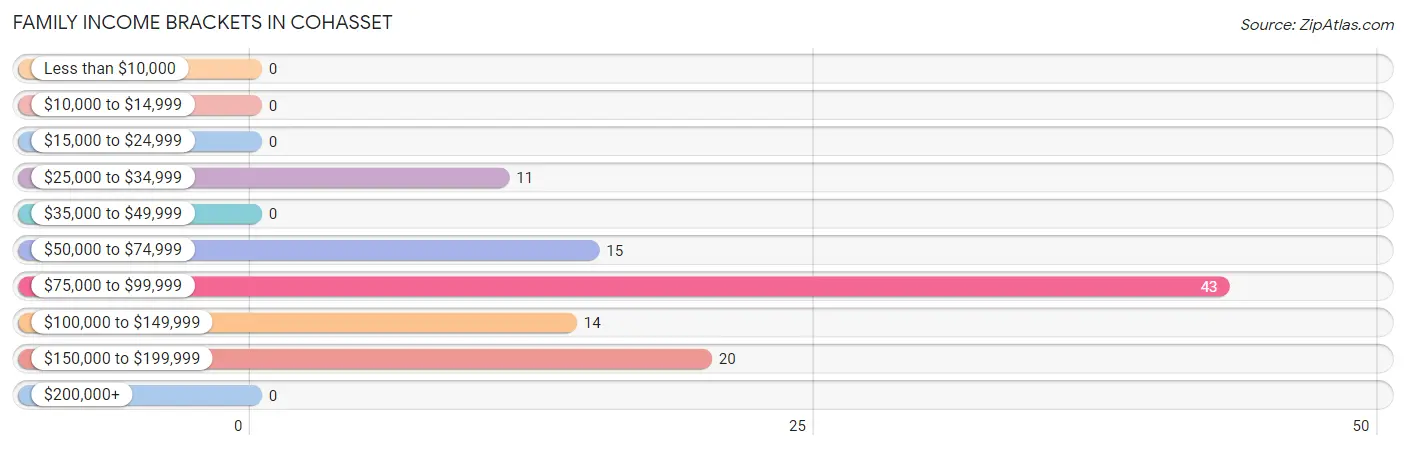
Family Income Brackets in Cohasset
According to the Cohasset family income data, there are 43 families falling into the $75,000 to $99,999 income range, which is the most common income bracket and makes up 41.7% of all families.
| Income Bracket | # Families | % Families |
| Less than $10,000 | 0 | 0.0% |
| $10,000 to $14,999 | 0 | 0.0% |
| $15,000 to $24,999 | 0 | 0.0% |
| $25,000 to $34,999 | 11 | 10.7% |
| $35,000 to $49,999 | 0 | 0.0% |
| $50,000 to $74,999 | 15 | 14.6% |
| $75,000 to $99,999 | 43 | 41.7% |
| $100,000 to $149,999 | 14 | 13.6% |
| $150,000 to $199,999 | 20 | 19.4% |
| $200,000+ | 0 | 0.0% |
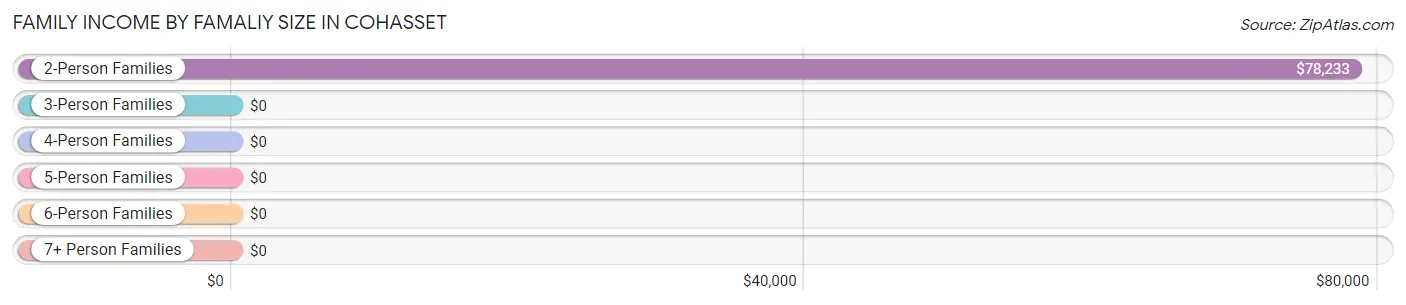
Family Income by Famaliy Size in Cohasset
2-person families (69 | 67.0%) account for the highest median family income in Cohasset with $78,233 per family, while 2-person families (69 | 67.0%) have the highest median income of $39,116 per family member.
| Income Bracket | # Families | Median Income |
| 2-Person Families | 69 (67.0%) | $78,233 |
| 3-Person Families | 20 (19.4%) | $0 |
| 4-Person Families | 0 (0.0%) | $0 |
| 5-Person Families | 14 (13.6%) | $0 |
| 6-Person Families | 0 (0.0%) | $0 |
| 7+ Person Families | 0 (0.0%) | $0 |
| Total | 103 (100.0%) | $78,491 |
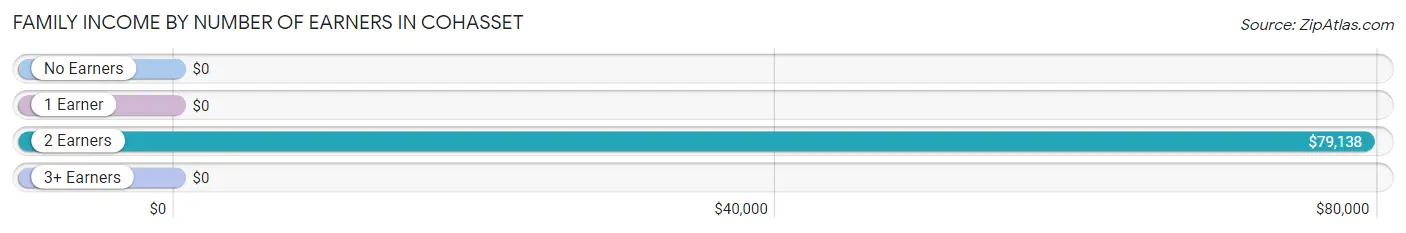
Family Income by Number of Earners in Cohasset
| Number of Earners | # Families | Median Income |
| No Earners | 0 (0.0%) | $0 |
| 1 Earner | 15 (14.6%) | $0 |
| 2 Earners | 88 (85.4%) | $79,138 |
| 3+ Earners | 0 (0.0%) | $0 |
| Total | 103 (100.0%) | $78,491 |
Household Income in Cohasset
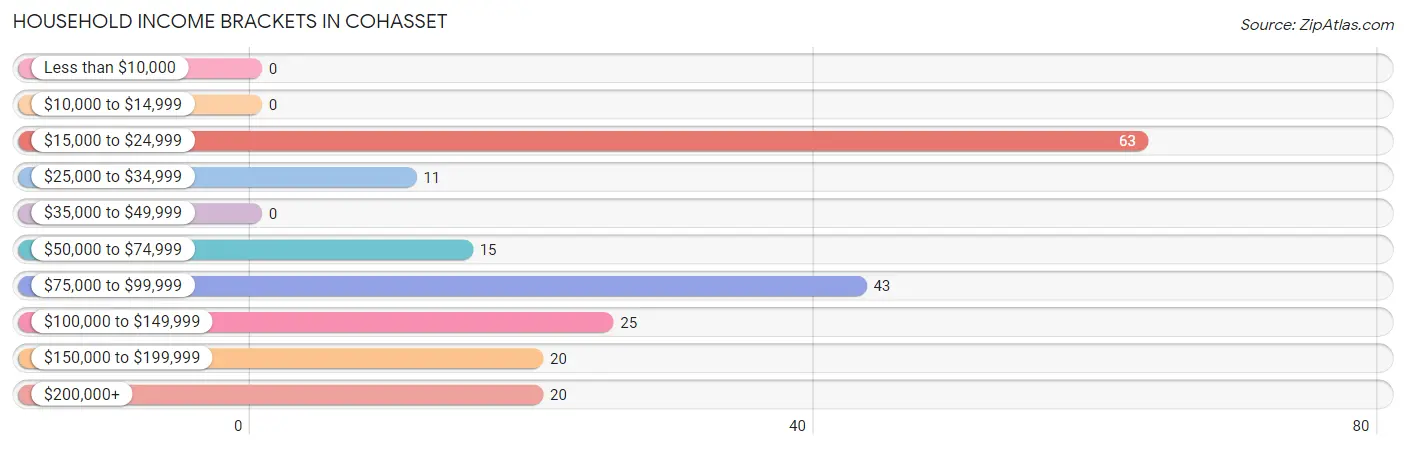
Household Income Brackets in Cohasset
With 63 households falling in the category, the $15,000 to $24,999 income range is the most frequent in Cohasset, accounting for 32.0% of all households.
| Income Bracket | # Households | % Households |
| Less than $10,000 | 0 | 0.0% |
| $10,000 to $14,999 | 0 | 0.0% |
| $15,000 to $24,999 | 63 | 32.0% |
| $25,000 to $34,999 | 11 | 5.6% |
| $35,000 to $49,999 | 0 | 0.0% |
| $50,000 to $74,999 | 15 | 7.6% |
| $75,000 to $99,999 | 43 | 21.8% |
| $100,000 to $149,999 | 25 | 12.7% |
| $150,000 to $199,999 | 20 | 10.2% |
| $200,000+ | 20 | 10.2% |
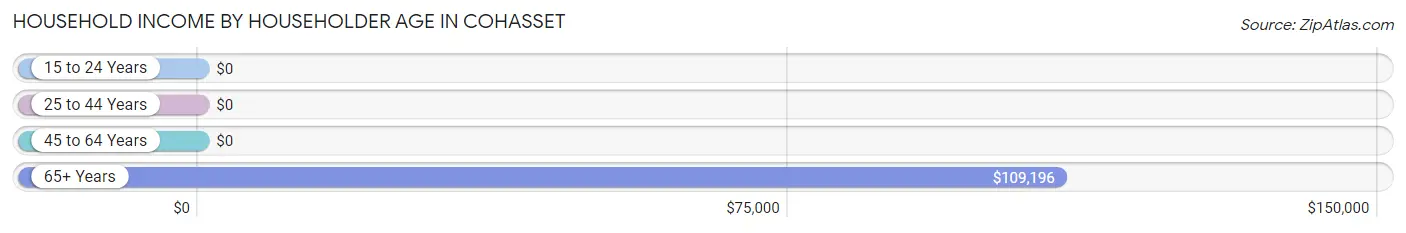
Household Income by Householder Age in Cohasset
The median household income in Cohasset is $76,696, with the highest median household income of $109,196 found in the 65+ years age bracket for the primary householder. A total of 71 households (36.0%) fall into this category.
| Income Bracket | # Households | Median Income |
| 15 to 24 Years | 0 (0.0%) | $0 |
| 25 to 44 Years | 20 (10.2%) | $0 |
| 45 to 64 Years | 106 (53.8%) | $0 |
| 65+ Years | 71 (36.0%) | $109,196 |
| Total | 197 (100.0%) | $76,696 |
Poverty in Cohasset
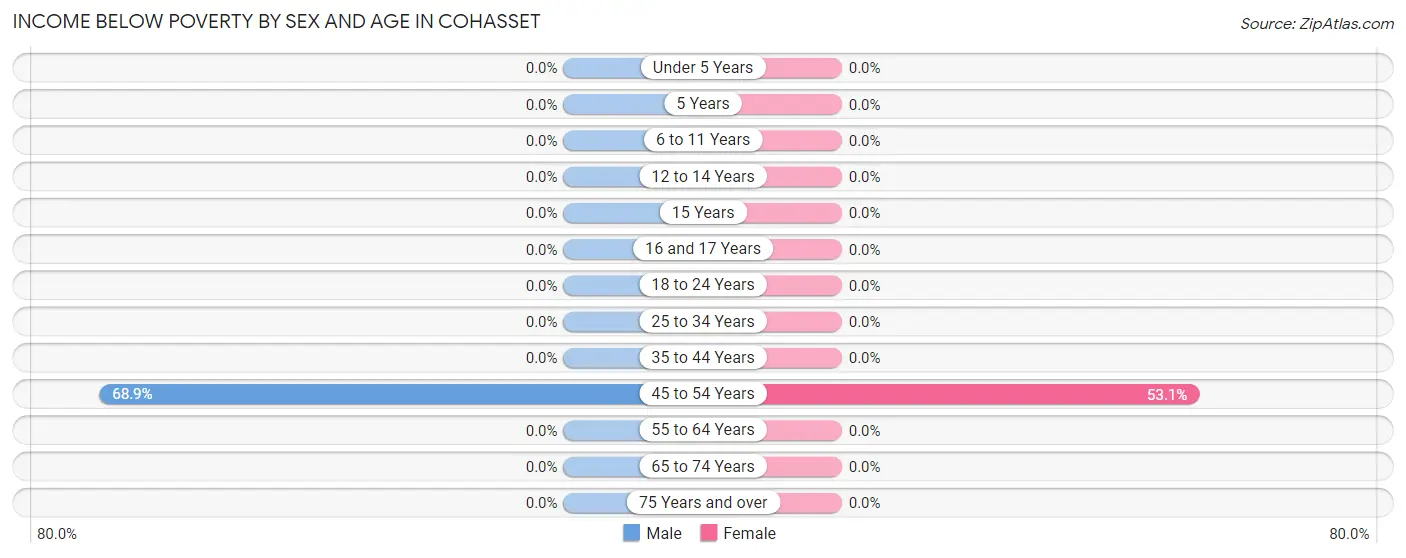
Income Below Poverty by Sex and Age in Cohasset
With 12.9% poverty level for males and 17.2% for females among the residents of Cohasset, 45 to 54 year old males and 45 to 54 year old females are the most vulnerable to poverty, with 31 males (68.9%) and 26 females (53.1%) in their respective age groups living below the poverty level.
| Age Bracket | Male | Female |
| Under 5 Years | 0 (0.0%) | 0 (0.0%) |
| 5 Years | 0 (0.0%) | 0 (0.0%) |
| 6 to 11 Years | 0 (0.0%) | 0 (0.0%) |
| 12 to 14 Years | 0 (0.0%) | 0 (0.0%) |
| 15 Years | 0 (0.0%) | 0 (0.0%) |
| 16 and 17 Years | 0 (0.0%) | 0 (0.0%) |
| 18 to 24 Years | 0 (0.0%) | 0 (0.0%) |
| 25 to 34 Years | 0 (0.0%) | 0 (0.0%) |
| 35 to 44 Years | 0 (0.0%) | 0 (0.0%) |
| 45 to 54 Years | 31 (68.9%) | 26 (53.1%) |
| 55 to 64 Years | 0 (0.0%) | 0 (0.0%) |
| 65 to 74 Years | 0 (0.0%) | 0 (0.0%) |
| 75 Years and over | 0 (0.0%) | 0 (0.0%) |
| Total | 31 (12.9%) | 26 (17.2%) |
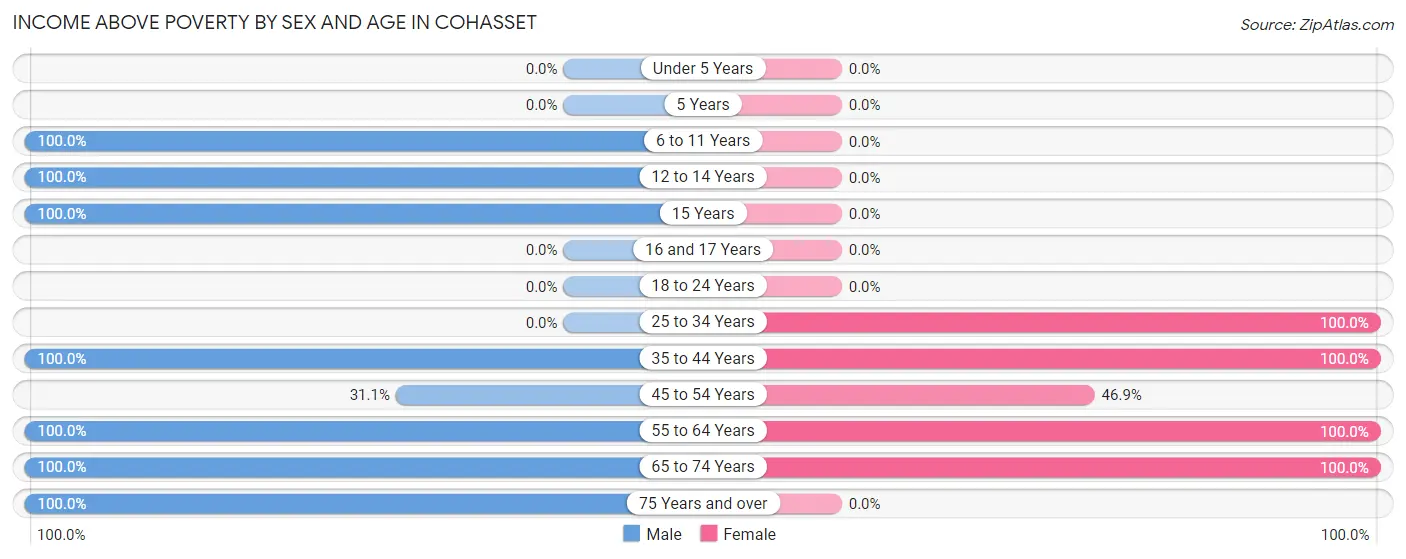
Income Above Poverty by Sex and Age in Cohasset
According to the poverty statistics in Cohasset, males aged 6 to 11 years and females aged 25 to 34 years are the age groups that are most secure financially, with 100.0% of males and 100.0% of females in these age groups living above the poverty line.
| Age Bracket | Male | Female |
| Under 5 Years | 0 (0.0%) | 0 (0.0%) |
| 5 Years | 0 (0.0%) | 0 (0.0%) |
| 6 to 11 Years | 33 (100.0%) | 0 (0.0%) |
| 12 to 14 Years | 13 (100.0%) | 0 (0.0%) |
| 15 Years | 16 (100.0%) | 0 (0.0%) |
| 16 and 17 Years | 0 (0.0%) | 0 (0.0%) |
| 18 to 24 Years | 0 (0.0%) | 0 (0.0%) |
| 25 to 34 Years | 0 (0.0%) | 17 (100.0%) |
| 35 to 44 Years | 32 (100.0%) | 28 (100.0%) |
| 45 to 54 Years | 14 (31.1%) | 23 (46.9%) |
| 55 to 64 Years | 29 (100.0%) | 32 (100.0%) |
| 65 to 74 Years | 53 (100.0%) | 25 (100.0%) |
| 75 Years and over | 20 (100.0%) | 0 (0.0%) |
| Total | 210 (87.1%) | 125 (82.8%) |
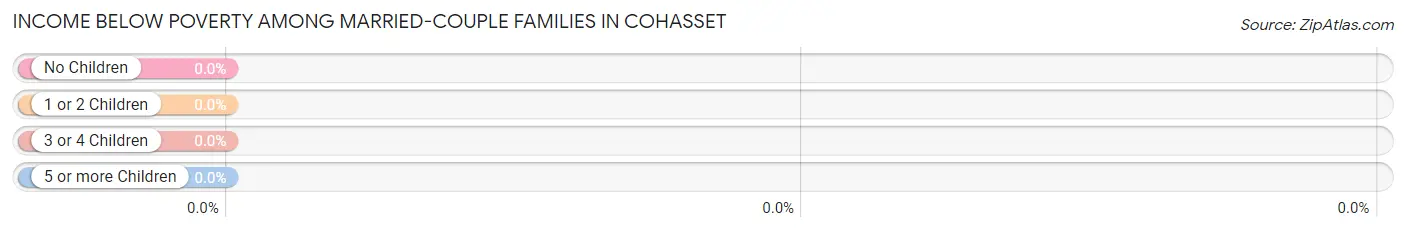
Income Below Poverty Among Married-Couple Families in Cohasset
| Children | Above Poverty | Below Poverty |
| No Children | 58 (100.0%) | 0 (0.0%) |
| 1 or 2 Children | 20 (100.0%) | 0 (0.0%) |
| 3 or 4 Children | 14 (100.0%) | 0 (0.0%) |
| 5 or more Children | 0 (0.0%) | 0 (0.0%) |
| Total | 92 (100.0%) | 0 (0.0%) |
Income Below Poverty Among Single-Parent Households in Cohasset
| Children | Single Father | Single Mother |
| No Children | 0 (0.0%) | 0 (0.0%) |
| 1 or 2 Children | 0 (0.0%) | 0 (0.0%) |
| 3 or 4 Children | 0 (0.0%) | 0 (0.0%) |
| 5 or more Children | 0 (0.0%) | 0 (0.0%) |
| Total | 0 (0.0%) | 0 (0.0%) |
Income Below Poverty Among Married-Couple vs Single-Parent Households in Cohasset
| Children | Married-Couple Families | Single-Parent Households |
| No Children | 0 (0.0%) | 0 (0.0%) |
| 1 or 2 Children | 0 (0.0%) | 0 (0.0%) |
| 3 or 4 Children | 0 (0.0%) | 0 (0.0%) |
| 5 or more Children | 0 (0.0%) | 0 (0.0%) |
| Total | 0 (0.0%) | 0 (0.0%) |
Race in Cohasset
The most populous races in Cohasset are White / Caucasian (358 | 91.3%), Two or more Races (23 | 5.9%), and Asian (11 | 2.8%).
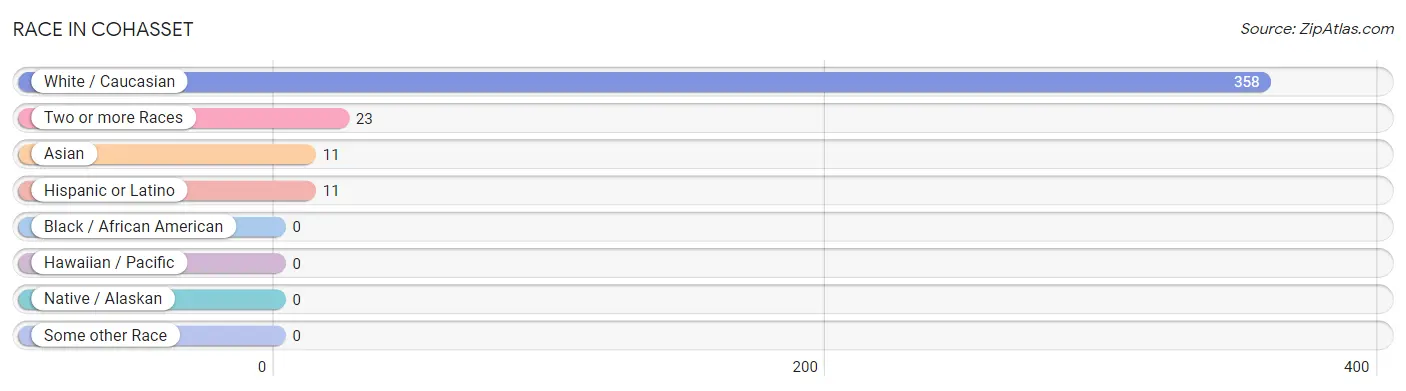
| Race | # Population | % Population |
| Asian | 11 | 2.8% |
| Black / African American | 0 | 0.0% |
| Hawaiian / Pacific | 0 | 0.0% |
| Hispanic or Latino | 11 | 2.8% |
| Native / Alaskan | 0 | 0.0% |
| White / Caucasian | 358 | 91.3% |
| Two or more Races | 23 | 5.9% |
| Some other Race | 0 | 0.0% |
| Total | 392 | 100.0% |
Ancestry in Cohasset
The most populous ancestries reported in Cohasset are English (76 | 19.4%), American (57 | 14.5%), Swedish (54 | 13.8%), Irish (32 | 8.2%), and Italian (32 | 8.2%), together accounting for 64.0% of all Cohasset residents.
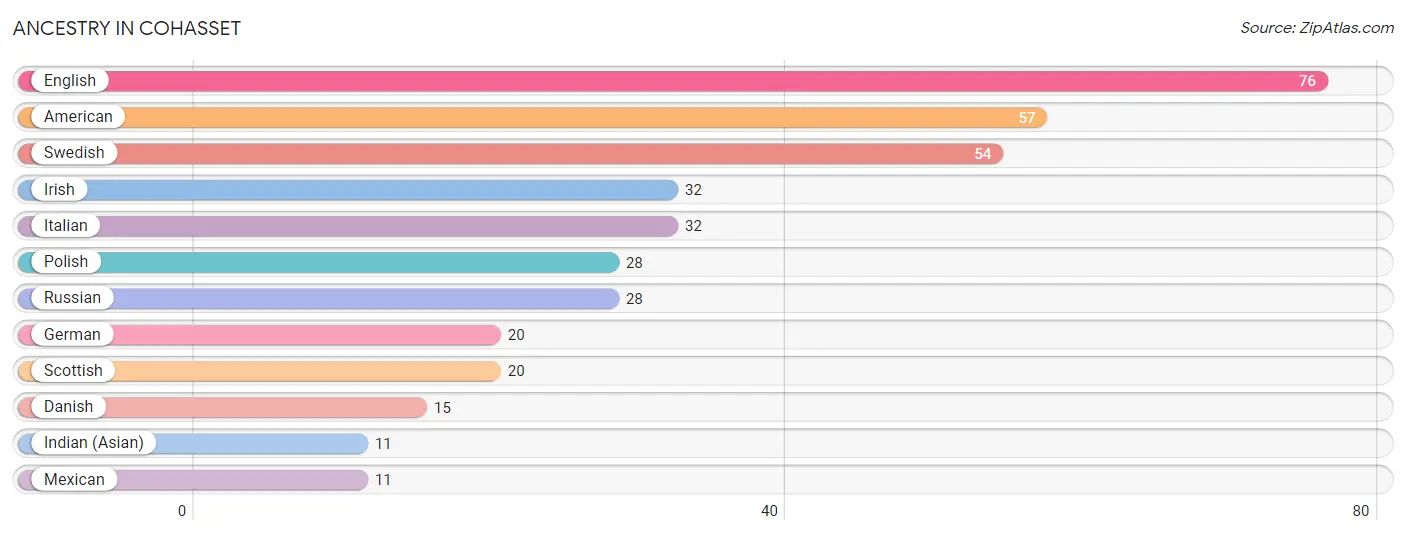
| Ancestry | # Population | % Population |
| American | 57 | 14.5% |
| Danish | 15 | 3.8% |
| English | 76 | 19.4% |
| German | 20 | 5.1% |
| Indian (Asian) | 11 | 2.8% |
| Irish | 32 | 8.2% |
| Italian | 32 | 8.2% |
| Mexican | 11 | 2.8% |
| Polish | 28 | 7.1% |
| Russian | 28 | 7.1% |
| Scottish | 20 | 5.1% |
| Swedish | 54 | 13.8% | View All 12 Rows |
Immigrants in Cohasset
The most numerous immigrant groups reported in Cohasset came from England (14 | 3.6%), Europe (14 | 3.6%), Northern Europe (14 | 3.6%), Asia (11 | 2.8%), and China (11 | 2.8%), together accounting for 16.3% of all Cohasset residents.
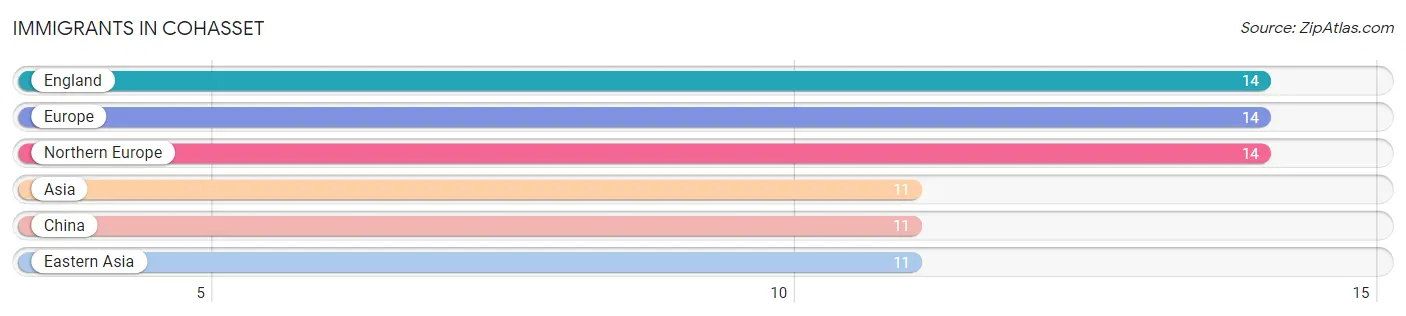
| Immigration Origin | # Population | % Population |
| Asia | 11 | 2.8% |
| China | 11 | 2.8% |
| Eastern Asia | 11 | 2.8% |
| England | 14 | 3.6% |
| Europe | 14 | 3.6% |
| Northern Europe | 14 | 3.6% | View All 6 Rows |
Sex and Age in Cohasset
Sex and Age in Cohasset
The most populous age groups in Cohasset are 65 to 69 Years (53 | 22.0%) for men and 55 to 59 Years (32 | 21.2%) for women.
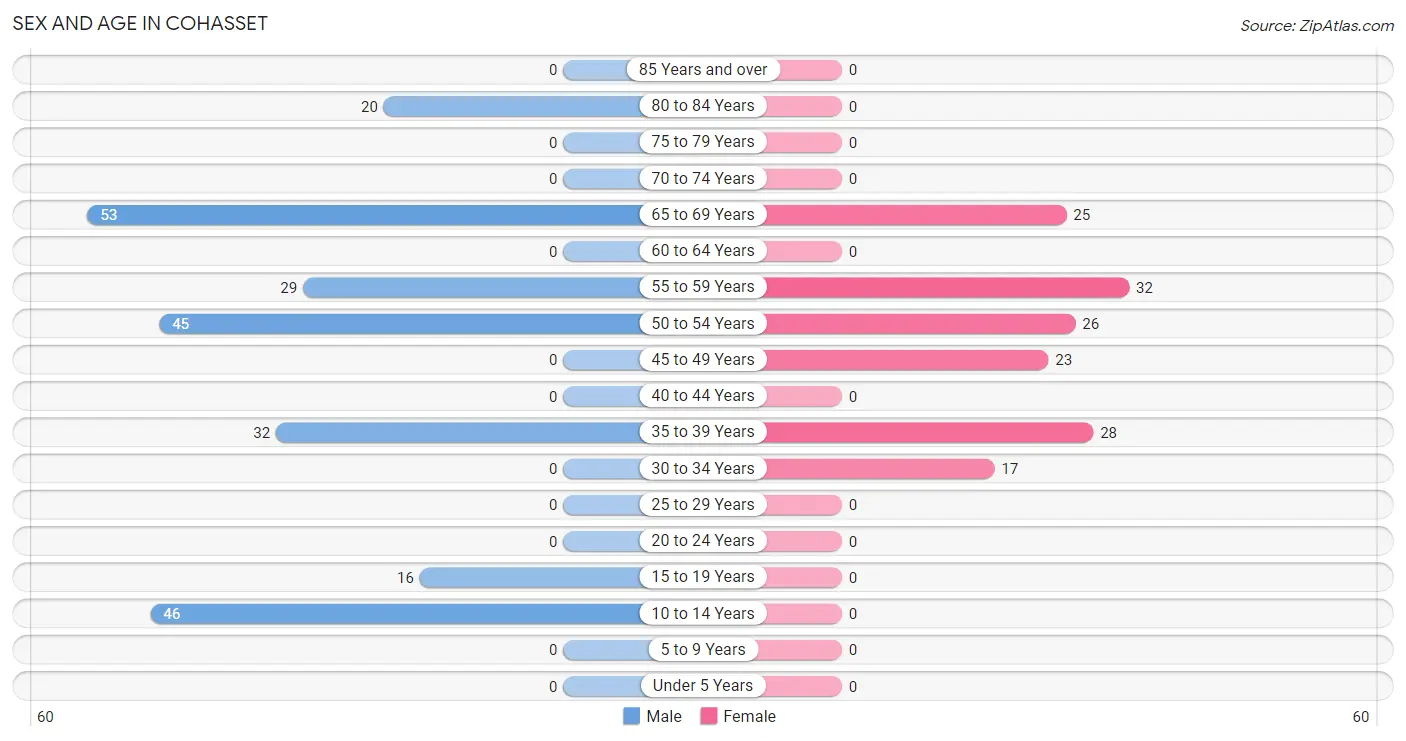
| Age Bracket | Male | Female |
| Under 5 Years | 0 (0.0%) | 0 (0.0%) |
| 5 to 9 Years | 0 (0.0%) | 0 (0.0%) |
| 10 to 14 Years | 46 (19.1%) | 0 (0.0%) |
| 15 to 19 Years | 16 (6.6%) | 0 (0.0%) |
| 20 to 24 Years | 0 (0.0%) | 0 (0.0%) |
| 25 to 29 Years | 0 (0.0%) | 0 (0.0%) |
| 30 to 34 Years | 0 (0.0%) | 17 (11.3%) |
| 35 to 39 Years | 32 (13.3%) | 28 (18.5%) |
| 40 to 44 Years | 0 (0.0%) | 0 (0.0%) |
| 45 to 49 Years | 0 (0.0%) | 23 (15.2%) |
| 50 to 54 Years | 45 (18.7%) | 26 (17.2%) |
| 55 to 59 Years | 29 (12.0%) | 32 (21.2%) |
| 60 to 64 Years | 0 (0.0%) | 0 (0.0%) |
| 65 to 69 Years | 53 (22.0%) | 25 (16.6%) |
| 70 to 74 Years | 0 (0.0%) | 0 (0.0%) |
| 75 to 79 Years | 0 (0.0%) | 0 (0.0%) |
| 80 to 84 Years | 20 (8.3%) | 0 (0.0%) |
| 85 Years and over | 0 (0.0%) | 0 (0.0%) |
| Total | 241 (100.0%) | 151 (100.0%) |
Families and Households in Cohasset
Median Family Size in Cohasset
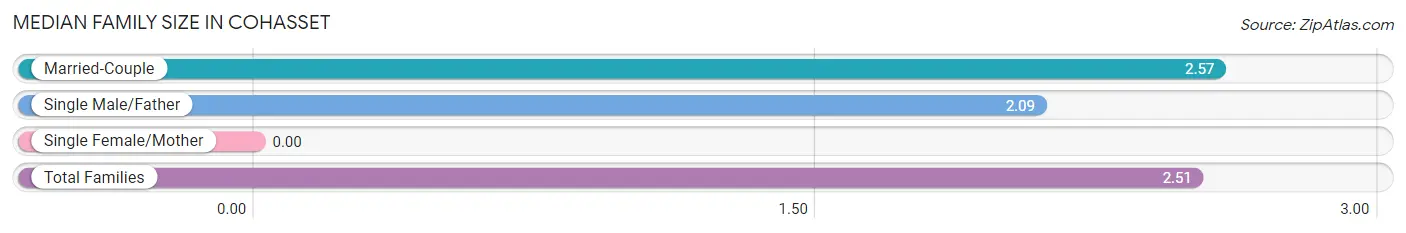
| Family Type | # Families | Family Size |
| Married-Couple | 92 (89.3%) | 2.57 |
| Single Male/Father | 11 (10.7%) | 2.09 |
| Single Female/Mother | 0 (0.0%) | - |
| Total Families | 103 (100.0%) | 2.51 |
Median Household Size in Cohasset
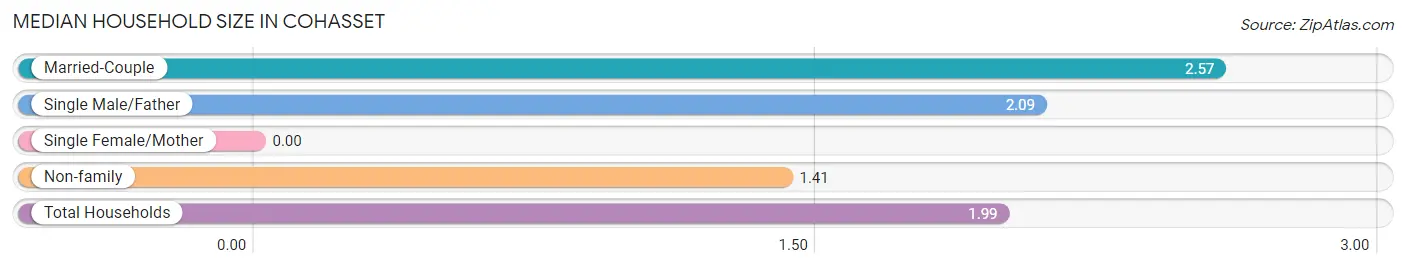
| Household Type | # Households | Household Size |
| Married-Couple | 92 (46.7%) | 2.57 |
| Single Male/Father | 11 (5.6%) | 2.09 |
| Single Female/Mother | 0 (0.0%) | - |
| Non-family | 94 (47.7%) | 1.41 |
| Total Households | 197 (100.0%) | 1.99 |
Household Size by Marriage Status in Cohasset
Out of a total of 197 households in Cohasset, 103 (52.3%) are family households, while 94 (47.7%) are nonfamily households. The most numerous type of family households are 2-person households, comprising 69, and the most common type of nonfamily households are 1-person households, comprising 52.
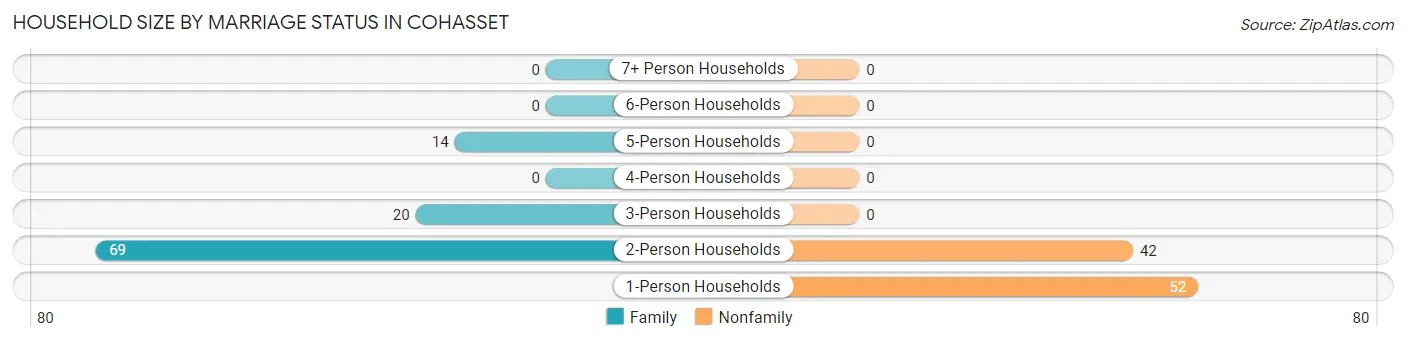
| Household Size | Family Households | Nonfamily Households |
| 1-Person Households | - | 52 (26.4%) |
| 2-Person Households | 69 (35.0%) | 42 (21.3%) |
| 3-Person Households | 20 (10.2%) | 0 (0.0%) |
| 4-Person Households | 0 (0.0%) | 0 (0.0%) |
| 5-Person Households | 14 (7.1%) | 0 (0.0%) |
| 6-Person Households | 0 (0.0%) | 0 (0.0%) |
| 7+ Person Households | 0 (0.0%) | 0 (0.0%) |
| Total | 103 (52.3%) | 94 (47.7%) |
Female Fertility in Cohasset
Fertility by Age in Cohasset
| Age Bracket | Women with Births | Births / 1,000 Women |
| 15 to 19 years | 0 (0.0%) | 0.0 |
| 20 to 34 years | 0 (0.0%) | 0.0 |
| 35 to 50 years | 0 (0.0%) | 0.0 |
| Total | 0 (0.0%) | 0.0 |
Fertility by Age by Marriage Status in Cohasset
| Age Bracket | Married | Unmarried |
| 15 to 19 years | 0 (0.0%) | 0 (0.0%) |
| 20 to 34 years | 0 (0.0%) | 0 (0.0%) |
| 35 to 50 years | 0 (0.0%) | 0 (0.0%) |
| Total | 0 (0.0%) | 0 (0.0%) |
Fertility by Education in Cohasset
| Educational Attainment | Women with Births | Births / 1,000 Women |
| Less than High School | 0 (0.0%) | 0.0 |
| High School Diploma | 0 (0.0%) | 0.0 |
| College or Associate's Degree | 0 (0.0%) | 0.0 |
| Bachelor's Degree | 0 (0.0%) | 0.0 |
| Graduate Degree | 0 (0.0%) | 0.0 |
| Total | 0 (0.0%) | 0.0 |
Fertility by Education by Marriage Status in Cohasset
| Educational Attainment | Married | Unmarried |
| Less than High School | 0 (0.0%) | 0 (0.0%) |
| High School Diploma | 0 (0.0%) | 0 (0.0%) |
| College or Associate's Degree | 0 (0.0%) | 0 (0.0%) |
| Bachelor's Degree | 0 (0.0%) | 0 (0.0%) |
| Graduate Degree | 0 (0.0%) | 0 (0.0%) |
| Total | 0 (0.0%) | 0 (0.0%) |
Employment Characteristics in Cohasset
Employment by Class of Employer in Cohasset
Among the 222 employed individuals in Cohasset, private company employees (97 | 43.7%), local government employees (43 | 19.4%), and state government employees (28 | 12.6%) make up the most common classes of employment.
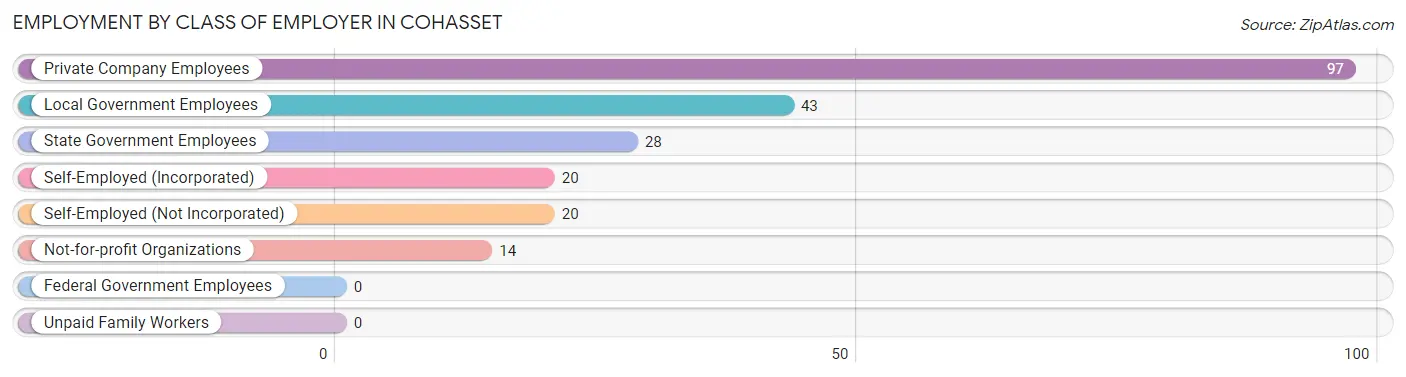
| Employer Class | # Employees | % Employees |
| Private Company Employees | 97 | 43.7% |
| Self-Employed (Incorporated) | 20 | 9.0% |
| Self-Employed (Not Incorporated) | 20 | 9.0% |
| Not-for-profit Organizations | 14 | 6.3% |
| Local Government Employees | 43 | 19.4% |
| State Government Employees | 28 | 12.6% |
| Federal Government Employees | 0 | 0.0% |
| Unpaid Family Workers | 0 | 0.0% |
| Total | 222 | 100.0% |
Employment Status by Age in Cohasset
According to the labor force statistics for Cohasset, out of the total population over 16 years of age (330), 74.2% or 245 individuals are in the labor force, with 9.4% or 23 of them unemployed. The age group with the highest labor force participation rate is 30 to 34 years, with 100.0% or 17 individuals in the labor force. Within the labor force, the 65 to 74 years age range has the highest percentage of unemployed individuals, with 44.0% or 11 of them being unemployed.
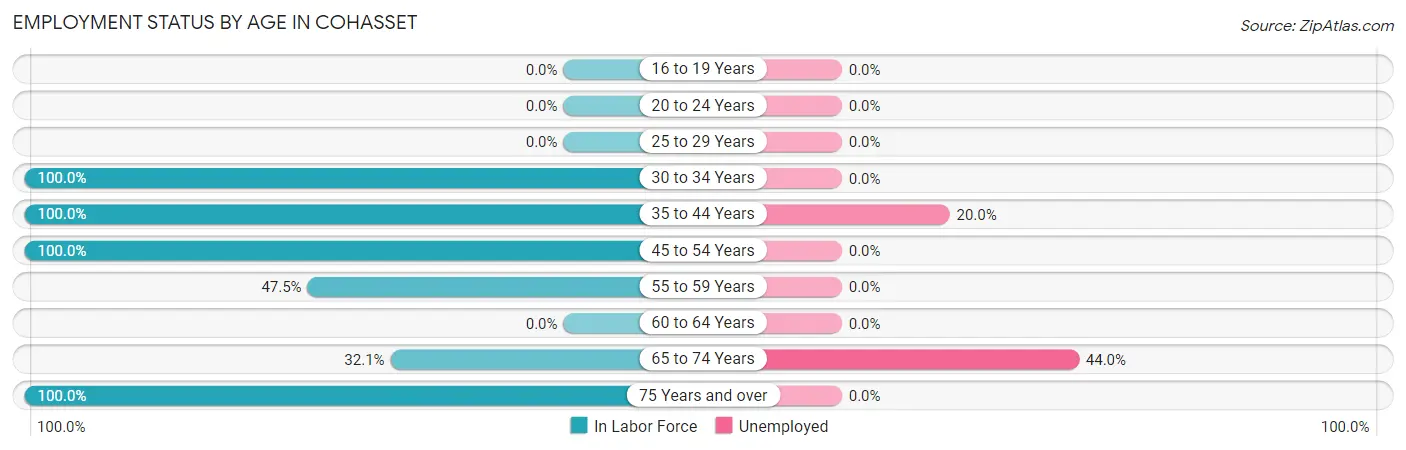
| Age Bracket | In Labor Force | Unemployed |
| 16 to 19 Years | 0 (0.0%) | 0 (0.0%) |
| 20 to 24 Years | 0 (0.0%) | 0 (0.0%) |
| 25 to 29 Years | 0 (0.0%) | 0 (0.0%) |
| 30 to 34 Years | 17 (100.0%) | 0 (0.0%) |
| 35 to 44 Years | 60 (100.0%) | 12 (20.0%) |
| 45 to 54 Years | 94 (100.0%) | 0 (0.0%) |
| 55 to 59 Years | 29 (47.5%) | 0 (0.0%) |
| 60 to 64 Years | 0 (0.0%) | 0 (0.0%) |
| 65 to 74 Years | 25 (32.1%) | 11 (44.0%) |
| 75 Years and over | 20 (100.0%) | 0 (0.0%) |
| Total | 245 (74.2%) | 23 (9.4%) |
Employment Status by Educational Attainment in Cohasset
According to labor force statistics for Cohasset, 86.2% of individuals (200) out of the total population between 25 and 64 years of age (232) are in the labor force, with 6.0% or 12 of them being unemployed. The group with the highest labor force participation rate are those with the educational attainment of high school diploma, with 100.0% or 29 individuals in the labor force. Within the labor force, individuals with college / associate degree education have the highest percentage of unemployment, with 16.2% or 12 of them being unemployed.
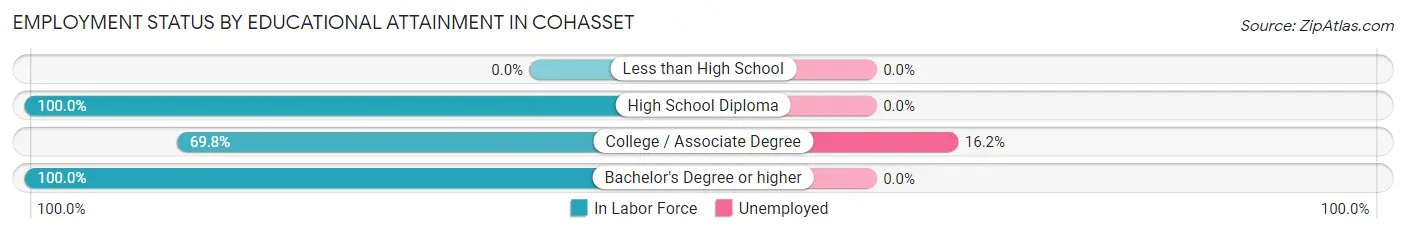
| Educational Attainment | In Labor Force | Unemployed |
| Less than High School | 0 (0.0%) | 0 (0.0%) |
| High School Diploma | 29 (100.0%) | 0 (0.0%) |
| College / Associate Degree | 74 (69.8%) | 17 (16.2%) |
| Bachelor's Degree or higher | 97 (100.0%) | 0 (0.0%) |
| Total | 200 (86.2%) | 14 (6.0%) |
Employment Occupations by Sex in Cohasset
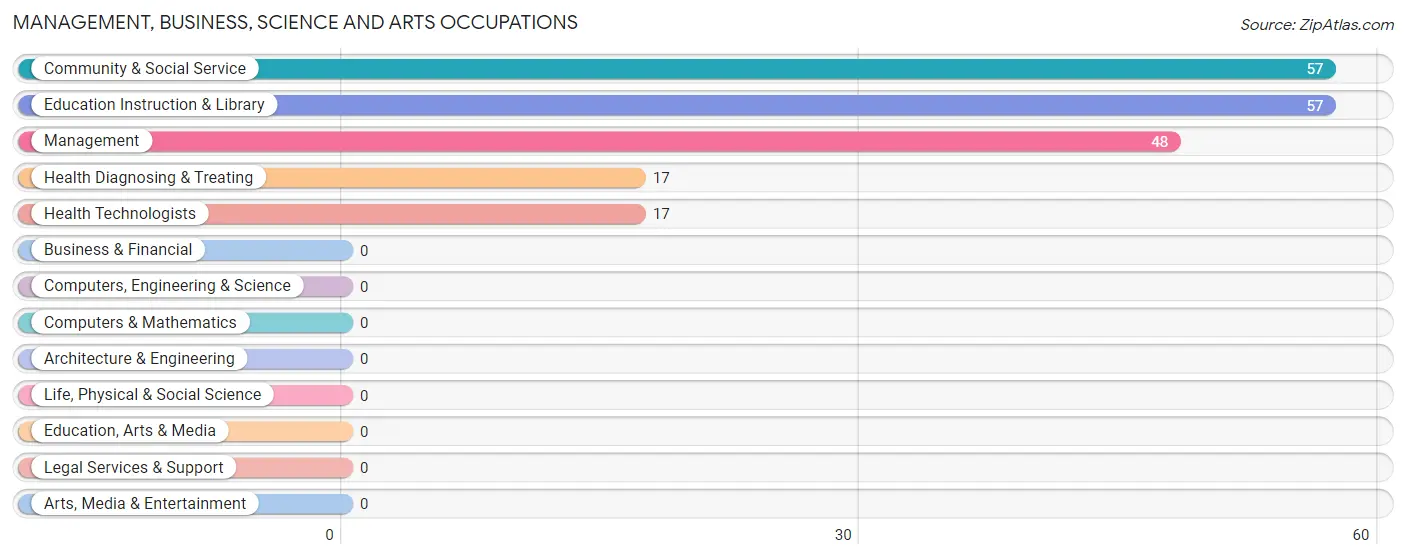
Management, Business, Science and Arts Occupations
The most common Management, Business, Science and Arts occupations in Cohasset are Community & Social Service (57 | 25.7%), Education Instruction & Library (57 | 25.7%), Management (48 | 21.6%), Health Diagnosing & Treating (17 | 7.7%), and Health Technologists (17 | 7.7%).
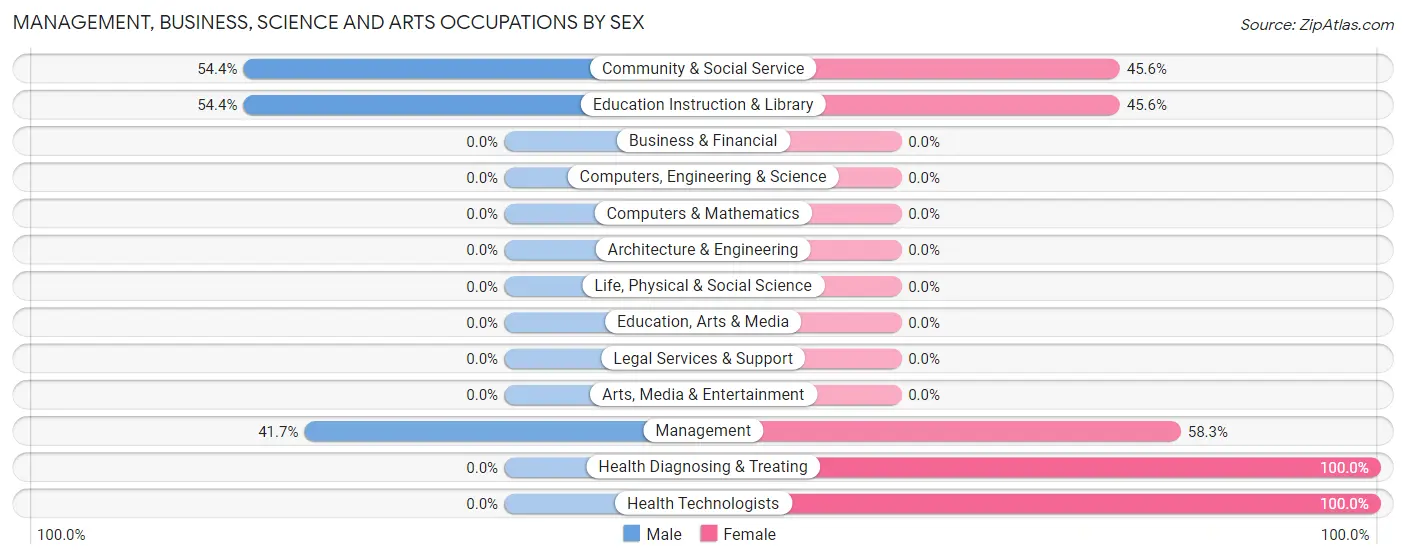
Management, Business, Science and Arts Occupations by Sex
Within the Management, Business, Science and Arts occupations in Cohasset, the most male-oriented occupations are Community & Social Service (54.4%), Education Instruction & Library (54.4%), and Management (41.7%), while the most female-oriented occupations are Health Diagnosing & Treating (100.0%), Health Technologists (100.0%), and Management (58.3%).
| Occupation | Male | Female |
| Management | 20 (41.7%) | 28 (58.3%) |
| Business & Financial | 0 (0.0%) | 0 (0.0%) |
| Computers, Engineering & Science | 0 (0.0%) | 0 (0.0%) |
| Computers & Mathematics | 0 (0.0%) | 0 (0.0%) |
| Architecture & Engineering | 0 (0.0%) | 0 (0.0%) |
| Life, Physical & Social Science | 0 (0.0%) | 0 (0.0%) |
| Community & Social Service | 31 (54.4%) | 26 (45.6%) |
| Education, Arts & Media | 0 (0.0%) | 0 (0.0%) |
| Legal Services & Support | 0 (0.0%) | 0 (0.0%) |
| Education Instruction & Library | 31 (54.4%) | 26 (45.6%) |
| Arts, Media & Entertainment | 0 (0.0%) | 0 (0.0%) |
| Health Diagnosing & Treating | 0 (0.0%) | 17 (100.0%) |
| Health Technologists | 0 (0.0%) | 17 (100.0%) |
| Total (Category) | 51 (41.8%) | 71 (58.2%) |
| Total (Overall) | 114 (51.3%) | 108 (48.6%) |
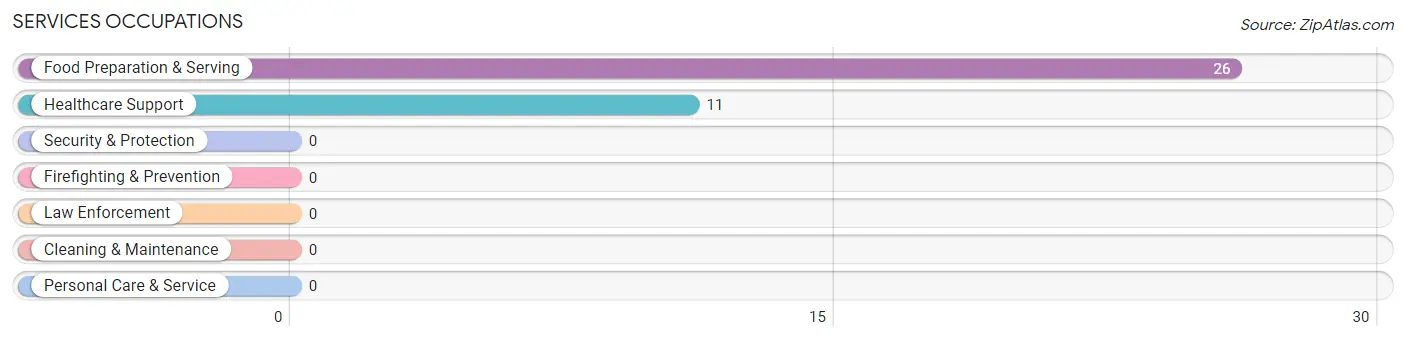
Services Occupations
The most common Services occupations in Cohasset are Food Preparation & Serving (26 | 11.7%), and Healthcare Support (11 | 5.0%).
Services Occupations by Sex
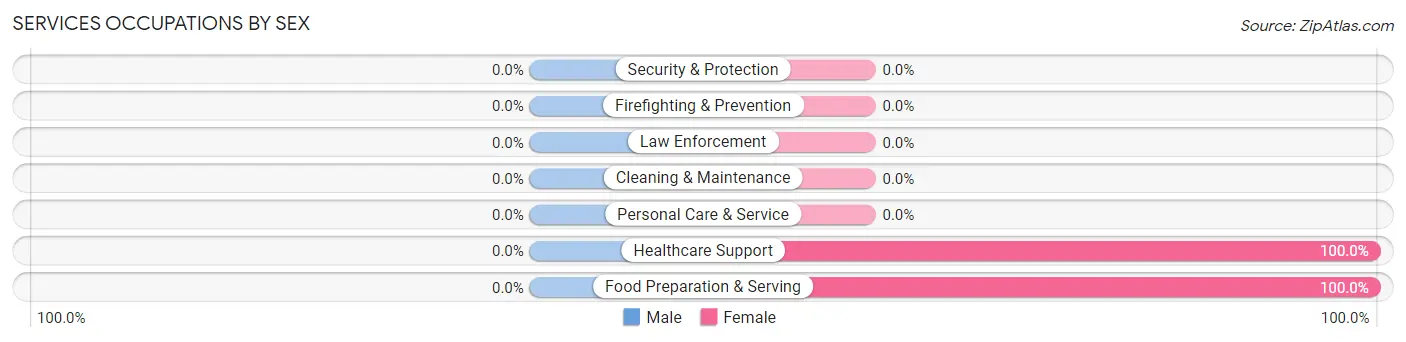
| Occupation | Male | Female |
| Healthcare Support | 0 (0.0%) | 11 (100.0%) |
| Security & Protection | 0 (0.0%) | 0 (0.0%) |
| Firefighting & Prevention | 0 (0.0%) | 0 (0.0%) |
| Law Enforcement | 0 (0.0%) | 0 (0.0%) |
| Food Preparation & Serving | 0 (0.0%) | 26 (100.0%) |
| Cleaning & Maintenance | 0 (0.0%) | 0 (0.0%) |
| Personal Care & Service | 0 (0.0%) | 0 (0.0%) |
| Total (Category) | 0 (0.0%) | 37 (100.0%) |
| Total (Overall) | 114 (51.3%) | 108 (48.6%) |
Sales and Office Occupations
Sales and Office Occupations by Sex
| Occupation | Male | Female |
| Sales & Related | 0 (0.0%) | 0 (0.0%) |
| Office & Administration | 0 (0.0%) | 0 (0.0%) |
| Total (Category) | 0 (0.0%) | 0 (0.0%) |
| Total (Overall) | 114 (51.3%) | 108 (48.6%) |
Natural Resources, Construction and Maintenance Occupations
The most common Natural Resources, Construction and Maintenance occupations in Cohasset are Installation, Maintenance & Repair (43 | 19.4%), and Construction & Extraction (20 | 9.0%).
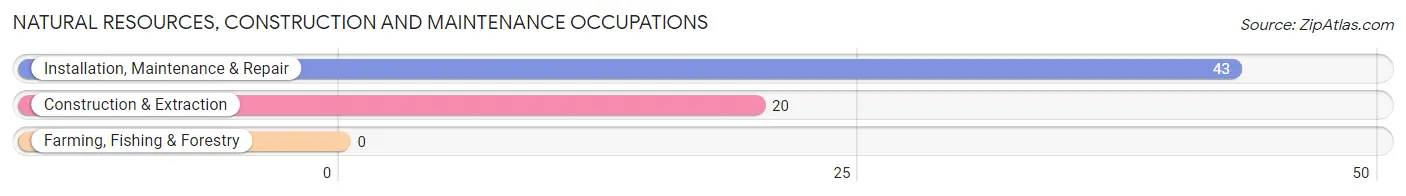
Natural Resources, Construction and Maintenance Occupations by Sex
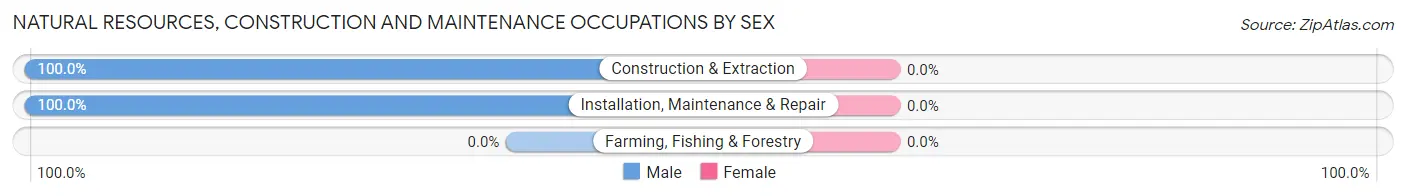
| Occupation | Male | Female |
| Farming, Fishing & Forestry | 0 (0.0%) | 0 (0.0%) |
| Construction & Extraction | 20 (100.0%) | 0 (0.0%) |
| Installation, Maintenance & Repair | 43 (100.0%) | 0 (0.0%) |
| Total (Category) | 63 (100.0%) | 0 (0.0%) |
| Total (Overall) | 114 (51.3%) | 108 (48.6%) |
Production, Transportation and Moving Occupations
Production, Transportation and Moving Occupations by Sex
| Occupation | Male | Female |
| Production | 0 (0.0%) | 0 (0.0%) |
| Transportation | 0 (0.0%) | 0 (0.0%) |
| Material Moving | 0 (0.0%) | 0 (0.0%) |
| Total (Category) | 0 (0.0%) | 0 (0.0%) |
| Total (Overall) | 114 (51.3%) | 108 (48.6%) |
Employment Industries by Sex in Cohasset
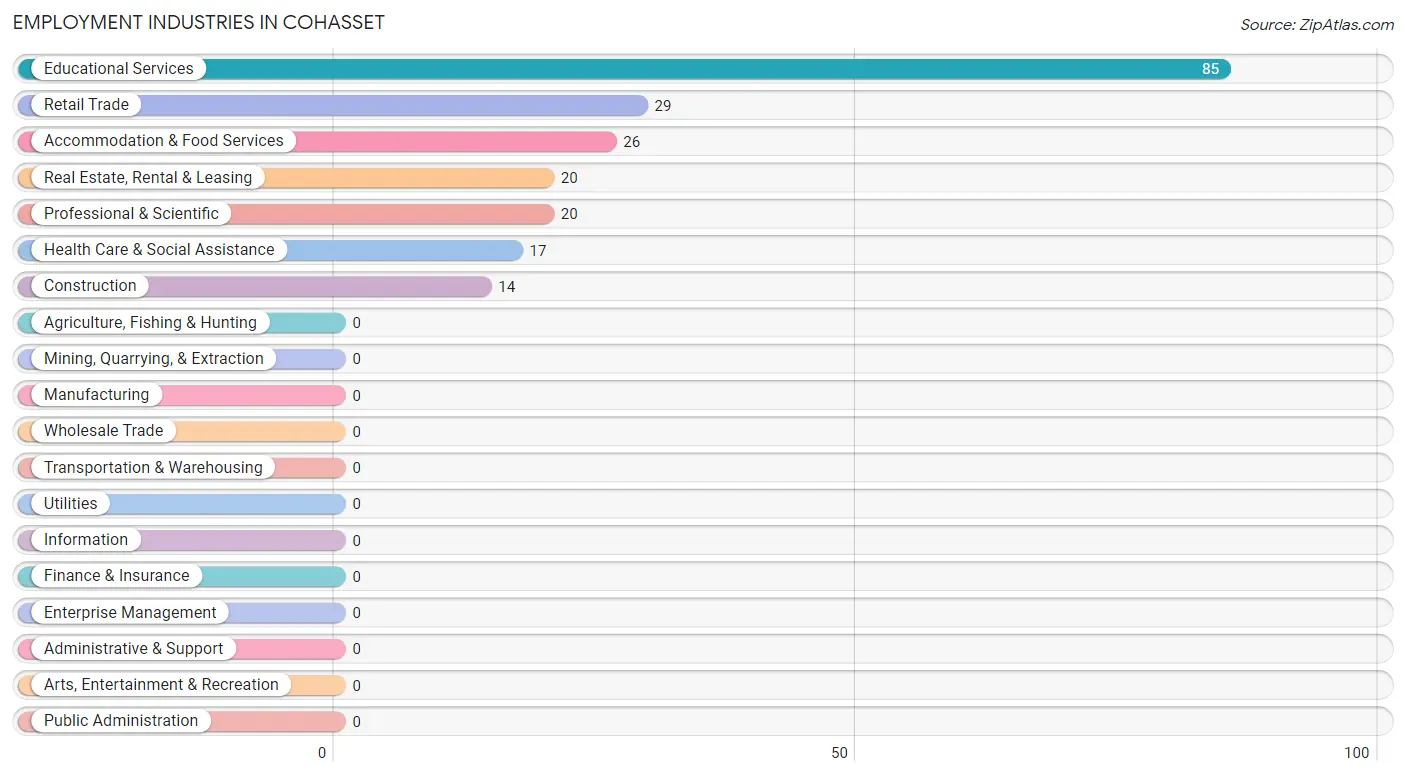
Employment Industries in Cohasset
The major employment industries in Cohasset include Educational Services (85 | 38.3%), Retail Trade (29 | 13.1%), Accommodation & Food Services (26 | 11.7%), Real Estate, Rental & Leasing (20 | 9.0%), and Professional & Scientific (20 | 9.0%).
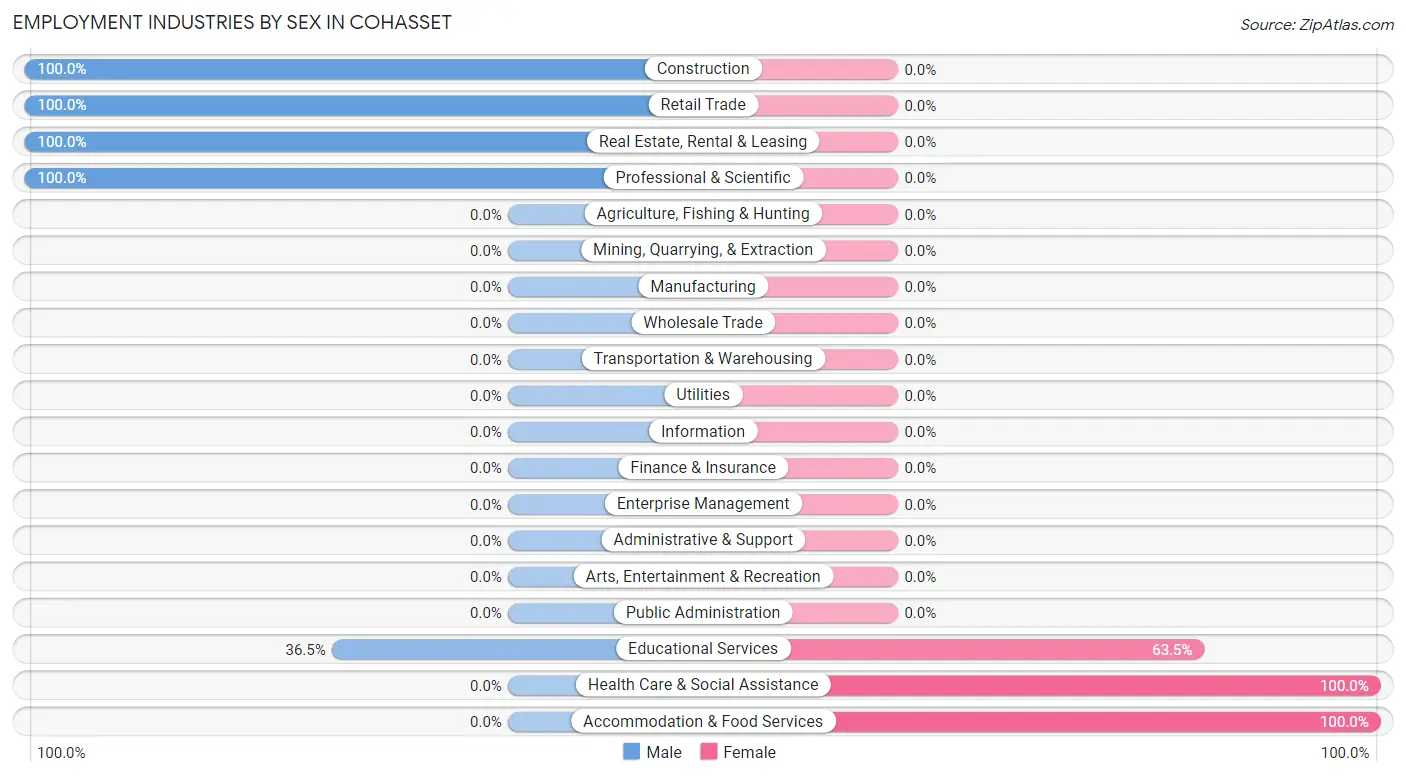
Employment Industries by Sex in Cohasset
The Cohasset industries that see more men than women are Construction (100.0%), Retail Trade (100.0%), and Real Estate, Rental & Leasing (100.0%), whereas the industries that tend to have a higher number of women are Health Care & Social Assistance (100.0%), Accommodation & Food Services (100.0%), and Educational Services (63.5%).
| Industry | Male | Female |
| Agriculture, Fishing & Hunting | 0 (0.0%) | 0 (0.0%) |
| Mining, Quarrying, & Extraction | 0 (0.0%) | 0 (0.0%) |
| Construction | 14 (100.0%) | 0 (0.0%) |
| Manufacturing | 0 (0.0%) | 0 (0.0%) |
| Wholesale Trade | 0 (0.0%) | 0 (0.0%) |
| Retail Trade | 29 (100.0%) | 0 (0.0%) |
| Transportation & Warehousing | 0 (0.0%) | 0 (0.0%) |
| Utilities | 0 (0.0%) | 0 (0.0%) |
| Information | 0 (0.0%) | 0 (0.0%) |
| Finance & Insurance | 0 (0.0%) | 0 (0.0%) |
| Real Estate, Rental & Leasing | 20 (100.0%) | 0 (0.0%) |
| Professional & Scientific | 20 (100.0%) | 0 (0.0%) |
| Enterprise Management | 0 (0.0%) | 0 (0.0%) |
| Administrative & Support | 0 (0.0%) | 0 (0.0%) |
| Educational Services | 31 (36.5%) | 54 (63.5%) |
| Health Care & Social Assistance | 0 (0.0%) | 17 (100.0%) |
| Arts, Entertainment & Recreation | 0 (0.0%) | 0 (0.0%) |
| Accommodation & Food Services | 0 (0.0%) | 26 (100.0%) |
| Public Administration | 0 (0.0%) | 0 (0.0%) |
| Total | 114 (51.3%) | 108 (48.6%) |
Education in Cohasset
School Enrollment in Cohasset
The most common levels of schooling among the 62 students in Cohasset are high school (29 | 46.8%), elementary school (20 | 32.3%), and middle school (13 | 21.0%).
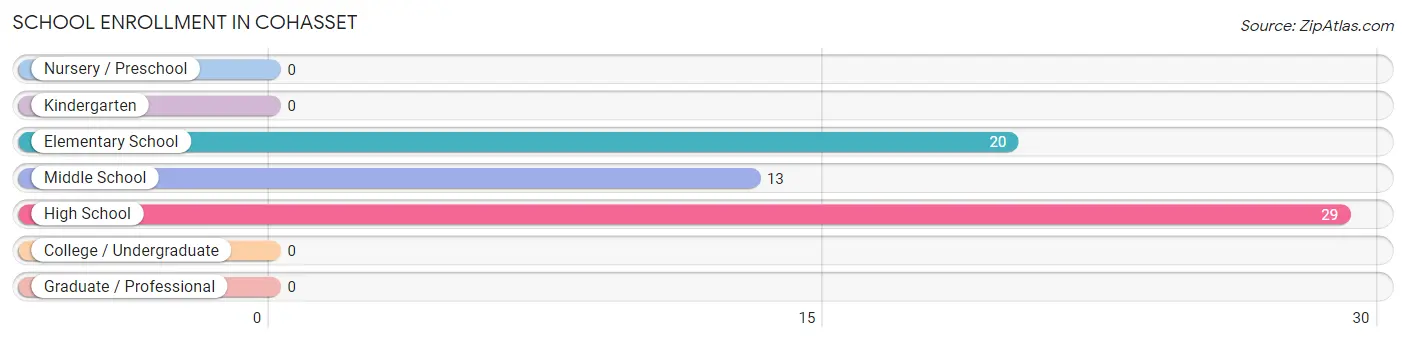
| School Level | # Students | % Students |
| Nursery / Preschool | 0 | 0.0% |
| Kindergarten | 0 | 0.0% |
| Elementary School | 20 | 32.3% |
| Middle School | 13 | 21.0% |
| High School | 29 | 46.8% |
| College / Undergraduate | 0 | 0.0% |
| Graduate / Professional | 0 | 0.0% |
| Total | 62 | 100.0% |
School Enrollment by Age by Funding Source in Cohasset
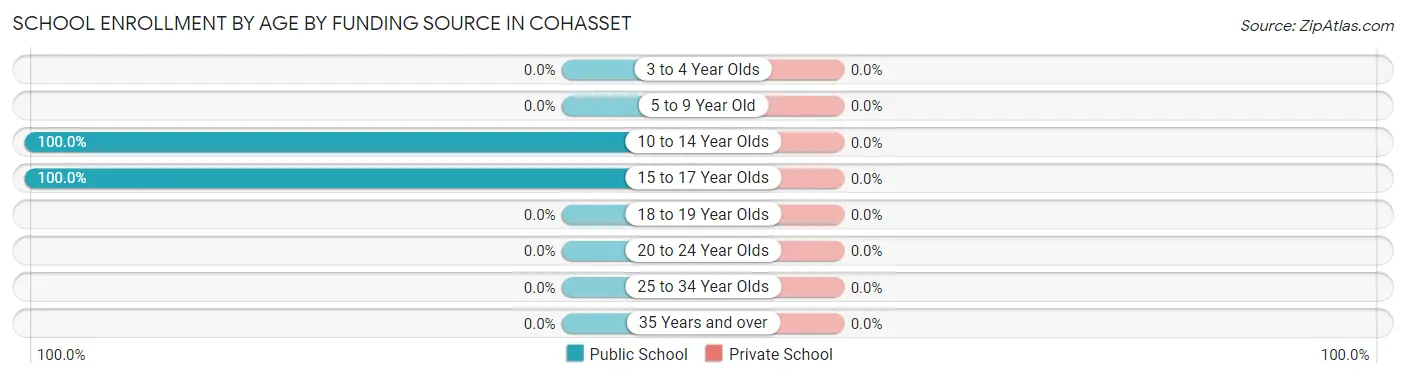
| Age Bracket | Public School | Private School |
| 3 to 4 Year Olds | 0 (0.0%) | 0 (0.0%) |
| 5 to 9 Year Old | 0 (0.0%) | 0 (0.0%) |
| 10 to 14 Year Olds | 46 (100.0%) | 0 (0.0%) |
| 15 to 17 Year Olds | 16 (100.0%) | 0 (0.0%) |
| 18 to 19 Year Olds | 0 (0.0%) | 0 (0.0%) |
| 20 to 24 Year Olds | 0 (0.0%) | 0 (0.0%) |
| 25 to 34 Year Olds | 0 (0.0%) | 0 (0.0%) |
| 35 Years and over | 0 (0.0%) | 0 (0.0%) |
| Total | 62 (100.0%) | 0 (0.0%) |
Educational Attainment by Field of Study in Cohasset
Education (38 | 20.6%), engineering (35 | 19.0%), liberal arts & history (31 | 16.9%), business (28 | 15.2%), and computers & mathematics (14 | 7.6%) are the most common fields of study among 184 individuals in Cohasset who have obtained a bachelor's degree or higher.
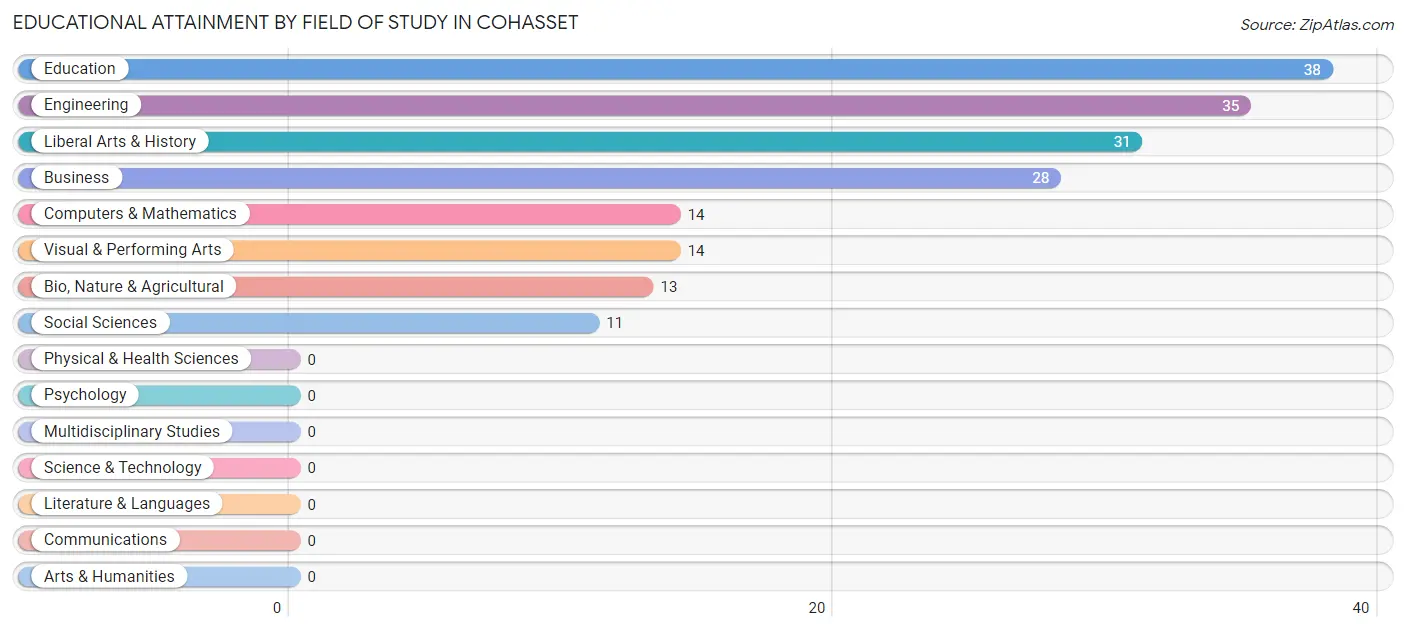
| Field of Study | # Graduates | % Graduates |
| Computers & Mathematics | 14 | 7.6% |
| Bio, Nature & Agricultural | 13 | 7.1% |
| Physical & Health Sciences | 0 | 0.0% |
| Psychology | 0 | 0.0% |
| Social Sciences | 11 | 6.0% |
| Engineering | 35 | 19.0% |
| Multidisciplinary Studies | 0 | 0.0% |
| Science & Technology | 0 | 0.0% |
| Business | 28 | 15.2% |
| Education | 38 | 20.6% |
| Literature & Languages | 0 | 0.0% |
| Liberal Arts & History | 31 | 16.9% |
| Visual & Performing Arts | 14 | 7.6% |
| Communications | 0 | 0.0% |
| Arts & Humanities | 0 | 0.0% |
| Total | 184 | 100.0% |
Transportation & Commute in Cohasset
Vehicle Availability by Sex in Cohasset
The most prevalent vehicle ownership categories in Cohasset are males with 1 vehicle (31, accounting for 27.2%) and females with 1 vehicle (26, making up 28.7%).
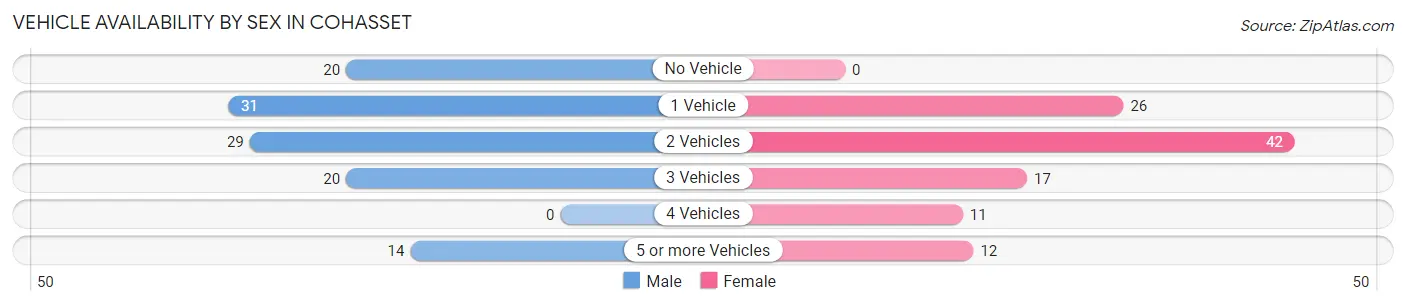
| Vehicles Available | Male | Female |
| No Vehicle | 20 (17.5%) | 0 (0.0%) |
| 1 Vehicle | 31 (27.2%) | 26 (24.1%) |
| 2 Vehicles | 29 (25.4%) | 42 (38.9%) |
| 3 Vehicles | 20 (17.5%) | 17 (15.7%) |
| 4 Vehicles | 0 (0.0%) | 11 (10.2%) |
| 5 or more Vehicles | 14 (12.3%) | 12 (11.1%) |
| Total | 114 (100.0%) | 108 (100.0%) |
Commute Time in Cohasset
The most frequently occuring commute durations in Cohasset are 30 to 34 minutes (105 commuters, 47.3%), 20 to 24 minutes (40 commuters, 18.0%), and less than 5 minutes (31 commuters, 14.0%).
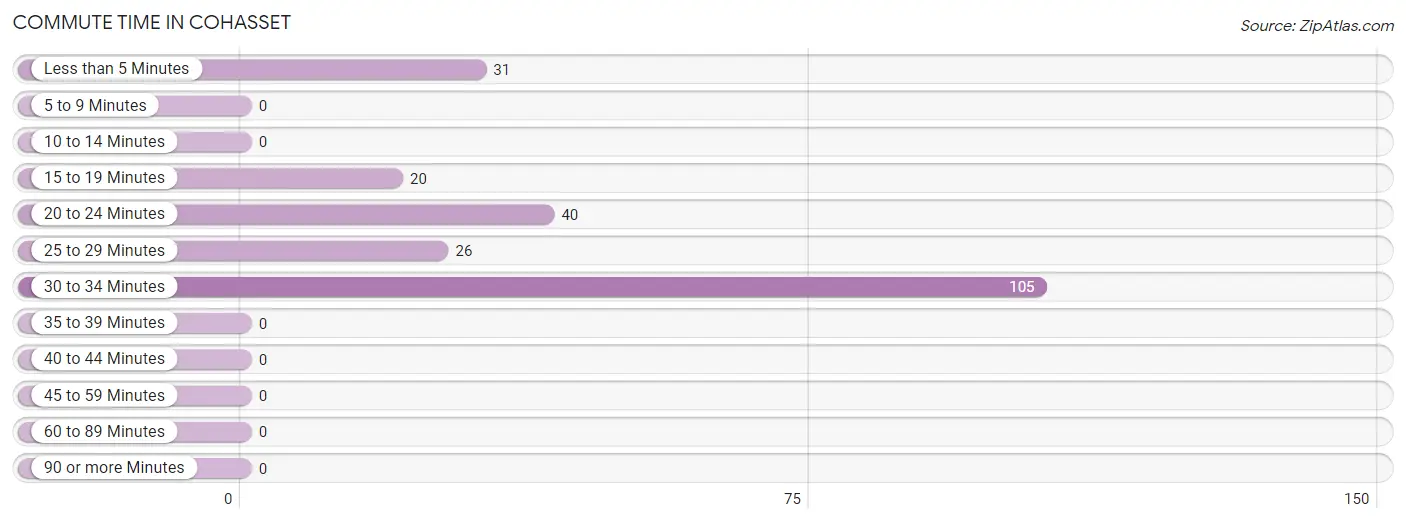
| Commute Time | # Commuters | % Commuters |
| Less than 5 Minutes | 31 | 14.0% |
| 5 to 9 Minutes | 0 | 0.0% |
| 10 to 14 Minutes | 0 | 0.0% |
| 15 to 19 Minutes | 20 | 9.0% |
| 20 to 24 Minutes | 40 | 18.0% |
| 25 to 29 Minutes | 26 | 11.7% |
| 30 to 34 Minutes | 105 | 47.3% |
| 35 to 39 Minutes | 0 | 0.0% |
| 40 to 44 Minutes | 0 | 0.0% |
| 45 to 59 Minutes | 0 | 0.0% |
| 60 to 89 Minutes | 0 | 0.0% |
| 90 or more Minutes | 0 | 0.0% |
Commute Time by Sex in Cohasset
The most common commute times in Cohasset are 30 to 34 minutes (49 commuters, 43.0%) for males and 30 to 34 minutes (56 commuters, 51.8%) for females.
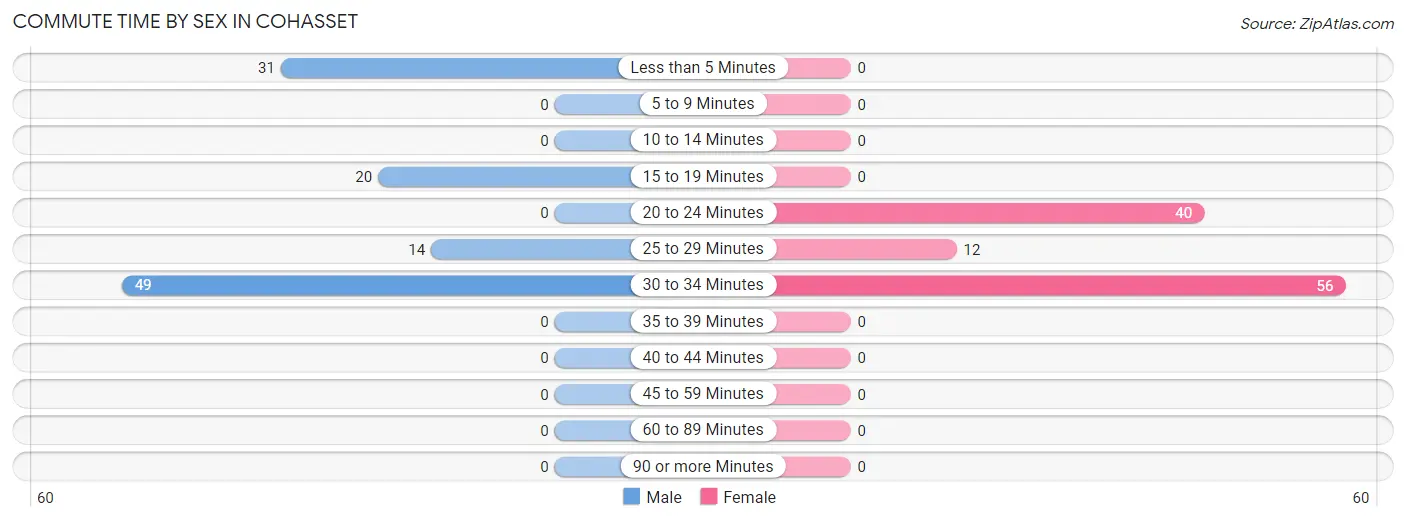
| Commute Time | Male | Female |
| Less than 5 Minutes | 31 (27.2%) | 0 (0.0%) |
| 5 to 9 Minutes | 0 (0.0%) | 0 (0.0%) |
| 10 to 14 Minutes | 0 (0.0%) | 0 (0.0%) |
| 15 to 19 Minutes | 20 (17.5%) | 0 (0.0%) |
| 20 to 24 Minutes | 0 (0.0%) | 40 (37.0%) |
| 25 to 29 Minutes | 14 (12.3%) | 12 (11.1%) |
| 30 to 34 Minutes | 49 (43.0%) | 56 (51.8%) |
| 35 to 39 Minutes | 0 (0.0%) | 0 (0.0%) |
| 40 to 44 Minutes | 0 (0.0%) | 0 (0.0%) |
| 45 to 59 Minutes | 0 (0.0%) | 0 (0.0%) |
| 60 to 89 Minutes | 0 (0.0%) | 0 (0.0%) |
| 90 or more Minutes | 0 (0.0%) | 0 (0.0%) |
Time of Departure to Work by Sex in Cohasset
The most frequent times of departure to work in Cohasset are 7:30 AM to 7:59 AM (34, 29.8%) for males and 7:00 AM to 7:29 AM (38, 35.2%) for females.
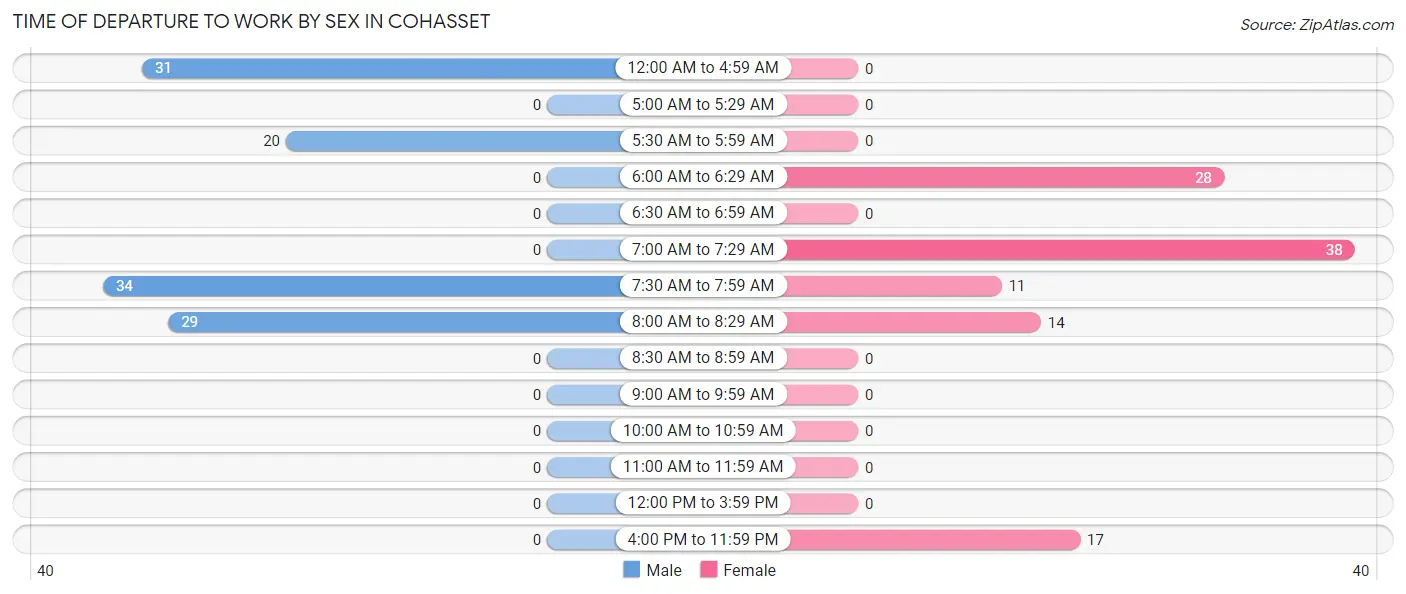
| Time of Departure | Male | Female |
| 12:00 AM to 4:59 AM | 31 (27.2%) | 0 (0.0%) |
| 5:00 AM to 5:29 AM | 0 (0.0%) | 0 (0.0%) |
| 5:30 AM to 5:59 AM | 20 (17.5%) | 0 (0.0%) |
| 6:00 AM to 6:29 AM | 0 (0.0%) | 28 (25.9%) |
| 6:30 AM to 6:59 AM | 0 (0.0%) | 0 (0.0%) |
| 7:00 AM to 7:29 AM | 0 (0.0%) | 38 (35.2%) |
| 7:30 AM to 7:59 AM | 34 (29.8%) | 11 (10.2%) |
| 8:00 AM to 8:29 AM | 29 (25.4%) | 14 (13.0%) |
| 8:30 AM to 8:59 AM | 0 (0.0%) | 0 (0.0%) |
| 9:00 AM to 9:59 AM | 0 (0.0%) | 0 (0.0%) |
| 10:00 AM to 10:59 AM | 0 (0.0%) | 0 (0.0%) |
| 11:00 AM to 11:59 AM | 0 (0.0%) | 0 (0.0%) |
| 12:00 PM to 3:59 PM | 0 (0.0%) | 0 (0.0%) |
| 4:00 PM to 11:59 PM | 0 (0.0%) | 17 (15.7%) |
| Total | 114 (100.0%) | 108 (100.0%) |
Housing Occupancy in Cohasset
Occupancy by Ownership in Cohasset
Of the total 197 dwellings in Cohasset, owner-occupied units account for 166 (84.3%), while renter-occupied units make up 31 (15.7%).
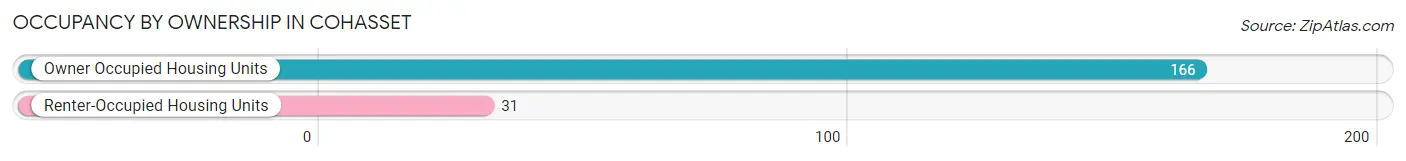
| Occupancy | # Housing Units | % Housing Units |
| Owner Occupied Housing Units | 166 | 84.3% |
| Renter-Occupied Housing Units | 31 | 15.7% |
| Total Occupied Housing Units | 197 | 100.0% |
Occupancy by Household Size in Cohasset
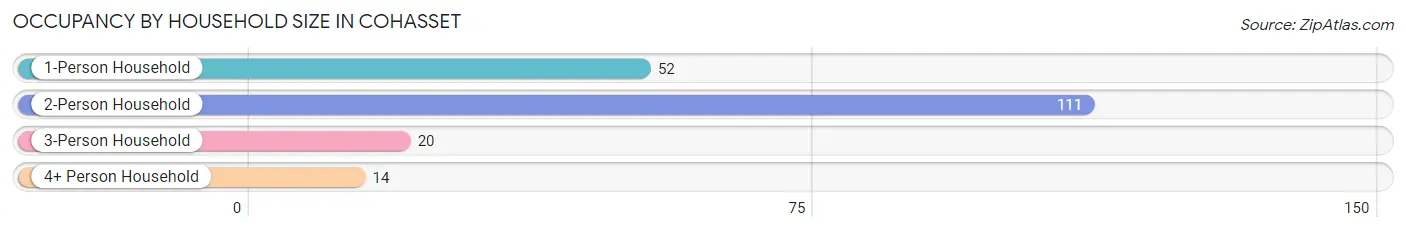
| Household Size | # Housing Units | % Housing Units |
| 1-Person Household | 52 | 26.4% |
| 2-Person Household | 111 | 56.4% |
| 3-Person Household | 20 | 10.2% |
| 4+ Person Household | 14 | 7.1% |
| Total Housing Units | 197 | 100.0% |
Occupancy by Ownership by Household Size in Cohasset
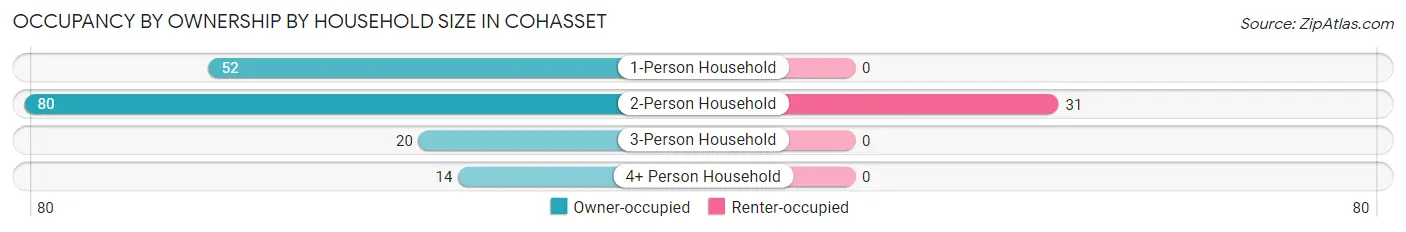
| Household Size | Owner-occupied | Renter-occupied |
| 1-Person Household | 52 (100.0%) | 0 (0.0%) |
| 2-Person Household | 80 (72.1%) | 31 (27.9%) |
| 3-Person Household | 20 (100.0%) | 0 (0.0%) |
| 4+ Person Household | 14 (100.0%) | 0 (0.0%) |
| Total Housing Units | 166 (84.3%) | 31 (15.7%) |
Occupancy by Educational Attainment in Cohasset
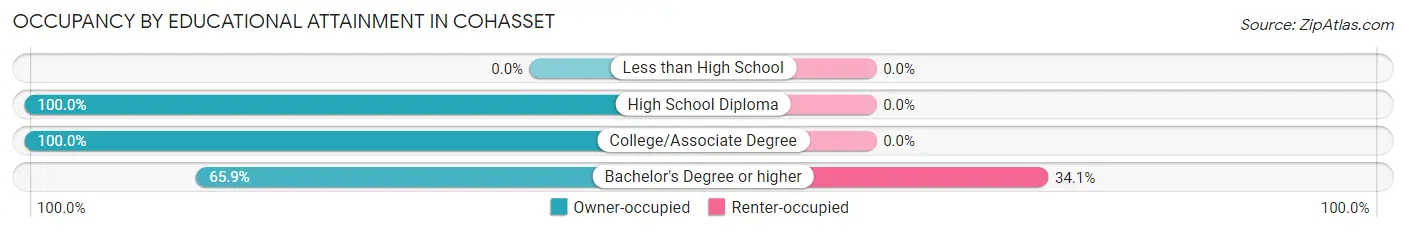
| Household Size | Owner-occupied | Renter-occupied |
| Less than High School | 0 (0.0%) | 0 (0.0%) |
| High School Diploma | 40 (100.0%) | 0 (0.0%) |
| College/Associate Degree | 66 (100.0%) | 0 (0.0%) |
| Bachelor's Degree or higher | 60 (65.9%) | 31 (34.1%) |
Occupancy by Age of Householder in Cohasset
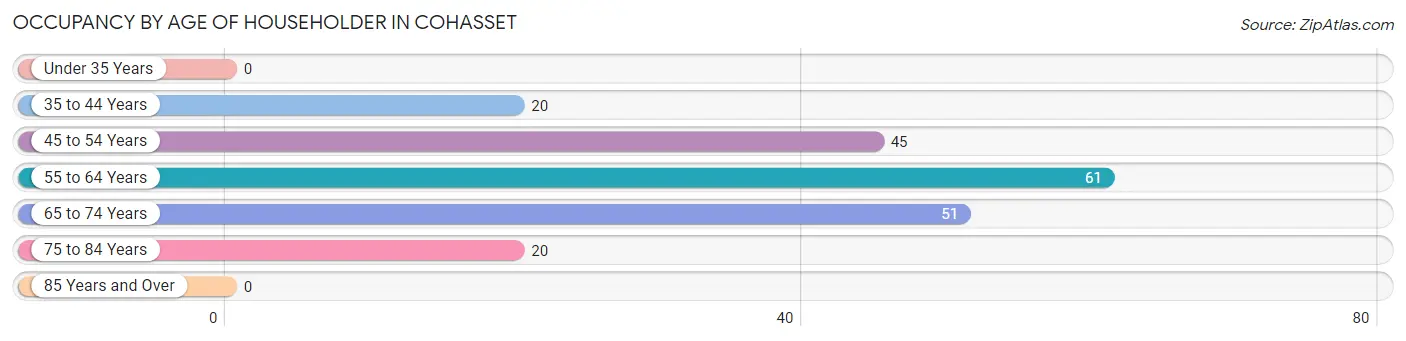
| Age Bracket | # Households | % Households |
| Under 35 Years | 0 | 0.0% |
| 35 to 44 Years | 20 | 10.2% |
| 45 to 54 Years | 45 | 22.8% |
| 55 to 64 Years | 61 | 31.0% |
| 65 to 74 Years | 51 | 25.9% |
| 75 to 84 Years | 20 | 10.2% |
| 85 Years and Over | 0 | 0.0% |
| Total | 197 | 100.0% |
Housing Finances in Cohasset
Median Income by Occupancy in Cohasset
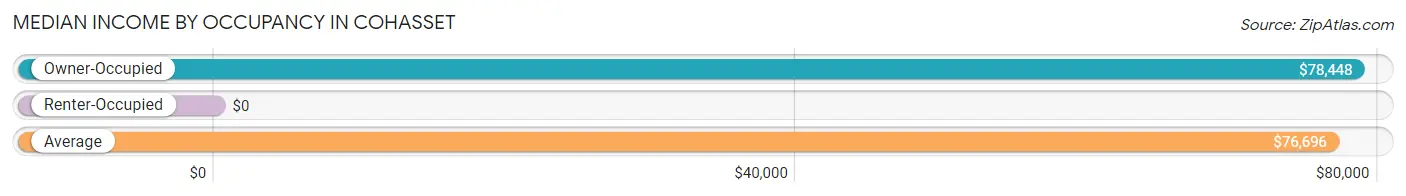
| Occupancy Type | # Households | Median Income |
| Owner-Occupied | 166 (84.3%) | $78,448 |
| Renter-Occupied | 31 (15.7%) | $0 |
| Average | 197 (100.0%) | $76,696 |
Occupancy by Householder Income Bracket in Cohasset
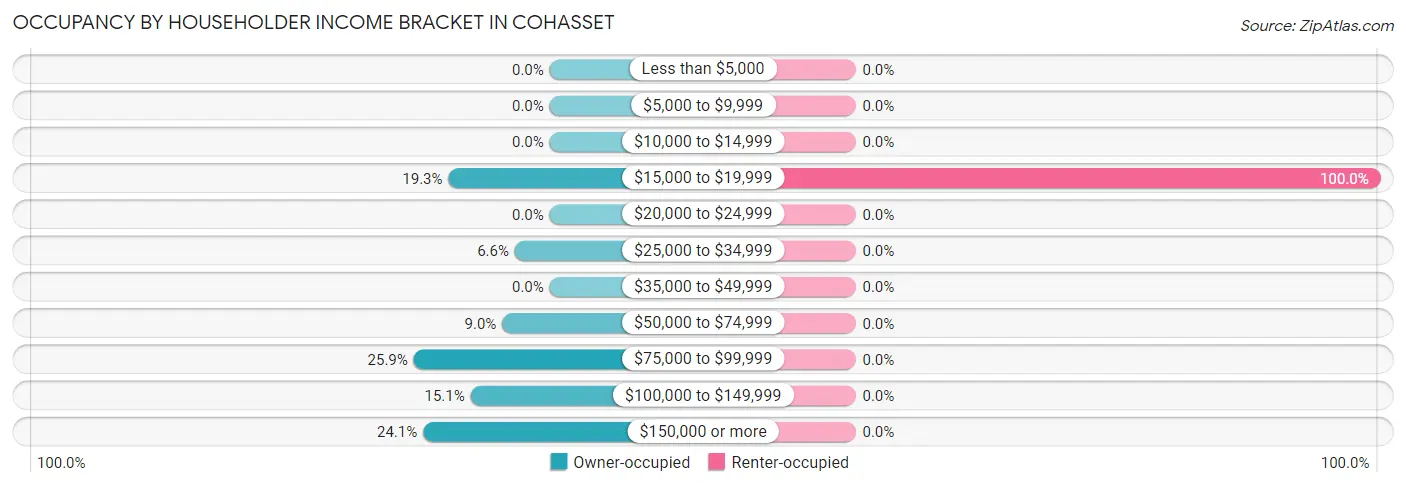
| Income Bracket | Owner-occupied | Renter-occupied |
| Less than $5,000 | 0 (0.0%) | 0 (0.0%) |
| $5,000 to $9,999 | 0 (0.0%) | 0 (0.0%) |
| $10,000 to $14,999 | 0 (0.0%) | 0 (0.0%) |
| $15,000 to $19,999 | 32 (19.3%) | 31 (100.0%) |
| $20,000 to $24,999 | 0 (0.0%) | 0 (0.0%) |
| $25,000 to $34,999 | 11 (6.6%) | 0 (0.0%) |
| $35,000 to $49,999 | 0 (0.0%) | 0 (0.0%) |
| $50,000 to $74,999 | 15 (9.0%) | 0 (0.0%) |
| $75,000 to $99,999 | 43 (25.9%) | 0 (0.0%) |
| $100,000 to $149,999 | 25 (15.1%) | 0 (0.0%) |
| $150,000 or more | 40 (24.1%) | 0 (0.0%) |
| Total | 166 (100.0%) | 31 (100.0%) |
Monthly Housing Cost Tiers in Cohasset
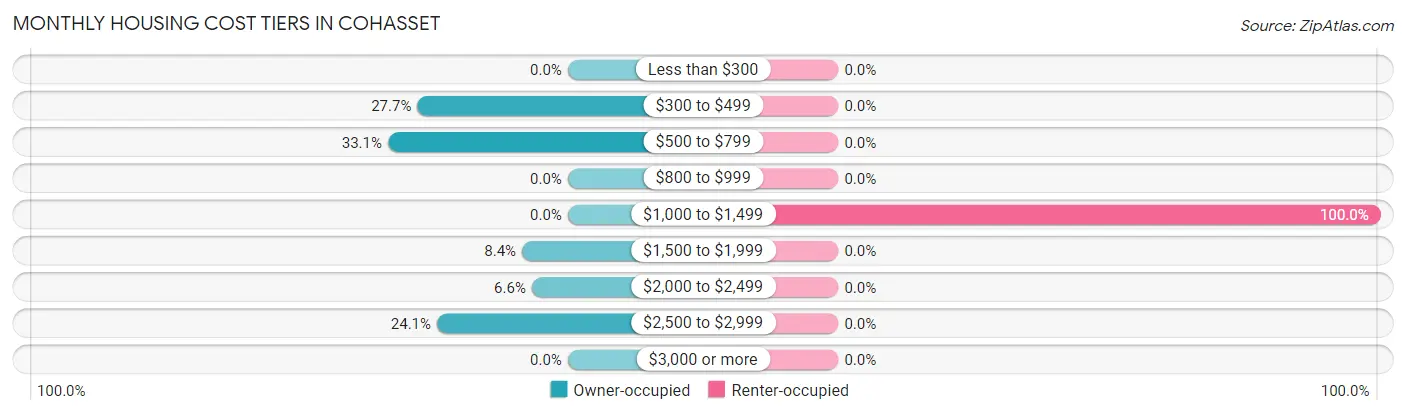
| Monthly Cost | Owner-occupied | Renter-occupied |
| Less than $300 | 0 (0.0%) | 0 (0.0%) |
| $300 to $499 | 46 (27.7%) | 0 (0.0%) |
| $500 to $799 | 55 (33.1%) | 0 (0.0%) |
| $800 to $999 | 0 (0.0%) | 0 (0.0%) |
| $1,000 to $1,499 | 0 (0.0%) | 31 (100.0%) |
| $1,500 to $1,999 | 14 (8.4%) | 0 (0.0%) |
| $2,000 to $2,499 | 11 (6.6%) | 0 (0.0%) |
| $2,500 to $2,999 | 40 (24.1%) | 0 (0.0%) |
| $3,000 or more | 0 (0.0%) | 0 (0.0%) |
| Total | 166 (100.0%) | 31 (100.0%) |
Physical Housing Characteristics in Cohasset
Housing Structures in Cohasset
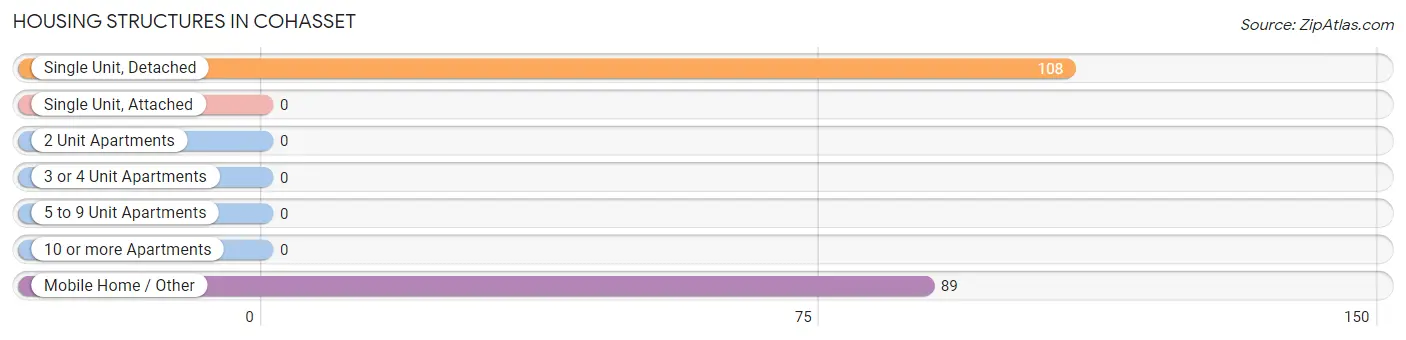
| Structure Type | # Housing Units | % Housing Units |
| Single Unit, Detached | 108 | 54.8% |
| Single Unit, Attached | 0 | 0.0% |
| 2 Unit Apartments | 0 | 0.0% |
| 3 or 4 Unit Apartments | 0 | 0.0% |
| 5 to 9 Unit Apartments | 0 | 0.0% |
| 10 or more Apartments | 0 | 0.0% |
| Mobile Home / Other | 89 | 45.2% |
| Total | 197 | 100.0% |
Housing Structures by Occupancy in Cohasset
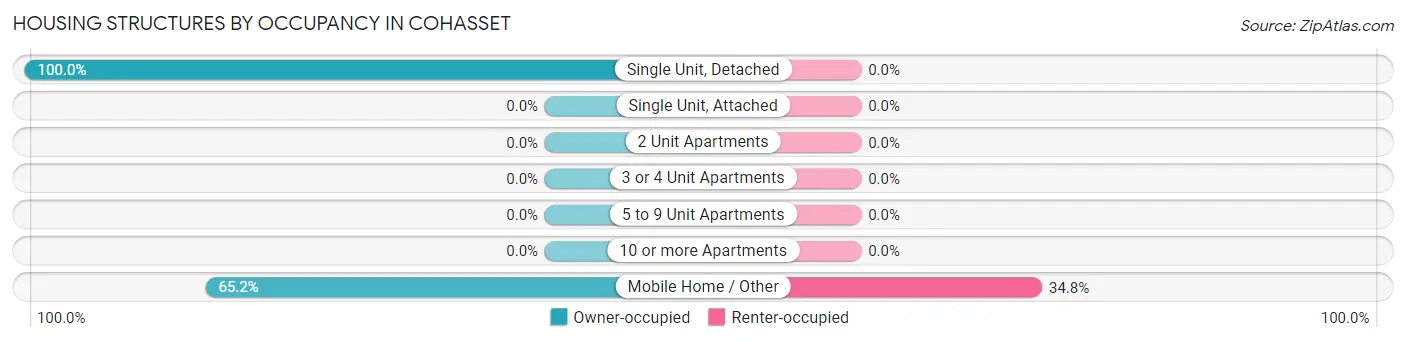
| Structure Type | Owner-occupied | Renter-occupied |
| Single Unit, Detached | 108 (100.0%) | 0 (0.0%) |
| Single Unit, Attached | 0 (0.0%) | 0 (0.0%) |
| 2 Unit Apartments | 0 (0.0%) | 0 (0.0%) |
| 3 or 4 Unit Apartments | 0 (0.0%) | 0 (0.0%) |
| 5 to 9 Unit Apartments | 0 (0.0%) | 0 (0.0%) |
| 10 or more Apartments | 0 (0.0%) | 0 (0.0%) |
| Mobile Home / Other | 58 (65.2%) | 31 (34.8%) |
| Total | 166 (84.3%) | 31 (15.7%) |
Housing Structures by Number of Rooms in Cohasset
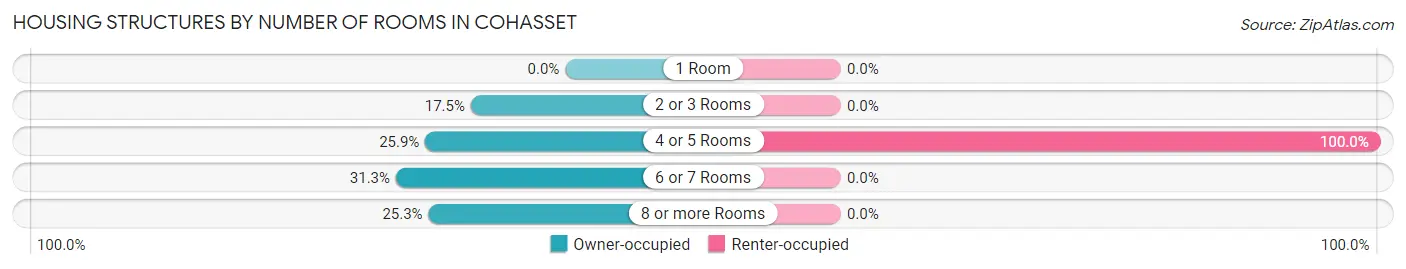
| Number of Rooms | Owner-occupied | Renter-occupied |
| 1 Room | 0 (0.0%) | 0 (0.0%) |
| 2 or 3 Rooms | 29 (17.5%) | 0 (0.0%) |
| 4 or 5 Rooms | 43 (25.9%) | 31 (100.0%) |
| 6 or 7 Rooms | 52 (31.3%) | 0 (0.0%) |
| 8 or more Rooms | 42 (25.3%) | 0 (0.0%) |
| Total | 166 (100.0%) | 31 (100.0%) |
Housing Structure by Heating Type in Cohasset
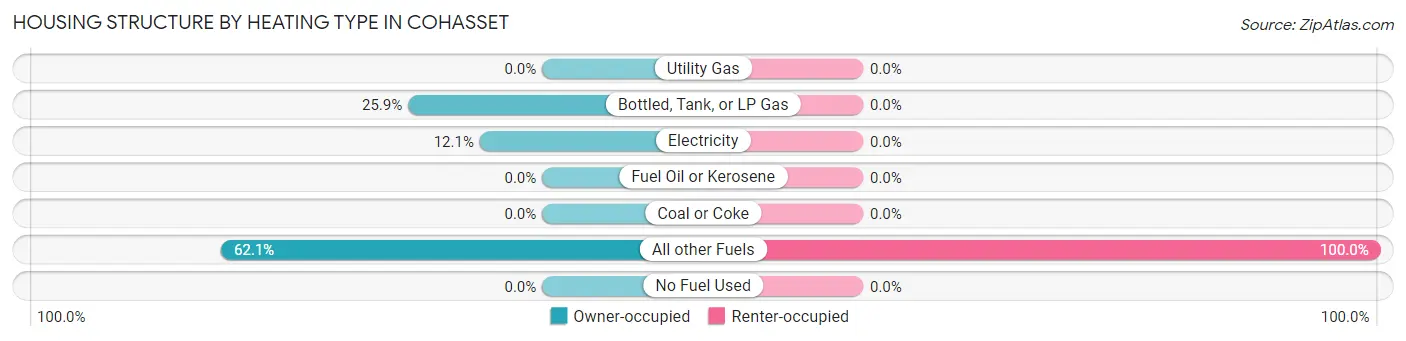
| Heating Type | Owner-occupied | Renter-occupied |
| Utility Gas | 0 (0.0%) | 0 (0.0%) |
| Bottled, Tank, or LP Gas | 43 (25.9%) | 0 (0.0%) |
| Electricity | 20 (12.0%) | 0 (0.0%) |
| Fuel Oil or Kerosene | 0 (0.0%) | 0 (0.0%) |
| Coal or Coke | 0 (0.0%) | 0 (0.0%) |
| All other Fuels | 103 (62.1%) | 31 (100.0%) |
| No Fuel Used | 0 (0.0%) | 0 (0.0%) |
| Total | 166 (100.0%) | 31 (100.0%) |
Household Vehicle Usage in Cohasset
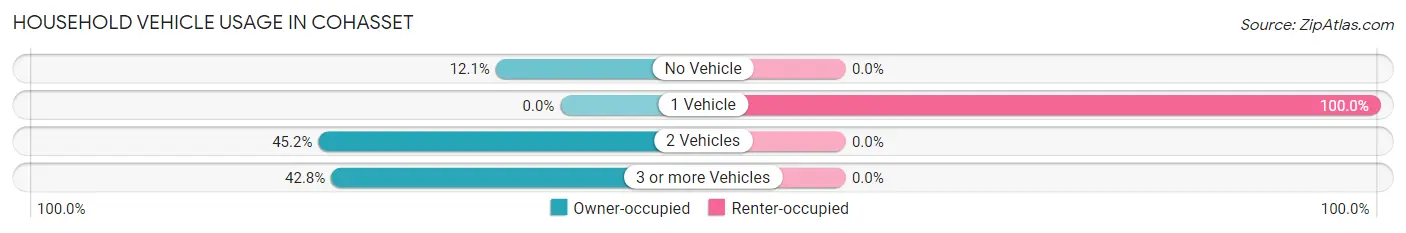
| Vehicles per Household | Owner-occupied | Renter-occupied |
| No Vehicle | 20 (12.0%) | 0 (0.0%) |
| 1 Vehicle | 0 (0.0%) | 31 (100.0%) |
| 2 Vehicles | 75 (45.2%) | 0 (0.0%) |
| 3 or more Vehicles | 71 (42.8%) | 0 (0.0%) |
| Total | 166 (100.0%) | 31 (100.0%) |
Real Estate & Mortgages in Cohasset
Real Estate and Mortgage Overview in Cohasset
| Characteristic | Without Mortgage | With Mortgage |
| Housing Units | 121 | 45 |
| Median Property Value | $343,300 | $357,500 |
| Median Household Income | $75,446 | $20 |
| Monthly Housing Costs | $636 | $0 |
| Real Estate Taxes | $2,203 | $0 |
Property Value by Mortgage Status in Cohasset
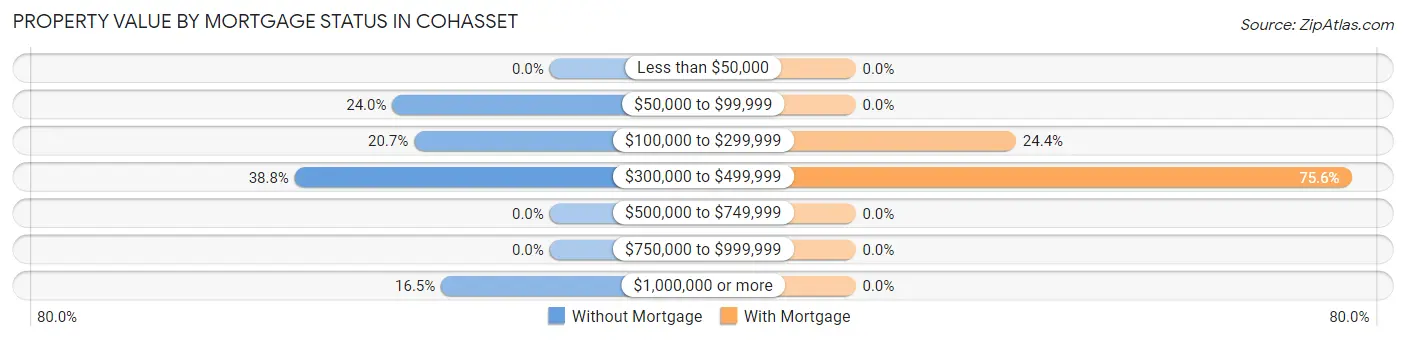
| Property Value | Without Mortgage | With Mortgage |
| Less than $50,000 | 0 (0.0%) | 0 (0.0%) |
| $50,000 to $99,999 | 29 (24.0%) | 0 (0.0%) |
| $100,000 to $299,999 | 25 (20.7%) | 11 (24.4%) |
| $300,000 to $499,999 | 47 (38.8%) | 34 (75.6%) |
| $500,000 to $749,999 | 0 (0.0%) | 0 (0.0%) |
| $750,000 to $999,999 | 0 (0.0%) | 0 (0.0%) |
| $1,000,000 or more | 20 (16.5%) | 0 (0.0%) |
| Total | 121 (100.0%) | 45 (100.0%) |
Household Income by Mortgage Status in Cohasset
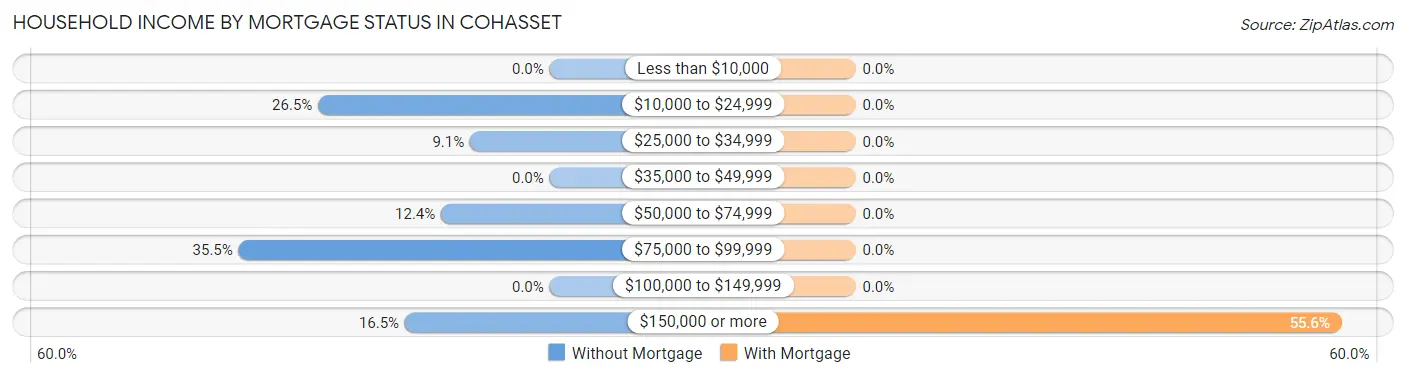
| Household Income | Without Mortgage | With Mortgage |
| Less than $10,000 | 0 (0.0%) | 0 (0.0%) |
| $10,000 to $24,999 | 32 (26.5%) | 0 (0.0%) |
| $25,000 to $34,999 | 11 (9.1%) | 0 (0.0%) |
| $35,000 to $49,999 | 0 (0.0%) | 0 (0.0%) |
| $50,000 to $74,999 | 15 (12.4%) | 0 (0.0%) |
| $75,000 to $99,999 | 43 (35.5%) | 0 (0.0%) |
| $100,000 to $149,999 | 0 (0.0%) | 0 (0.0%) |
| $150,000 or more | 20 (16.5%) | 25 (55.6%) |
| Total | 121 (100.0%) | 45 (100.0%) |
Property Value to Household Income Ratio in Cohasset
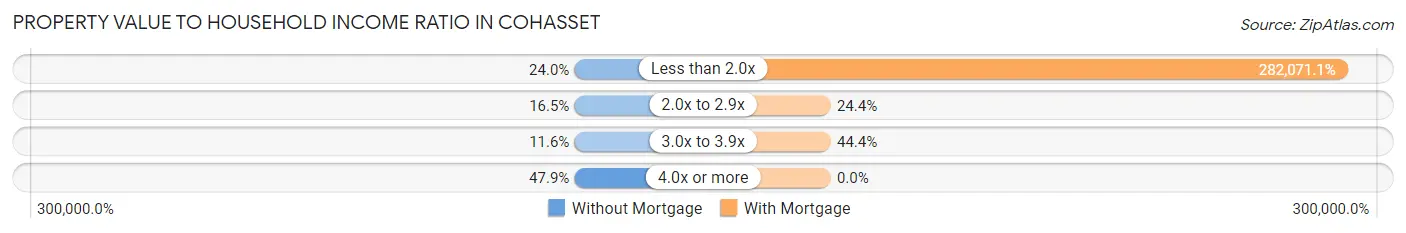
| Value-to-Income Ratio | Without Mortgage | With Mortgage |
| Less than 2.0x | 29 (24.0%) | 126,932 (282,071.1%) |
| 2.0x to 2.9x | 20 (16.5%) | 11 (24.4%) |
| 3.0x to 3.9x | 14 (11.6%) | 20 (44.4%) |
| 4.0x or more | 58 (47.9%) | 0 (0.0%) |
| Total | 121 (100.0%) | 45 (100.0%) |
Real Estate Taxes by Mortgage Status in Cohasset
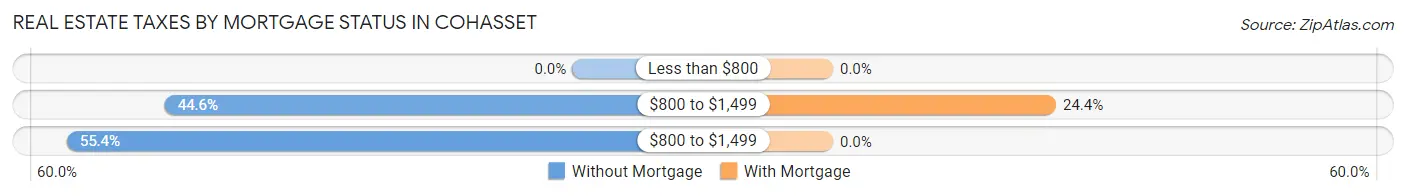
| Property Taxes | Without Mortgage | With Mortgage |
| Less than $800 | 0 (0.0%) | 0 (0.0%) |
| $800 to $1,499 | 54 (44.6%) | 11 (24.4%) |
| $800 to $1,499 | 67 (55.4%) | 0 (0.0%) |
| Total | 121 (100.0%) | 45 (100.0%) |
Health & Disability in Cohasset
Health Insurance Coverage by Age in Cohasset
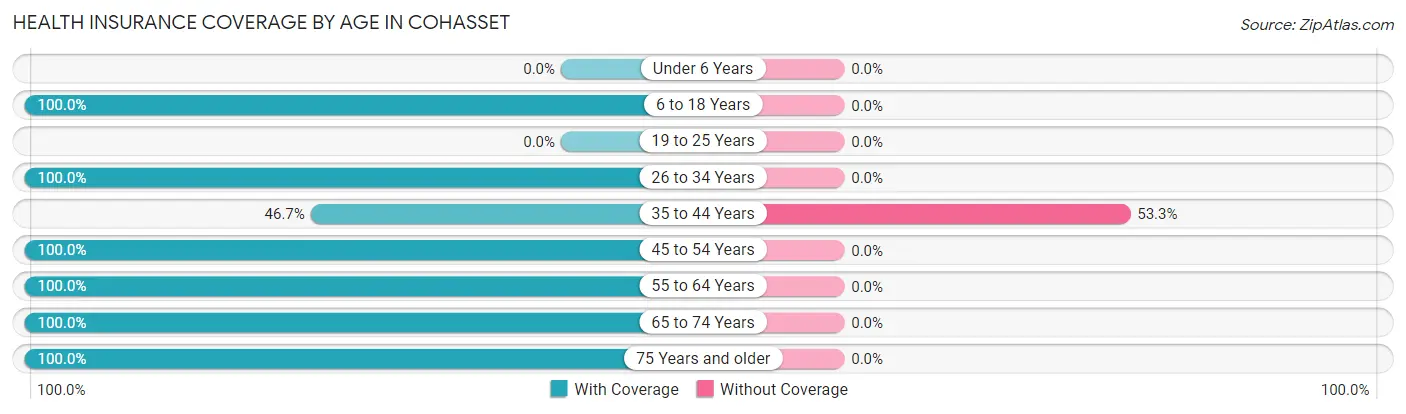
| Age Bracket | With Coverage | Without Coverage |
| Under 6 Years | 0 (0.0%) | 0 (0.0%) |
| 6 to 18 Years | 62 (100.0%) | 0 (0.0%) |
| 19 to 25 Years | 0 (0.0%) | 0 (0.0%) |
| 26 to 34 Years | 17 (100.0%) | 0 (0.0%) |
| 35 to 44 Years | 28 (46.7%) | 32 (53.3%) |
| 45 to 54 Years | 94 (100.0%) | 0 (0.0%) |
| 55 to 64 Years | 61 (100.0%) | 0 (0.0%) |
| 65 to 74 Years | 78 (100.0%) | 0 (0.0%) |
| 75 Years and older | 20 (100.0%) | 0 (0.0%) |
| Total | 360 (91.8%) | 32 (8.2%) |
Health Insurance Coverage by Citizenship Status in Cohasset
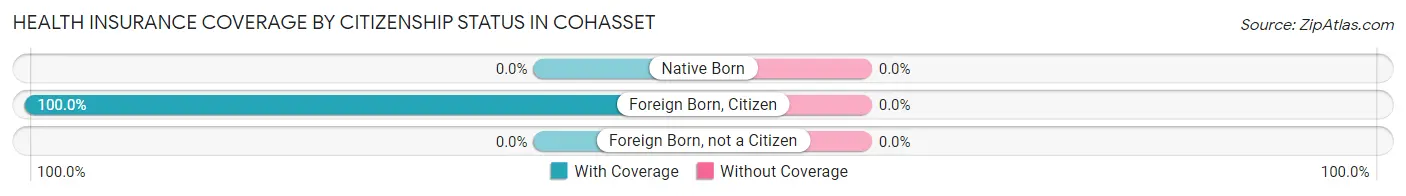
| Citizenship Status | With Coverage | Without Coverage |
| Native Born | 0 (0.0%) | 0 (0.0%) |
| Foreign Born, Citizen | 62 (100.0%) | 0 (0.0%) |
| Foreign Born, not a Citizen | 0 (0.0%) | 0 (0.0%) |
Health Insurance Coverage by Household Income in Cohasset
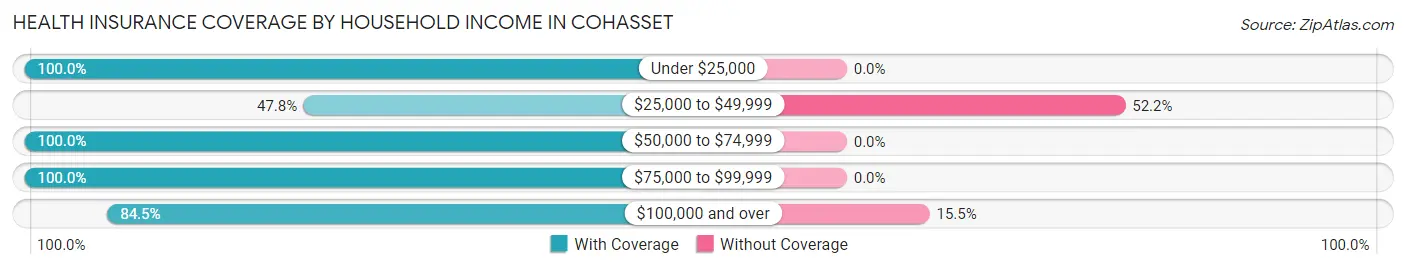
| Household Income | With Coverage | Without Coverage |
| Under $25,000 | 89 (100.0%) | 0 (0.0%) |
| $25,000 to $49,999 | 11 (47.8%) | 12 (52.2%) |
| $50,000 to $74,999 | 26 (100.0%) | 0 (0.0%) |
| $75,000 to $99,999 | 125 (100.0%) | 0 (0.0%) |
| $100,000 and over | 109 (84.5%) | 20 (15.5%) |
Public vs Private Health Insurance Coverage by Age in Cohasset
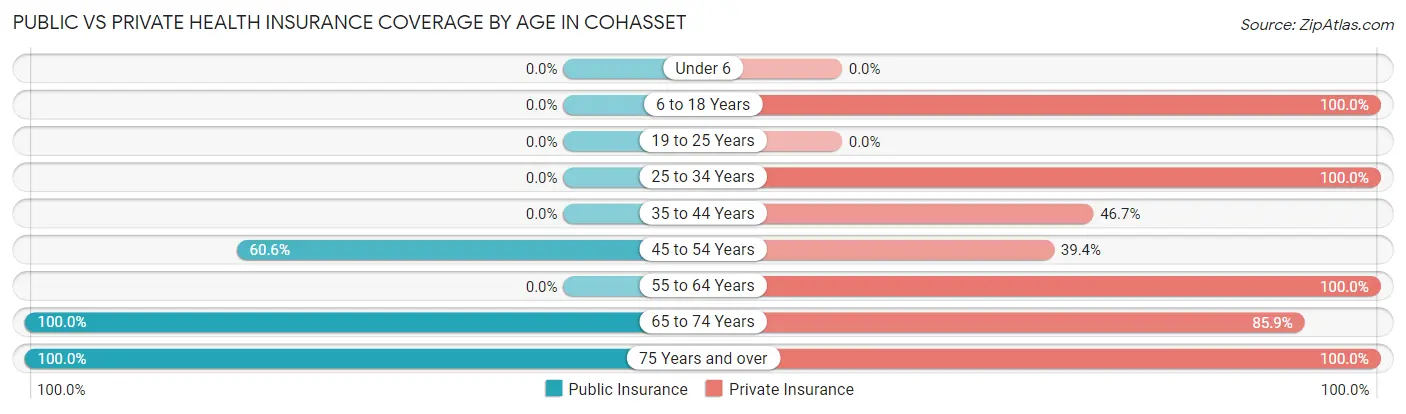
| Age Bracket | Public Insurance | Private Insurance |
| Under 6 | 0 (0.0%) | 0 (0.0%) |
| 6 to 18 Years | 0 (0.0%) | 62 (100.0%) |
| 19 to 25 Years | 0 (0.0%) | 0 (0.0%) |
| 25 to 34 Years | 0 (0.0%) | 17 (100.0%) |
| 35 to 44 Years | 0 (0.0%) | 28 (46.7%) |
| 45 to 54 Years | 57 (60.6%) | 37 (39.4%) |
| 55 to 64 Years | 0 (0.0%) | 61 (100.0%) |
| 65 to 74 Years | 78 (100.0%) | 67 (85.9%) |
| 75 Years and over | 20 (100.0%) | 20 (100.0%) |
| Total | 155 (39.5%) | 292 (74.5%) |
Disability Status by Sex by Age in Cohasset
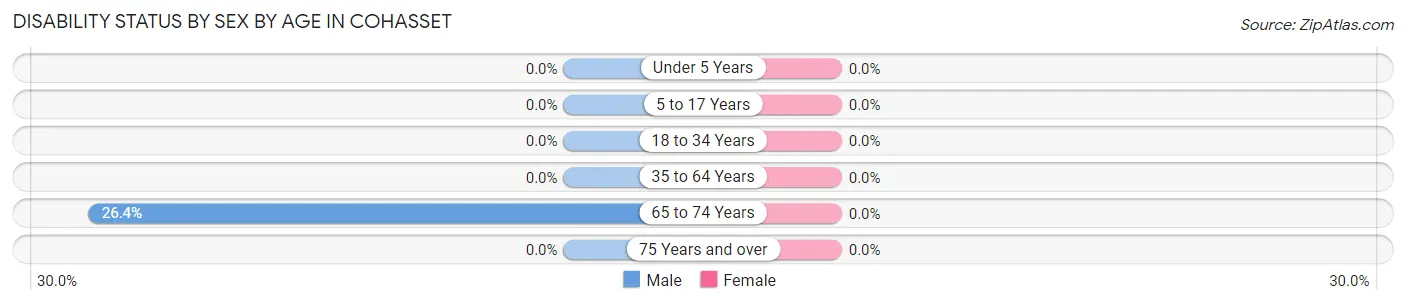
| Age Bracket | Male | Female |
| Under 5 Years | 0 (0.0%) | 0 (0.0%) |
| 5 to 17 Years | 0 (0.0%) | 0 (0.0%) |
| 18 to 34 Years | 0 (0.0%) | 0 (0.0%) |
| 35 to 64 Years | 0 (0.0%) | 0 (0.0%) |
| 65 to 74 Years | 14 (26.4%) | 0 (0.0%) |
| 75 Years and over | 0 (0.0%) | 0 (0.0%) |
Disability Class by Sex by Age in Cohasset
Disability Class: Hearing Difficulty
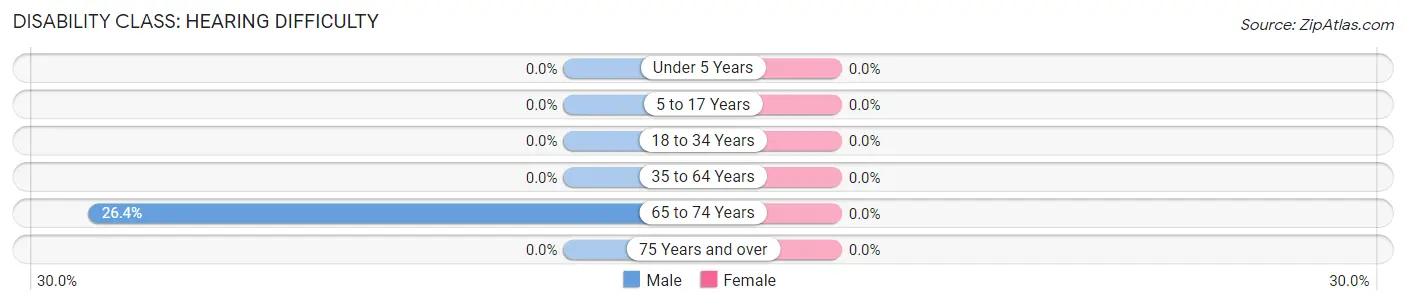
| Age Bracket | Male | Female |
| Under 5 Years | 0 (0.0%) | 0 (0.0%) |
| 5 to 17 Years | 0 (0.0%) | 0 (0.0%) |
| 18 to 34 Years | 0 (0.0%) | 0 (0.0%) |
| 35 to 64 Years | 0 (0.0%) | 0 (0.0%) |
| 65 to 74 Years | 14 (26.4%) | 0 (0.0%) |
| 75 Years and over | 0 (0.0%) | 0 (0.0%) |
Disability Class: Vision Difficulty
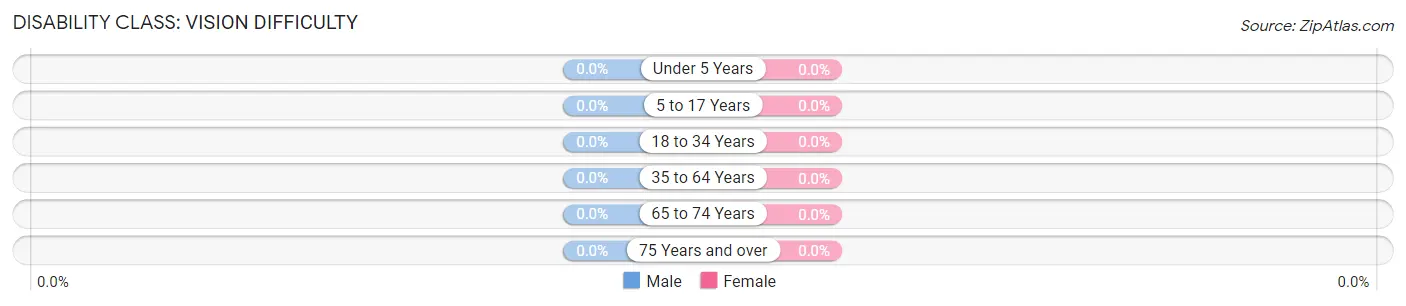
| Age Bracket | Male | Female |
| Under 5 Years | 0 (0.0%) | 0 (0.0%) |
| 5 to 17 Years | 0 (0.0%) | 0 (0.0%) |
| 18 to 34 Years | 0 (0.0%) | 0 (0.0%) |
| 35 to 64 Years | 0 (0.0%) | 0 (0.0%) |
| 65 to 74 Years | 0 (0.0%) | 0 (0.0%) |
| 75 Years and over | 0 (0.0%) | 0 (0.0%) |
Disability Class: Cognitive Difficulty
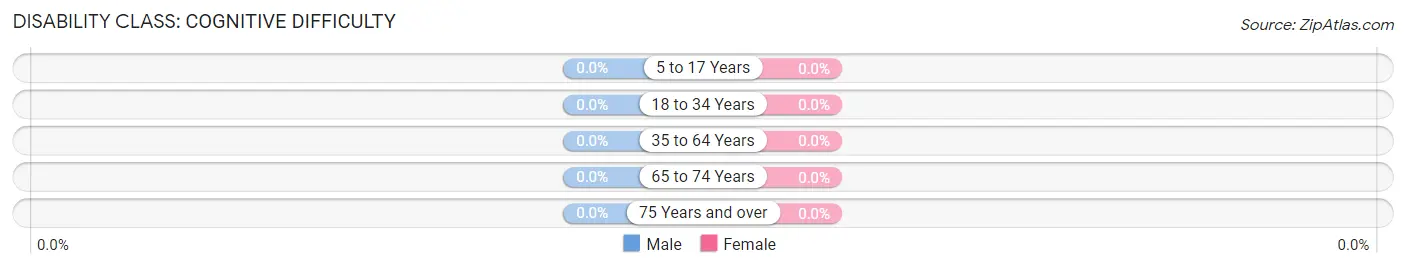
| Age Bracket | Male | Female |
| 5 to 17 Years | 0 (0.0%) | 0 (0.0%) |
| 18 to 34 Years | 0 (0.0%) | 0 (0.0%) |
| 35 to 64 Years | 0 (0.0%) | 0 (0.0%) |
| 65 to 74 Years | 0 (0.0%) | 0 (0.0%) |
| 75 Years and over | 0 (0.0%) | 0 (0.0%) |
Disability Class: Ambulatory Difficulty
| Age Bracket | Male | Female |
| 5 to 17 Years | 0 (0.0%) | 0 (0.0%) |
| 18 to 34 Years | 0 (0.0%) | 0 (0.0%) |
| 35 to 64 Years | 0 (0.0%) | 0 (0.0%) |
| 65 to 74 Years | 0 (0.0%) | 0 (0.0%) |
| 75 Years and over | 0 (0.0%) | 0 (0.0%) |
Disability Class: Self-Care Difficulty
| Age Bracket | Male | Female |
| 5 to 17 Years | 0 (0.0%) | 0 (0.0%) |
| 18 to 34 Years | 0 (0.0%) | 0 (0.0%) |
| 35 to 64 Years | 0 (0.0%) | 0 (0.0%) |
| 65 to 74 Years | 0 (0.0%) | 0 (0.0%) |
| 75 Years and over | 0 (0.0%) | 0 (0.0%) |
Technology Access in Cohasset
Computing Device Access in Cohasset
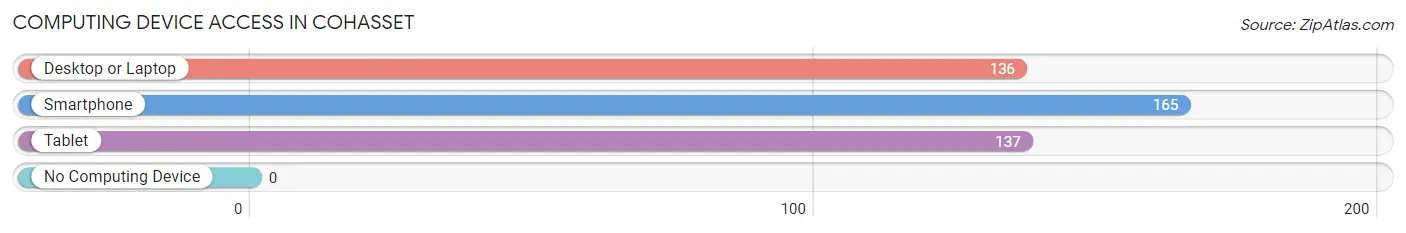
| Device Type | # Households | % Households |
| Desktop or Laptop | 136 | 69.0% |
| Smartphone | 165 | 83.8% |
| Tablet | 137 | 69.5% |
| No Computing Device | 0 | 0.0% |
| Total | 197 | 100.0% |
Internet Access in Cohasset
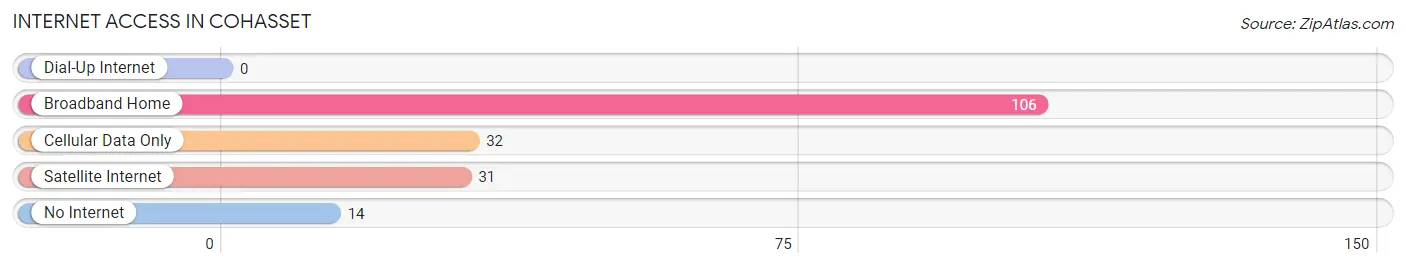
| Internet Type | # Households | % Households |
| Dial-Up Internet | 0 | 0.0% |
| Broadband Home | 106 | 53.8% |
| Cellular Data Only | 32 | 16.2% |
| Satellite Internet | 31 | 15.7% |
| No Internet | 14 | 7.1% |
| Total | 197 | 100.0% |
Cohasset Summary
Cohasset is a small unincorporated community located in Butte County, California. It is situated in the foothills of the Sierra Nevada Mountains, approximately 10 miles east of Chico. The town is home to a population of approximately 1,000 people, and is known for its rural atmosphere and small-town charm.
History
Cohasset was first settled in the late 1800s by a group of miners who were looking for gold in the nearby hills. The town was officially established in 1887, and was named after the nearby Cohasset Creek. The town quickly grew, and by the early 1900s, it had become a bustling center of commerce and industry. The town was home to several businesses, including a general store, a blacksmith shop, a hotel, and a saloon.
In the early 1900s, the town was also home to a large Chinese population. The Chinese immigrants had come to the area to work in the gold mines, and they established a Chinatown in the town. The Chinatown was home to a variety of businesses, including restaurants, laundries, and stores.
Geography
Cohasset is located in the foothills of the Sierra Nevada Mountains, approximately 10 miles east of Chico. The town is situated at an elevation of 1,400 feet, and is surrounded by rolling hills and open fields. The town is located in a semi-arid climate, with hot summers and mild winters.
Economy
Cohasset’s economy is largely based on agriculture and tourism. The town is home to several farms, which produce a variety of crops, including almonds, walnuts, and olives. The town is also home to several wineries, which produce a variety of wines.
Tourism is also an important part of the town’s economy. The town is home to several attractions, including the Cohasset Museum, which showcases the town’s history, and the Cohasset Historical Society, which offers tours of the town’s historic sites.
Demographics
As of the 2010 census, Cohasset had a population of 1,000 people. The town is predominantly white, with approximately 75% of the population identifying as Caucasian. The town is also home to a small Hispanic population, with approximately 10% of the population identifying as Hispanic or Latino. The town is also home to a small Asian population, with approximately 5% of the population identifying as Asian.
Conclusion
Cohasset is a small unincorporated community located in Butte County, California. It is situated in the foothills of the Sierra Nevada Mountains, approximately 10 miles east of Chico. The town is home to a population of approximately 1,000 people, and is known for its rural atmosphere and small-town charm. The town’s economy is largely based on agriculture and tourism, and the town is home to several attractions, including the Cohasset Museum and the Cohasset Historical Society. The town is predominantly white, with approximately 75% of the population identifying as Caucasian.
Common Questions
What is Per Capita Income in Cohasset?
Per Capita income in Cohasset is $92,896.
What is the Median Family Income in Cohasset?
Median Family Income in Cohasset is $78,491.
What is the Median Household income in Cohasset?
Median Household Income in Cohasset is $76,696.
What is Inequality or Gini Index in Cohasset?
Inequality or Gini Index in Cohasset is 0.68.
What is the Total Population of Cohasset?
Total Population of Cohasset is 392.
What is the Total Male Population of Cohasset?
Total Male Population of Cohasset is 241.
What is the Total Female Population of Cohasset?
Total Female Population of Cohasset is 151.
What is the Ratio of Males per 100 Females in Cohasset?
There are 159.60 Males per 100 Females in Cohasset.
What is the Ratio of Females per 100 Males in Cohasset?
There are 62.66 Females per 100 Males in Cohasset.
What is the Median Population Age in Cohasset?
Median Population Age in Cohasset is 50.9 Years.
What is the Average Family Size in Cohasset
Average Family Size in Cohasset is 2.5 People.
What is the Average Household Size in Cohasset
Average Household Size in Cohasset is 2.0 People.
How Large is the Labor Force in Cohasset?
There are 245 People in the Labor Forcein in Cohasset.
What is the Percentage of People in the Labor Force in Cohasset?
74.2% of People are in the Labor Force in Cohasset.
What is the Unemployment Rate in Cohasset?
Unemployment Rate in Cohasset is 9.4%.