Cities with the Lowest Poverty Level Among Seniors Over the Age of 65 in California
RELATED REPORTS & OPTIONS
Lowest Poverty | Seniors 65+
California
Compare Cities
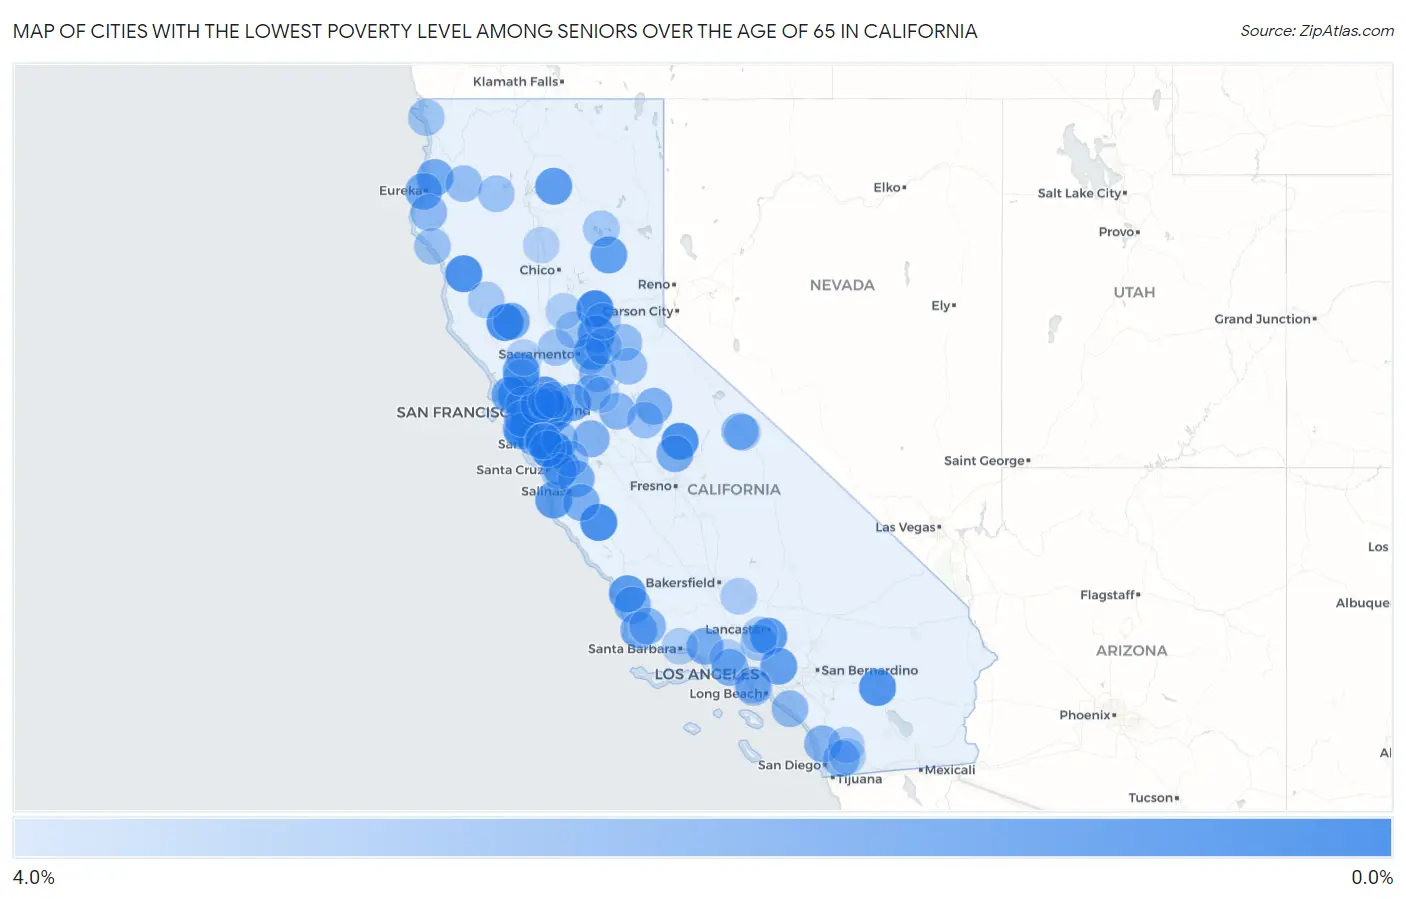
Map of Cities with the Lowest Poverty Level Among Seniors Over the Age of 65 in California
4.0%
0.0%
Cities with the Lowest Poverty Level Among Seniors Over the Age of 65 in California
| City | Senior Poverty | vs State | vs National | |
| 1. | El Sobrante Cdp Riverside County | 0.24% | 11.0%(-10.8)#1 | 10.0%(-9.72)#27 |
| 2. | Monte Sereno | 0.33% | 11.0%(-10.7)#2 | 10.0%(-9.62)#46 |
| 3. | Cambrian Park | 0.44% | 11.0%(-10.6)#3 | 10.0%(-9.51)#71 |
| 4. | Penn Valley | 0.44% | 11.0%(-10.6)#4 | 10.0%(-9.51)#73 |
| 5. | Hillsborough | 0.44% | 11.0%(-10.6)#5 | 10.0%(-9.51)#74 |
| 6. | Bakersfield Country Club | 0.52% | 11.0%(-10.5)#6 | 10.0%(-9.43)#86 |
| 7. | King City | 0.66% | 11.0%(-10.4)#7 | 10.0%(-9.29)#122 |
| 8. | Soda Bay | 0.73% | 11.0%(-10.3)#8 | 10.0%(-9.22)#152 |
| 9. | Ahwahnee | 0.75% | 11.0%(-10.3)#9 | 10.0%(-9.20)#163 |
| 10. | Laytonville | 0.79% | 11.0%(-10.2)#10 | 10.0%(-9.16)#174 |
| 11. | San Miguel Cdp Contra Costa County | 0.87% | 11.0%(-10.1)#11 | 10.0%(-9.08)#206 |
| 12. | Indio Hills | 0.88% | 11.0%(-10.1)#12 | 10.0%(-9.07)#220 |
| 13. | Vine Hill | 0.93% | 11.0%(-10.1)#13 | 10.0%(-9.02)#243 |
| 14. | Sleepy Hollow | 1.0% | 11.0%(-10.0)#14 | 10.0%(-8.95)#285 |
| 15. | Eldridge | 1.1% | 11.0%(-9.88)#15 | 10.0%(-8.82)#363 |
| 16. | Desert View Highlands | 1.2% | 11.0%(-9.85)#16 | 10.0%(-8.79)#390 |
| 17. | Carmel By The Sea | 1.2% | 11.0%(-9.84)#17 | 10.0%(-8.78)#395 |
| 18. | Los Ranchos | 1.2% | 11.0%(-9.81)#18 | 10.0%(-8.75)#418 |
| 19. | Penryn | 1.2% | 11.0%(-9.81)#19 | 10.0%(-8.75)#420 |
| 20. | Montgomery Creek | 1.3% | 11.0%(-9.76)#20 | 10.0%(-8.70)#448 |
| 21. | Fairview | 1.3% | 11.0%(-9.74)#21 | 10.0%(-8.68)#466 |
| 22. | Quincy | 1.3% | 11.0%(-9.72)#22 | 10.0%(-8.66)#487 |
| 23. | Montara | 1.3% | 11.0%(-9.70)#23 | 10.0%(-8.64)#504 |
| 24. | Gold River | 1.3% | 11.0%(-9.69)#24 | 10.0%(-8.63)#515 |
| 25. | Woodside | 1.4% | 11.0%(-9.65)#25 | 10.0%(-8.59)#549 |
| 26. | Bradbury | 1.4% | 11.0%(-9.62)#26 | 10.0%(-8.56)#563 |
| 27. | Corralitos | 1.5% | 11.0%(-9.53)#27 | 10.0%(-8.47)#639 |
| 28. | Discovery Bay | 1.5% | 11.0%(-9.50)#28 | 10.0%(-8.44)#657 |
| 29. | Lagunitas Forest Knolls | 1.6% | 11.0%(-9.44)#29 | 10.0%(-8.38)#703 |
| 30. | Camino Tassajara | 1.7% | 11.0%(-9.36)#30 | 10.0%(-8.30)#767 |
| 31. | Fieldbrook | 1.8% | 11.0%(-9.23)#31 | 10.0%(-8.17)#889 |
| 32. | Fairhaven | 1.8% | 11.0%(-9.23)#32 | 10.0%(-8.17)#895 |
| 33. | Clearlake Oaks | 1.8% | 11.0%(-9.22)#33 | 10.0%(-8.15)#901 |
| 34. | Blackhawk | 1.8% | 11.0%(-9.18)#34 | 10.0%(-8.12)#923 |
| 35. | San Juan Bautista | 1.8% | 11.0%(-9.18)#35 | 10.0%(-8.11)#936 |
| 36. | Yosemite Lakes | 1.9% | 11.0%(-9.15)#36 | 10.0%(-8.08)#958 |
| 37. | Meiners Oaks | 1.9% | 11.0%(-9.14)#37 | 10.0%(-8.08)#964 |
| 38. | Blacklake | 2.0% | 11.0%(-9.04)#38 | 10.0%(-7.98)#1,071 |
| 39. | Tiburon | 2.0% | 11.0%(-9.03)#39 | 10.0%(-7.97)#1,081 |
| 40. | Gonzales | 2.0% | 11.0%(-9.00)#40 | 10.0%(-7.94)#1,105 |
| 41. | Westlake Village | 2.0% | 11.0%(-8.98)#41 | 10.0%(-7.91)#1,116 |
| 42. | Pine Mountain Lake | 2.1% | 11.0%(-8.96)#42 | 10.0%(-7.90)#1,138 |
| 43. | Mission Hills | 2.1% | 11.0%(-8.96)#43 | 10.0%(-7.90)#1,145 |
| 44. | Diablo Grande | 2.1% | 11.0%(-8.91)#44 | 10.0%(-7.85)#1,192 |
| 45. | Piedmont | 2.2% | 11.0%(-8.84)#45 | 10.0%(-7.78)#1,237 |
| 46. | Silverado | 2.2% | 11.0%(-8.84)#46 | 10.0%(-7.78)#1,240 |
| 47. | Swall Meadows | 2.2% | 11.0%(-8.84)#47 | 10.0%(-7.78)#1,244 |
| 48. | Clay | 2.2% | 11.0%(-8.80)#48 | 10.0%(-7.74)#1,285 |
| 49. | Rancho Santa Fe | 2.2% | 11.0%(-8.78)#49 | 10.0%(-7.72)#1,306 |
| 50. | Los Alamos | 2.2% | 11.0%(-8.77)#50 | 10.0%(-7.70)#1,326 |
| 51. | Crest | 2.3% | 11.0%(-8.76)#51 | 10.0%(-7.70)#1,337 |
| 52. | East Oakdale | 2.3% | 11.0%(-8.75)#52 | 10.0%(-7.69)#1,341 |
| 53. | El Granada | 2.3% | 11.0%(-8.70)#53 | 10.0%(-7.64)#1,384 |
| 54. | Broadmoor | 2.4% | 11.0%(-8.65)#54 | 10.0%(-7.59)#1,435 |
| 55. | Alamo | 2.4% | 11.0%(-8.63)#55 | 10.0%(-7.57)#1,458 |
| 56. | Rio Dell | 2.4% | 11.0%(-8.59)#56 | 10.0%(-7.53)#1,511 |
| 57. | Laguna Beach | 2.4% | 11.0%(-8.57)#57 | 10.0%(-7.51)#1,540 |
| 58. | San Miguel Cdp San Luis Obispo County | 2.5% | 11.0%(-8.55)#58 | 10.0%(-7.49)#1,554 |
| 59. | Los Altos Hills | 2.5% | 11.0%(-8.48)#59 | 10.0%(-7.42)#1,624 |
| 60. | Camino | 2.5% | 11.0%(-8.48)#60 | 10.0%(-7.41)#1,636 |
| 61. | East Foothills | 2.6% | 11.0%(-8.46)#61 | 10.0%(-7.40)#1,652 |
| 62. | Morada | 2.6% | 11.0%(-8.40)#62 | 10.0%(-7.34)#1,718 |
| 63. | Trinity Village | 2.6% | 11.0%(-8.37)#63 | 10.0%(-7.31)#1,762 |
| 64. | Red Corral | 2.7% | 11.0%(-8.35)#64 | 10.0%(-7.29)#1,778 |
| 65. | Orinda | 2.7% | 11.0%(-8.35)#65 | 10.0%(-7.29)#1,784 |
| 66. | Manhattan Beach | 2.7% | 11.0%(-8.32)#66 | 10.0%(-7.26)#1,818 |
| 67. | Contra Costa Centre | 2.7% | 11.0%(-8.31)#67 | 10.0%(-7.25)#1,824 |
| 68. | Lake Don Pedro | 2.7% | 11.0%(-8.28)#68 | 10.0%(-7.22)#1,862 |
| 69. | Temelec | 2.7% | 11.0%(-8.26)#69 | 10.0%(-7.20)#1,875 |
| 70. | Agua Dulce | 2.8% | 11.0%(-8.25)#70 | 10.0%(-7.19)#1,882 |
| 71. | Shelter Cove | 2.8% | 11.0%(-8.25)#71 | 10.0%(-7.18)#1,894 |
| 72. | Morgan Hill | 2.8% | 11.0%(-8.24)#72 | 10.0%(-7.18)#1,898 |
| 73. | Weaverville | 2.8% | 11.0%(-8.21)#73 | 10.0%(-7.15)#1,933 |
| 74. | Hermosa Beach | 2.9% | 11.0%(-8.16)#74 | 10.0%(-7.10)#1,985 |
| 75. | Monument Hills | 2.9% | 11.0%(-8.16)#75 | 10.0%(-7.09)#1,993 |
| 76. | Bertsch Oceanview | 2.9% | 11.0%(-8.13)#76 | 10.0%(-7.07)#2,037 |
| 77. | Mather | 2.9% | 11.0%(-8.12)#77 | 10.0%(-7.06)#2,047 |
| 78. | Nicolaus | 2.9% | 11.0%(-8.07)#78 | 10.0%(-7.01)#2,115 |
| 79. | El Dorado Hills | 3.0% | 11.0%(-8.06)#79 | 10.0%(-7.00)#2,127 |
| 80. | Hamilton Branch | 3.0% | 11.0%(-8.02)#80 | 10.0%(-6.96)#2,170 |
| 81. | Lake Of The Pines | 3.1% | 11.0%(-7.95)#81 | 10.0%(-6.89)#2,253 |
| 82. | Modjeska | 3.1% | 11.0%(-7.94)#82 | 10.0%(-6.87)#2,269 |
| 83. | Sage | 3.1% | 11.0%(-7.93)#83 | 10.0%(-6.87)#2,283 |
| 84. | Potter Valley | 3.1% | 11.0%(-7.92)#84 | 10.0%(-6.86)#2,294 |
| 85. | San Diego Country Estates | 3.1% | 11.0%(-7.90)#85 | 10.0%(-6.84)#2,317 |
| 86. | Bear Valley Springs | 3.1% | 11.0%(-7.88)#86 | 10.0%(-6.82)#2,352 |
| 87. | Aptos Hills Larkin Valley | 3.1% | 11.0%(-7.87)#87 | 10.0%(-6.81)#2,369 |
| 88. | Mission Canyon | 3.2% | 11.0%(-7.86)#88 | 10.0%(-6.80)#2,377 |
| 89. | Paradise | 3.2% | 11.0%(-7.82)#89 | 10.0%(-6.76)#2,430 |
| 90. | Alpine | 3.2% | 11.0%(-7.79)#90 | 10.0%(-6.73)#2,454 |
| 91. | Moorpark | 3.2% | 11.0%(-7.79)#91 | 10.0%(-6.73)#2,482 |
| 92. | Sutter | 3.3% | 11.0%(-7.75)#92 | 10.0%(-6.68)#2,524 |
| 93. | Clayton | 3.3% | 11.0%(-7.74)#93 | 10.0%(-6.68)#2,534 |
| 94. | La Canada Flintridge | 3.3% | 11.0%(-7.71)#94 | 10.0%(-6.65)#2,581 |
| 95. | Leona Valley | 3.3% | 11.0%(-7.71)#95 | 10.0%(-6.65)#2,583 |
| 96. | St Helena | 3.3% | 11.0%(-7.67)#96 | 10.0%(-6.61)#2,647 |
| 97. | Gerber | 3.3% | 11.0%(-7.67)#97 | 10.0%(-6.61)#2,653 |
| 98. | Linden | 3.4% | 11.0%(-7.59)#98 | 10.0%(-6.52)#2,753 |
| 99. | Los Altos | 3.4% | 11.0%(-7.58)#99 | 10.0%(-6.52)#2,760 |
| 100. | Saratoga | 3.4% | 11.0%(-7.57)#100 | 10.0%(-6.51)#2,769 |
Common Questions
What are the Top 10 Cities with the Lowest Poverty Level Among Seniors Over the Age of 65 in California?
Top 10 Cities with the Lowest Poverty Level Among Seniors Over the Age of 65 in California are:
#1
0.33%
#2
0.44%
#3
0.44%
#4
0.44%
#5
0.66%
#6
0.73%
#7
0.75%
#8
0.79%
#9
0.88%
#10
0.93%
What city has the Lowest Poverty Level Among Seniors Over the Age of 65 in California?
Monte Sereno has the Lowest Poverty Level Among Seniors Over the Age of 65 in California with 0.33%.
What is the Poverty Level Among Seniors Over the Age of 65 in the State of California?
Poverty Level Among Seniors Over the Age of 65 in California is 11.0%.
What is the Poverty Level Among Seniors Over the Age of 65 in the United States?
Poverty Level Among Seniors Over the Age of 65 in the United States is 10.0%.