Potrero, CA Map & Demographics
Potrero Map
Potrero Overview
$18,563
PER CAPITA INCOME
$184,313
AVG FAMILY INCOME
63.3%
WAGE / INCOME GAP [ % ]
36.7¢/ $1
WAGE / INCOME GAP [ $ ]
0.43
INEQUALITY / GINI INDEX
509
TOTAL POPULATION
271
MALE POPULATION
238
FEMALE POPULATION
113.87
MALES / 100 FEMALES
87.82
FEMALES / 100 MALES
24.9
MEDIAN AGE
7.5
AVG FAMILY SIZE
6.2
AVG HOUSEHOLD SIZE
231
LABOR FORCE [ PEOPLE ]
59.2%
PERCENT IN LABOR FORCE
9.1%
UNEMPLOYMENT RATE
Potrero Zip Codes
Potrero Area Codes
Income in Potrero
Income Overview in Potrero
| Characteristic | Number | Measure |
| Per Capita Income | 509 | $18,563 |
| Median Family Income | 57 | $184,313 |
| Mean Family Income | 57 | $145,951 |
| Median Household Income | 82 | $0 |
| Mean Household Income | 82 | $105,957 |
| Income Deficit | 57 | $0 |
| Wage / Income Gap (%) | 509 | 63.35% |
| Wage / Income Gap ($) | 509 | 36.65¢ per $1 |
| Gini / Inequality Index | 509 | 0.43 |
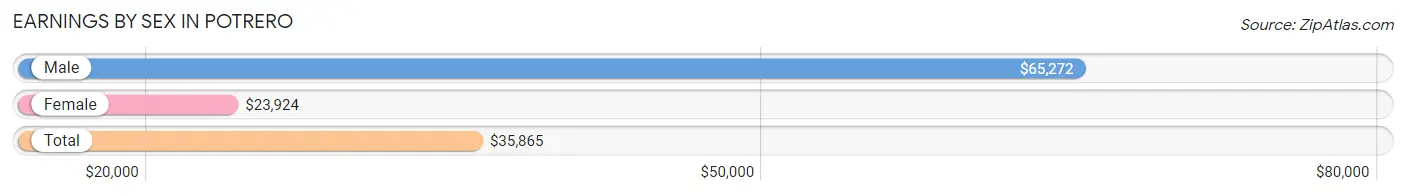
Earnings by Sex in Potrero
Average Earnings in Potrero are $35,865, $65,272 for men and $23,924 for women, a difference of 63.3%.
| Sex | Number | Average Earnings |
| Male | 95 (42.4%) | $65,272 |
| Female | 129 (57.6%) | $23,924 |
| Total | 224 (100.0%) | $35,865 |
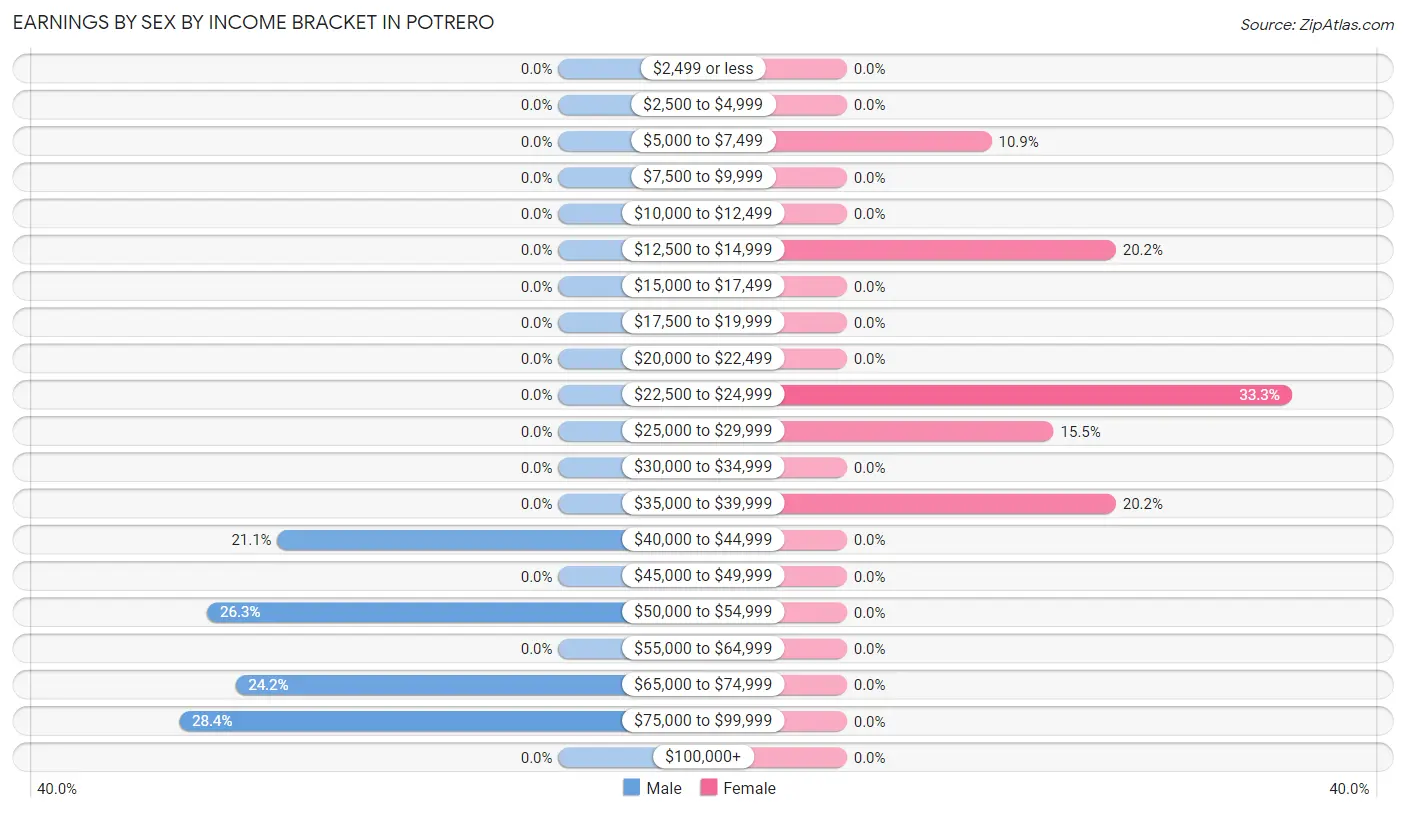
Earnings by Sex by Income Bracket in Potrero
The most common earnings brackets in Potrero are $75,000 to $99,999 for men (27 | 28.4%) and $22,500 to $24,999 for women (43 | 33.3%).
| Income | Male | Female |
| $2,499 or less | 0 (0.0%) | 0 (0.0%) |
| $2,500 to $4,999 | 0 (0.0%) | 0 (0.0%) |
| $5,000 to $7,499 | 0 (0.0%) | 14 (10.8%) |
| $7,500 to $9,999 | 0 (0.0%) | 0 (0.0%) |
| $10,000 to $12,499 | 0 (0.0%) | 0 (0.0%) |
| $12,500 to $14,999 | 0 (0.0%) | 26 (20.2%) |
| $15,000 to $17,499 | 0 (0.0%) | 0 (0.0%) |
| $17,500 to $19,999 | 0 (0.0%) | 0 (0.0%) |
| $20,000 to $22,499 | 0 (0.0%) | 0 (0.0%) |
| $22,500 to $24,999 | 0 (0.0%) | 43 (33.3%) |
| $25,000 to $29,999 | 0 (0.0%) | 20 (15.5%) |
| $30,000 to $34,999 | 0 (0.0%) | 0 (0.0%) |
| $35,000 to $39,999 | 0 (0.0%) | 26 (20.2%) |
| $40,000 to $44,999 | 20 (21.0%) | 0 (0.0%) |
| $45,000 to $49,999 | 0 (0.0%) | 0 (0.0%) |
| $50,000 to $54,999 | 25 (26.3%) | 0 (0.0%) |
| $55,000 to $64,999 | 0 (0.0%) | 0 (0.0%) |
| $65,000 to $74,999 | 23 (24.2%) | 0 (0.0%) |
| $75,000 to $99,999 | 27 (28.4%) | 0 (0.0%) |
| $100,000+ | 0 (0.0%) | 0 (0.0%) |
| Total | 95 (100.0%) | 129 (100.0%) |
Earnings by Sex by Educational Attainment in Potrero
| Educational Attainment | Male Income | Female Income |
| Less than High School | - | - |
| High School Diploma | - | - |
| College or Associate's Degree | - | - |
| Bachelor's Degree | - | - |
| Graduate Degree | - | - |
| Total | $66,630 | $23,924 |
Family Income in Potrero
Family Income Brackets in Potrero
According to the Potrero family income data, there are 43 families falling into the $150,000 to $199,999 income range, which is the most common income bracket and makes up 75.4% of all families.
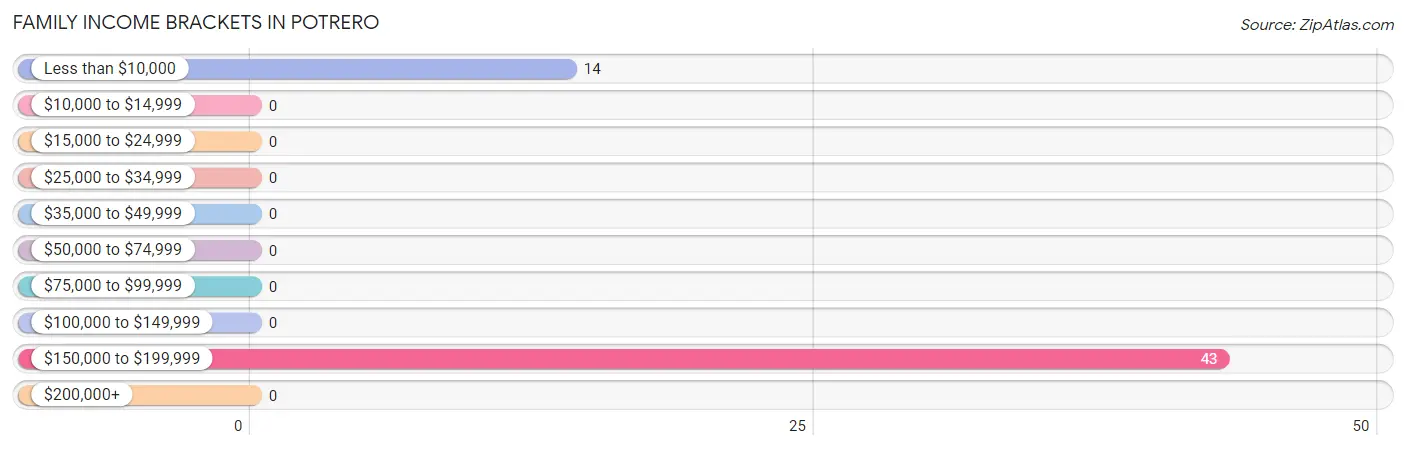
| Income Bracket | # Families | % Families |
| Less than $10,000 | 14 | 24.6% |
| $10,000 to $14,999 | 0 | 0.0% |
| $15,000 to $24,999 | 0 | 0.0% |
| $25,000 to $34,999 | 0 | 0.0% |
| $35,000 to $49,999 | 0 | 0.0% |
| $50,000 to $74,999 | 0 | 0.0% |
| $75,000 to $99,999 | 0 | 0.0% |
| $100,000 to $149,999 | 0 | 0.0% |
| $150,000 to $199,999 | 43 | 75.4% |
| $200,000+ | 0 | 0.0% |
Family Income by Famaliy Size in Potrero
| Income Bracket | # Families | Median Income |
| 2-Person Families | 0 (0.0%) | $0 |
| 3-Person Families | 0 (0.0%) | $0 |
| 4-Person Families | 14 (24.6%) | $0 |
| 5-Person Families | 0 (0.0%) | $0 |
| 6-Person Families | 0 (0.0%) | $0 |
| 7+ Person Families | 43 (75.4%) | $0 |
| Total | 57 (100.0%) | $184,313 |
Family Income by Number of Earners in Potrero
| Number of Earners | # Families | Median Income |
| No Earners | 0 (0.0%) | $0 |
| 1 Earner | 14 (24.6%) | $0 |
| 2 Earners | 0 (0.0%) | $0 |
| 3+ Earners | 43 (75.4%) | $0 |
| Total | 57 (100.0%) | $184,313 |
Household Income in Potrero
Household Income Brackets in Potrero
With 43 households falling in the category, the $150,000 to $199,999 income range is the most frequent in Potrero, accounting for 52.4% of all households.
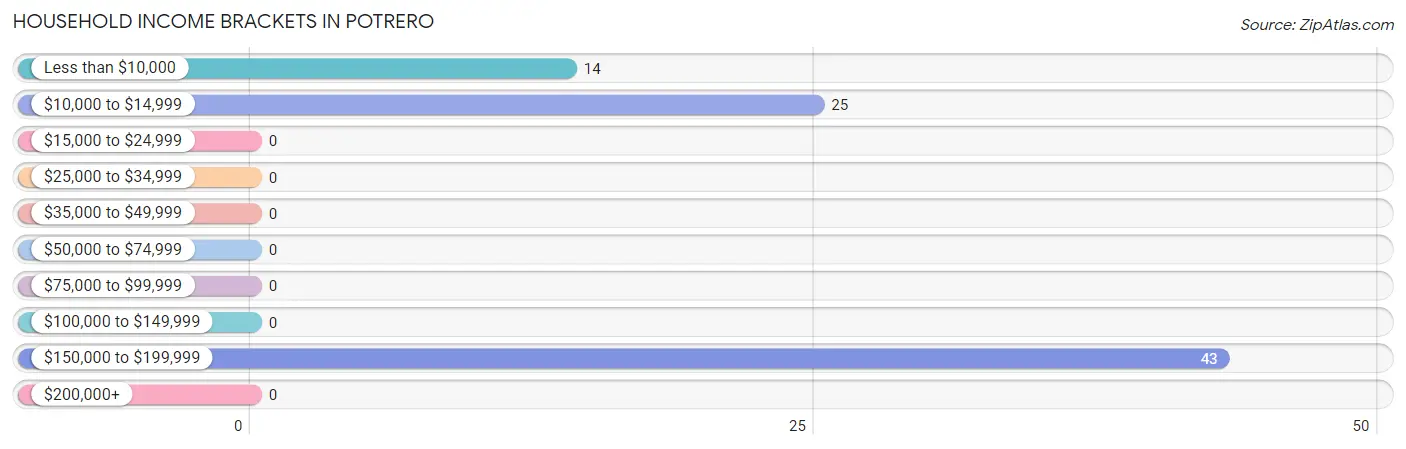
| Income Bracket | # Households | % Households |
| Less than $10,000 | 14 | 17.1% |
| $10,000 to $14,999 | 25 | 30.5% |
| $15,000 to $24,999 | 0 | 0.0% |
| $25,000 to $34,999 | 0 | 0.0% |
| $35,000 to $49,999 | 0 | 0.0% |
| $50,000 to $74,999 | 0 | 0.0% |
| $75,000 to $99,999 | 0 | 0.0% |
| $100,000 to $149,999 | 0 | 0.0% |
| $150,000 to $199,999 | 43 | 52.4% |
| $200,000+ | 0 | 0.0% |
Household Income by Householder Age in Potrero
| Income Bracket | # Households | Median Income |
| 15 to 24 Years | 0 (0.0%) | $0 |
| 25 to 44 Years | 39 (47.6%) | $0 |
| 45 to 64 Years | 23 (28.1%) | $0 |
| 65+ Years | 20 (24.4%) | $0 |
| Total | 82 (100.0%) | $0 |
Poverty in Potrero
Income Below Poverty by Sex and Age in Potrero
With 40.6% poverty level for males and 12.2% for females among the residents of Potrero, 6 to 11 year old males and 6 to 11 year old females are the most vulnerable to poverty, with 30 males (100.0%) and 15 females (40.5%) in their respective age groups living below the poverty level.
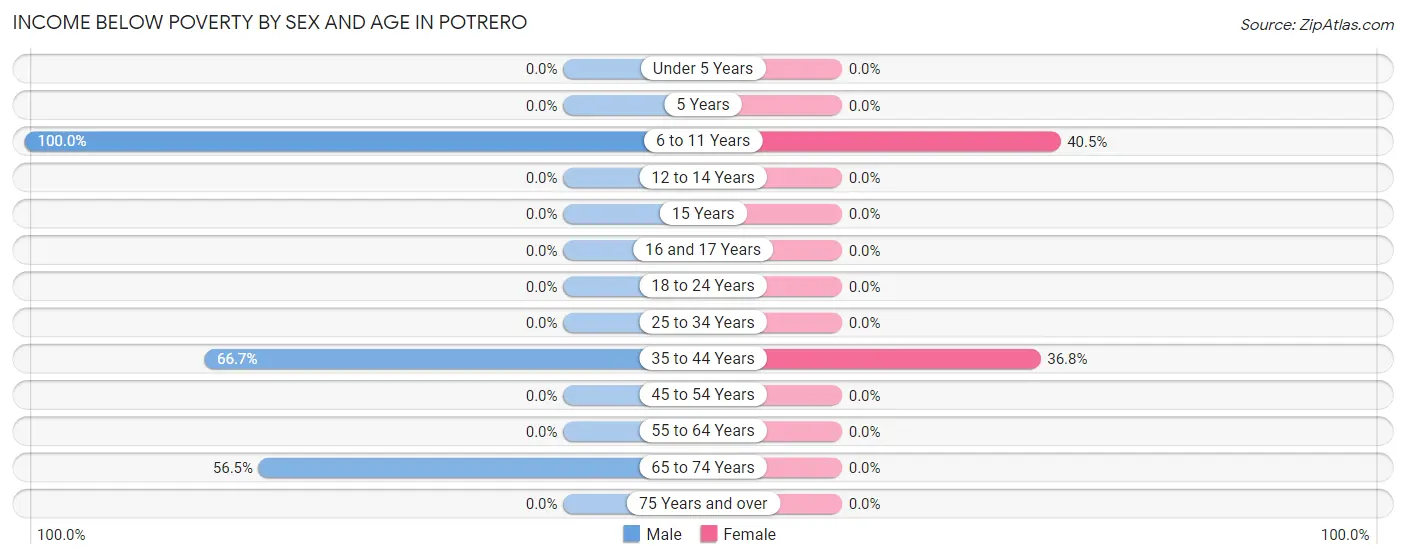
| Age Bracket | Male | Female |
| Under 5 Years | 0 (0.0%) | 0 (0.0%) |
| 5 Years | 0 (0.0%) | 0 (0.0%) |
| 6 to 11 Years | 30 (100.0%) | 15 (40.5%) |
| 12 to 14 Years | 0 (0.0%) | 0 (0.0%) |
| 15 Years | 0 (0.0%) | 0 (0.0%) |
| 16 and 17 Years | 0 (0.0%) | 0 (0.0%) |
| 18 to 24 Years | 0 (0.0%) | 0 (0.0%) |
| 25 to 34 Years | 0 (0.0%) | 0 (0.0%) |
| 35 to 44 Years | 54 (66.7%) | 14 (36.8%) |
| 45 to 54 Years | 0 (0.0%) | 0 (0.0%) |
| 55 to 64 Years | 0 (0.0%) | 0 (0.0%) |
| 65 to 74 Years | 26 (56.5%) | 0 (0.0%) |
| 75 Years and over | 0 (0.0%) | 0 (0.0%) |
| Total | 110 (40.6%) | 29 (12.2%) |
Income Above Poverty by Sex and Age in Potrero
According to the poverty statistics in Potrero, males aged under 5 years and females aged under 5 years are the age groups that are most secure financially, with 100.0% of males and 100.0% of females in these age groups living above the poverty line.
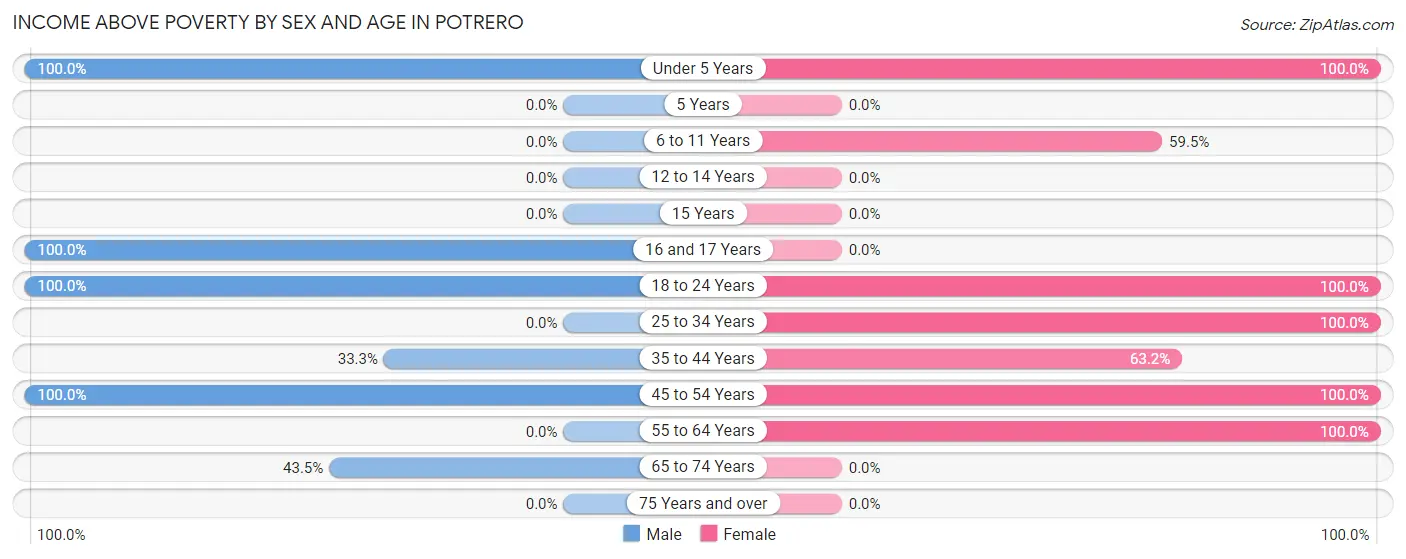
| Age Bracket | Male | Female |
| Under 5 Years | 25 (100.0%) | 27 (100.0%) |
| 5 Years | 0 (0.0%) | 0 (0.0%) |
| 6 to 11 Years | 0 (0.0%) | 22 (59.5%) |
| 12 to 14 Years | 0 (0.0%) | 0 (0.0%) |
| 15 Years | 0 (0.0%) | 0 (0.0%) |
| 16 and 17 Years | 22 (100.0%) | 0 (0.0%) |
| 18 to 24 Years | 44 (100.0%) | 73 (100.0%) |
| 25 to 34 Years | 0 (0.0%) | 24 (100.0%) |
| 35 to 44 Years | 27 (33.3%) | 24 (63.2%) |
| 45 to 54 Years | 23 (100.0%) | 20 (100.0%) |
| 55 to 64 Years | 0 (0.0%) | 19 (100.0%) |
| 65 to 74 Years | 20 (43.5%) | 0 (0.0%) |
| 75 Years and over | 0 (0.0%) | 0 (0.0%) |
| Total | 161 (59.4%) | 209 (87.8%) |
Income Below Poverty Among Married-Couple Families in Potrero
| Children | Above Poverty | Below Poverty |
| No Children | 0 (0.0%) | 0 (0.0%) |
| 1 or 2 Children | 43 (100.0%) | 0 (0.0%) |
| 3 or 4 Children | 0 (0.0%) | 0 (0.0%) |
| 5 or more Children | 0 (0.0%) | 0 (0.0%) |
| Total | 43 (100.0%) | 0 (0.0%) |
Income Below Poverty Among Single-Parent Households in Potrero
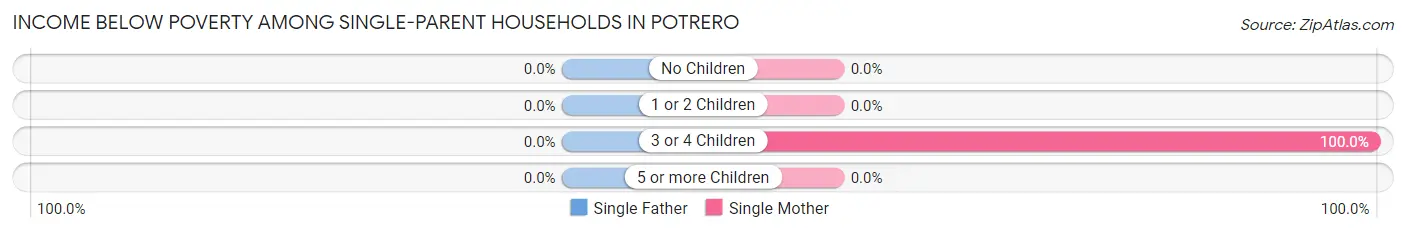
| Children | Single Father | Single Mother |
| No Children | 0 (0.0%) | 0 (0.0%) |
| 1 or 2 Children | 0 (0.0%) | 0 (0.0%) |
| 3 or 4 Children | 0 (0.0%) | 14 (100.0%) |
| 5 or more Children | 0 (0.0%) | 0 (0.0%) |
| Total | 0 (0.0%) | 14 (100.0%) |
Income Below Poverty Among Married-Couple vs Single-Parent Households in Potrero
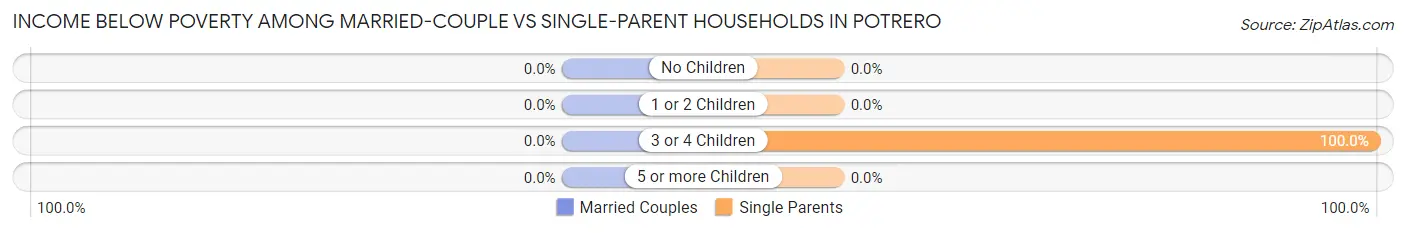
| Children | Married-Couple Families | Single-Parent Households |
| No Children | 0 (0.0%) | 0 (0.0%) |
| 1 or 2 Children | 0 (0.0%) | 0 (0.0%) |
| 3 or 4 Children | 0 (0.0%) | 14 (100.0%) |
| 5 or more Children | 0 (0.0%) | 0 (0.0%) |
| Total | 0 (0.0%) | 14 (100.0%) |
Race in Potrero
The most populous races in Potrero are Hispanic or Latino (484 | 95.1%), White / Caucasian (336 | 66.0%), and Some other Race (173 | 34.0%).
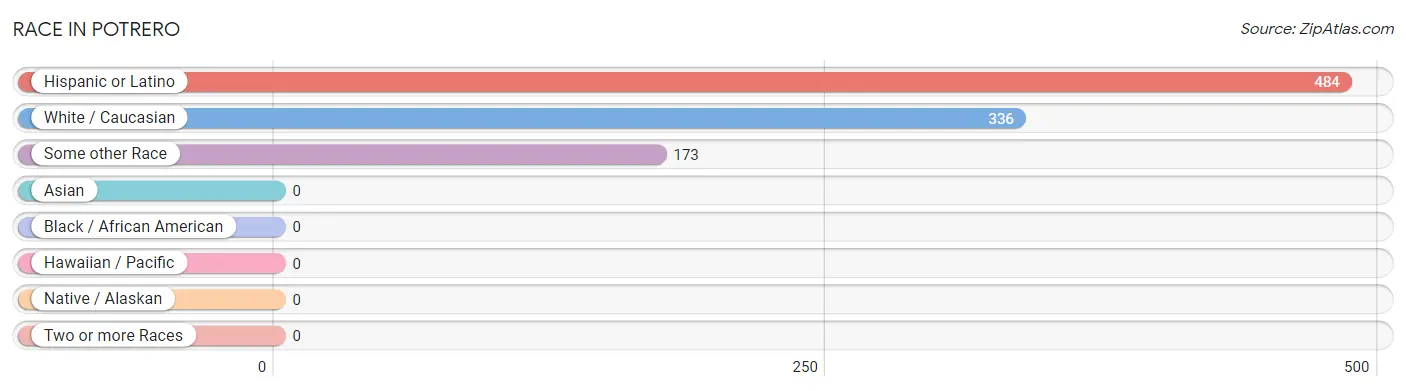
| Race | # Population | % Population |
| Asian | 0 | 0.0% |
| Black / African American | 0 | 0.0% |
| Hawaiian / Pacific | 0 | 0.0% |
| Hispanic or Latino | 484 | 95.1% |
| Native / Alaskan | 0 | 0.0% |
| White / Caucasian | 336 | 66.0% |
| Two or more Races | 0 | 0.0% |
| Some other Race | 173 | 34.0% |
| Total | 509 | 100.0% |
Ancestry in Potrero
The most populous ancestries reported in Potrero are Mexican (484 | 95.1%), Irish (52 | 10.2%), and Danish (25 | 4.9%), together accounting for 110.2% of all Potrero residents.
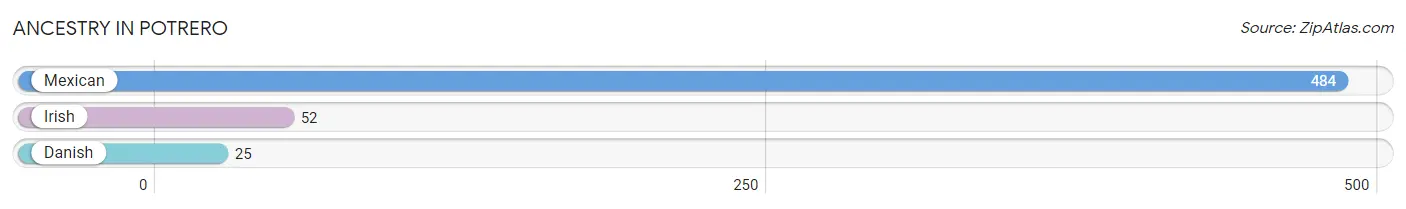
| Ancestry | # Population | % Population |
| Danish | 25 | 4.9% |
| Irish | 52 | 10.2% |
| Mexican | 484 | 95.1% | View All 3 Rows |
Immigrants in Potrero
The most numerous immigrant groups reported in Potrero came from Central America (173 | 34.0%), Latin America (173 | 34.0%), and Mexico (173 | 34.0%), together accounting for 102.0% of all Potrero residents.
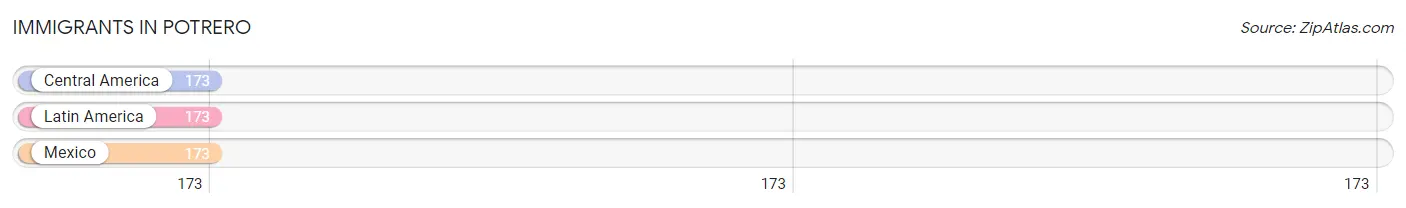
| Immigration Origin | # Population | % Population |
| Central America | 173 | 34.0% |
| Latin America | 173 | 34.0% |
| Mexico | 173 | 34.0% | View All 3 Rows |
Sex and Age in Potrero
Sex and Age in Potrero
The most populous age groups in Potrero are 40 to 44 Years (81 | 29.9%) for men and 20 to 24 Years (52 | 21.8%) for women.
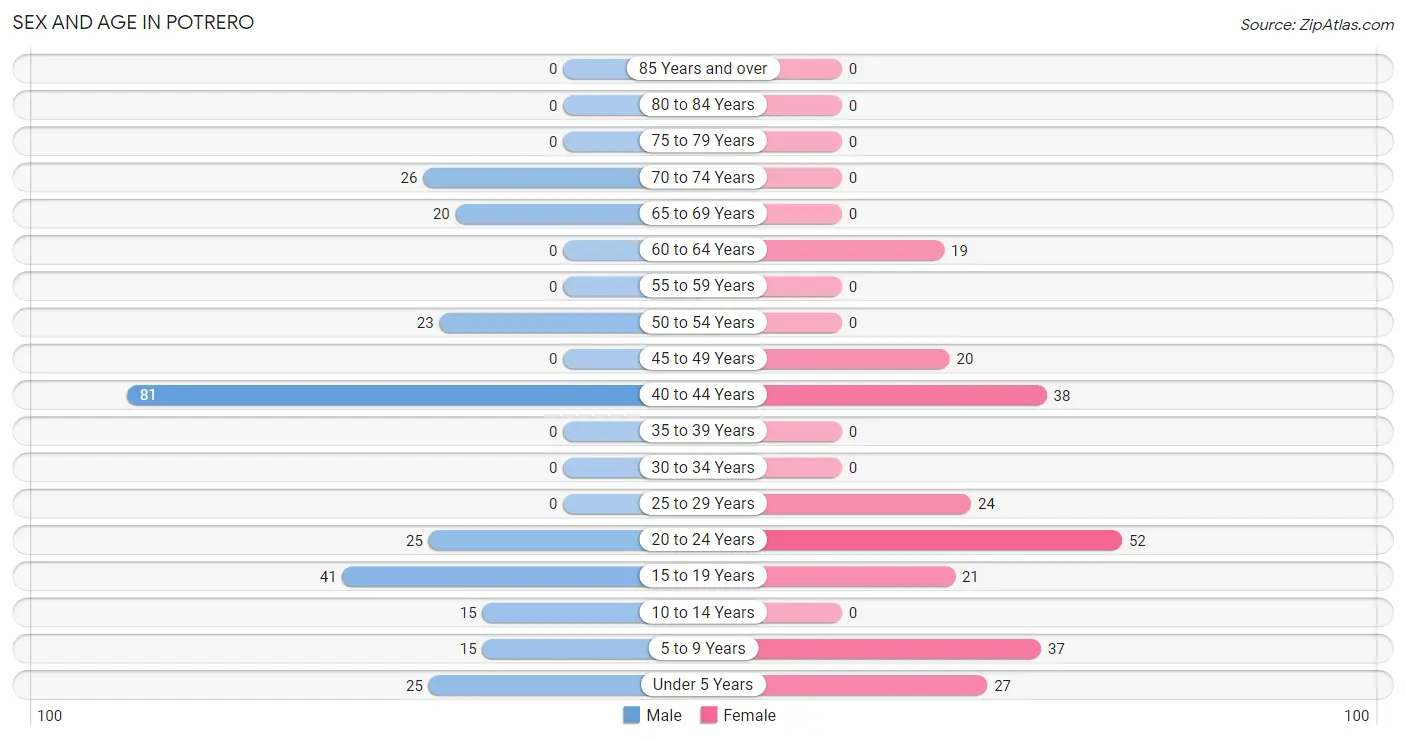
| Age Bracket | Male | Female |
| Under 5 Years | 25 (9.2%) | 27 (11.3%) |
| 5 to 9 Years | 15 (5.5%) | 37 (15.5%) |
| 10 to 14 Years | 15 (5.5%) | 0 (0.0%) |
| 15 to 19 Years | 41 (15.1%) | 21 (8.8%) |
| 20 to 24 Years | 25 (9.2%) | 52 (21.8%) |
| 25 to 29 Years | 0 (0.0%) | 24 (10.1%) |
| 30 to 34 Years | 0 (0.0%) | 0 (0.0%) |
| 35 to 39 Years | 0 (0.0%) | 0 (0.0%) |
| 40 to 44 Years | 81 (29.9%) | 38 (16.0%) |
| 45 to 49 Years | 0 (0.0%) | 20 (8.4%) |
| 50 to 54 Years | 23 (8.5%) | 0 (0.0%) |
| 55 to 59 Years | 0 (0.0%) | 0 (0.0%) |
| 60 to 64 Years | 0 (0.0%) | 19 (8.0%) |
| 65 to 69 Years | 20 (7.4%) | 0 (0.0%) |
| 70 to 74 Years | 26 (9.6%) | 0 (0.0%) |
| 75 to 79 Years | 0 (0.0%) | 0 (0.0%) |
| 80 to 84 Years | 0 (0.0%) | 0 (0.0%) |
| 85 Years and over | 0 (0.0%) | 0 (0.0%) |
| Total | 271 (100.0%) | 238 (100.0%) |
Families and Households in Potrero
Median Family Size in Potrero
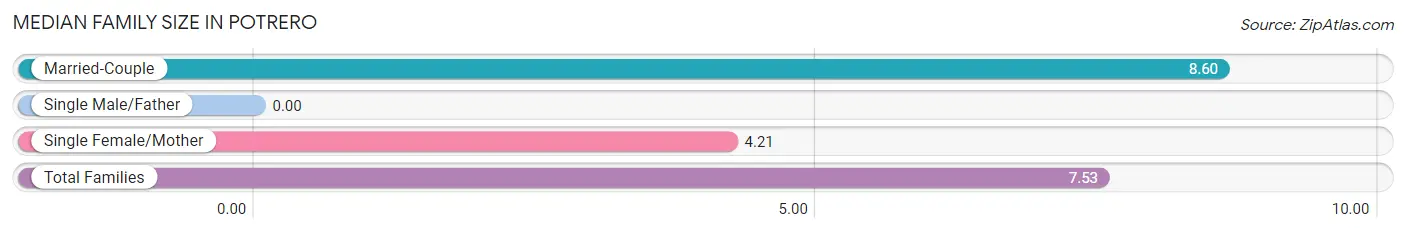
| Family Type | # Families | Family Size |
| Married-Couple | 43 (75.4%) | 8.60 |
| Single Male/Father | 0 (0.0%) | - |
| Single Female/Mother | 14 (24.6%) | 4.21 |
| Total Families | 57 (100.0%) | 7.53 |
Median Household Size in Potrero
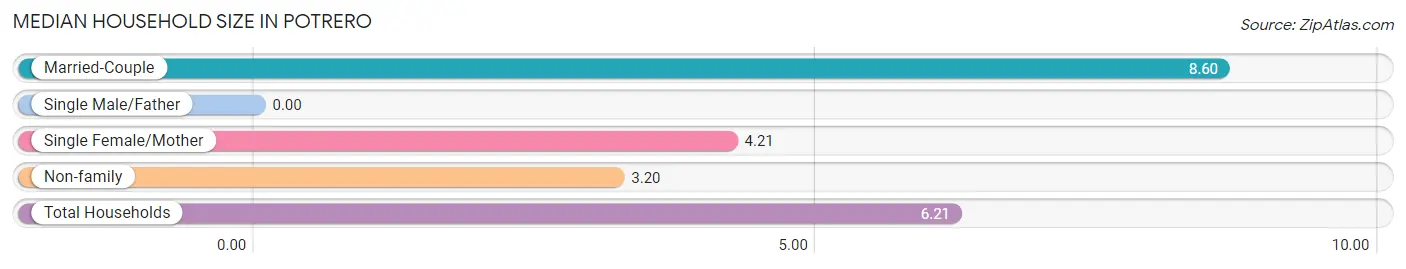
| Household Type | # Households | Household Size |
| Married-Couple | 43 (52.4%) | 8.60 |
| Single Male/Father | 0 (0.0%) | - |
| Single Female/Mother | 14 (17.1%) | 4.21 |
| Non-family | 25 (30.5%) | 3.20 |
| Total Households | 82 (100.0%) | 6.21 |
Household Size by Marriage Status in Potrero
Out of a total of 82 households in Potrero, 57 (69.5%) are family households, while 25 (30.5%) are nonfamily households. The most numerous type of family households are 7+ person households, comprising 43, and the most common type of nonfamily households are 3-person households, comprising 25.
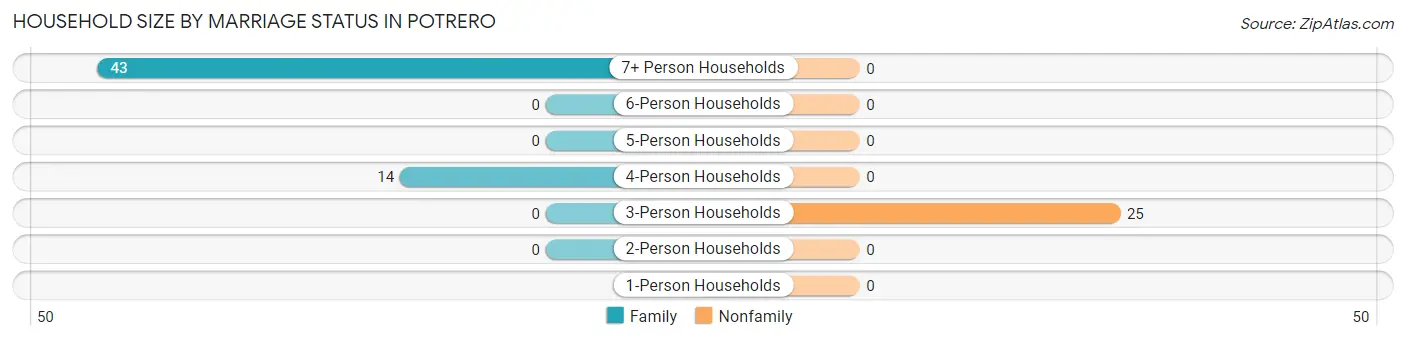
| Household Size | Family Households | Nonfamily Households |
| 1-Person Households | - | 0 (0.0%) |
| 2-Person Households | 0 (0.0%) | 0 (0.0%) |
| 3-Person Households | 0 (0.0%) | 25 (30.5%) |
| 4-Person Households | 14 (17.1%) | 0 (0.0%) |
| 5-Person Households | 0 (0.0%) | 0 (0.0%) |
| 6-Person Households | 0 (0.0%) | 0 (0.0%) |
| 7+ Person Households | 43 (52.4%) | 0 (0.0%) |
| Total | 57 (69.5%) | 25 (30.5%) |
Female Fertility in Potrero
Fertility by Age in Potrero
| Age Bracket | Women with Births | Births / 1,000 Women |
| 15 to 19 years | 0 (0.0%) | 0.0 |
| 20 to 34 years | 0 (0.0%) | 0.0 |
| 35 to 50 years | 0 (0.0%) | 0.0 |
| Total | 0 (0.0%) | 0.0 |
Fertility by Age by Marriage Status in Potrero
| Age Bracket | Married | Unmarried |
| 15 to 19 years | 0 (0.0%) | 0 (0.0%) |
| 20 to 34 years | 0 (0.0%) | 0 (0.0%) |
| 35 to 50 years | 0 (0.0%) | 0 (0.0%) |
| Total | 0 (0.0%) | 0 (0.0%) |
Fertility by Education in Potrero
| Educational Attainment | Women with Births | Births / 1,000 Women |
| Less than High School | 0 (0.0%) | 0.0 |
| High School Diploma | 0 (0.0%) | 0.0 |
| College or Associate's Degree | 0 (0.0%) | 0.0 |
| Bachelor's Degree | 0 (0.0%) | 0.0 |
| Graduate Degree | 0 (0.0%) | 0.0 |
| Total | 0 (0.0%) | 0.0 |
Fertility by Education by Marriage Status in Potrero
| Educational Attainment | Married | Unmarried |
| Less than High School | 0 (0.0%) | 0 (0.0%) |
| High School Diploma | 0 (0.0%) | 0 (0.0%) |
| College or Associate's Degree | 0 (0.0%) | 0 (0.0%) |
| Bachelor's Degree | 0 (0.0%) | 0 (0.0%) |
| Graduate Degree | 0 (0.0%) | 0 (0.0%) |
| Total | 0 (0.0%) | 0 (0.0%) |
Employment Characteristics in Potrero
Employment by Class of Employer in Potrero
Among the 190 employed individuals in Potrero, private company employees (164 | 86.3%), and local government employees (26 | 13.7%) make up the most common classes of employment.
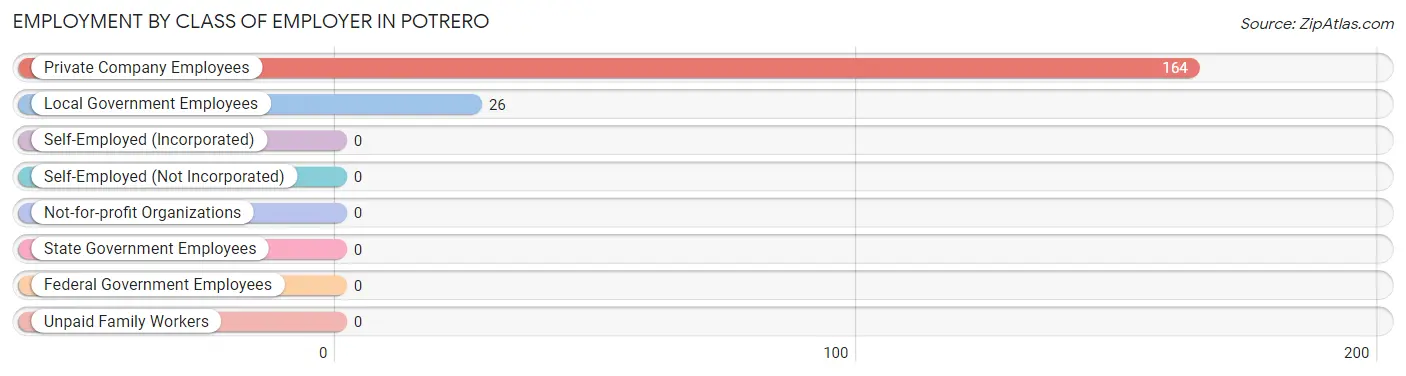
| Employer Class | # Employees | % Employees |
| Private Company Employees | 164 | 86.3% |
| Self-Employed (Incorporated) | 0 | 0.0% |
| Self-Employed (Not Incorporated) | 0 | 0.0% |
| Not-for-profit Organizations | 0 | 0.0% |
| Local Government Employees | 26 | 13.7% |
| State Government Employees | 0 | 0.0% |
| Federal Government Employees | 0 | 0.0% |
| Unpaid Family Workers | 0 | 0.0% |
| Total | 190 | 100.0% |
Employment Status by Age in Potrero
According to the labor force statistics for Potrero, out of the total population over 16 years of age (390), 59.2% or 231 individuals are in the labor force, with 9.1% or 21 of them unemployed. The age group with the highest labor force participation rate is 20 to 24 years, with 100.0% or 77 individuals in the labor force. Within the labor force, the 16 to 19 years age range has the highest percentage of unemployed individuals, with 100.0% or 21 of them being unemployed.
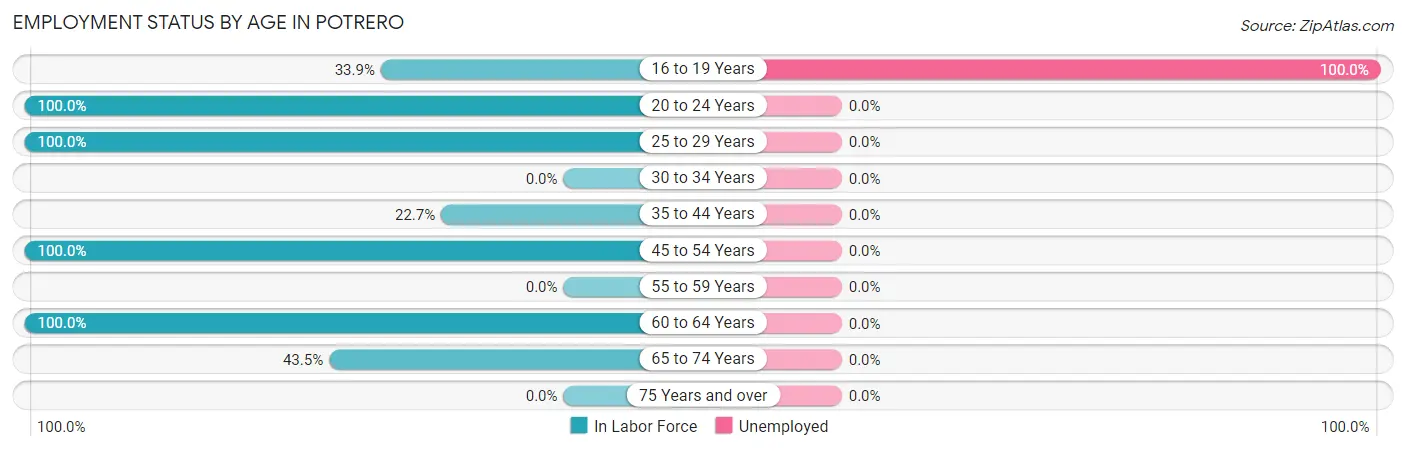
| Age Bracket | In Labor Force | Unemployed |
| 16 to 19 Years | 21 (33.9%) | 21 (100.0%) |
| 20 to 24 Years | 77 (100.0%) | 0 (0.0%) |
| 25 to 29 Years | 24 (100.0%) | 0 (0.0%) |
| 30 to 34 Years | 0 (0.0%) | 0 (0.0%) |
| 35 to 44 Years | 27 (22.7%) | 0 (0.0%) |
| 45 to 54 Years | 43 (100.0%) | 0 (0.0%) |
| 55 to 59 Years | 0 (0.0%) | 0 (0.0%) |
| 60 to 64 Years | 19 (100.0%) | 0 (0.0%) |
| 65 to 74 Years | 20 (43.5%) | 0 (0.0%) |
| 75 Years and over | 0 (0.0%) | 0 (0.0%) |
| Total | 231 (59.2%) | 21 (9.1%) |
Employment Status by Educational Attainment in Potrero
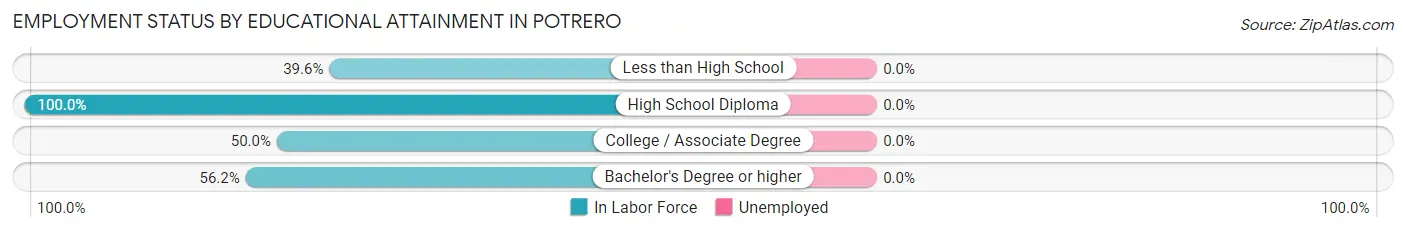
| Educational Attainment | In Labor Force | Unemployed |
| Less than High School | 19 (39.6%) | 0 (0.0%) |
| High School Diploma | 20 (100.0%) | 0 (0.0%) |
| College / Associate Degree | 24 (50.0%) | 0 (0.0%) |
| Bachelor's Degree or higher | 50 (56.2%) | 0 (0.0%) |
| Total | 113 (55.1%) | 0 (0.0%) |
Employment Occupations by Sex in Potrero
Management, Business, Science and Arts Occupations
The most common Management, Business, Science and Arts occupations in Potrero are Community & Social Service (46 | 21.9%), and Education Instruction & Library (46 | 21.9%).
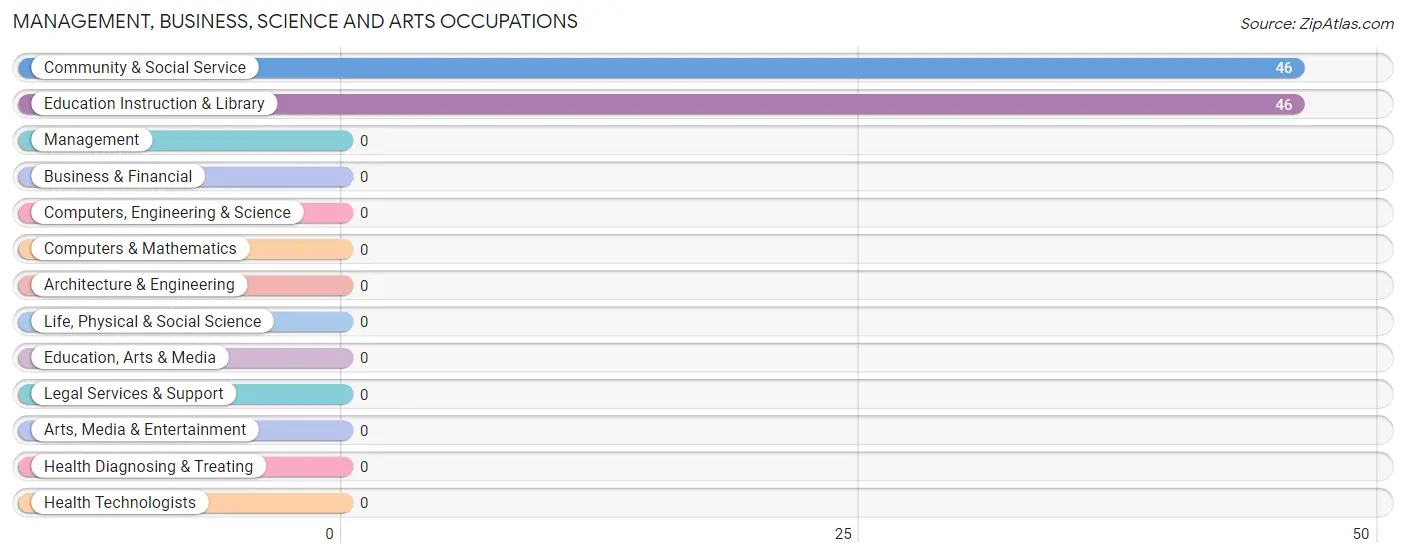
Management, Business, Science and Arts Occupations by Sex
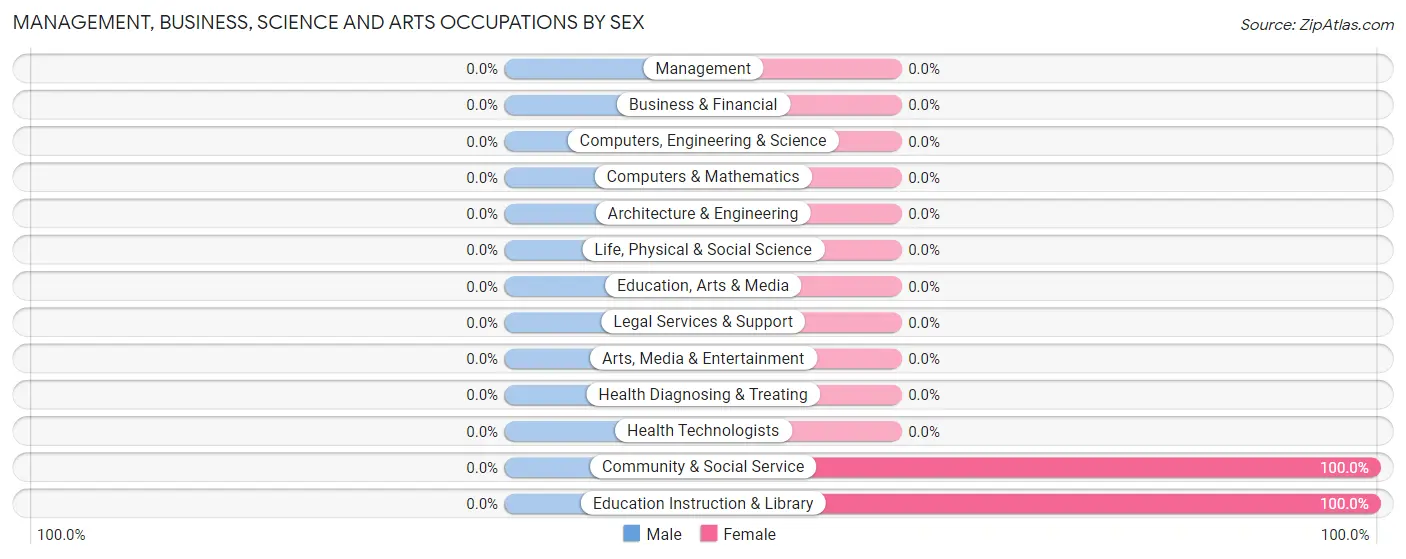
| Occupation | Male | Female |
| Management | 0 (0.0%) | 0 (0.0%) |
| Business & Financial | 0 (0.0%) | 0 (0.0%) |
| Computers, Engineering & Science | 0 (0.0%) | 0 (0.0%) |
| Computers & Mathematics | 0 (0.0%) | 0 (0.0%) |
| Architecture & Engineering | 0 (0.0%) | 0 (0.0%) |
| Life, Physical & Social Science | 0 (0.0%) | 0 (0.0%) |
| Community & Social Service | 0 (0.0%) | 46 (100.0%) |
| Education, Arts & Media | 0 (0.0%) | 0 (0.0%) |
| Legal Services & Support | 0 (0.0%) | 0 (0.0%) |
| Education Instruction & Library | 0 (0.0%) | 46 (100.0%) |
| Arts, Media & Entertainment | 0 (0.0%) | 0 (0.0%) |
| Health Diagnosing & Treating | 0 (0.0%) | 0 (0.0%) |
| Health Technologists | 0 (0.0%) | 0 (0.0%) |
| Total (Category) | 0 (0.0%) | 46 (100.0%) |
| Total (Overall) | 95 (45.2%) | 115 (54.8%) |
Services Occupations
The most common Services occupations in Potrero are , and Healthcare Support (24 | 11.4%).
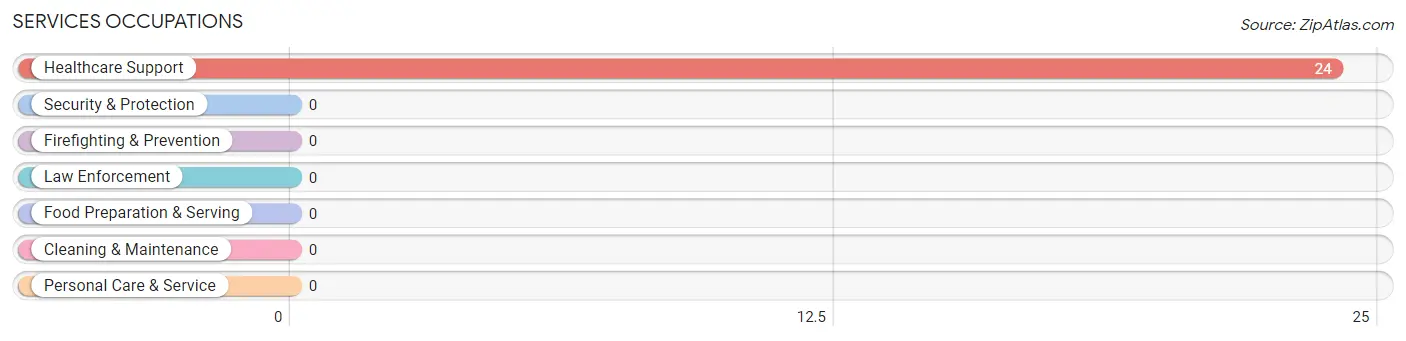
Services Occupations by Sex
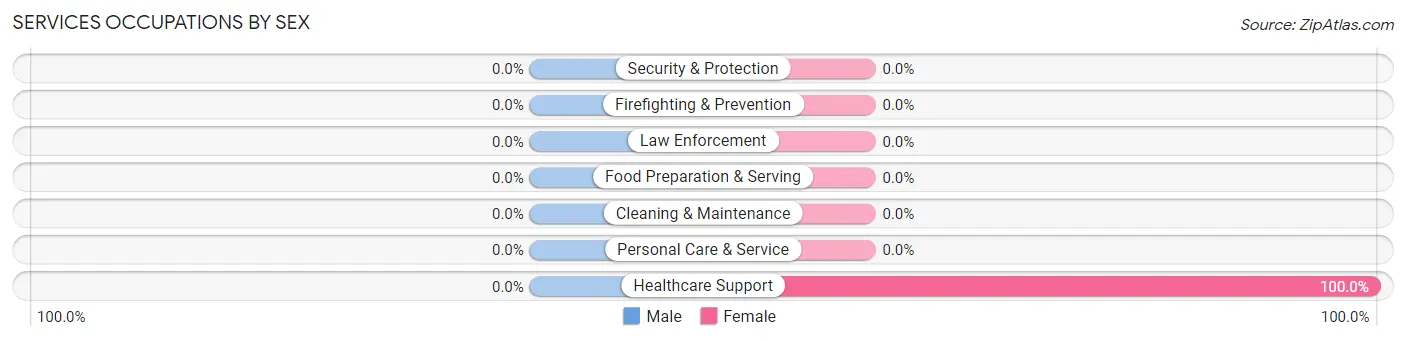
| Occupation | Male | Female |
| Healthcare Support | 0 (0.0%) | 24 (100.0%) |
| Security & Protection | 0 (0.0%) | 0 (0.0%) |
| Firefighting & Prevention | 0 (0.0%) | 0 (0.0%) |
| Law Enforcement | 0 (0.0%) | 0 (0.0%) |
| Food Preparation & Serving | 0 (0.0%) | 0 (0.0%) |
| Cleaning & Maintenance | 0 (0.0%) | 0 (0.0%) |
| Personal Care & Service | 0 (0.0%) | 0 (0.0%) |
| Total (Category) | 0 (0.0%) | 24 (100.0%) |
| Total (Overall) | 95 (45.2%) | 115 (54.8%) |
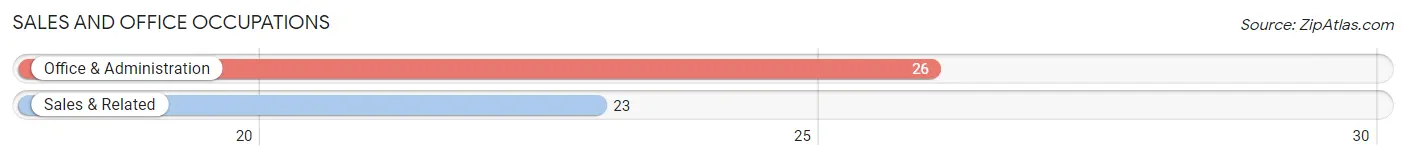
Sales and Office Occupations
The most common Sales and Office occupations in Potrero are Office & Administration (26 | 12.4%), and Sales & Related (23 | 11.0%).
Sales and Office Occupations by Sex

| Occupation | Male | Female |
| Sales & Related | 23 (100.0%) | 0 (0.0%) |
| Office & Administration | 0 (0.0%) | 26 (100.0%) |
| Total (Category) | 23 (46.9%) | 26 (53.1%) |
| Total (Overall) | 95 (45.2%) | 115 (54.8%) |
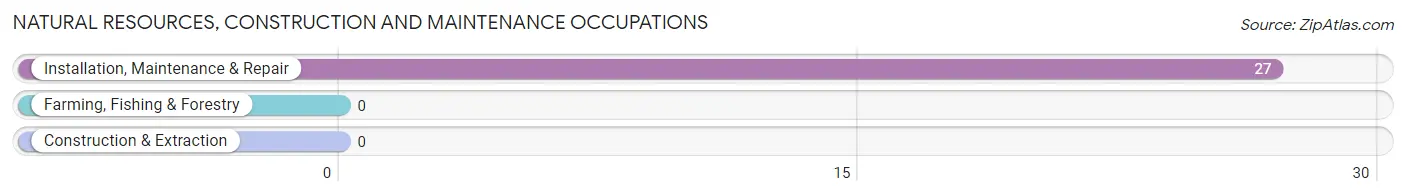
Natural Resources, Construction and Maintenance Occupations
The most common Natural Resources, Construction and Maintenance occupations in Potrero are , and Installation, Maintenance & Repair (27 | 12.9%).
Natural Resources, Construction and Maintenance Occupations by Sex
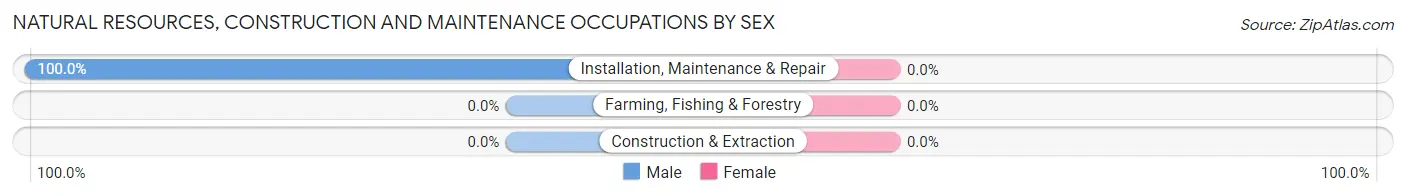
| Occupation | Male | Female |
| Farming, Fishing & Forestry | 0 (0.0%) | 0 (0.0%) |
| Construction & Extraction | 0 (0.0%) | 0 (0.0%) |
| Installation, Maintenance & Repair | 27 (100.0%) | 0 (0.0%) |
| Total (Category) | 27 (100.0%) | 0 (0.0%) |
| Total (Overall) | 95 (45.2%) | 115 (54.8%) |
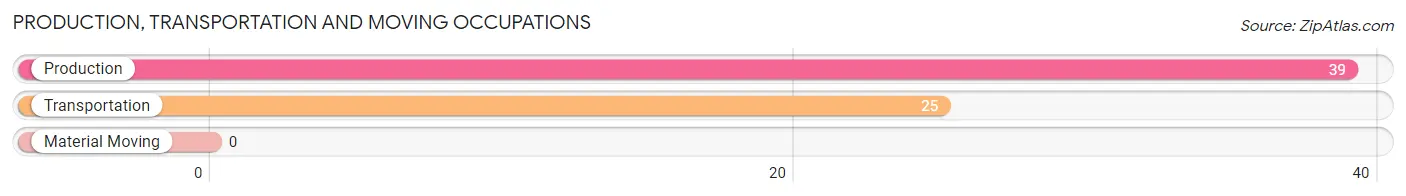
Production, Transportation and Moving Occupations
The most common Production, Transportation and Moving occupations in Potrero are Production (39 | 18.6%), and Transportation (25 | 11.9%).
Production, Transportation and Moving Occupations by Sex
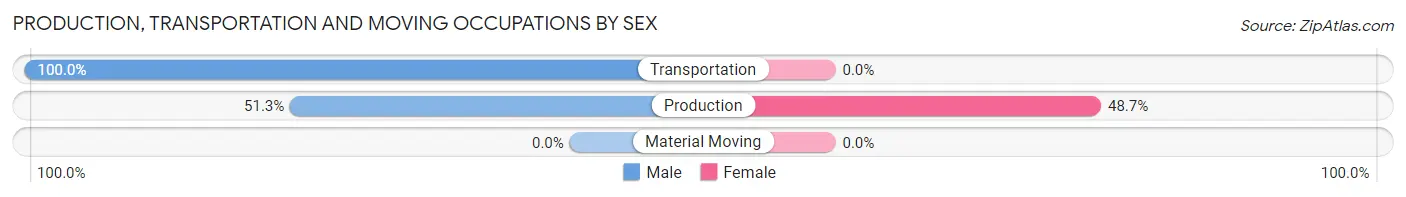
| Occupation | Male | Female |
| Production | 20 (51.3%) | 19 (48.7%) |
| Transportation | 25 (100.0%) | 0 (0.0%) |
| Material Moving | 0 (0.0%) | 0 (0.0%) |
| Total (Category) | 45 (70.3%) | 19 (29.7%) |
| Total (Overall) | 95 (45.2%) | 115 (54.8%) |
Employment Industries by Sex in Potrero
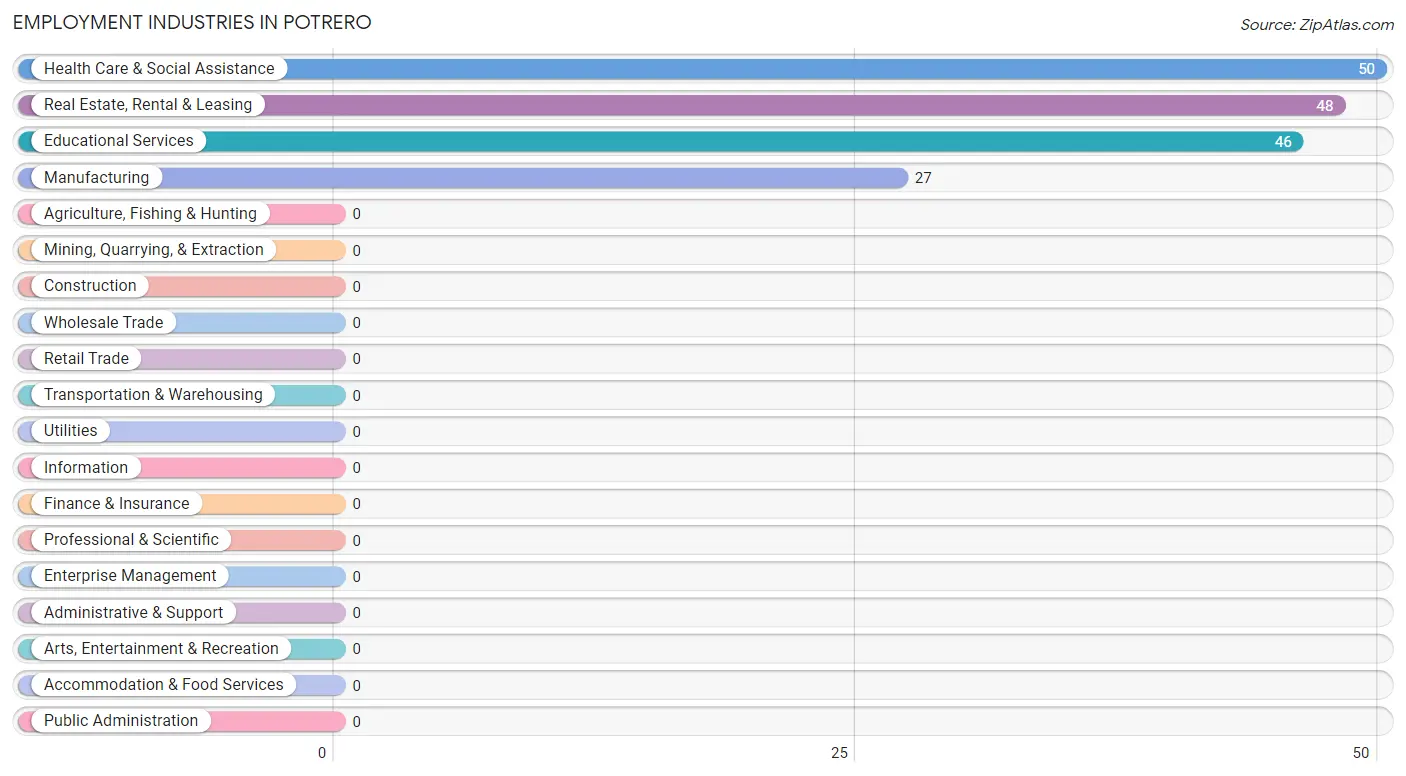
Employment Industries in Potrero
The major employment industries in Potrero include Health Care & Social Assistance (50 | 23.8%), Real Estate, Rental & Leasing (48 | 22.9%), Educational Services (46 | 21.9%), and Manufacturing (27 | 12.9%).
Employment Industries by Sex in Potrero
The Potrero industries that see more men than women are Manufacturing (100.0%), and Real Estate, Rental & Leasing (100.0%), whereas the industries that tend to have a higher number of women are Educational Services (100.0%), and Health Care & Social Assistance (100.0%).
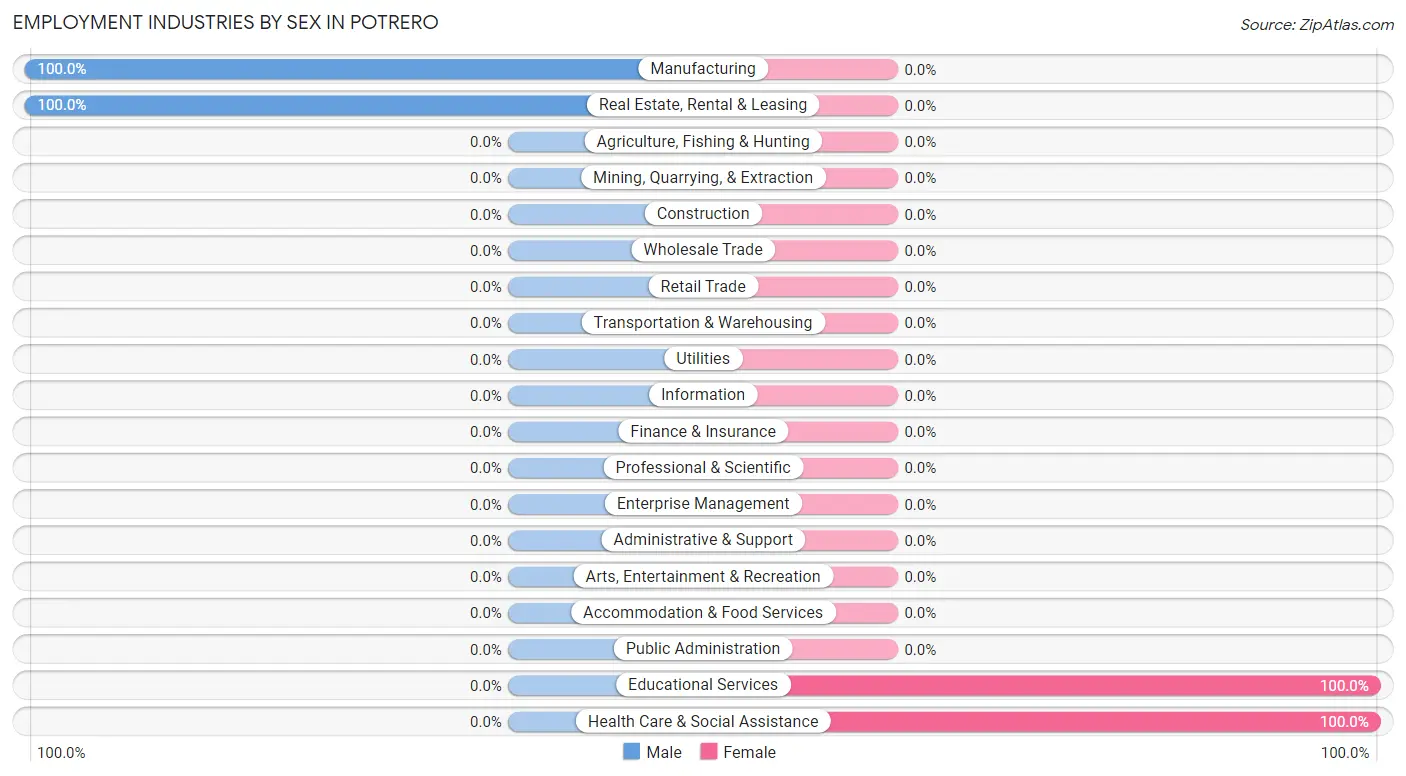
| Industry | Male | Female |
| Agriculture, Fishing & Hunting | 0 (0.0%) | 0 (0.0%) |
| Mining, Quarrying, & Extraction | 0 (0.0%) | 0 (0.0%) |
| Construction | 0 (0.0%) | 0 (0.0%) |
| Manufacturing | 27 (100.0%) | 0 (0.0%) |
| Wholesale Trade | 0 (0.0%) | 0 (0.0%) |
| Retail Trade | 0 (0.0%) | 0 (0.0%) |
| Transportation & Warehousing | 0 (0.0%) | 0 (0.0%) |
| Utilities | 0 (0.0%) | 0 (0.0%) |
| Information | 0 (0.0%) | 0 (0.0%) |
| Finance & Insurance | 0 (0.0%) | 0 (0.0%) |
| Real Estate, Rental & Leasing | 48 (100.0%) | 0 (0.0%) |
| Professional & Scientific | 0 (0.0%) | 0 (0.0%) |
| Enterprise Management | 0 (0.0%) | 0 (0.0%) |
| Administrative & Support | 0 (0.0%) | 0 (0.0%) |
| Educational Services | 0 (0.0%) | 46 (100.0%) |
| Health Care & Social Assistance | 0 (0.0%) | 50 (100.0%) |
| Arts, Entertainment & Recreation | 0 (0.0%) | 0 (0.0%) |
| Accommodation & Food Services | 0 (0.0%) | 0 (0.0%) |
| Public Administration | 0 (0.0%) | 0 (0.0%) |
| Total | 95 (45.2%) | 115 (54.8%) |
Education in Potrero
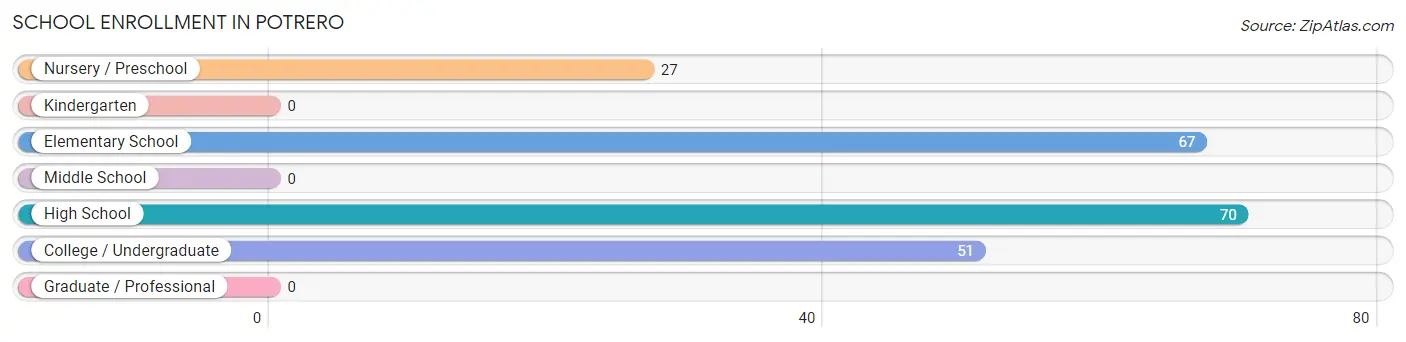
School Enrollment in Potrero
The most common levels of schooling among the 215 students in Potrero are high school (70 | 32.6%), elementary school (67 | 31.2%), and college / undergraduate (51 | 23.7%).
| School Level | # Students | % Students |
| Nursery / Preschool | 27 | 12.6% |
| Kindergarten | 0 | 0.0% |
| Elementary School | 67 | 31.2% |
| Middle School | 0 | 0.0% |
| High School | 70 | 32.6% |
| College / Undergraduate | 51 | 23.7% |
| Graduate / Professional | 0 | 0.0% |
| Total | 215 | 100.0% |
School Enrollment by Age by Funding Source in Potrero
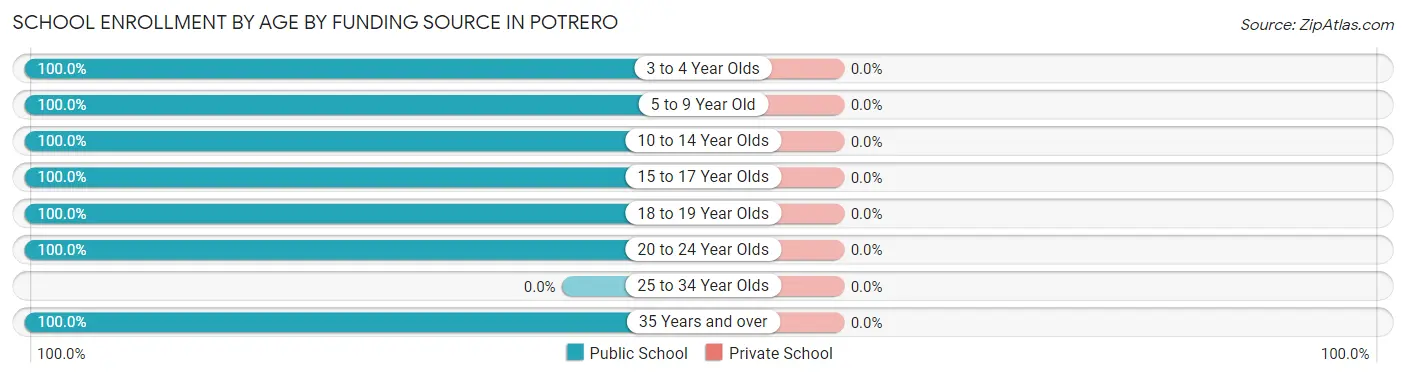
| Age Bracket | Public School | Private School |
| 3 to 4 Year Olds | 27 (100.0%) | 0 (0.0%) |
| 5 to 9 Year Old | 52 (100.0%) | 0 (0.0%) |
| 10 to 14 Year Olds | 15 (100.0%) | 0 (0.0%) |
| 15 to 17 Year Olds | 22 (100.0%) | 0 (0.0%) |
| 18 to 19 Year Olds | 19 (100.0%) | 0 (0.0%) |
| 20 to 24 Year Olds | 26 (100.0%) | 0 (0.0%) |
| 25 to 34 Year Olds | 0 (0.0%) | 0 (0.0%) |
| 35 Years and over | 54 (100.0%) | 0 (0.0%) |
| Total | 215 (100.0%) | 0 (0.0%) |
Educational Attainment by Field of Study in Potrero
Engineering (50 | 56.2%), computers & mathematics (25 | 28.1%), and education (14 | 15.7%) are the most common fields of study among 89 individuals in Potrero who have obtained a bachelor's degree or higher.
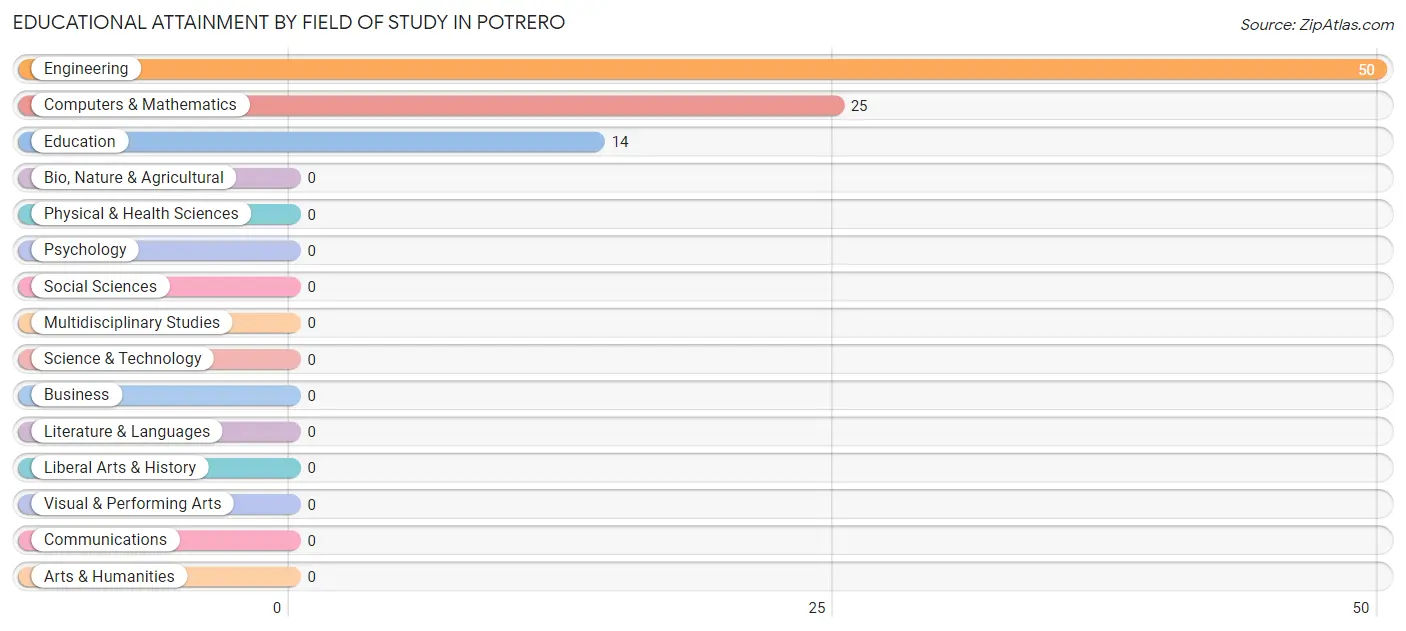
| Field of Study | # Graduates | % Graduates |
| Computers & Mathematics | 25 | 28.1% |
| Bio, Nature & Agricultural | 0 | 0.0% |
| Physical & Health Sciences | 0 | 0.0% |
| Psychology | 0 | 0.0% |
| Social Sciences | 0 | 0.0% |
| Engineering | 50 | 56.2% |
| Multidisciplinary Studies | 0 | 0.0% |
| Science & Technology | 0 | 0.0% |
| Business | 0 | 0.0% |
| Education | 14 | 15.7% |
| Literature & Languages | 0 | 0.0% |
| Liberal Arts & History | 0 | 0.0% |
| Visual & Performing Arts | 0 | 0.0% |
| Communications | 0 | 0.0% |
| Arts & Humanities | 0 | 0.0% |
| Total | 89 | 100.0% |
Transportation & Commute in Potrero
Vehicle Availability by Sex in Potrero
The most prevalent vehicle ownership categories in Potrero are males with 4 vehicles (95, accounting for 100.0%) and females with 4 vehicles (95, making up 100.0%).
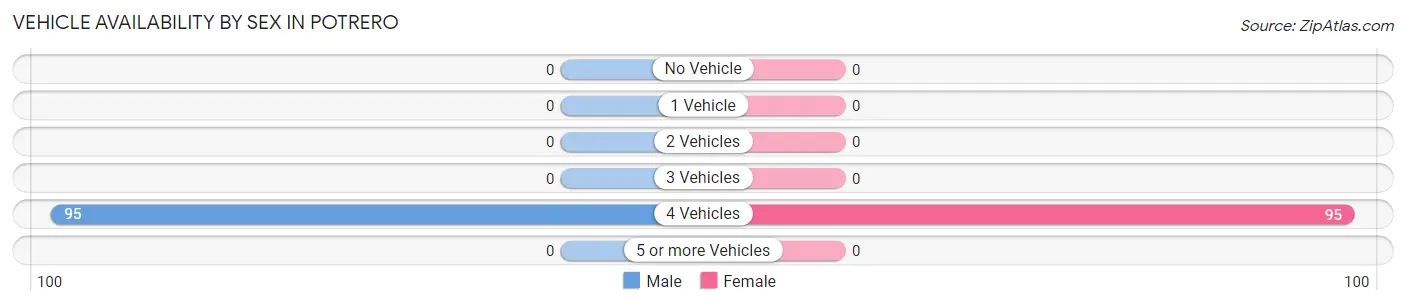
| Vehicles Available | Male | Female |
| No Vehicle | 0 (0.0%) | 0 (0.0%) |
| 1 Vehicle | 0 (0.0%) | 0 (0.0%) |
| 2 Vehicles | 0 (0.0%) | 0 (0.0%) |
| 3 Vehicles | 0 (0.0%) | 0 (0.0%) |
| 4 Vehicles | 95 (100.0%) | 95 (100.0%) |
| 5 or more Vehicles | 0 (0.0%) | 0 (0.0%) |
| Total | 95 (100.0%) | 95 (100.0%) |
Commute Time in Potrero
The most frequently occuring commute durations in Potrero are 40 to 44 minutes (76 commuters, 40.0%), 60 to 89 minutes (48 commuters, 25.3%), and 45 to 59 minutes (39 commuters, 20.5%).
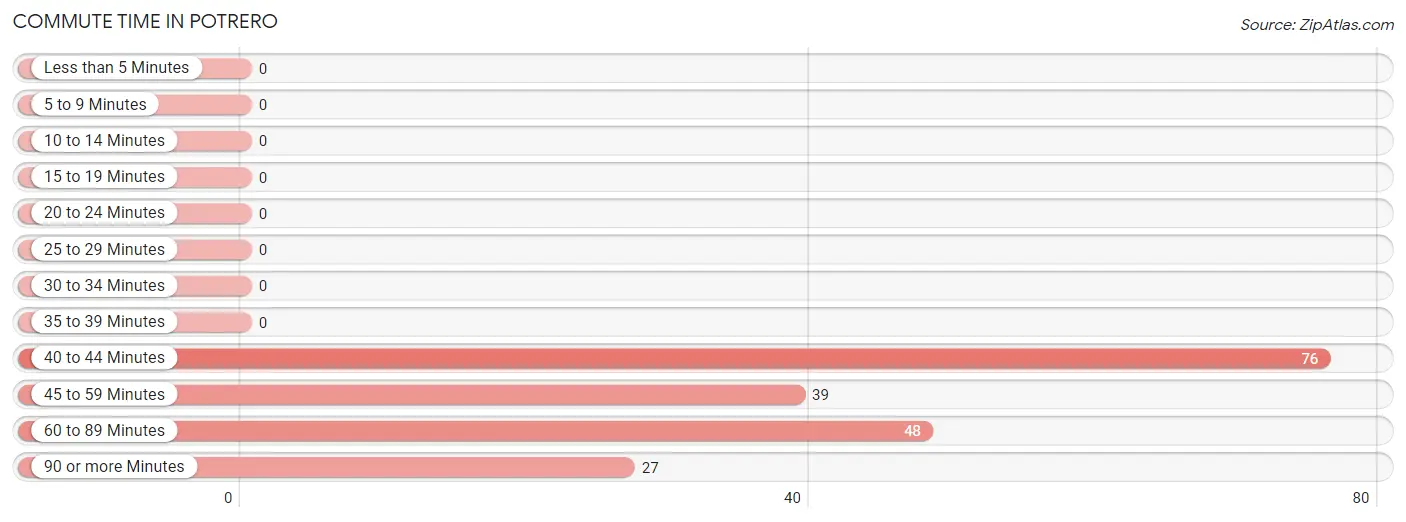
| Commute Time | # Commuters | % Commuters |
| Less than 5 Minutes | 0 | 0.0% |
| 5 to 9 Minutes | 0 | 0.0% |
| 10 to 14 Minutes | 0 | 0.0% |
| 15 to 19 Minutes | 0 | 0.0% |
| 20 to 24 Minutes | 0 | 0.0% |
| 25 to 29 Minutes | 0 | 0.0% |
| 30 to 34 Minutes | 0 | 0.0% |
| 35 to 39 Minutes | 0 | 0.0% |
| 40 to 44 Minutes | 76 | 40.0% |
| 45 to 59 Minutes | 39 | 20.5% |
| 60 to 89 Minutes | 48 | 25.3% |
| 90 or more Minutes | 27 | 14.2% |
Commute Time by Sex in Potrero
The most common commute times in Potrero are 60 to 89 minutes (48 commuters, 50.5%) for males and 40 to 44 minutes (76 commuters, 80.0%) for females.
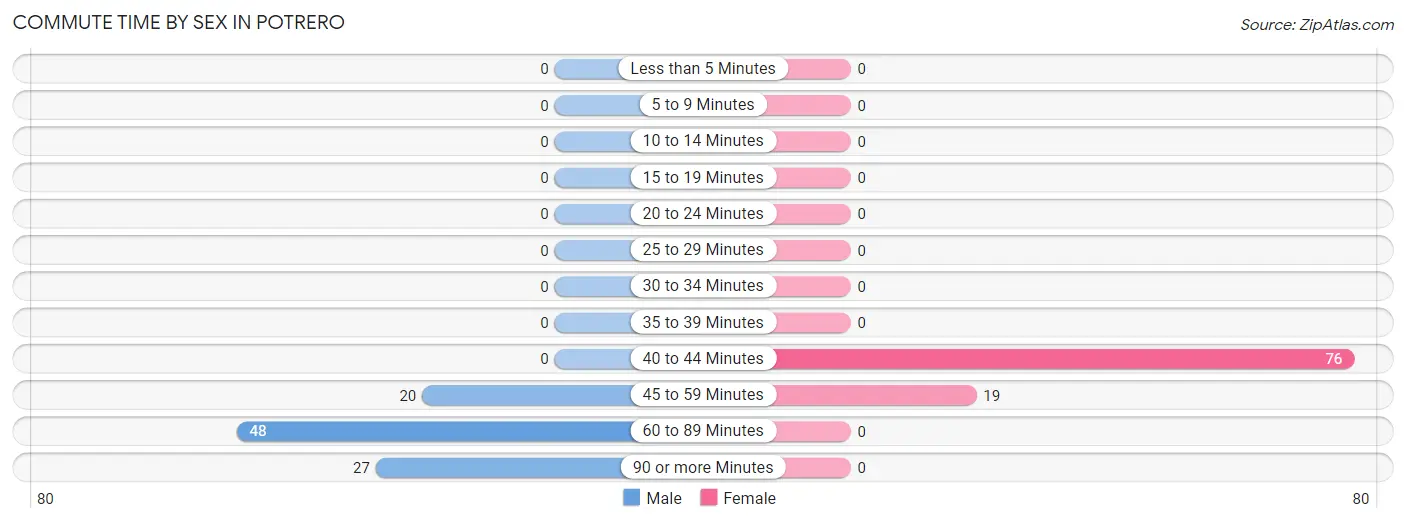
| Commute Time | Male | Female |
| Less than 5 Minutes | 0 (0.0%) | 0 (0.0%) |
| 5 to 9 Minutes | 0 (0.0%) | 0 (0.0%) |
| 10 to 14 Minutes | 0 (0.0%) | 0 (0.0%) |
| 15 to 19 Minutes | 0 (0.0%) | 0 (0.0%) |
| 20 to 24 Minutes | 0 (0.0%) | 0 (0.0%) |
| 25 to 29 Minutes | 0 (0.0%) | 0 (0.0%) |
| 30 to 34 Minutes | 0 (0.0%) | 0 (0.0%) |
| 35 to 39 Minutes | 0 (0.0%) | 0 (0.0%) |
| 40 to 44 Minutes | 0 (0.0%) | 76 (80.0%) |
| 45 to 59 Minutes | 20 (21.0%) | 19 (20.0%) |
| 60 to 89 Minutes | 48 (50.5%) | 0 (0.0%) |
| 90 or more Minutes | 27 (28.4%) | 0 (0.0%) |
Time of Departure to Work by Sex in Potrero
The most frequent times of departure to work in Potrero are 12:00 PM to 3:59 PM (27, 28.4%) for males and 6:00 AM to 6:29 AM (26, 27.4%) for females.
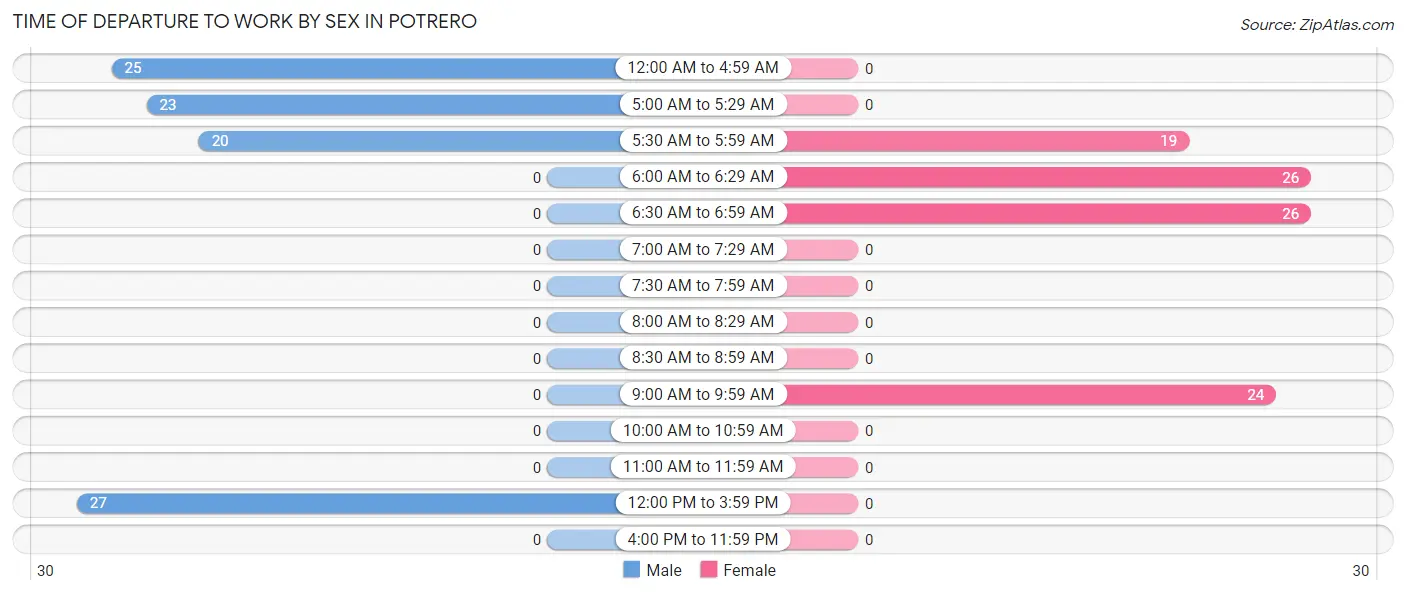
| Time of Departure | Male | Female |
| 12:00 AM to 4:59 AM | 25 (26.3%) | 0 (0.0%) |
| 5:00 AM to 5:29 AM | 23 (24.2%) | 0 (0.0%) |
| 5:30 AM to 5:59 AM | 20 (21.0%) | 19 (20.0%) |
| 6:00 AM to 6:29 AM | 0 (0.0%) | 26 (27.4%) |
| 6:30 AM to 6:59 AM | 0 (0.0%) | 26 (27.4%) |
| 7:00 AM to 7:29 AM | 0 (0.0%) | 0 (0.0%) |
| 7:30 AM to 7:59 AM | 0 (0.0%) | 0 (0.0%) |
| 8:00 AM to 8:29 AM | 0 (0.0%) | 0 (0.0%) |
| 8:30 AM to 8:59 AM | 0 (0.0%) | 0 (0.0%) |
| 9:00 AM to 9:59 AM | 0 (0.0%) | 24 (25.3%) |
| 10:00 AM to 10:59 AM | 0 (0.0%) | 0 (0.0%) |
| 11:00 AM to 11:59 AM | 0 (0.0%) | 0 (0.0%) |
| 12:00 PM to 3:59 PM | 27 (28.4%) | 0 (0.0%) |
| 4:00 PM to 11:59 PM | 0 (0.0%) | 0 (0.0%) |
| Total | 95 (100.0%) | 95 (100.0%) |
Housing Occupancy in Potrero
Occupancy by Ownership in Potrero
Of the total 82 dwellings in Potrero, owner-occupied units account for 57 (69.5%), while renter-occupied units make up 25 (30.5%).
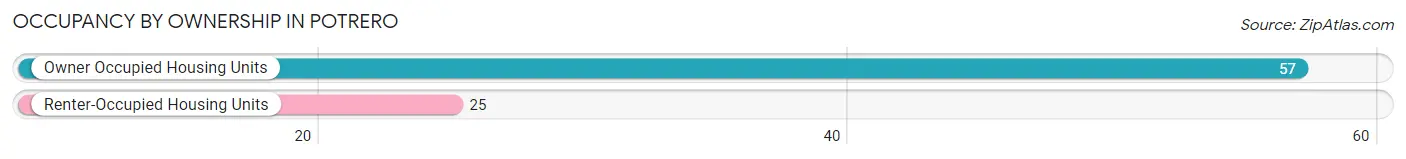
| Occupancy | # Housing Units | % Housing Units |
| Owner Occupied Housing Units | 57 | 69.5% |
| Renter-Occupied Housing Units | 25 | 30.5% |
| Total Occupied Housing Units | 82 | 100.0% |
Occupancy by Household Size in Potrero
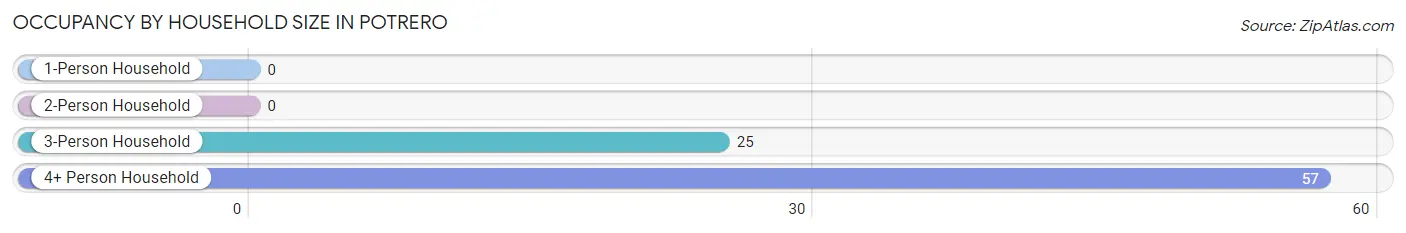
| Household Size | # Housing Units | % Housing Units |
| 1-Person Household | 0 | 0.0% |
| 2-Person Household | 0 | 0.0% |
| 3-Person Household | 25 | 30.5% |
| 4+ Person Household | 57 | 69.5% |
| Total Housing Units | 82 | 100.0% |
Occupancy by Ownership by Household Size in Potrero
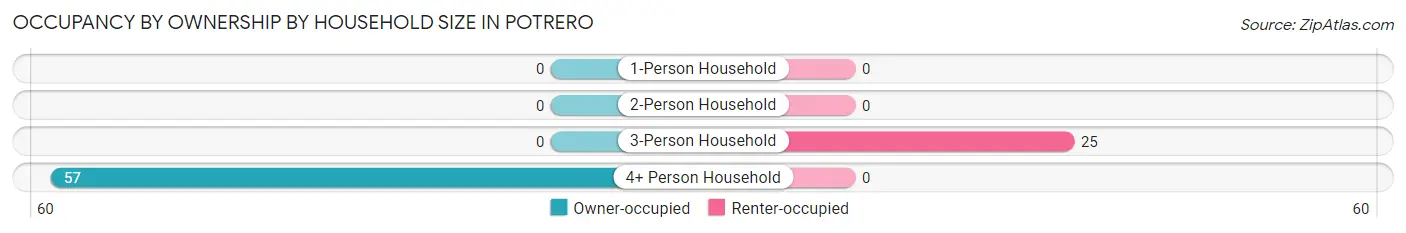
| Household Size | Owner-occupied | Renter-occupied |
| 1-Person Household | 0 (0.0%) | 0 (0.0%) |
| 2-Person Household | 0 (0.0%) | 0 (0.0%) |
| 3-Person Household | 0 (0.0%) | 25 (100.0%) |
| 4+ Person Household | 57 (100.0%) | 0 (0.0%) |
| Total Housing Units | 57 (69.5%) | 25 (30.5%) |
Occupancy by Educational Attainment in Potrero
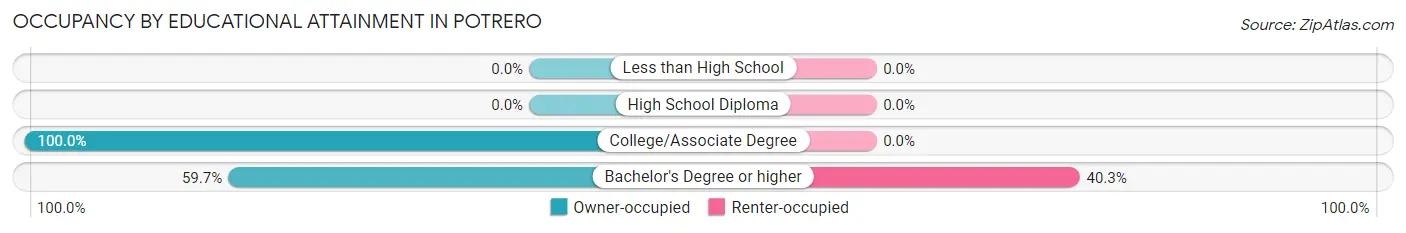
| Household Size | Owner-occupied | Renter-occupied |
| Less than High School | 0 (0.0%) | 0 (0.0%) |
| High School Diploma | 0 (0.0%) | 0 (0.0%) |
| College/Associate Degree | 20 (100.0%) | 0 (0.0%) |
| Bachelor's Degree or higher | 37 (59.7%) | 25 (40.3%) |
Occupancy by Age of Householder in Potrero
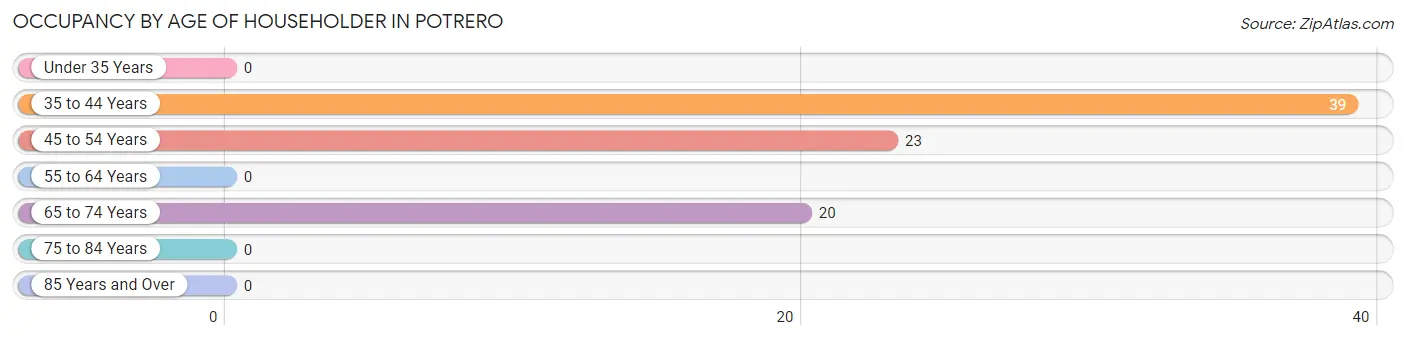
| Age Bracket | # Households | % Households |
| Under 35 Years | 0 | 0.0% |
| 35 to 44 Years | 39 | 47.6% |
| 45 to 54 Years | 23 | 28.1% |
| 55 to 64 Years | 0 | 0.0% |
| 65 to 74 Years | 20 | 24.4% |
| 75 to 84 Years | 0 | 0.0% |
| 85 Years and Over | 0 | 0.0% |
| Total | 82 | 100.0% |
Housing Finances in Potrero
Median Income by Occupancy in Potrero
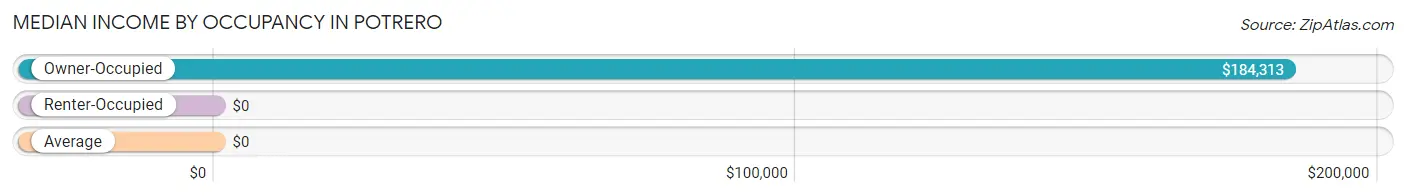
| Occupancy Type | # Households | Median Income |
| Owner-Occupied | 57 (69.5%) | $184,313 |
| Renter-Occupied | 25 (30.5%) | $0 |
| Average | 82 (100.0%) | $0 |
Occupancy by Householder Income Bracket in Potrero
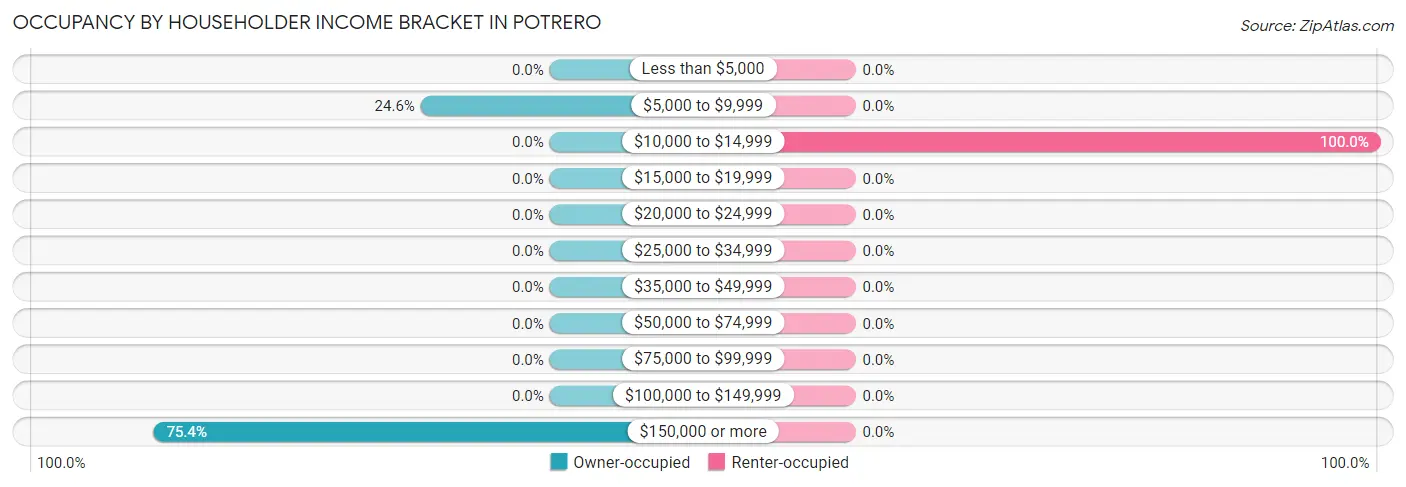
| Income Bracket | Owner-occupied | Renter-occupied |
| Less than $5,000 | 0 (0.0%) | 0 (0.0%) |
| $5,000 to $9,999 | 14 (24.6%) | 0 (0.0%) |
| $10,000 to $14,999 | 0 (0.0%) | 25 (100.0%) |
| $15,000 to $19,999 | 0 (0.0%) | 0 (0.0%) |
| $20,000 to $24,999 | 0 (0.0%) | 0 (0.0%) |
| $25,000 to $34,999 | 0 (0.0%) | 0 (0.0%) |
| $35,000 to $49,999 | 0 (0.0%) | 0 (0.0%) |
| $50,000 to $74,999 | 0 (0.0%) | 0 (0.0%) |
| $75,000 to $99,999 | 0 (0.0%) | 0 (0.0%) |
| $100,000 to $149,999 | 0 (0.0%) | 0 (0.0%) |
| $150,000 or more | 43 (75.4%) | 0 (0.0%) |
| Total | 57 (100.0%) | 25 (100.0%) |
Monthly Housing Cost Tiers in Potrero
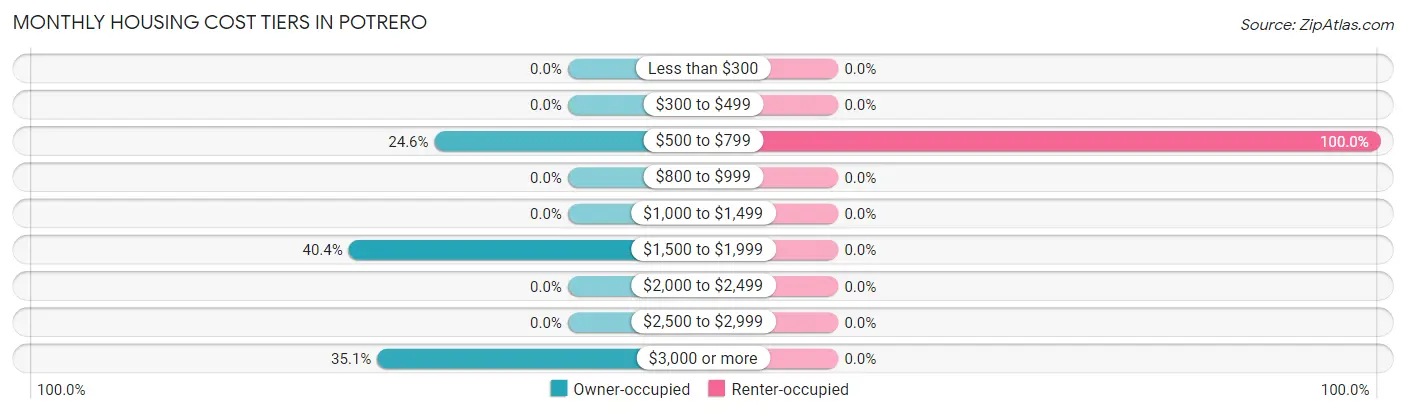
| Monthly Cost | Owner-occupied | Renter-occupied |
| Less than $300 | 0 (0.0%) | 0 (0.0%) |
| $300 to $499 | 0 (0.0%) | 0 (0.0%) |
| $500 to $799 | 14 (24.6%) | 25 (100.0%) |
| $800 to $999 | 0 (0.0%) | 0 (0.0%) |
| $1,000 to $1,499 | 0 (0.0%) | 0 (0.0%) |
| $1,500 to $1,999 | 23 (40.4%) | 0 (0.0%) |
| $2,000 to $2,499 | 0 (0.0%) | 0 (0.0%) |
| $2,500 to $2,999 | 0 (0.0%) | 0 (0.0%) |
| $3,000 or more | 20 (35.1%) | 0 (0.0%) |
| Total | 57 (100.0%) | 25 (100.0%) |
Physical Housing Characteristics in Potrero
Housing Structures in Potrero
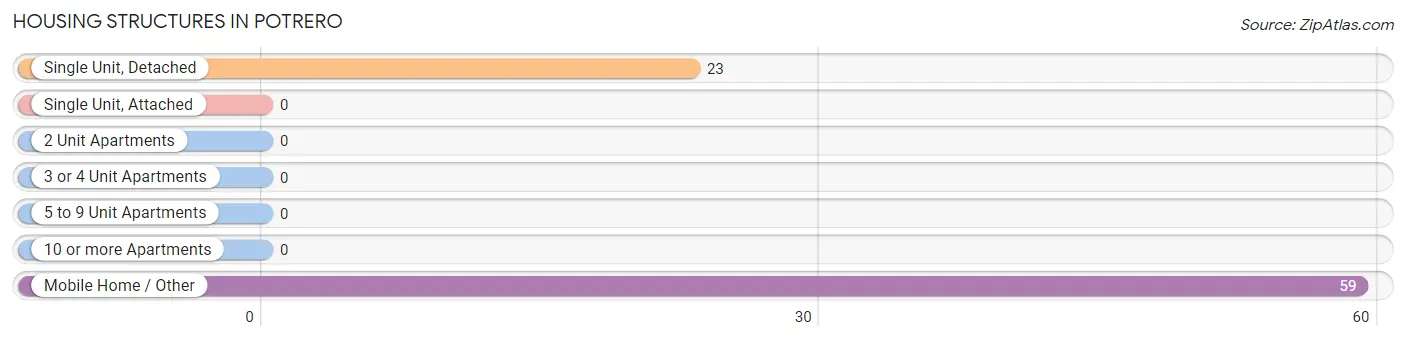
| Structure Type | # Housing Units | % Housing Units |
| Single Unit, Detached | 23 | 28.1% |
| Single Unit, Attached | 0 | 0.0% |
| 2 Unit Apartments | 0 | 0.0% |
| 3 or 4 Unit Apartments | 0 | 0.0% |
| 5 to 9 Unit Apartments | 0 | 0.0% |
| 10 or more Apartments | 0 | 0.0% |
| Mobile Home / Other | 59 | 72.0% |
| Total | 82 | 100.0% |
Housing Structures by Occupancy in Potrero
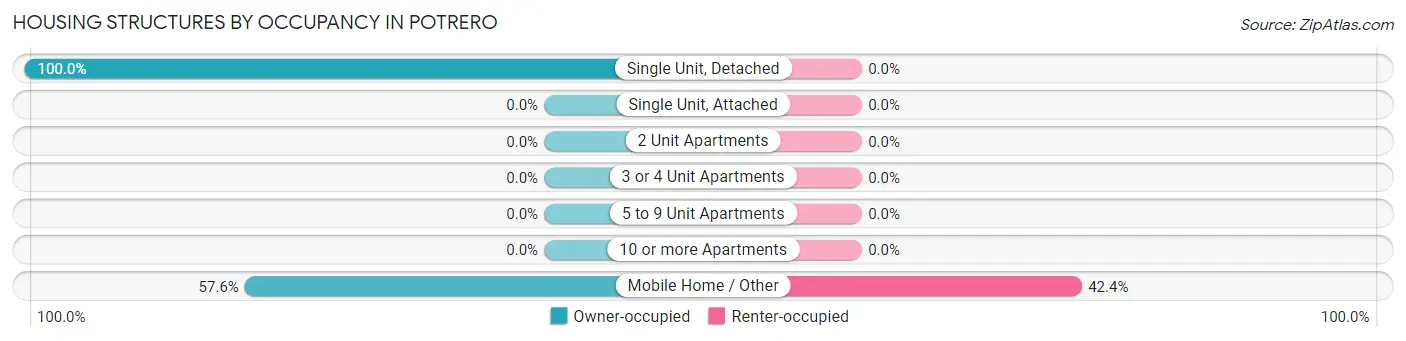
| Structure Type | Owner-occupied | Renter-occupied |
| Single Unit, Detached | 23 (100.0%) | 0 (0.0%) |
| Single Unit, Attached | 0 (0.0%) | 0 (0.0%) |
| 2 Unit Apartments | 0 (0.0%) | 0 (0.0%) |
| 3 or 4 Unit Apartments | 0 (0.0%) | 0 (0.0%) |
| 5 to 9 Unit Apartments | 0 (0.0%) | 0 (0.0%) |
| 10 or more Apartments | 0 (0.0%) | 0 (0.0%) |
| Mobile Home / Other | 34 (57.6%) | 25 (42.4%) |
| Total | 57 (69.5%) | 25 (30.5%) |
Housing Structures by Number of Rooms in Potrero
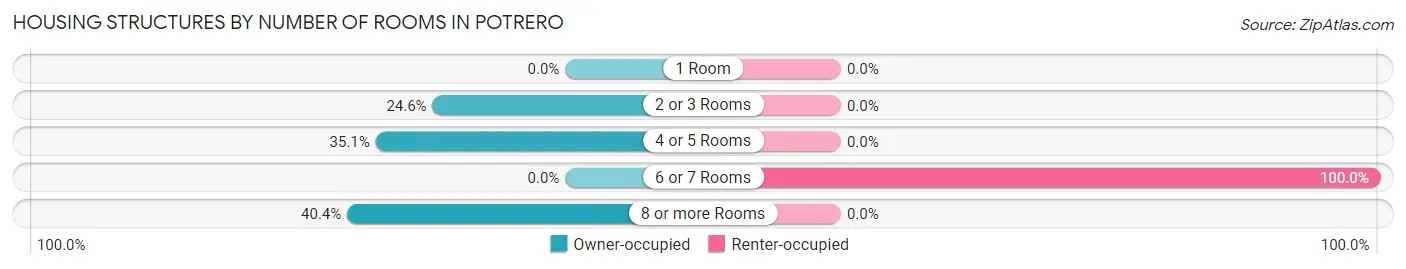
| Number of Rooms | Owner-occupied | Renter-occupied |
| 1 Room | 0 (0.0%) | 0 (0.0%) |
| 2 or 3 Rooms | 14 (24.6%) | 0 (0.0%) |
| 4 or 5 Rooms | 20 (35.1%) | 0 (0.0%) |
| 6 or 7 Rooms | 0 (0.0%) | 25 (100.0%) |
| 8 or more Rooms | 23 (40.4%) | 0 (0.0%) |
| Total | 57 (100.0%) | 25 (100.0%) |
Housing Structure by Heating Type in Potrero
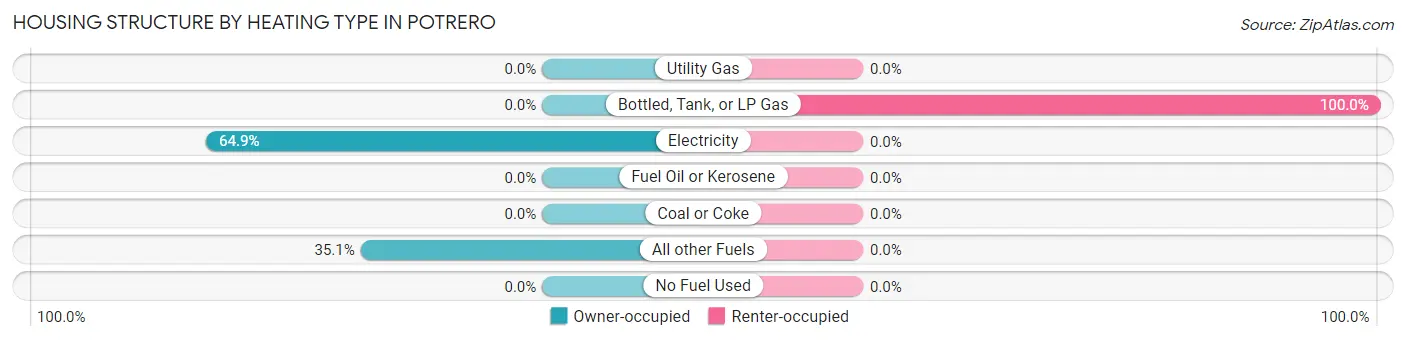
| Heating Type | Owner-occupied | Renter-occupied |
| Utility Gas | 0 (0.0%) | 0 (0.0%) |
| Bottled, Tank, or LP Gas | 0 (0.0%) | 25 (100.0%) |
| Electricity | 37 (64.9%) | 0 (0.0%) |
| Fuel Oil or Kerosene | 0 (0.0%) | 0 (0.0%) |
| Coal or Coke | 0 (0.0%) | 0 (0.0%) |
| All other Fuels | 20 (35.1%) | 0 (0.0%) |
| No Fuel Used | 0 (0.0%) | 0 (0.0%) |
| Total | 57 (100.0%) | 25 (100.0%) |
Household Vehicle Usage in Potrero
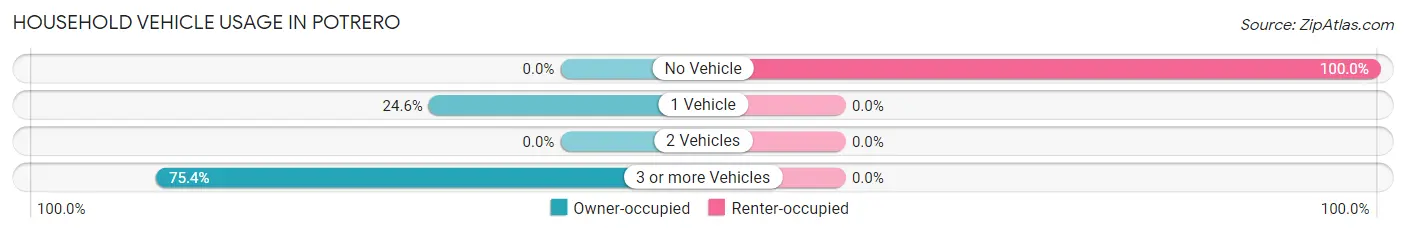
| Vehicles per Household | Owner-occupied | Renter-occupied |
| No Vehicle | 0 (0.0%) | 25 (100.0%) |
| 1 Vehicle | 14 (24.6%) | 0 (0.0%) |
| 2 Vehicles | 0 (0.0%) | 0 (0.0%) |
| 3 or more Vehicles | 43 (75.4%) | 0 (0.0%) |
| Total | 57 (100.0%) | 25 (100.0%) |
Real Estate & Mortgages in Potrero
Real Estate and Mortgage Overview in Potrero
| Characteristic | Without Mortgage | With Mortgage |
| Housing Units | 0 | 57 |
| Median Property Value | - | - |
| Median Household Income | - | - |
| Monthly Housing Costs | - | - |
| Real Estate Taxes | - | - |
Property Value by Mortgage Status in Potrero
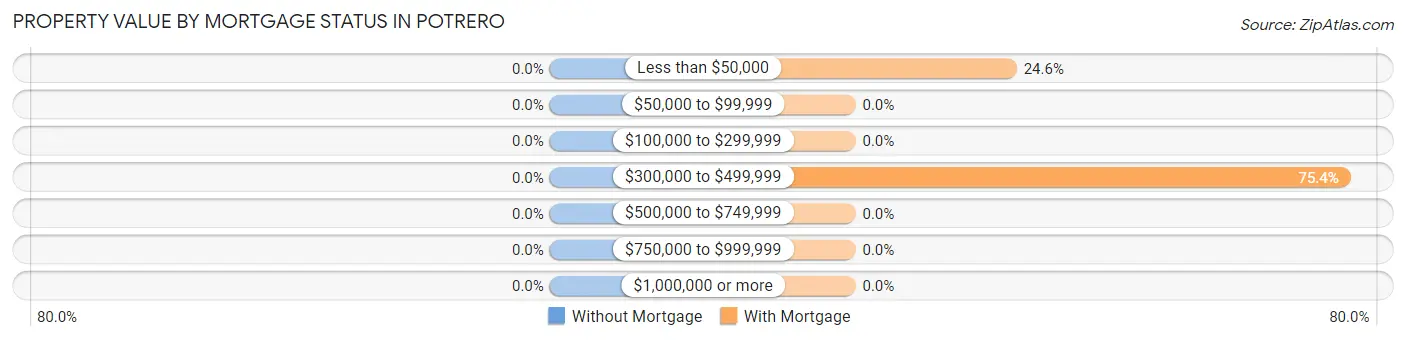
| Property Value | Without Mortgage | With Mortgage |
| Less than $50,000 | 0 (0.0%) | 14 (24.6%) |
| $50,000 to $99,999 | 0 (0.0%) | 0 (0.0%) |
| $100,000 to $299,999 | 0 (0.0%) | 0 (0.0%) |
| $300,000 to $499,999 | 0 (0.0%) | 43 (75.4%) |
| $500,000 to $749,999 | 0 (0.0%) | 0 (0.0%) |
| $750,000 to $999,999 | 0 (0.0%) | 0 (0.0%) |
| $1,000,000 or more | 0 (0.0%) | 0 (0.0%) |
| Total | 0 (0.0%) | 57 (100.0%) |
Household Income by Mortgage Status in Potrero
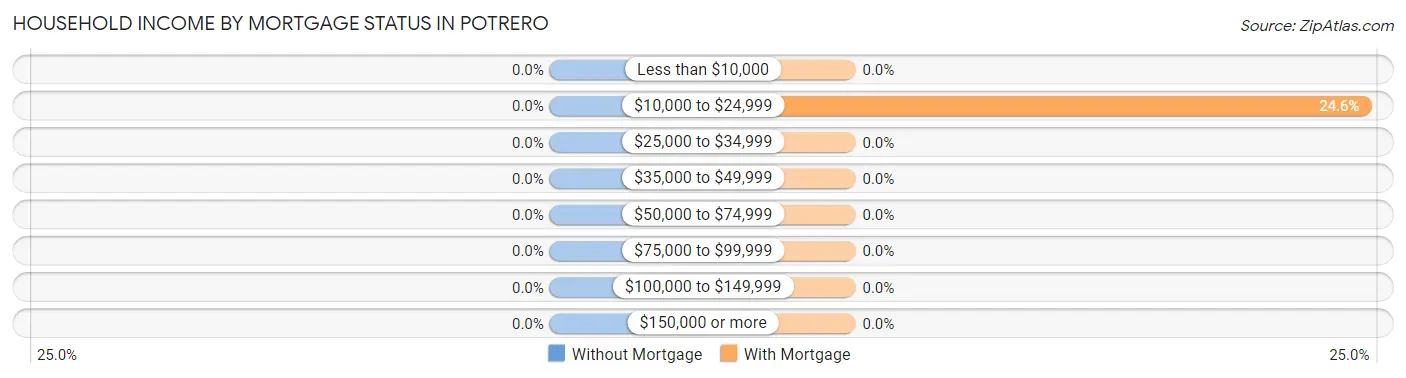
| Household Income | Without Mortgage | With Mortgage |
| Less than $10,000 | 0 (0.0%) | 0 (0.0%) |
| $10,000 to $24,999 | 0 (0.0%) | 14 (24.6%) |
| $25,000 to $34,999 | 0 (0.0%) | 0 (0.0%) |
| $35,000 to $49,999 | 0 (0.0%) | 0 (0.0%) |
| $50,000 to $74,999 | 0 (0.0%) | 0 (0.0%) |
| $75,000 to $99,999 | 0 (0.0%) | 0 (0.0%) |
| $100,000 to $149,999 | 0 (0.0%) | 0 (0.0%) |
| $150,000 or more | 0 (0.0%) | 0 (0.0%) |
| Total | 0 (0.0%) | 57 (100.0%) |
Property Value to Household Income Ratio in Potrero
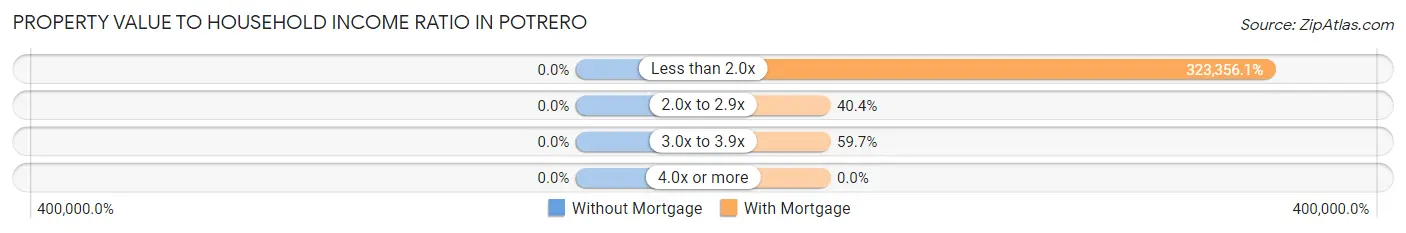
| Value-to-Income Ratio | Without Mortgage | With Mortgage |
| Less than 2.0x | 0 (0.0%) | 184,313 (323,356.1%) |
| 2.0x to 2.9x | 0 (0.0%) | 23 (40.4%) |
| 3.0x to 3.9x | 0 (0.0%) | 34 (59.7%) |
| 4.0x or more | 0 (0.0%) | 0 (0.0%) |
| Total | 0 (0.0%) | 57 (100.0%) |
Real Estate Taxes by Mortgage Status in Potrero
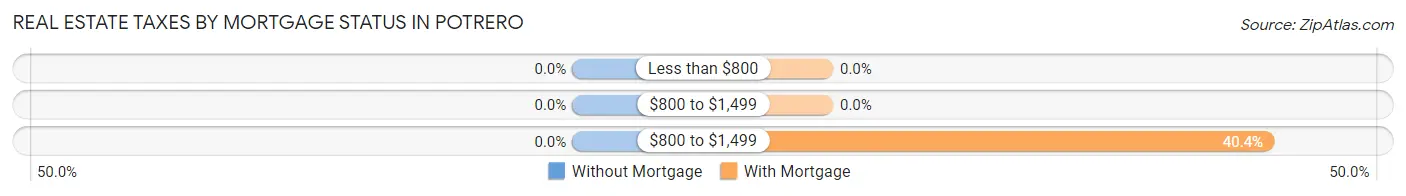
| Property Taxes | Without Mortgage | With Mortgage |
| Less than $800 | 0 (0.0%) | 0 (0.0%) |
| $800 to $1,499 | 0 (0.0%) | 0 (0.0%) |
| $800 to $1,499 | 0 (0.0%) | 23 (40.4%) |
| Total | 0 (0.0%) | 57 (100.0%) |
Health & Disability in Potrero
Health Insurance Coverage by Age in Potrero
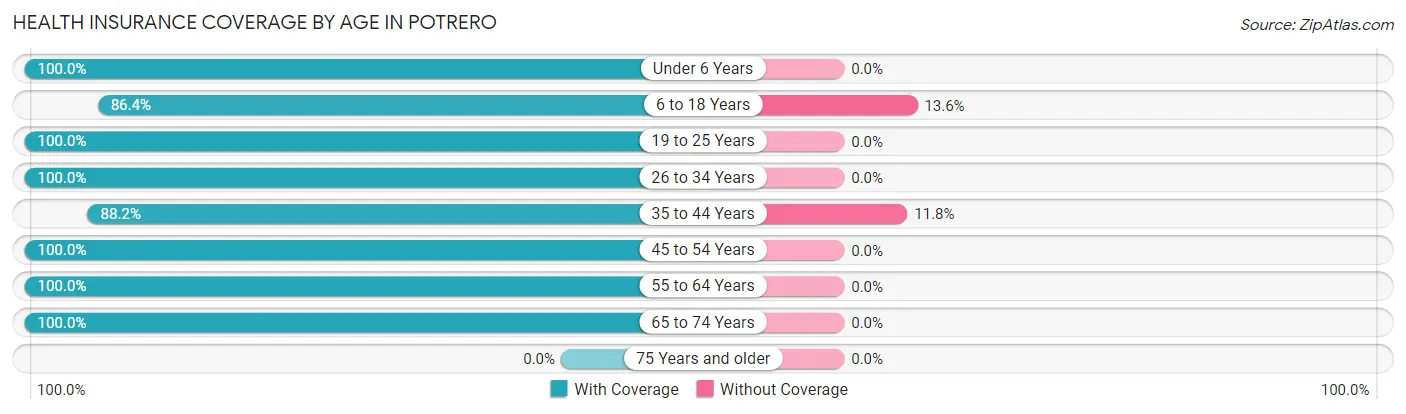
| Age Bracket | With Coverage | Without Coverage |
| Under 6 Years | 52 (100.0%) | 0 (0.0%) |
| 6 to 18 Years | 95 (86.4%) | 15 (13.6%) |
| 19 to 25 Years | 96 (100.0%) | 0 (0.0%) |
| 26 to 34 Years | 24 (100.0%) | 0 (0.0%) |
| 35 to 44 Years | 105 (88.2%) | 14 (11.8%) |
| 45 to 54 Years | 43 (100.0%) | 0 (0.0%) |
| 55 to 64 Years | 19 (100.0%) | 0 (0.0%) |
| 65 to 74 Years | 46 (100.0%) | 0 (0.0%) |
| 75 Years and older | 0 (0.0%) | 0 (0.0%) |
| Total | 480 (94.3%) | 29 (5.7%) |
Health Insurance Coverage by Citizenship Status in Potrero
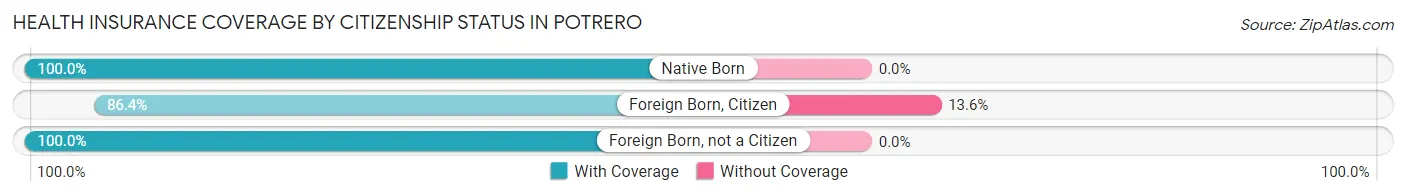
| Citizenship Status | With Coverage | Without Coverage |
| Native Born | 52 (100.0%) | 0 (0.0%) |
| Foreign Born, Citizen | 95 (86.4%) | 15 (13.6%) |
| Foreign Born, not a Citizen | 96 (100.0%) | 0 (0.0%) |
Health Insurance Coverage by Household Income in Potrero
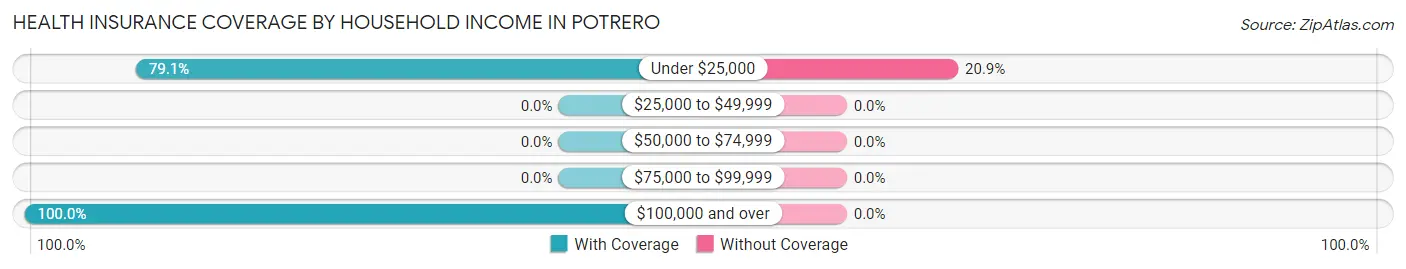
| Household Income | With Coverage | Without Coverage |
| Under $25,000 | 110 (79.1%) | 29 (20.9%) |
| $25,000 to $49,999 | 0 (0.0%) | 0 (0.0%) |
| $50,000 to $74,999 | 0 (0.0%) | 0 (0.0%) |
| $75,000 to $99,999 | 0 (0.0%) | 0 (0.0%) |
| $100,000 and over | 370 (100.0%) | 0 (0.0%) |
Public vs Private Health Insurance Coverage by Age in Potrero
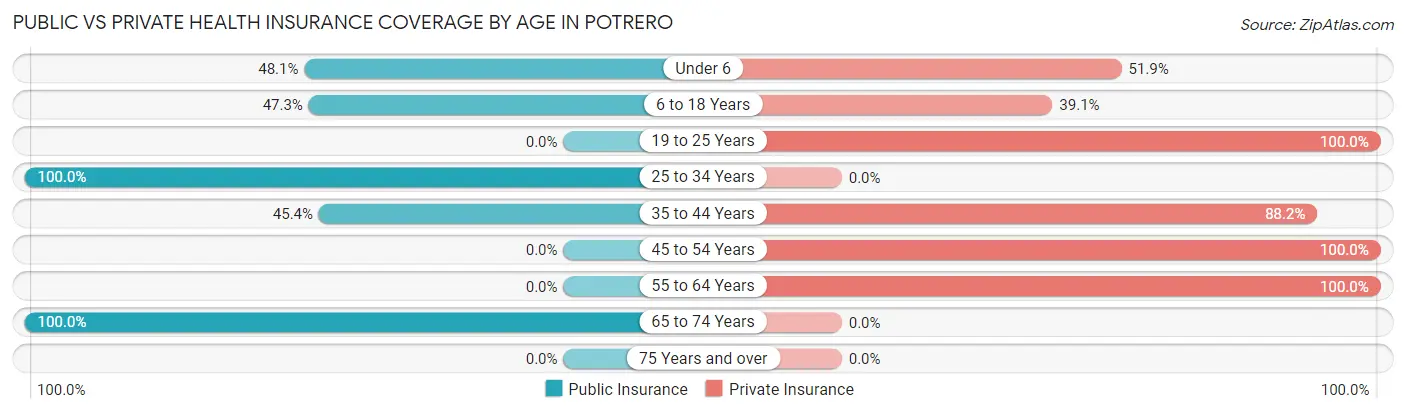
| Age Bracket | Public Insurance | Private Insurance |
| Under 6 | 25 (48.1%) | 27 (51.9%) |
| 6 to 18 Years | 52 (47.3%) | 43 (39.1%) |
| 19 to 25 Years | 0 (0.0%) | 96 (100.0%) |
| 25 to 34 Years | 24 (100.0%) | 0 (0.0%) |
| 35 to 44 Years | 54 (45.4%) | 105 (88.2%) |
| 45 to 54 Years | 0 (0.0%) | 43 (100.0%) |
| 55 to 64 Years | 0 (0.0%) | 19 (100.0%) |
| 65 to 74 Years | 46 (100.0%) | 0 (0.0%) |
| 75 Years and over | 0 (0.0%) | 0 (0.0%) |
| Total | 201 (39.5%) | 333 (65.4%) |
Disability Status by Sex by Age in Potrero
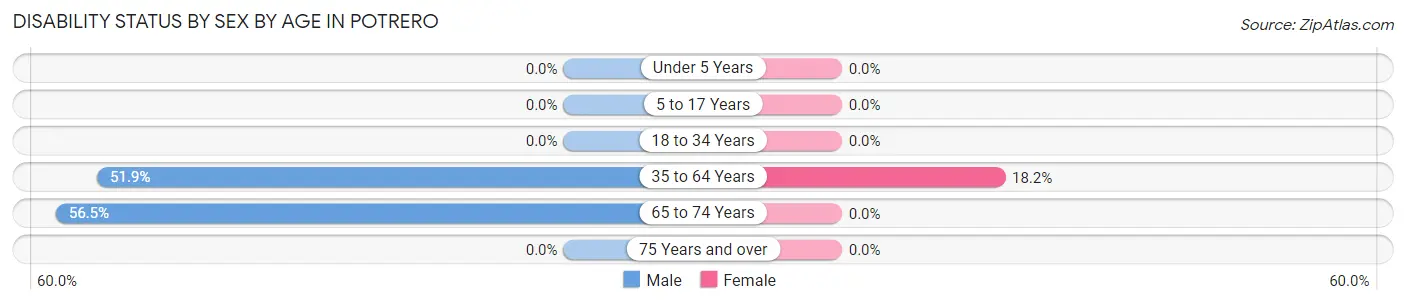
| Age Bracket | Male | Female |
| Under 5 Years | 0 (0.0%) | 0 (0.0%) |
| 5 to 17 Years | 0 (0.0%) | 0 (0.0%) |
| 18 to 34 Years | 0 (0.0%) | 0 (0.0%) |
| 35 to 64 Years | 54 (51.9%) | 14 (18.2%) |
| 65 to 74 Years | 26 (56.5%) | 0 (0.0%) |
| 75 Years and over | 0 (0.0%) | 0 (0.0%) |
Disability Class by Sex by Age in Potrero
Disability Class: Hearing Difficulty
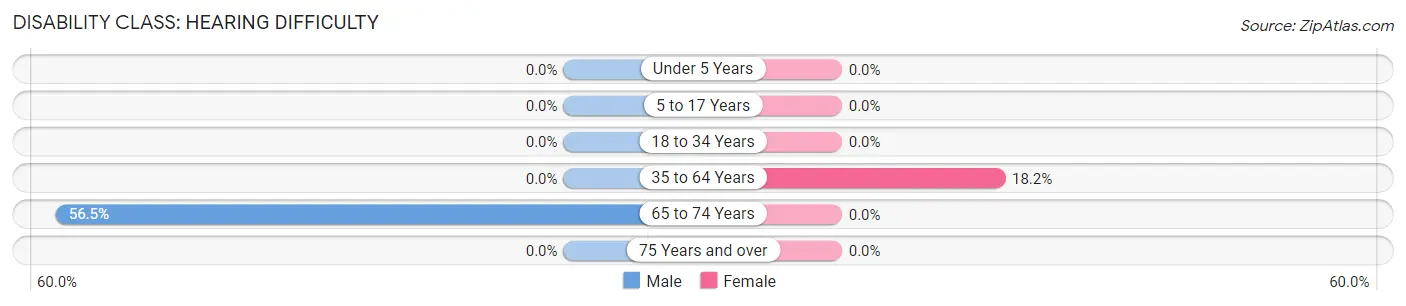
| Age Bracket | Male | Female |
| Under 5 Years | 0 (0.0%) | 0 (0.0%) |
| 5 to 17 Years | 0 (0.0%) | 0 (0.0%) |
| 18 to 34 Years | 0 (0.0%) | 0 (0.0%) |
| 35 to 64 Years | 0 (0.0%) | 14 (18.2%) |
| 65 to 74 Years | 26 (56.5%) | 0 (0.0%) |
| 75 Years and over | 0 (0.0%) | 0 (0.0%) |
Disability Class: Vision Difficulty
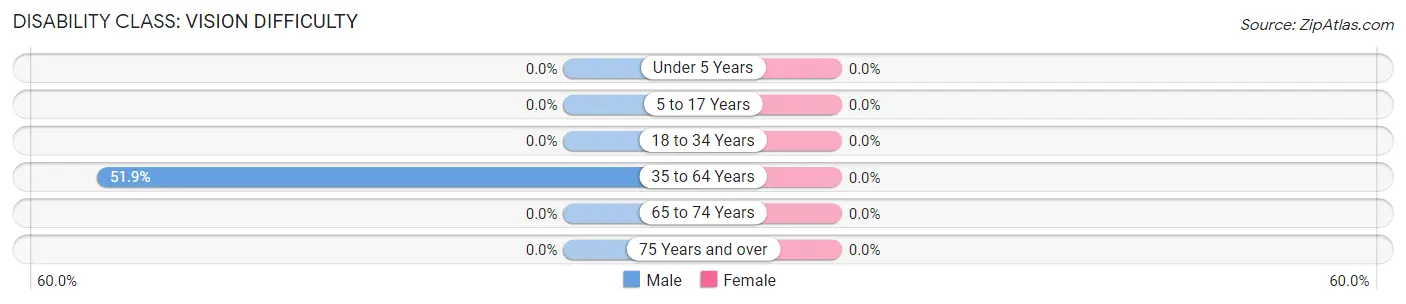
| Age Bracket | Male | Female |
| Under 5 Years | 0 (0.0%) | 0 (0.0%) |
| 5 to 17 Years | 0 (0.0%) | 0 (0.0%) |
| 18 to 34 Years | 0 (0.0%) | 0 (0.0%) |
| 35 to 64 Years | 54 (51.9%) | 0 (0.0%) |
| 65 to 74 Years | 0 (0.0%) | 0 (0.0%) |
| 75 Years and over | 0 (0.0%) | 0 (0.0%) |
Disability Class: Cognitive Difficulty
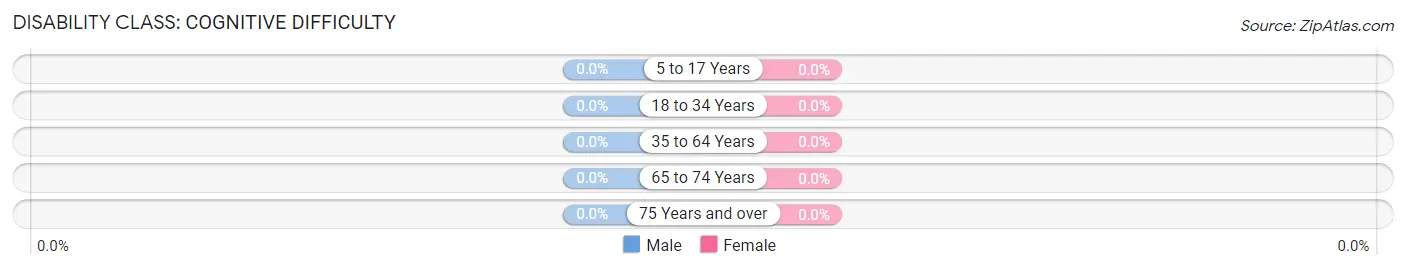
| Age Bracket | Male | Female |
| 5 to 17 Years | 0 (0.0%) | 0 (0.0%) |
| 18 to 34 Years | 0 (0.0%) | 0 (0.0%) |
| 35 to 64 Years | 0 (0.0%) | 0 (0.0%) |
| 65 to 74 Years | 0 (0.0%) | 0 (0.0%) |
| 75 Years and over | 0 (0.0%) | 0 (0.0%) |
Disability Class: Ambulatory Difficulty
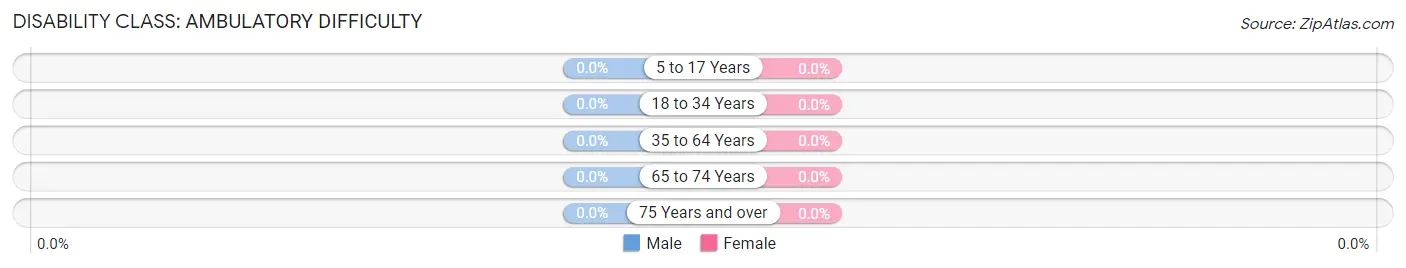
| Age Bracket | Male | Female |
| 5 to 17 Years | 0 (0.0%) | 0 (0.0%) |
| 18 to 34 Years | 0 (0.0%) | 0 (0.0%) |
| 35 to 64 Years | 0 (0.0%) | 0 (0.0%) |
| 65 to 74 Years | 0 (0.0%) | 0 (0.0%) |
| 75 Years and over | 0 (0.0%) | 0 (0.0%) |
Disability Class: Self-Care Difficulty
| Age Bracket | Male | Female |
| 5 to 17 Years | 0 (0.0%) | 0 (0.0%) |
| 18 to 34 Years | 0 (0.0%) | 0 (0.0%) |
| 35 to 64 Years | 0 (0.0%) | 0 (0.0%) |
| 65 to 74 Years | 0 (0.0%) | 0 (0.0%) |
| 75 Years and over | 0 (0.0%) | 0 (0.0%) |
Technology Access in Potrero
Computing Device Access in Potrero
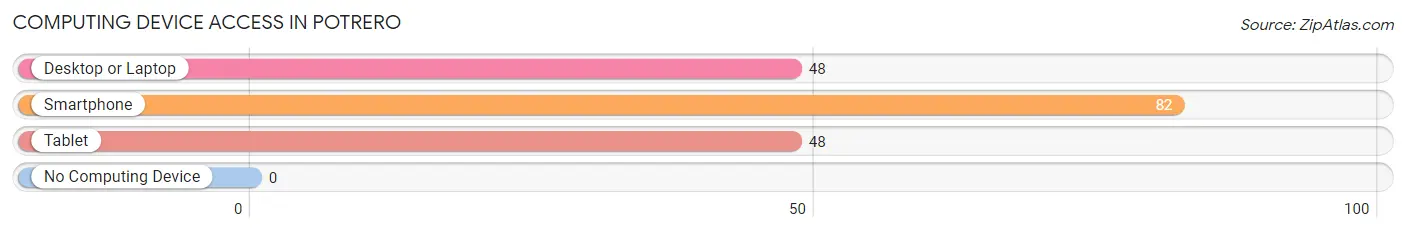
| Device Type | # Households | % Households |
| Desktop or Laptop | 48 | 58.5% |
| Smartphone | 82 | 100.0% |
| Tablet | 48 | 58.5% |
| No Computing Device | 0 | 0.0% |
| Total | 82 | 100.0% |
Internet Access in Potrero
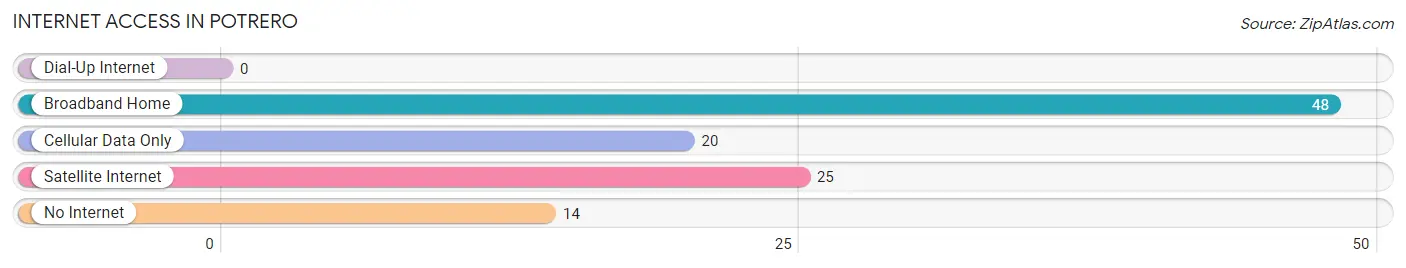
| Internet Type | # Households | % Households |
| Dial-Up Internet | 0 | 0.0% |
| Broadband Home | 48 | 58.5% |
| Cellular Data Only | 20 | 24.4% |
| Satellite Internet | 25 | 30.5% |
| No Internet | 14 | 17.1% |
| Total | 82 | 100.0% |
Potrero Summary
History
Potrero is a small unincorporated community located in San Diego County, California. It is situated in the southeastern corner of the county, near the Mexican border. The area was originally inhabited by the Kumeyaay people, who were hunter-gatherers and lived in the area for thousands of years. The first Europeans to arrive in the area were Spanish missionaries, who established a mission in the area in 1774. The mission was abandoned in 1834, and the area was then settled by Mexican ranchers.
In 1846, the United States annexed the area as part of the Mexican-American War. The area was then divided into large land grants, and the first settlers began to arrive in the 1850s. The area was known as Potrero de San Diego, and the first post office was established in 1858. The town was officially incorporated in 1887, and the name was changed to Potrero.
The town grew slowly over the next few decades, and by the early 1900s, it had become a popular tourist destination. The town was known for its hot springs, which were believed to have healing properties. The town also had a number of saloons and gambling halls, which attracted visitors from all over the region.
In the 1920s, the town began to decline as the hot springs lost their popularity. The Great Depression also had a negative effect on the town, and many of the businesses closed. The town was further impacted by the construction of Interstate 8 in the 1950s, which bypassed the town and diverted traffic away from it.
Geography
Potrero is located in southeastern San Diego County, near the Mexican border. It is situated in the foothills of the Laguna Mountains, at an elevation of 1,400 feet (427 m). The town is located on the San Diego River, which flows through the area. The climate in the area is semi-arid, with hot summers and mild winters.
The town covers an area of 4.2 square miles (10.8 km2), and has a population of approximately 1,000 people. The town is located near the communities of Campo, Boulevard, and Tecate, Mexico.
Economy
The economy of Potrero is largely based on agriculture and tourism. The town is home to several farms, which produce a variety of crops, including avocados, citrus fruits, and vegetables. The town is also home to several wineries, which produce a variety of wines.
The town is also a popular tourist destination, and is home to several attractions, including the Potrero County Park, which features a lake, picnic areas, and hiking trails. The town is also home to several restaurants, bars, and shops.
Demographics
As of the 2010 census, the population of Potrero was 1,000 people. The racial makeup of the town was 75.2% White, 0.7% African American, 0.7% Native American, 0.7% Asian, 0.7% Pacific Islander, and 21.1% from other races. Hispanic or Latino of any race were 57.7% of the population.
The median household income in Potrero was $37,500, and the median family income was $41,250. The per capita income in the town was $17,500. About 15.2% of the population was below the poverty line.
Common Questions
What is Per Capita Income in Potrero?
Per Capita income in Potrero is $18,563.
What is the Median Family Income in Potrero?
Median Family Income in Potrero is $184,313.
What is Income or Wage Gap in Potrero?
Income or Wage Gap in Potrero is 63.3%.
Women in Potrero earn 36.7 cents for every dollar earned by a man.
What is Inequality or Gini Index in Potrero?
Inequality or Gini Index in Potrero is 0.43.
What is the Total Population of Potrero?
Total Population of Potrero is 509.
What is the Total Male Population of Potrero?
Total Male Population of Potrero is 271.
What is the Total Female Population of Potrero?
Total Female Population of Potrero is 238.
What is the Ratio of Males per 100 Females in Potrero?
There are 113.87 Males per 100 Females in Potrero.
What is the Ratio of Females per 100 Males in Potrero?
There are 87.82 Females per 100 Males in Potrero.
What is the Median Population Age in Potrero?
Median Population Age in Potrero is 24.9 Years.
What is the Average Family Size in Potrero
Average Family Size in Potrero is 7.5 People.
What is the Average Household Size in Potrero
Average Household Size in Potrero is 6.2 People.
How Large is the Labor Force in Potrero?
There are 231 People in the Labor Forcein in Potrero.
What is the Percentage of People in the Labor Force in Potrero?
59.2% of People are in the Labor Force in Potrero.
What is the Unemployment Rate in Potrero?
Unemployment Rate in Potrero is 9.1%.