Zip Codes with the Highest Percentage of Population Employed in Installation, Maintenance & Repair in Culver City, CA
RELATED REPORTS & OPTIONS
Installation, Maintenance & Repair
Culver City
Compare Zip Codes
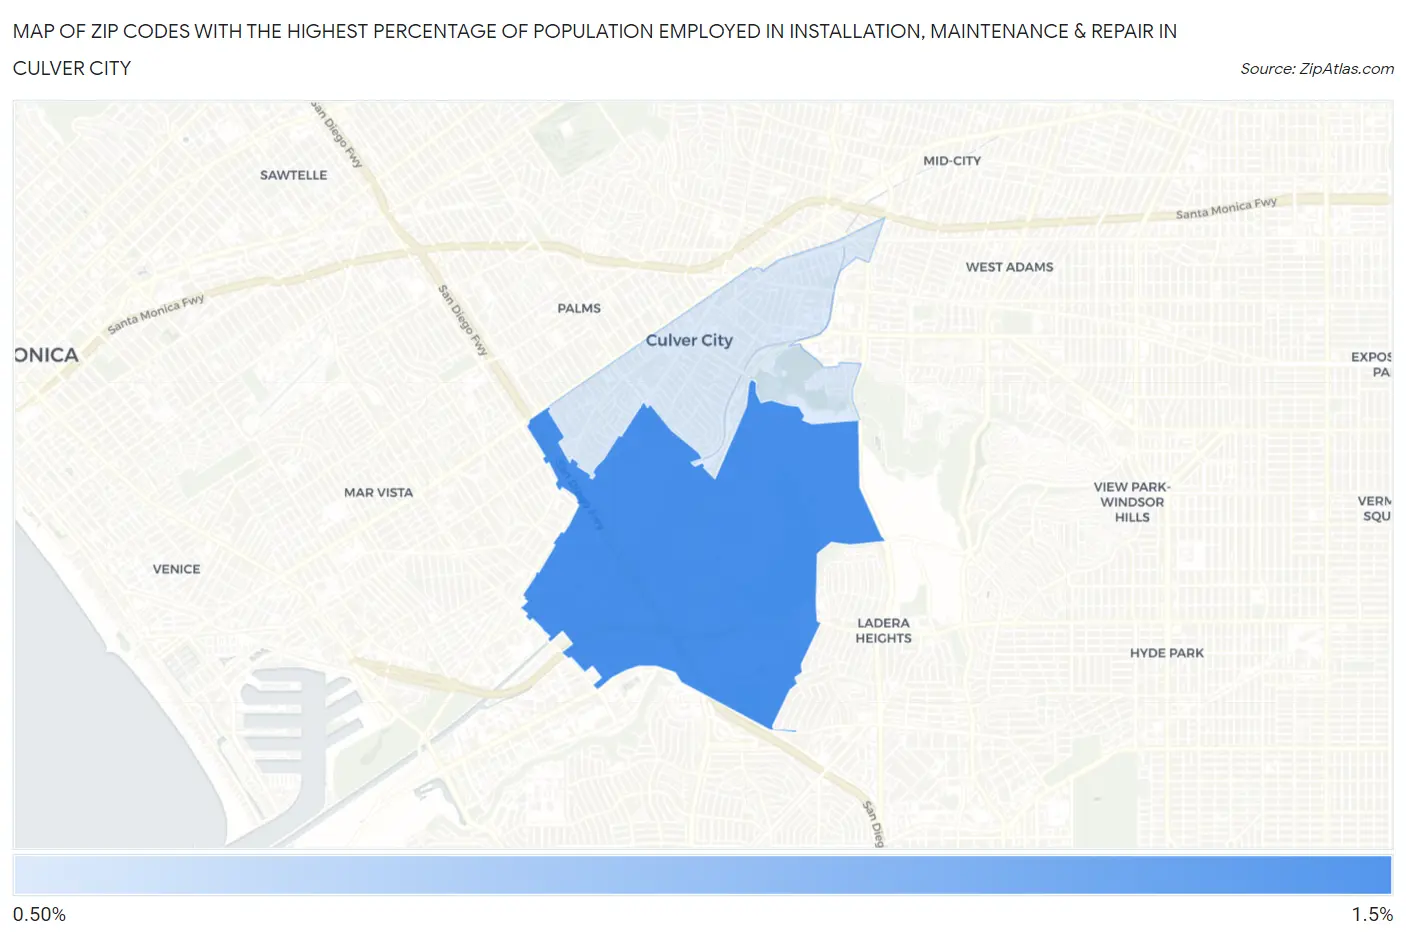
Map of Zip Codes with the Highest Percentage of Population Employed in Installation, Maintenance & Repair in Culver City
0.93%
1.2%
Zip Codes with the Highest Percentage of Population Employed in Installation, Maintenance & Repair in Culver City, CA
| Zip Code | % Employed | vs State | vs National | |
| 1. | 90230 | 1.2% | 2.6%(-1.32)#1,187 | 3.1%(-1.83)#25,136 |
| 2. | 90232 | 0.93% | 2.6%(-1.63)#1,269 | 3.1%(-2.14)#26,111 |
1
Common Questions
What are the Top Zip Codes with the Highest Percentage of Population Employed in Installation, Maintenance & Repair in Culver City, CA?
Top Zip Codes with the Highest Percentage of Population Employed in Installation, Maintenance & Repair in Culver City, CA are:
What zip code has the Highest Percentage of Population Employed in Installation, Maintenance & Repair in Culver City, CA?
90230 has the Highest Percentage of Population Employed in Installation, Maintenance & Repair in Culver City, CA with 1.2%.
What is the Percentage of Population Employed in Installation, Maintenance & Repair in Culver City, CA?
Percentage of Population Employed in Installation, Maintenance & Repair in Culver City is 1.1%.
What is the Percentage of Population Employed in Installation, Maintenance & Repair in California?
Percentage of Population Employed in Installation, Maintenance & Repair in California is 2.6%.
What is the Percentage of Population Employed in Installation, Maintenance & Repair in the United States?
Percentage of Population Employed in Installation, Maintenance & Repair in the United States is 3.1%.