Cities with the Highest Percentage of Population Employed in Office & Administration in California
RELATED REPORTS & OPTIONS
Office & Administration
California
Compare Cities
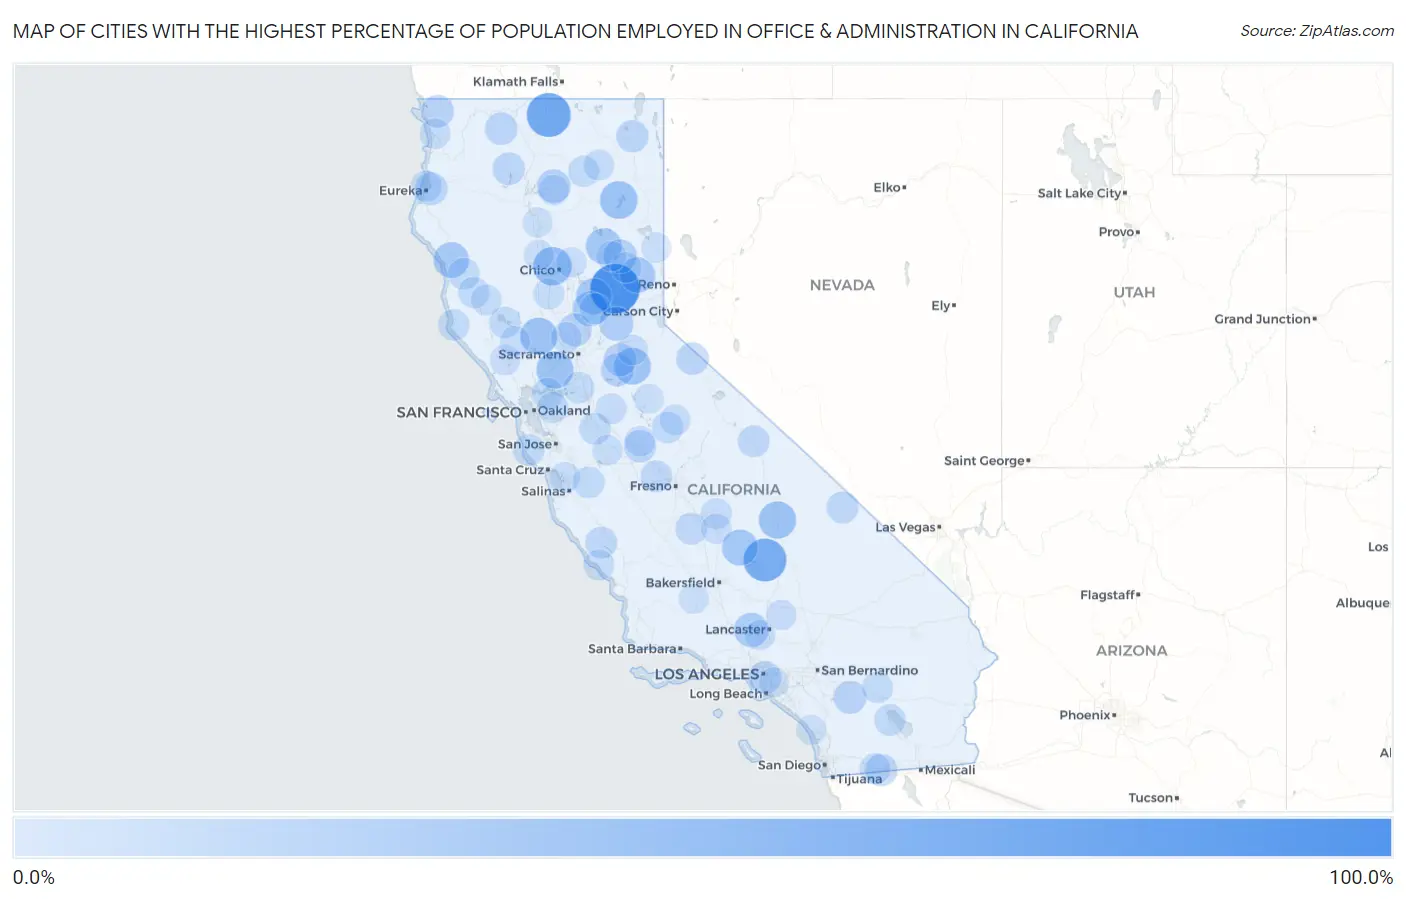
Map of Cities with the Highest Percentage of Population Employed in Office & Administration in California
0.0%
100.0%
Cities with the Highest Percentage of Population Employed in Office & Administration in California
| City | % Employed | vs State | vs National | |
| 1. | Alleghany | 100.0% | 10.5%(+89.5)#1 | 10.9%(+89.1)#19 |
| 2. | Franklin Cdp Sacramento County | 100.0% | 10.5%(+89.5)#2 | 10.9%(+89.1)#32 |
| 3. | Mount Hebron | 76.1% | 10.5%(+65.6)#3 | 10.9%(+65.2)#70 |
| 4. | Onyx | 71.3% | 10.5%(+60.8)#4 | 10.9%(+60.4)#82 |
| 5. | Nord | 52.5% | 10.5%(+42.0)#5 | 10.9%(+41.6)#185 |
| 6. | Wautec | 50.0% | 10.5%(+39.5)#6 | 10.9%(+39.1)#226 |
| 7. | Spaulding | 49.1% | 10.5%(+38.6)#7 | 10.9%(+38.2)#236 |
| 8. | Olancha | 47.7% | 10.5%(+37.2)#8 | 10.9%(+36.8)#252 |
| 9. | Guinda | 47.0% | 10.5%(+36.5)#9 | 10.9%(+36.1)#259 |
| 10. | Elmira | 46.8% | 10.5%(+36.3)#10 | 10.9%(+36.0)#263 |
| 11. | West Point | 45.6% | 10.5%(+35.1)#11 | 10.9%(+34.8)#279 |
| 12. | Rivergrove | 44.4% | 10.5%(+33.9)#12 | 10.9%(+33.6)#304 |
| 13. | Pine Flat | 42.5% | 10.5%(+32.0)#13 | 10.9%(+31.6)#346 |
| 14. | Twain | 42.0% | 10.5%(+31.5)#14 | 10.9%(+31.1)#362 |
| 15. | Dobbins | 41.2% | 10.5%(+30.7)#15 | 10.9%(+30.4)#376 |
| 16. | Leggett | 40.9% | 10.5%(+30.4)#16 | 10.9%(+30.1)#392 |
| 17. | Calpine | 40.6% | 10.5%(+30.1)#17 | 10.9%(+29.8)#398 |
| 18. | Smartsville | 37.8% | 10.5%(+27.3)#18 | 10.9%(+27.0)#475 |
| 19. | Lake Hughes | 36.3% | 10.5%(+25.8)#19 | 10.9%(+25.5)#527 |
| 20. | Foresthill | 35.0% | 10.5%(+24.5)#20 | 10.9%(+24.1)#581 |
| 21. | Greenhorn | 34.0% | 10.5%(+23.5)#21 | 10.9%(+23.1)#620 |
| 22. | Johnson Park | 33.9% | 10.5%(+23.4)#22 | 10.9%(+23.0)#621 |
| 23. | Woody | 33.3% | 10.5%(+22.8)#23 | 10.9%(+22.5)#653 |
| 24. | Montgomery Creek | 33.0% | 10.5%(+22.5)#24 | 10.9%(+22.1)#695 |
| 25. | East Nicolaus | 31.3% | 10.5%(+20.8)#25 | 10.9%(+20.5)#772 |
| 26. | Martell | 30.5% | 10.5%(+20.0)#26 | 10.9%(+19.6)#815 |
| 27. | Fiddletown | 30.0% | 10.5%(+19.5)#27 | 10.9%(+19.1)#846 |
| 28. | Mountain Center | 30.0% | 10.5%(+19.5)#28 | 10.9%(+19.1)#848 |
| 29. | Vernon | 29.9% | 10.5%(+19.4)#29 | 10.9%(+19.1)#852 |
| 30. | Gasquet | 29.6% | 10.5%(+19.1)#30 | 10.9%(+18.7)#873 |
| 31. | Indianola | 29.1% | 10.5%(+18.6)#31 | 10.9%(+18.2)#913 |
| 32. | Fort Jones | 28.8% | 10.5%(+18.3)#32 | 10.9%(+17.9)#935 |
| 33. | Coffee Creek | 28.4% | 10.5%(+17.9)#33 | 10.9%(+17.6)#972 |
| 34. | Walker | 28.2% | 10.5%(+17.7)#34 | 10.9%(+17.3)#984 |
| 35. | Bear Creek | 27.8% | 10.5%(+17.3)#35 | 10.9%(+16.9)#1,026 |
| 36. | Las Flores Cdp Tehama County | 27.8% | 10.5%(+17.3)#36 | 10.9%(+16.9)#1,027 |
| 37. | Daphnedale Park | 27.5% | 10.5%(+17.0)#37 | 10.9%(+16.7)#1,058 |
| 38. | Whitmore | 27.1% | 10.5%(+16.6)#38 | 10.9%(+16.2)#1,095 |
| 39. | Jacumba | 26.7% | 10.5%(+16.2)#39 | 10.9%(+15.9)#1,131 |
| 40. | Millerton | 26.4% | 10.5%(+15.9)#40 | 10.9%(+15.5)#1,162 |
| 41. | Igo | 26.2% | 10.5%(+15.7)#41 | 10.9%(+15.3)#1,189 |
| 42. | Waukena | 25.9% | 10.5%(+15.4)#42 | 10.9%(+15.1)#1,208 |
| 43. | Furnace Creek | 25.9% | 10.5%(+15.4)#43 | 10.9%(+15.0)#1,212 |
| 44. | Lockwood | 25.3% | 10.5%(+14.8)#44 | 10.9%(+14.5)#1,272 |
| 45. | Bishop | 25.2% | 10.5%(+14.7)#45 | 10.9%(+14.3)#1,283 |
| 46. | La Vina | 25.1% | 10.5%(+14.6)#46 | 10.9%(+14.3)#1,290 |
| 47. | Westley | 24.7% | 10.5%(+14.2)#47 | 10.9%(+13.8)#1,363 |
| 48. | Laytonville | 24.7% | 10.5%(+14.2)#48 | 10.9%(+13.8)#1,369 |
| 49. | Tres Pinos | 24.6% | 10.5%(+14.1)#49 | 10.9%(+13.7)#1,373 |
| 50. | Midpines | 24.6% | 10.5%(+14.1)#50 | 10.9%(+13.7)#1,376 |
| 51. | Soda Bay | 24.6% | 10.5%(+14.0)#51 | 10.9%(+13.7)#1,387 |
| 52. | Trabuco Canyon | 24.5% | 10.5%(+14.0)#52 | 10.9%(+13.7)#1,388 |
| 53. | Salton Sea Beach | 24.5% | 10.5%(+14.0)#53 | 10.9%(+13.7)#1,392 |
| 54. | Manchester | 24.2% | 10.5%(+13.6)#54 | 10.9%(+13.3)#1,440 |
| 55. | Pescadero | 23.9% | 10.5%(+13.4)#55 | 10.9%(+13.1)#1,470 |
| 56. | Clyde | 23.7% | 10.5%(+13.2)#56 | 10.9%(+12.9)#1,507 |
| 57. | Diablo | 23.7% | 10.5%(+13.2)#57 | 10.9%(+12.8)#1,514 |
| 58. | Terminous | 23.7% | 10.5%(+13.2)#58 | 10.9%(+12.8)#1,516 |
| 59. | Manila | 23.3% | 10.5%(+12.8)#59 | 10.9%(+12.5)#1,572 |
| 60. | Mcarthur | 23.3% | 10.5%(+12.8)#60 | 10.9%(+12.5)#1,574 |
| 61. | Indio Hills | 23.2% | 10.5%(+12.7)#61 | 10.9%(+12.3)#1,605 |
| 62. | Willits | 23.0% | 10.5%(+12.4)#62 | 10.9%(+12.1)#1,640 |
| 63. | Happy Valley | 22.9% | 10.5%(+12.4)#63 | 10.9%(+12.0)#1,652 |
| 64. | Dixon Lane Meadow Creek | 22.6% | 10.5%(+12.1)#64 | 10.9%(+11.7)#1,709 |
| 65. | Boulevard | 22.5% | 10.5%(+12.0)#65 | 10.9%(+11.7)#1,731 |
| 66. | Penn Valley | 22.5% | 10.5%(+12.0)#66 | 10.9%(+11.7)#1,737 |
| 67. | Lindcove | 22.2% | 10.5%(+11.7)#67 | 10.9%(+11.4)#1,788 |
| 68. | San Simeon | 22.0% | 10.5%(+11.5)#68 | 10.9%(+11.2)#1,834 |
| 69. | Potter Valley | 21.8% | 10.5%(+11.3)#69 | 10.9%(+10.9)#1,887 |
| 70. | Yermo | 21.7% | 10.5%(+11.2)#70 | 10.9%(+10.8)#1,912 |
| 71. | Valley Home | 21.6% | 10.5%(+11.1)#71 | 10.9%(+10.7)#1,947 |
| 72. | Knights Landing | 21.6% | 10.5%(+11.1)#72 | 10.9%(+10.7)#1,951 |
| 73. | Klamath | 21.5% | 10.5%(+11.0)#73 | 10.9%(+10.6)#1,968 |
| 74. | El Portal | 21.4% | 10.5%(+10.9)#74 | 10.9%(+10.5)#1,999 |
| 75. | Princeton | 21.4% | 10.5%(+10.9)#75 | 10.9%(+10.5)#2,001 |
| 76. | Bieber | 21.2% | 10.5%(+10.7)#76 | 10.9%(+10.4)#2,038 |
| 77. | Grizzly Flats | 21.2% | 10.5%(+10.7)#77 | 10.9%(+10.3)#2,042 |
| 78. | Graeagle | 21.1% | 10.5%(+10.6)#78 | 10.9%(+10.3)#2,071 |
| 79. | Las Lomas | 21.1% | 10.5%(+10.6)#79 | 10.9%(+10.2)#2,075 |
| 80. | Pepperdine University | 20.6% | 10.5%(+10.1)#80 | 10.9%(+9.75)#2,221 |
| 81. | Pumpkin Center | 20.5% | 10.5%(+9.95)#81 | 10.9%(+9.60)#2,260 |
| 82. | University Of California Merced | 20.4% | 10.5%(+9.93)#82 | 10.9%(+9.58)#2,269 |
| 83. | Edwards Afb | 20.4% | 10.5%(+9.89)#83 | 10.9%(+9.54)#2,280 |
| 84. | Fulton | 20.4% | 10.5%(+9.85)#84 | 10.9%(+9.50)#2,294 |
| 85. | Middletown | 20.2% | 10.5%(+9.70)#85 | 10.9%(+9.35)#2,339 |
| 86. | Strathmore | 20.1% | 10.5%(+9.65)#86 | 10.9%(+9.29)#2,353 |
| 87. | Gustine | 20.1% | 10.5%(+9.60)#87 | 10.9%(+9.25)#2,370 |
| 88. | Round Mountain | 20.0% | 10.5%(+9.50)#88 | 10.9%(+9.14)#2,425 |
| 89. | Modjeska | 19.9% | 10.5%(+9.44)#89 | 10.9%(+9.09)#2,454 |
| 90. | Leona Valley | 19.8% | 10.5%(+9.33)#90 | 10.9%(+8.98)#2,486 |
| 91. | Magalia | 19.8% | 10.5%(+9.30)#91 | 10.9%(+8.95)#2,497 |
| 92. | Bear Valley Cdp Alpine County | 19.6% | 10.5%(+9.06)#92 | 10.9%(+8.71)#2,587 |
| 93. | Tuolumne City | 19.3% | 10.5%(+8.81)#93 | 10.9%(+8.45)#2,677 |
| 94. | Santa Fe Springs | 19.2% | 10.5%(+8.70)#94 | 10.9%(+8.35)#2,721 |
| 95. | Corning | 19.1% | 10.5%(+8.64)#95 | 10.9%(+8.29)#2,745 |
| 96. | Camp Pendleton South | 19.1% | 10.5%(+8.63)#96 | 10.9%(+8.28)#2,746 |
| 97. | Doyle | 19.1% | 10.5%(+8.62)#97 | 10.9%(+8.27)#2,750 |
| 98. | Taft Heights | 19.1% | 10.5%(+8.62)#98 | 10.9%(+8.27)#2,754 |
| 99. | East Quincy | 19.1% | 10.5%(+8.60)#99 | 10.9%(+8.25)#2,762 |
| 100. | Lake California | 19.0% | 10.5%(+8.49)#100 | 10.9%(+8.14)#2,808 |
Common Questions
What are the Top 10 Cities with the Highest Percentage of Population Employed in Office & Administration in California?
Top 10 Cities with the Highest Percentage of Population Employed in Office & Administration in California are:
#1
100.0%
#2
76.1%
#3
71.3%
#4
52.5%
#5
49.1%
#6
47.7%
#7
47.0%
#8
46.8%
#9
45.6%
#10
42.5%
What city has the Highest Percentage of Population Employed in Office & Administration in California?
Alleghany has the Highest Percentage of Population Employed in Office & Administration in California with 100.0%.
What is the Percentage of Population Employed in Office & Administration in the State of California?
Percentage of Population Employed in Office & Administration in California is 10.5%.
What is the Percentage of Population Employed in Office & Administration in the United States?
Percentage of Population Employed in Office & Administration in the United States is 10.9%.