Cities with the Highest Percentage of Burmese Population in California
RELATED REPORTS & OPTIONS
Burmese
California
Compare Cities
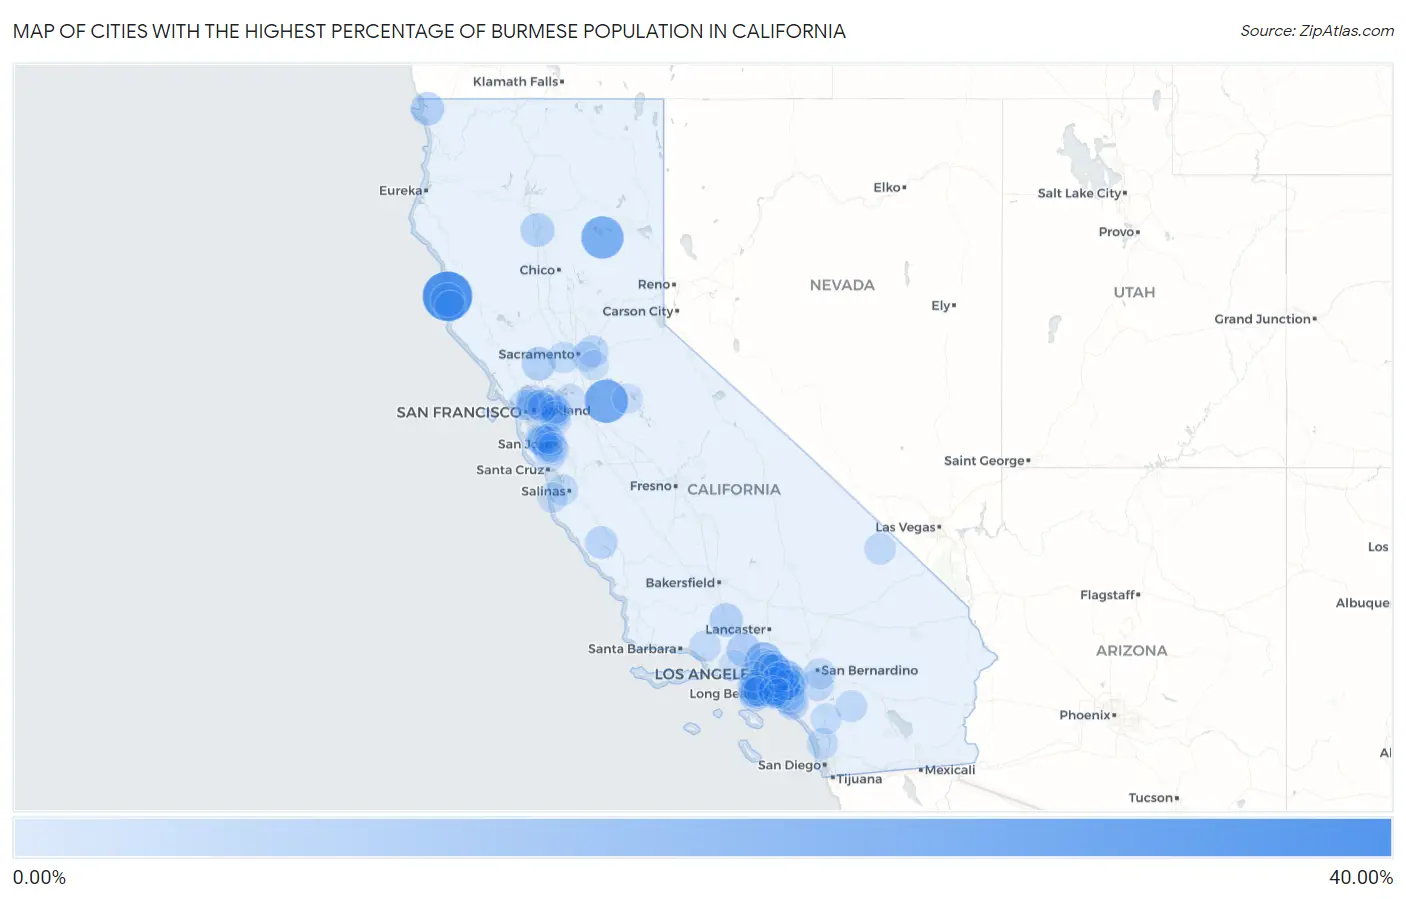
Map of Cities with the Highest Percentage of Burmese Population in California
0.00%
40.00%
Cities with the Highest Percentage of Burmese Population in California
| City | Burmese | vs State | vs National | |
| 1. | Caspar | 38.89% | 1.44%(+37.4)#1 | 0.60%(+38.3)#3 |
| 2. | Farmington | 27.03% | 1.44%(+25.6)#2 | 0.60%(+26.4)#10 |
| 3. | Canyondam | 25.00% | 1.44%(+23.6)#3 | 0.60%(+24.4)#15 |
| 4. | La Crescenta Montrose | 16.41% | 1.44%(+15.0)#4 | 0.60%(+15.8)#33 |
| 5. | La Palma | 15.64% | 1.44%(+14.2)#5 | 0.60%(+15.0)#38 |
| 6. | La Canada Flintridge | 15.04% | 1.44%(+13.6)#6 | 0.60%(+14.4)#42 |
| 7. | Cerritos | 13.20% | 1.44%(+11.8)#7 | 0.60%(+12.6)#53 |
| 8. | Cypress | 13.04% | 1.44%(+11.6)#8 | 0.60%(+12.4)#55 |
| 9. | Fullerton | 12.74% | 1.44%(+11.3)#9 | 0.60%(+12.1)#56 |
| 10. | Buena Park | 12.58% | 1.44%(+11.1)#10 | 0.60%(+12.0)#60 |
| 11. | Brea | 11.84% | 1.44%(+10.4)#11 | 0.60%(+11.2)#63 |
| 12. | San Pasqual | 10.86% | 1.44%(+9.42)#12 | 0.60%(+10.3)#67 |
| 13. | La Mirada | 10.62% | 1.44%(+9.18)#13 | 0.60%(+10.0)#71 |
| 14. | Stevenson Ranch | 9.84% | 1.44%(+8.40)#14 | 0.60%(+9.24)#82 |
| 15. | Diamond Bar | 9.47% | 1.44%(+8.03)#15 | 0.60%(+8.88)#91 |
| 16. | Mendocino | 9.44% | 1.44%(+8.00)#16 | 0.60%(+8.84)#93 |
| 17. | Bend | 9.18% | 1.44%(+7.74)#17 | 0.60%(+8.58)#96 |
| 18. | Moskowite Corner | 8.90% | 1.44%(+7.46)#18 | 0.60%(+8.31)#103 |
| 19. | Lebec | 8.87% | 1.44%(+7.43)#19 | 0.60%(+8.27)#104 |
| 20. | Torrance | 8.76% | 1.44%(+7.32)#20 | 0.60%(+8.16)#106 |
| 21. | Fort Dick | 8.73% | 1.44%(+7.28)#21 | 0.60%(+8.13)#108 |
| 22. | West Carson | 8.35% | 1.44%(+6.90)#22 | 0.60%(+7.75)#118 |
| 23. | Irvine | 7.87% | 1.44%(+6.43)#23 | 0.60%(+7.27)#131 |
| 24. | Rancho Palos Verdes | 7.80% | 1.44%(+6.36)#24 | 0.60%(+7.20)#132 |
| 25. | Rolling Hills Estates | 6.99% | 1.44%(+5.55)#25 | 0.60%(+6.39)#144 |
| 26. | South Pasadena | 6.86% | 1.44%(+5.42)#26 | 0.60%(+6.26)#147 |
| 27. | Lockwood | 6.81% | 1.44%(+5.37)#27 | 0.60%(+6.21)#152 |
| 28. | Laguna Woods | 6.24% | 1.44%(+4.80)#28 | 0.60%(+5.64)#174 |
| 29. | Saranap | 6.08% | 1.44%(+4.64)#29 | 0.60%(+5.48)#182 |
| 30. | Gardena | 5.77% | 1.44%(+4.33)#30 | 0.60%(+5.17)#188 |
| 31. | March Arb | 5.70% | 1.44%(+4.26)#31 | 0.60%(+5.10)#194 |
| 32. | Anza | 5.67% | 1.44%(+4.22)#32 | 0.60%(+5.07)#196 |
| 33. | Rowland Heights | 5.57% | 1.44%(+4.13)#33 | 0.60%(+4.97)#201 |
| 34. | La Habra | 5.57% | 1.44%(+4.12)#34 | 0.60%(+4.97)#202 |
| 35. | Gold River | 5.41% | 1.44%(+3.97)#35 | 0.60%(+4.81)#208 |
| 36. | Tecopa | 5.35% | 1.44%(+3.91)#36 | 0.60%(+4.75)#213 |
| 37. | Artesia | 5.32% | 1.44%(+3.88)#37 | 0.60%(+4.72)#216 |
| 38. | Chino Hills | 5.24% | 1.44%(+3.79)#38 | 0.60%(+4.64)#221 |
| 39. | University Of California Davis | 5.18% | 1.44%(+3.74)#39 | 0.60%(+4.58)#226 |
| 40. | Yorba Linda | 5.12% | 1.44%(+3.68)#40 | 0.60%(+4.52)#228 |
| 41. | Meiners Oaks | 5.06% | 1.44%(+3.62)#41 | 0.60%(+4.46)#235 |
| 42. | Pinon Hills | 4.96% | 1.44%(+3.52)#42 | 0.60%(+4.36)#241 |
| 43. | Tustin | 4.95% | 1.44%(+3.50)#43 | 0.60%(+4.35)#244 |
| 44. | Rancho Santa Fe | 4.71% | 1.44%(+3.27)#44 | 0.60%(+4.12)#264 |
| 45. | Hawaiian Gardens | 4.67% | 1.44%(+3.23)#45 | 0.60%(+4.08)#268 |
| 46. | North El Monte | 4.64% | 1.44%(+3.20)#46 | 0.60%(+4.05)#274 |
| 47. | Seal Beach | 4.62% | 1.44%(+3.18)#47 | 0.60%(+4.03)#276 |
| 48. | San Marino | 4.61% | 1.44%(+3.17)#48 | 0.60%(+4.02)#279 |
| 49. | Pepperdine University | 4.56% | 1.44%(+3.12)#49 | 0.60%(+3.96)#286 |
| 50. | Cupertino | 4.41% | 1.44%(+2.97)#50 | 0.60%(+3.81)#299 |
| 51. | Marina | 4.37% | 1.44%(+2.93)#51 | 0.60%(+3.77)#303 |
| 52. | Emeryville | 4.36% | 1.44%(+2.92)#52 | 0.60%(+3.76)#304 |
| 53. | Rainbow | 4.32% | 1.44%(+2.88)#53 | 0.60%(+3.72)#311 |
| 54. | Albany | 4.31% | 1.44%(+2.87)#54 | 0.60%(+3.72)#313 |
| 55. | Loma Linda | 4.25% | 1.44%(+2.81)#55 | 0.60%(+3.65)#321 |
| 56. | San Ramon | 4.20% | 1.44%(+2.76)#56 | 0.60%(+3.60)#328 |
| 57. | Albion | 4.05% | 1.44%(+2.61)#57 | 0.60%(+3.46)#346 |
| 58. | Stanford | 3.96% | 1.44%(+2.52)#58 | 0.60%(+3.36)#356 |
| 59. | Los Altos | 3.95% | 1.44%(+2.51)#59 | 0.60%(+3.35)#357 |
| 60. | Glendale | 3.94% | 1.44%(+2.50)#60 | 0.60%(+3.34)#359 |
| 61. | Los Altos Hills | 3.93% | 1.44%(+2.49)#61 | 0.60%(+3.34)#362 |
| 62. | Castle Hill | 3.86% | 1.44%(+2.42)#62 | 0.60%(+3.26)#377 |
| 63. | Cambrian Park | 3.83% | 1.44%(+2.39)#63 | 0.60%(+3.23)#383 |
| 64. | Placentia | 3.81% | 1.44%(+2.37)#64 | 0.60%(+3.22)#385 |
| 65. | Walnut | 3.72% | 1.44%(+2.28)#65 | 0.60%(+3.12)#401 |
| 66. | Elfin Forest | 3.70% | 1.44%(+2.26)#66 | 0.60%(+3.10)#406 |
| 67. | Sonoma State University | 3.69% | 1.44%(+2.25)#67 | 0.60%(+3.09)#407 |
| 68. | Palo Alto | 3.56% | 1.44%(+2.11)#68 | 0.60%(+2.96)#432 |
| 69. | Santa Fe Springs | 3.53% | 1.44%(+2.09)#69 | 0.60%(+2.93)#438 |
| 70. | Del Monte Forest | 3.48% | 1.44%(+2.04)#70 | 0.60%(+2.89)#446 |
| 71. | Copperopolis | 3.38% | 1.44%(+1.94)#71 | 0.60%(+2.78)#465 |
| 72. | Danville | 3.33% | 1.44%(+1.89)#72 | 0.60%(+2.73)#475 |
| 73. | Lexington Hills | 3.32% | 1.44%(+1.88)#73 | 0.60%(+2.73)#476 |
| 74. | Redondo Beach | 3.28% | 1.44%(+1.84)#74 | 0.60%(+2.68)#485 |
| 75. | Arcadia | 3.25% | 1.44%(+1.81)#75 | 0.60%(+2.65)#488 |
| 76. | Santa Clara | 3.21% | 1.44%(+1.77)#76 | 0.60%(+2.61)#496 |
| 77. | Tiburon | 3.17% | 1.44%(+1.73)#77 | 0.60%(+2.57)#502 |
| 78. | Pleasanton | 3.12% | 1.44%(+1.68)#78 | 0.60%(+2.53)#509 |
| 79. | University Of California-Santa Barbara | 3.07% | 1.44%(+1.63)#79 | 0.60%(+2.47)#518 |
| 80. | East Richmond Heights | 3.04% | 1.44%(+1.60)#80 | 0.60%(+2.45)#524 |
| 81. | Camino Tassajara | 3.01% | 1.44%(+1.57)#81 | 0.60%(+2.42)#529 |
| 82. | Rosemont | 3.00% | 1.44%(+1.56)#82 | 0.60%(+2.41)#532 |
| 83. | Manhattan Beach | 3.00% | 1.44%(+1.55)#83 | 0.60%(+2.40)#534 |
| 84. | Palos Verdes Estates | 2.99% | 1.44%(+1.55)#84 | 0.60%(+2.39)#537 |
| 85. | Orinda | 2.97% | 1.44%(+1.53)#85 | 0.60%(+2.37)#546 |
| 86. | Los Angeles | 2.94% | 1.44%(+1.50)#86 | 0.60%(+2.34)#552 |
| 87. | Lomita | 2.90% | 1.44%(+1.46)#87 | 0.60%(+2.31)#562 |
| 88. | Wilton | 2.90% | 1.44%(+1.45)#88 | 0.60%(+2.30)#566 |
| 89. | Hacienda Heights | 2.89% | 1.44%(+1.45)#89 | 0.60%(+2.29)#569 |
| 90. | Blackhawk | 2.88% | 1.44%(+1.44)#90 | 0.60%(+2.28)#571 |
| 91. | Los Alamitos | 2.87% | 1.44%(+1.43)#91 | 0.60%(+2.28)#575 |
| 92. | Rancho Mission Viejo | 2.86% | 1.44%(+1.42)#92 | 0.60%(+2.26)#581 |
| 93. | Dublin | 2.85% | 1.44%(+1.41)#93 | 0.60%(+2.25)#584 |
| 94. | Moraga | 2.84% | 1.44%(+1.39)#94 | 0.60%(+2.24)#586 |
| 95. | Saratoga | 2.74% | 1.44%(+1.29)#95 | 0.60%(+2.14)#605 |
| 96. | Campbell | 2.71% | 1.44%(+1.27)#96 | 0.60%(+2.11)#610 |
| 97. | Sunnyvale | 2.61% | 1.44%(+1.16)#97 | 0.60%(+2.01)#642 |
| 98. | Oak Park | 2.60% | 1.44%(+1.16)#98 | 0.60%(+2.00)#645 |
| 99. | Knightsen | 2.55% | 1.44%(+1.11)#99 | 0.60%(+1.95)#662 |
| 100. | Garden Grove | 2.54% | 1.44%(+1.10)#100 | 0.60%(+1.94)#665 |
Common Questions
What are the Top 10 Cities with the Highest Percentage of Burmese Population in California?
Top 10 Cities with the Highest Percentage of Burmese Population in California are:
#1
38.89%
#2
27.03%
#3
25.00%
#4
16.41%
#5
15.64%
#6
13.20%
#7
13.04%
#8
12.74%
#9
12.58%
#10
11.84%
What city has the Highest Percentage of Burmese Population in California?
Caspar has the Highest Percentage of Burmese Population in California with 38.89%.
What is the Percentage of Burmese Population in the State of California?
Percentage of Burmese Population in California is 1.44%.
What is the Percentage of Burmese Population in the United States?
Percentage of Burmese Population in the United States is 0.60%.