Zip Codes with the Highest Percentage of Population Employed in Installation, Maintenance & Repair in Glendora, CA
RELATED REPORTS & OPTIONS
Installation, Maintenance & Repair
Glendora
Compare Zip Codes
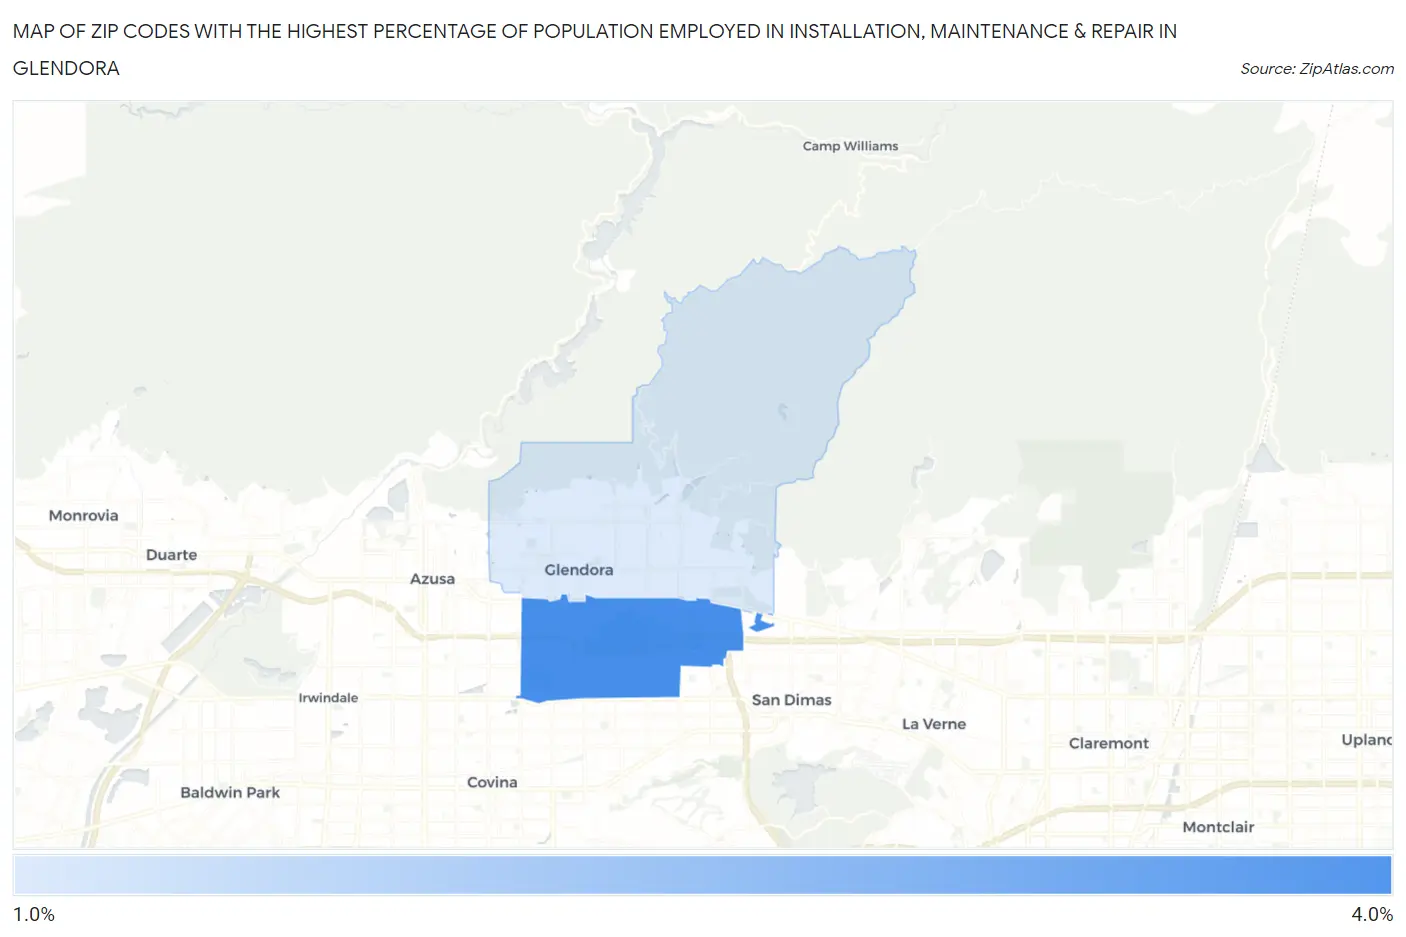
Map of Zip Codes with the Highest Percentage of Population Employed in Installation, Maintenance & Repair in Glendora
1.7%
3.4%
Zip Codes with the Highest Percentage of Population Employed in Installation, Maintenance & Repair in Glendora, CA
| Zip Code | % Employed | vs State | vs National | |
| 1. | 91740 | 3.4% | 2.6%(+0.824)#481 | 3.1%(+0.313)#15,171 |
| 2. | 91741 | 1.7% | 2.6%(-0.902)#1,077 | 3.1%(-1.41)#23,544 |
1
Common Questions
What are the Top Zip Codes with the Highest Percentage of Population Employed in Installation, Maintenance & Repair in Glendora, CA?
Top Zip Codes with the Highest Percentage of Population Employed in Installation, Maintenance & Repair in Glendora, CA are:
What zip code has the Highest Percentage of Population Employed in Installation, Maintenance & Repair in Glendora, CA?
91740 has the Highest Percentage of Population Employed in Installation, Maintenance & Repair in Glendora, CA with 3.4%.
What is the Percentage of Population Employed in Installation, Maintenance & Repair in Glendora, CA?
Percentage of Population Employed in Installation, Maintenance & Repair in Glendora is 2.5%.
What is the Percentage of Population Employed in Installation, Maintenance & Repair in California?
Percentage of Population Employed in Installation, Maintenance & Repair in California is 2.6%.
What is the Percentage of Population Employed in Installation, Maintenance & Repair in the United States?
Percentage of Population Employed in Installation, Maintenance & Repair in the United States is 3.1%.