Yolo, CA Map & Demographics
Yolo Map
Yolo Overview
$16,508
PER CAPITA INCOME
0.27
INEQUALITY / GINI INDEX
281
TOTAL POPULATION
164
MALE POPULATION
117
FEMALE POPULATION
140.17
MALES / 100 FEMALES
71.34
FEMALES / 100 MALES
17.9
MEDIAN AGE
4.4
AVG FAMILY SIZE
3.2
AVG HOUSEHOLD SIZE
99
LABOR FORCE [ PEOPLE ]
64.3%
PERCENT IN LABOR FORCE
Yolo Zip Codes
Income in Yolo
Income Overview in Yolo
| Characteristic | Number | Measure |
| Per Capita Income | 281 | $16,508 |
| Median Family Income | 56 | $0 |
| Mean Family Income | 56 | $41,064 |
| Median Household Income | 89 | $0 |
| Mean Household Income | 89 | $50,424 |
| Income Deficit | 56 | $0 |
| Wage / Income Gap (%) | 281 | 0.00% |
| Wage / Income Gap ($) | 281 | 100.00¢ per $1 |
| Gini / Inequality Index | 281 | 0.27 |
Earnings by Sex in Yolo
| Sex | Number | Average Earnings |
| Male | 41 (41.4%) | $0 |
| Female | 58 (58.6%) | $0 |
| Total | 99 (100.0%) | $0 |
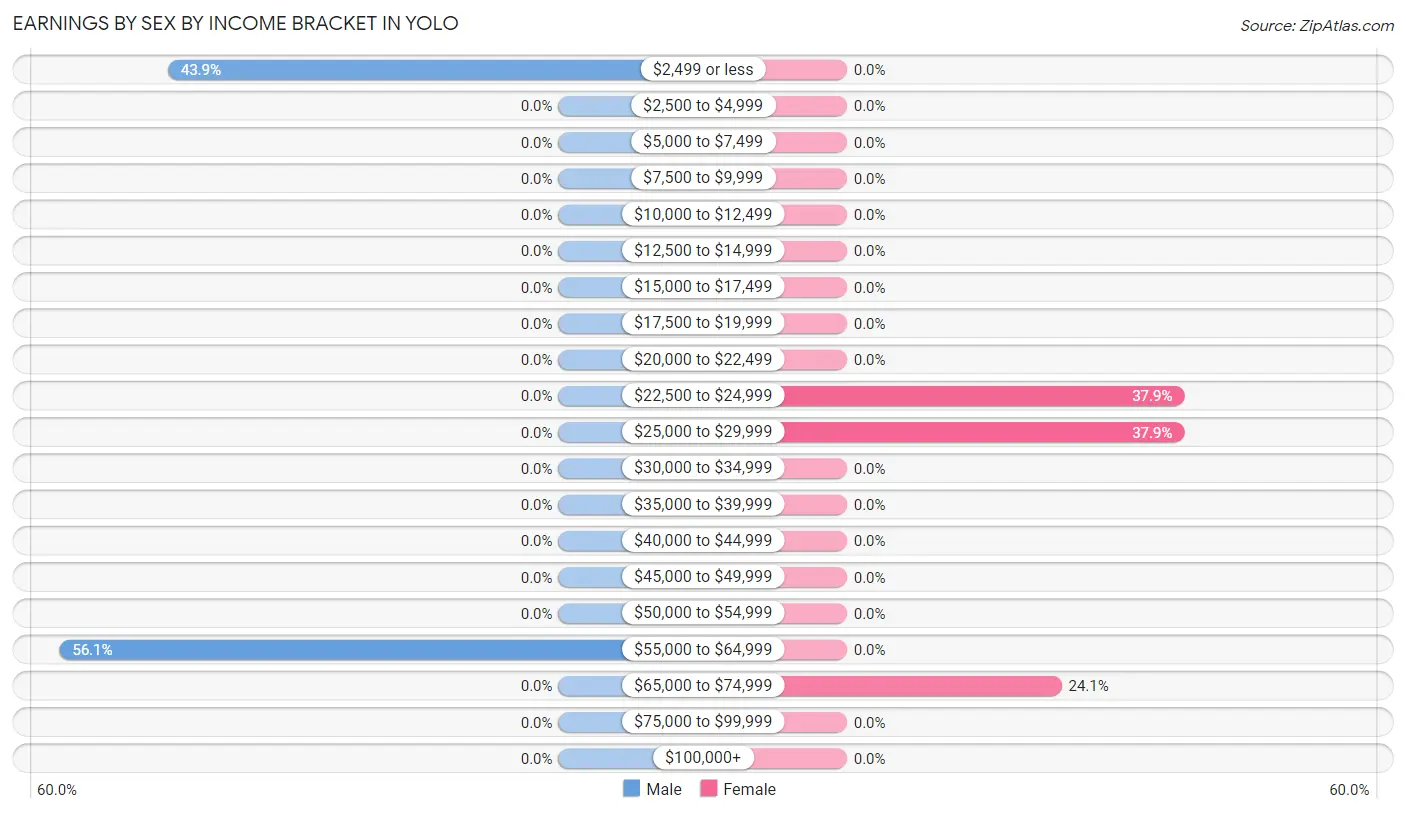
Earnings by Sex by Income Bracket in Yolo
The most common earnings brackets in Yolo are $55,000 to $64,999 for men (23 | 56.1%) and $22,500 to $24,999 for women (22 | 37.9%).
| Income | Male | Female |
| $2,499 or less | 18 (43.9%) | 0 (0.0%) |
| $2,500 to $4,999 | 0 (0.0%) | 0 (0.0%) |
| $5,000 to $7,499 | 0 (0.0%) | 0 (0.0%) |
| $7,500 to $9,999 | 0 (0.0%) | 0 (0.0%) |
| $10,000 to $12,499 | 0 (0.0%) | 0 (0.0%) |
| $12,500 to $14,999 | 0 (0.0%) | 0 (0.0%) |
| $15,000 to $17,499 | 0 (0.0%) | 0 (0.0%) |
| $17,500 to $19,999 | 0 (0.0%) | 0 (0.0%) |
| $20,000 to $22,499 | 0 (0.0%) | 0 (0.0%) |
| $22,500 to $24,999 | 0 (0.0%) | 22 (37.9%) |
| $25,000 to $29,999 | 0 (0.0%) | 22 (37.9%) |
| $30,000 to $34,999 | 0 (0.0%) | 0 (0.0%) |
| $35,000 to $39,999 | 0 (0.0%) | 0 (0.0%) |
| $40,000 to $44,999 | 0 (0.0%) | 0 (0.0%) |
| $45,000 to $49,999 | 0 (0.0%) | 0 (0.0%) |
| $50,000 to $54,999 | 0 (0.0%) | 0 (0.0%) |
| $55,000 to $64,999 | 23 (56.1%) | 0 (0.0%) |
| $65,000 to $74,999 | 0 (0.0%) | 14 (24.1%) |
| $75,000 to $99,999 | 0 (0.0%) | 0 (0.0%) |
| $100,000+ | 0 (0.0%) | 0 (0.0%) |
| Total | 41 (100.0%) | 58 (100.0%) |
Earnings by Sex by Educational Attainment in Yolo
| Educational Attainment | Male Income | Female Income |
| Less than High School | - | - |
| High School Diploma | - | - |
| College or Associate's Degree | - | - |
| Bachelor's Degree | - | - |
| Graduate Degree | - | - |
| Total | - | - |
Family Income in Yolo
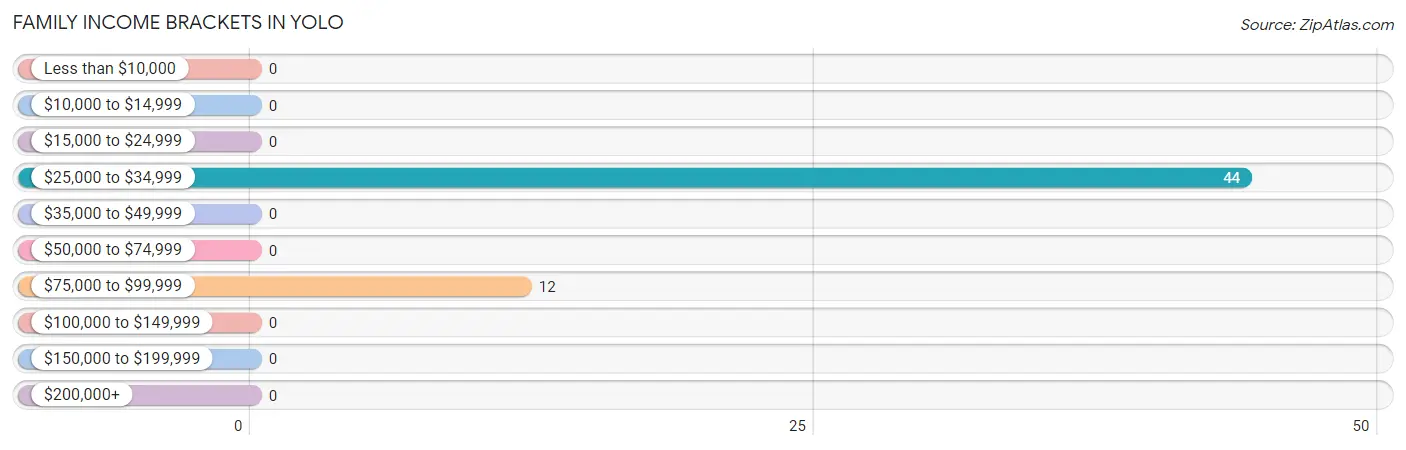
Family Income Brackets in Yolo
According to the Yolo family income data, there are 44 families falling into the $25,000 to $34,999 income range, which is the most common income bracket and makes up 78.6% of all families.
| Income Bracket | # Families | % Families |
| Less than $10,000 | 0 | 0.0% |
| $10,000 to $14,999 | 0 | 0.0% |
| $15,000 to $24,999 | 0 | 0.0% |
| $25,000 to $34,999 | 44 | 78.6% |
| $35,000 to $49,999 | 0 | 0.0% |
| $50,000 to $74,999 | 0 | 0.0% |
| $75,000 to $99,999 | 12 | 21.4% |
| $100,000 to $149,999 | 0 | 0.0% |
| $150,000 to $199,999 | 0 | 0.0% |
| $200,000+ | 0 | 0.0% |
Family Income by Famaliy Size in Yolo
| Income Bracket | # Families | Median Income |
| 2-Person Families | 0 (0.0%) | $0 |
| 3-Person Families | 0 (0.0%) | $0 |
| 4-Person Families | 34 (60.7%) | $0 |
| 5-Person Families | 22 (39.3%) | $0 |
| 6-Person Families | 0 (0.0%) | $0 |
| 7+ Person Families | 0 (0.0%) | $0 |
| Total | 56 (100.0%) | $0 |
Family Income by Number of Earners in Yolo
| Number of Earners | # Families | Median Income |
| No Earners | 0 (0.0%) | $0 |
| 1 Earner | 44 (78.6%) | $0 |
| 2 Earners | 12 (21.4%) | $0 |
| 3+ Earners | 0 (0.0%) | $0 |
| Total | 56 (100.0%) | $0 |
Household Income in Yolo
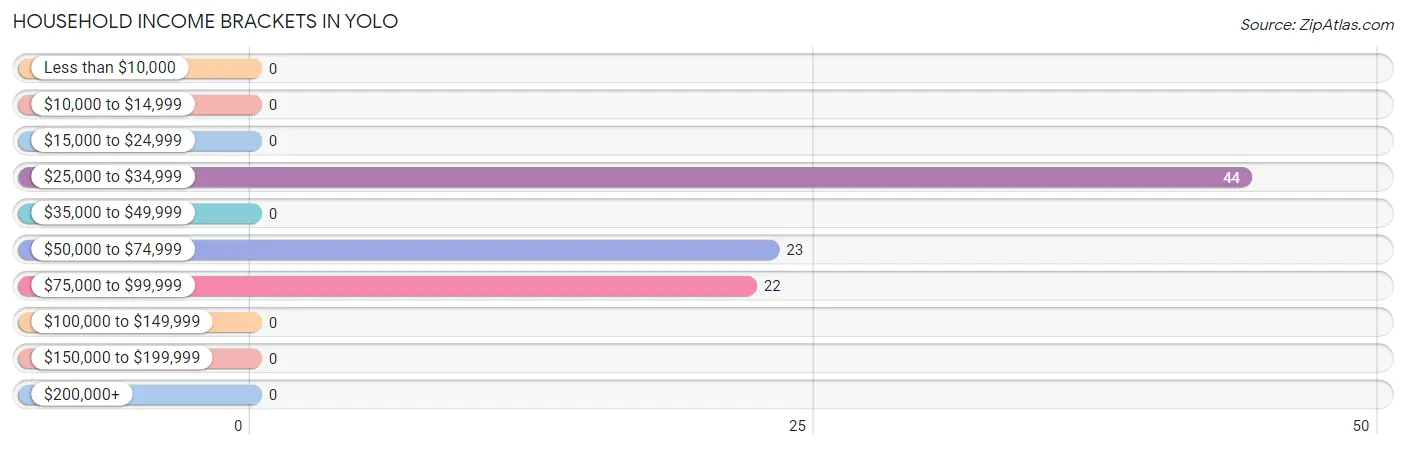
Household Income Brackets in Yolo
With 44 households falling in the category, the $25,000 to $34,999 income range is the most frequent in Yolo, accounting for 49.4% of all households.
| Income Bracket | # Households | % Households |
| Less than $10,000 | 0 | 0.0% |
| $10,000 to $14,999 | 0 | 0.0% |
| $15,000 to $24,999 | 0 | 0.0% |
| $25,000 to $34,999 | 44 | 49.4% |
| $35,000 to $49,999 | 0 | 0.0% |
| $50,000 to $74,999 | 23 | 25.8% |
| $75,000 to $99,999 | 22 | 24.7% |
| $100,000 to $149,999 | 0 | 0.0% |
| $150,000 to $199,999 | 0 | 0.0% |
| $200,000+ | 0 | 0.0% |
Household Income by Householder Age in Yolo
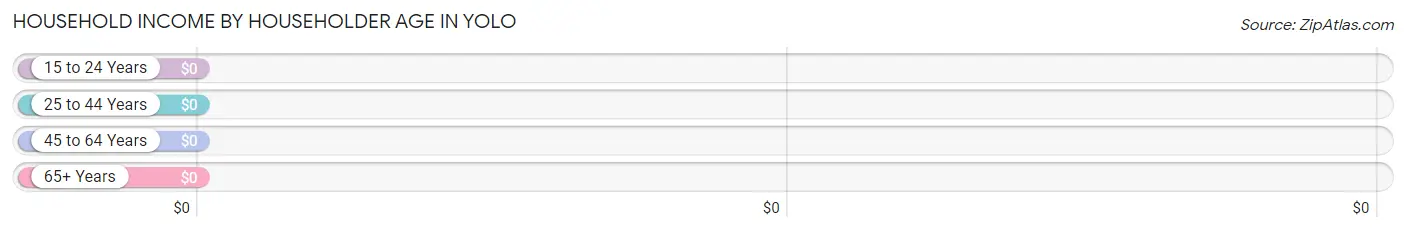
| Income Bracket | # Households | Median Income |
| 15 to 24 Years | 23 (25.8%) | $0 |
| 25 to 44 Years | 44 (49.4%) | $0 |
| 45 to 64 Years | 0 (0.0%) | $0 |
| 65+ Years | 22 (24.7%) | $0 |
| Total | 89 (100.0%) | $0 |
Poverty in Yolo
Income Below Poverty by Sex and Age in Yolo
With 61.6% poverty level for males and 75.2% for females among the residents of Yolo, 6 to 11 year old males and under 5 year old females are the most vulnerable to poverty, with 23 males (100.0%) and 21 females (100.0%) in their respective age groups living below the poverty level.
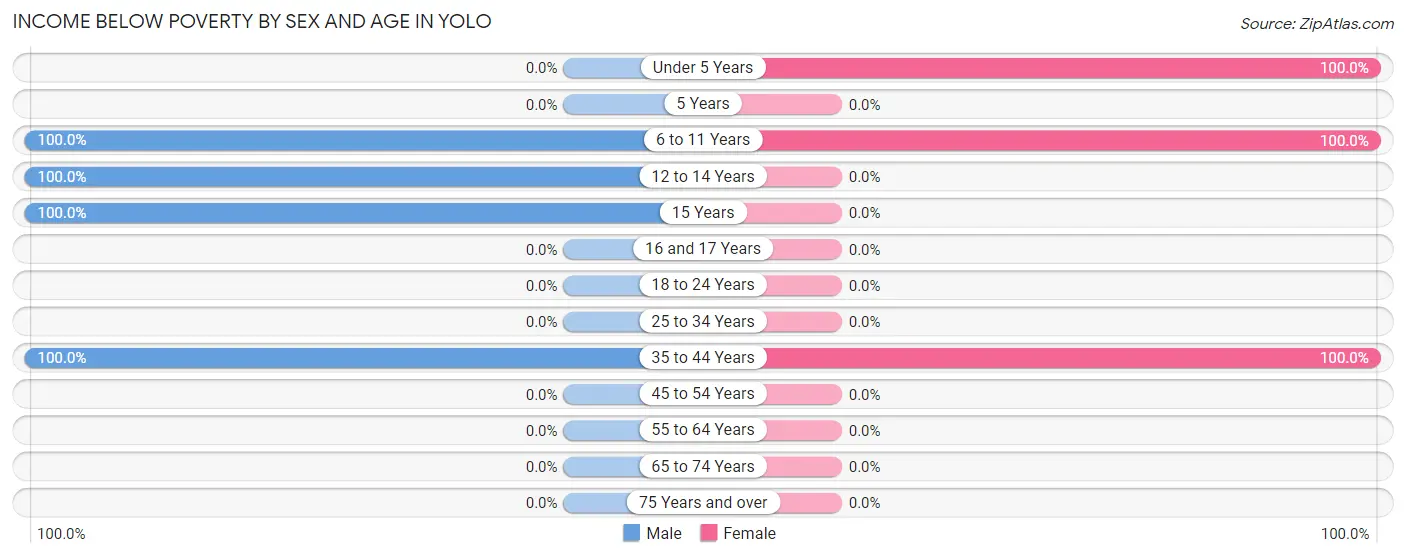
| Age Bracket | Male | Female |
| Under 5 Years | 0 (0.0%) | 21 (100.0%) |
| 5 Years | 0 (0.0%) | 0 (0.0%) |
| 6 to 11 Years | 23 (100.0%) | 23 (100.0%) |
| 12 to 14 Years | 23 (100.0%) | 0 (0.0%) |
| 15 Years | 37 (100.0%) | 0 (0.0%) |
| 16 and 17 Years | 0 (0.0%) | 0 (0.0%) |
| 18 to 24 Years | 0 (0.0%) | 0 (0.0%) |
| 25 to 34 Years | 0 (0.0%) | 0 (0.0%) |
| 35 to 44 Years | 18 (100.0%) | 44 (100.0%) |
| 45 to 54 Years | 0 (0.0%) | 0 (0.0%) |
| 55 to 64 Years | 0 (0.0%) | 0 (0.0%) |
| 65 to 74 Years | 0 (0.0%) | 0 (0.0%) |
| 75 Years and over | 0 (0.0%) | 0 (0.0%) |
| Total | 101 (61.6%) | 88 (75.2%) |
Income Above Poverty by Sex and Age in Yolo
According to the poverty statistics in Yolo, males aged 18 to 24 years and females aged 16 and 17 years are the age groups that are most secure financially, with 100.0% of males and 100.0% of females in these age groups living above the poverty line.
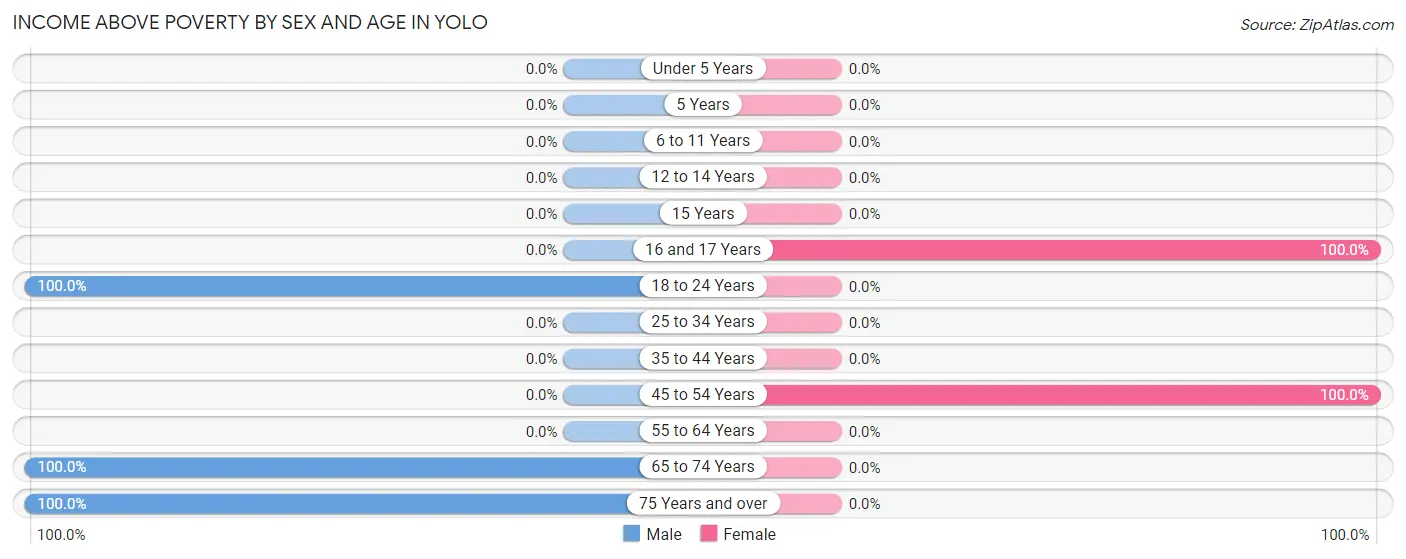
| Age Bracket | Male | Female |
| Under 5 Years | 0 (0.0%) | 0 (0.0%) |
| 5 Years | 0 (0.0%) | 0 (0.0%) |
| 6 to 11 Years | 0 (0.0%) | 0 (0.0%) |
| 12 to 14 Years | 0 (0.0%) | 0 (0.0%) |
| 15 Years | 0 (0.0%) | 0 (0.0%) |
| 16 and 17 Years | 0 (0.0%) | 15 (100.0%) |
| 18 to 24 Years | 41 (100.0%) | 0 (0.0%) |
| 25 to 34 Years | 0 (0.0%) | 0 (0.0%) |
| 35 to 44 Years | 0 (0.0%) | 0 (0.0%) |
| 45 to 54 Years | 0 (0.0%) | 14 (100.0%) |
| 55 to 64 Years | 0 (0.0%) | 0 (0.0%) |
| 65 to 74 Years | 10 (100.0%) | 0 (0.0%) |
| 75 Years and over | 12 (100.0%) | 0 (0.0%) |
| Total | 63 (38.4%) | 29 (24.8%) |
Income Below Poverty Among Married-Couple Families in Yolo
The poverty statistics for married-couple families in Yolo show that 100.0% or 22 of the total 22 families live below the poverty line. Families with 1 or 2 children have the highest poverty rate of 100.0%, comprising of 22 families. On the other hand, families with 1 or 2 children have the lowest poverty rate of 100.0%, which includes 22 families.
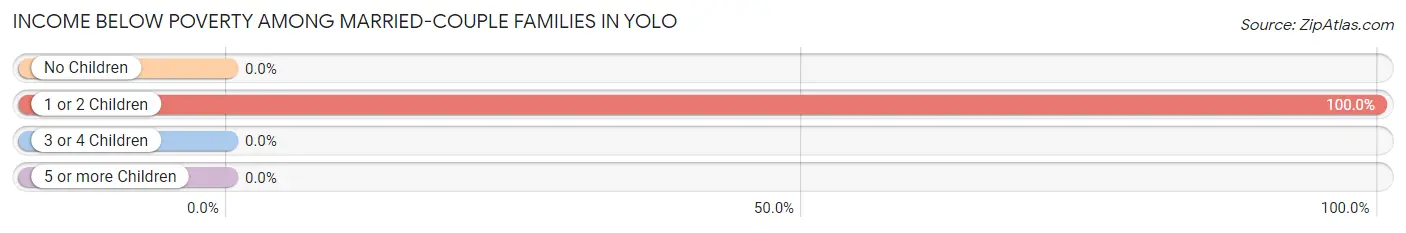
| Children | Above Poverty | Below Poverty |
| No Children | 0 (0.0%) | 0 (0.0%) |
| 1 or 2 Children | 0 (0.0%) | 22 (100.0%) |
| 3 or 4 Children | 0 (0.0%) | 0 (0.0%) |
| 5 or more Children | 0 (0.0%) | 0 (0.0%) |
| Total | 0 (0.0%) | 22 (100.0%) |
Income Below Poverty Among Single-Parent Households in Yolo
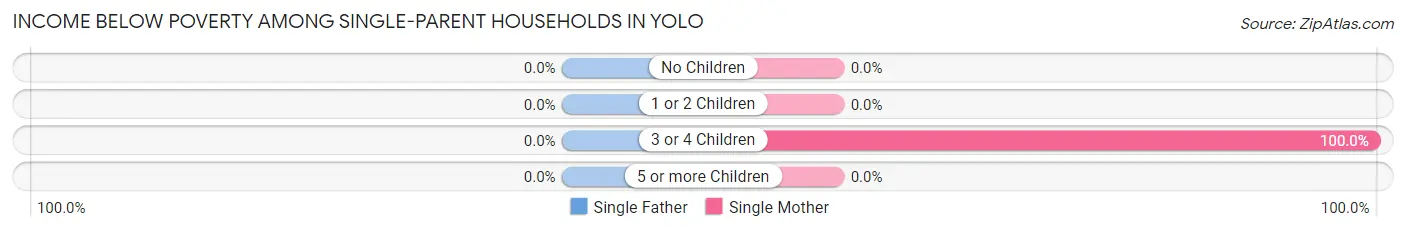
| Children | Single Father | Single Mother |
| No Children | 0 (0.0%) | 0 (0.0%) |
| 1 or 2 Children | 0 (0.0%) | 0 (0.0%) |
| 3 or 4 Children | 0 (0.0%) | 22 (100.0%) |
| 5 or more Children | 0 (0.0%) | 0 (0.0%) |
| Total | 0 (0.0%) | 22 (100.0%) |
Income Below Poverty Among Married-Couple vs Single-Parent Households in Yolo
The poverty data for Yolo shows that 22 of the married-couple family households (100.0%) and 22 of the single-parent households (64.7%) are living below the poverty level. Within the married-couple family households, those with 1 or 2 children have the highest poverty rate, with 22 households (100.0%) falling below the poverty line. Among the single-parent households, those with 3 or 4 children have the highest poverty rate, with 22 household (100.0%) living below poverty.
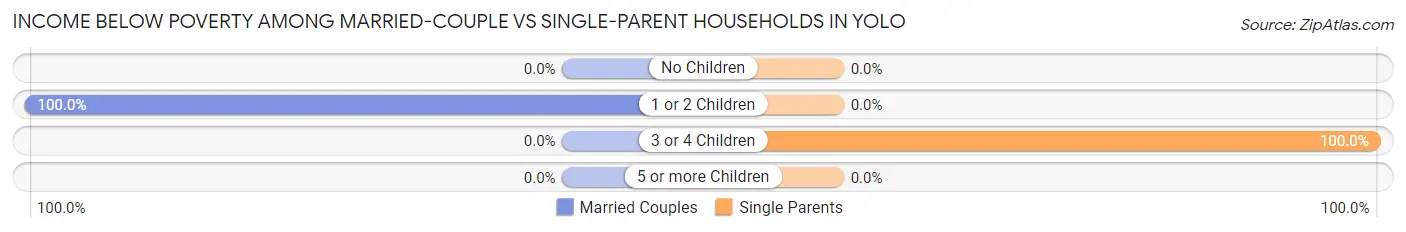
| Children | Married-Couple Families | Single-Parent Households |
| No Children | 0 (0.0%) | 0 (0.0%) |
| 1 or 2 Children | 22 (100.0%) | 0 (0.0%) |
| 3 or 4 Children | 0 (0.0%) | 22 (100.0%) |
| 5 or more Children | 0 (0.0%) | 0 (0.0%) |
| Total | 22 (100.0%) | 22 (64.7%) |
Race in Yolo
The most populous races in Yolo are Hispanic or Latino (263 | 93.6%), White / Caucasian (174 | 61.9%), and Some other Race (107 | 38.1%).
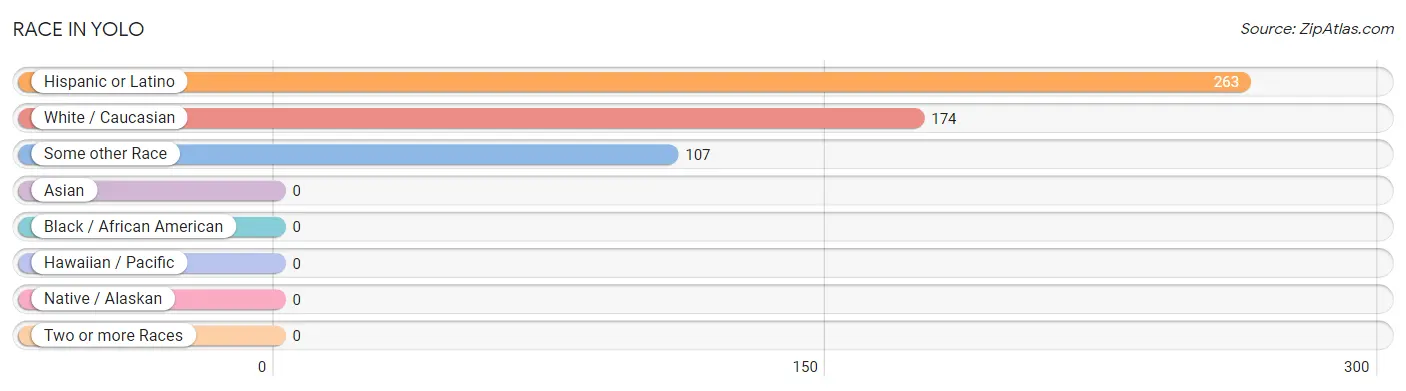
| Race | # Population | % Population |
| Asian | 0 | 0.0% |
| Black / African American | 0 | 0.0% |
| Hawaiian / Pacific | 0 | 0.0% |
| Hispanic or Latino | 263 | 93.6% |
| Native / Alaskan | 0 | 0.0% |
| White / Caucasian | 174 | 61.9% |
| Two or more Races | 0 | 0.0% |
| Some other Race | 107 | 38.1% |
| Total | 281 | 100.0% |
Ancestry in Yolo
The most populous ancestries reported in Yolo are Mexican (253 | 90.0%), Arab (18 | 6.4%), Scottish (10 | 3.6%), and Spaniard (10 | 3.6%), together accounting for 103.6% of all Yolo residents.
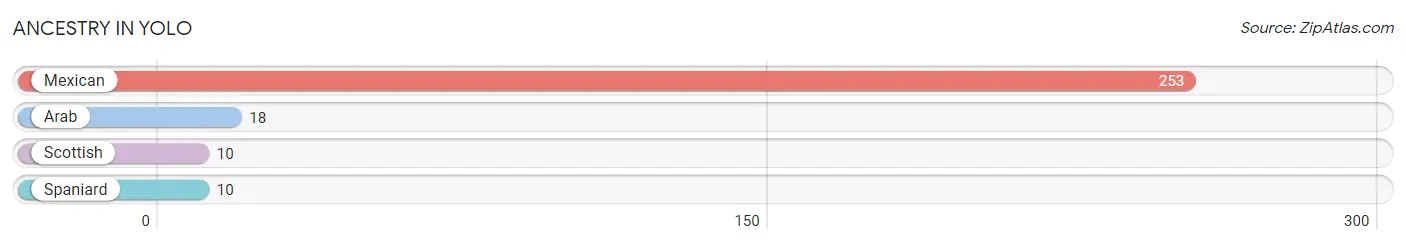
| Ancestry | # Population | % Population |
| Arab | 18 | 6.4% |
| Mexican | 253 | 90.0% |
| Scottish | 10 | 3.6% |
| Spaniard | 10 | 3.6% | View All 4 Rows |
Immigrants in Yolo
The most numerous immigrant groups reported in Yolo came from Central America (22 | 7.8%), Latin America (22 | 7.8%), Mexico (22 | 7.8%), Asia (18 | 6.4%), and Jordan (18 | 6.4%), together accounting for 36.3% of all Yolo residents.
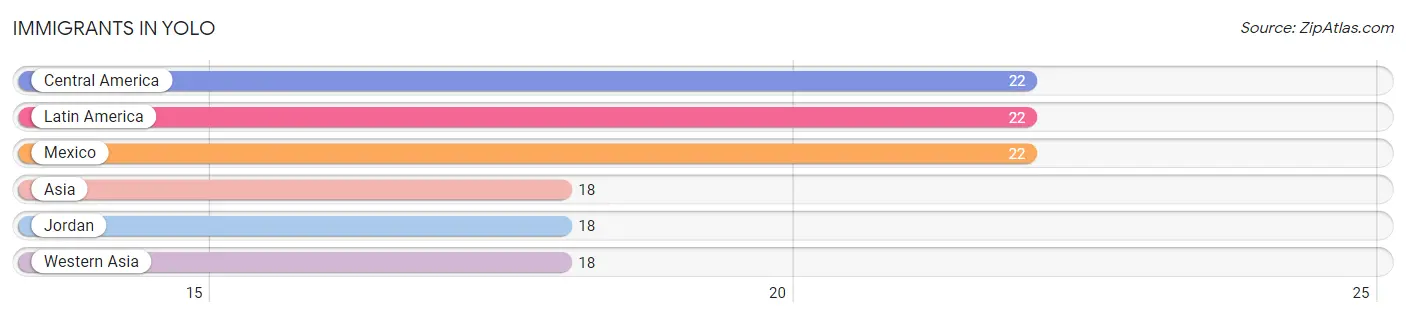
| Immigration Origin | # Population | % Population |
| Asia | 18 | 6.4% |
| Central America | 22 | 7.8% |
| Jordan | 18 | 6.4% |
| Latin America | 22 | 7.8% |
| Mexico | 22 | 7.8% |
| Western Asia | 18 | 6.4% | View All 6 Rows |
Sex and Age in Yolo
Sex and Age in Yolo
The most populous age groups in Yolo are 10 to 14 Years (46 | 28.1%) for men and 35 to 39 Years (44 | 37.6%) for women.
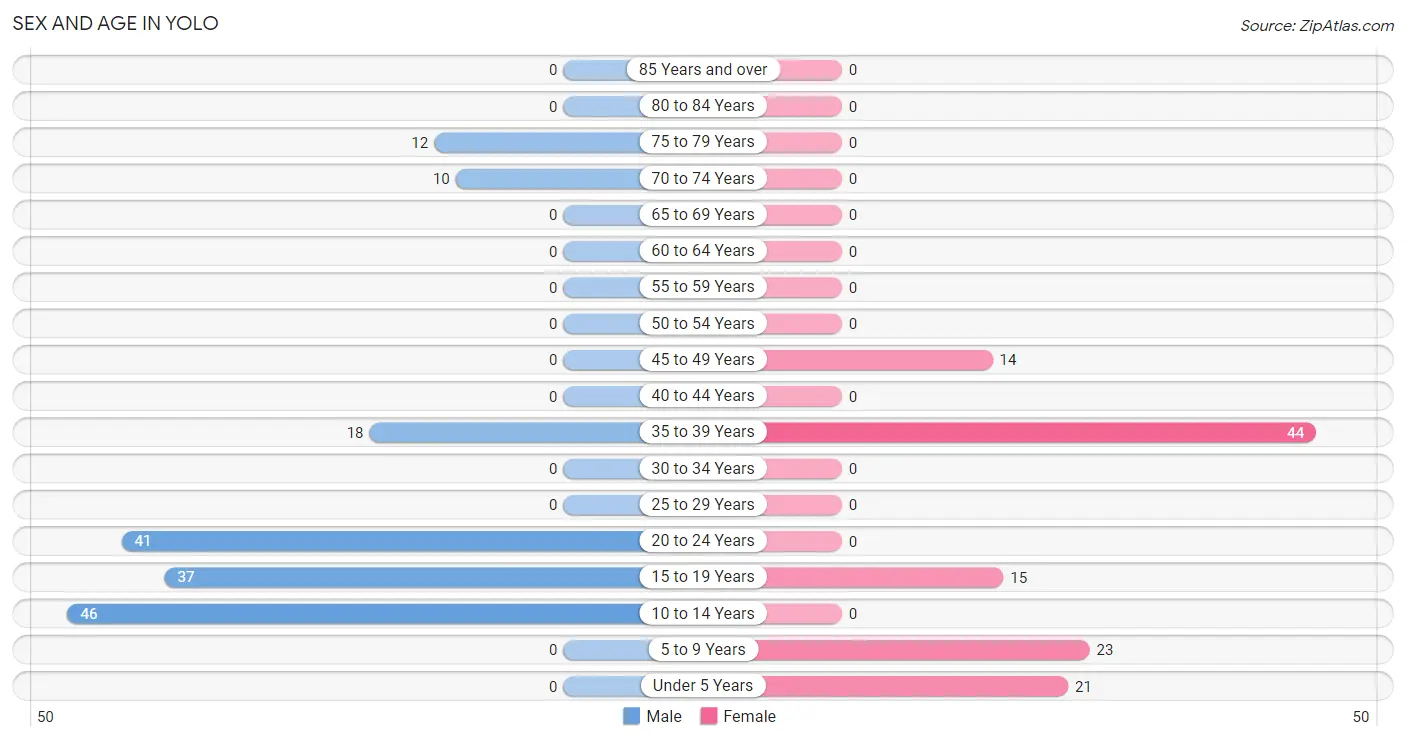
| Age Bracket | Male | Female |
| Under 5 Years | 0 (0.0%) | 21 (17.9%) |
| 5 to 9 Years | 0 (0.0%) | 23 (19.7%) |
| 10 to 14 Years | 46 (28.1%) | 0 (0.0%) |
| 15 to 19 Years | 37 (22.6%) | 15 (12.8%) |
| 20 to 24 Years | 41 (25.0%) | 0 (0.0%) |
| 25 to 29 Years | 0 (0.0%) | 0 (0.0%) |
| 30 to 34 Years | 0 (0.0%) | 0 (0.0%) |
| 35 to 39 Years | 18 (11.0%) | 44 (37.6%) |
| 40 to 44 Years | 0 (0.0%) | 0 (0.0%) |
| 45 to 49 Years | 0 (0.0%) | 14 (12.0%) |
| 50 to 54 Years | 0 (0.0%) | 0 (0.0%) |
| 55 to 59 Years | 0 (0.0%) | 0 (0.0%) |
| 60 to 64 Years | 0 (0.0%) | 0 (0.0%) |
| 65 to 69 Years | 0 (0.0%) | 0 (0.0%) |
| 70 to 74 Years | 10 (6.1%) | 0 (0.0%) |
| 75 to 79 Years | 12 (7.3%) | 0 (0.0%) |
| 80 to 84 Years | 0 (0.0%) | 0 (0.0%) |
| 85 Years and over | 0 (0.0%) | 0 (0.0%) |
| Total | 164 (100.0%) | 117 (100.0%) |
Families and Households in Yolo
Median Family Size in Yolo
The median family size in Yolo is 4.43 persons per family, with single male/father families (12 | 21.4%) accounting for the largest median family size of 4.92 persons per family. On the other hand, married-couple families (22 | 39.3%) represent the smallest median family size with 3.73 persons per family.
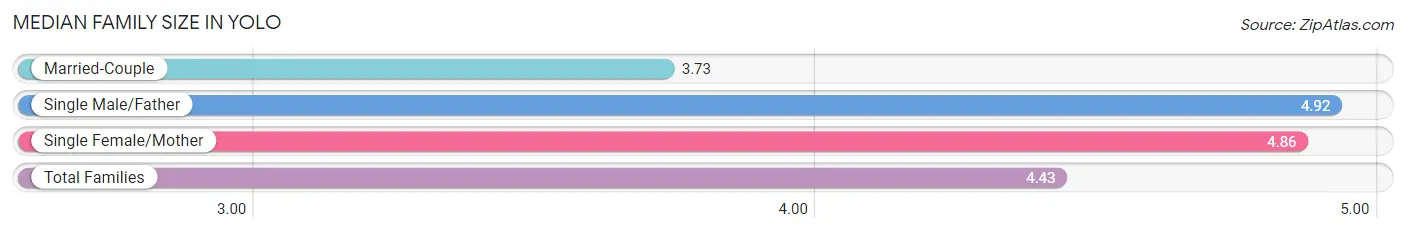
| Family Type | # Families | Family Size |
| Married-Couple | 22 (39.3%) | 3.73 |
| Single Male/Father | 12 (21.4%) | 4.92 |
| Single Female/Mother | 22 (39.3%) | 4.86 |
| Total Families | 56 (100.0%) | 4.43 |
Median Household Size in Yolo
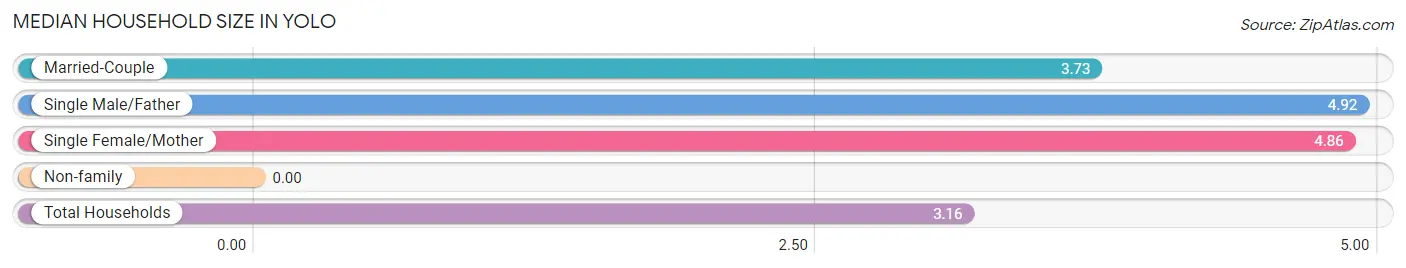
| Household Type | # Households | Household Size |
| Married-Couple | 22 (24.7%) | 3.73 |
| Single Male/Father | 12 (13.5%) | 4.92 |
| Single Female/Mother | 22 (24.7%) | 4.86 |
| Non-family | 33 (37.1%) | - |
| Total Households | 89 (100.0%) | 3.16 |
Household Size by Marriage Status in Yolo
Out of a total of 89 households in Yolo, 56 (62.9%) are family households, while 33 (37.1%) are nonfamily households. The most numerous type of family households are 4-person households, comprising 34, and the most common type of nonfamily households are 1-person households, comprising 33.
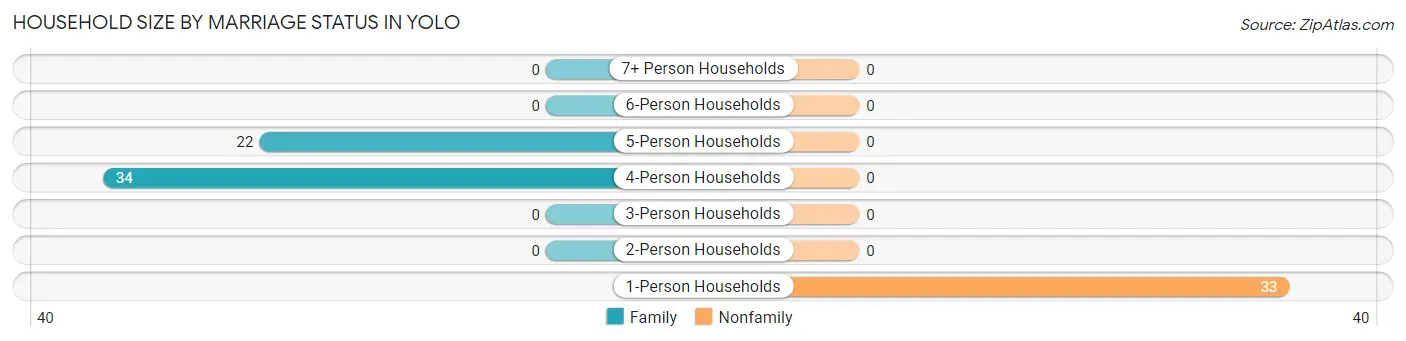
| Household Size | Family Households | Nonfamily Households |
| 1-Person Households | - | 33 (37.1%) |
| 2-Person Households | 0 (0.0%) | 0 (0.0%) |
| 3-Person Households | 0 (0.0%) | 0 (0.0%) |
| 4-Person Households | 34 (38.2%) | 0 (0.0%) |
| 5-Person Households | 22 (24.7%) | 0 (0.0%) |
| 6-Person Households | 0 (0.0%) | 0 (0.0%) |
| 7+ Person Households | 0 (0.0%) | 0 (0.0%) |
| Total | 56 (62.9%) | 33 (37.1%) |
Female Fertility in Yolo
Fertility by Age in Yolo
| Age Bracket | Women with Births | Births / 1,000 Women |
| 15 to 19 years | 0 (0.0%) | 0.0 |
| 20 to 34 years | 0 (0.0%) | 0.0 |
| 35 to 50 years | 0 (0.0%) | 0.0 |
| Total | 0 (0.0%) | 0.0 |
Fertility by Age by Marriage Status in Yolo
| Age Bracket | Married | Unmarried |
| 15 to 19 years | 0 (0.0%) | 0 (0.0%) |
| 20 to 34 years | 0 (0.0%) | 0 (0.0%) |
| 35 to 50 years | 0 (0.0%) | 0 (0.0%) |
| Total | 0 (0.0%) | 0 (0.0%) |
Fertility by Education in Yolo
| Educational Attainment | Women with Births | Births / 1,000 Women |
| Less than High School | 0 (0.0%) | 0.0 |
| High School Diploma | 0 (0.0%) | 0.0 |
| College or Associate's Degree | 0 (0.0%) | 0.0 |
| Bachelor's Degree | 0 (0.0%) | 0.0 |
| Graduate Degree | 0 (0.0%) | 0.0 |
| Total | 0 (0.0%) | 0.0 |
Fertility by Education by Marriage Status in Yolo
| Educational Attainment | Married | Unmarried |
| Less than High School | 0 (0.0%) | 0 (0.0%) |
| High School Diploma | 0 (0.0%) | 0 (0.0%) |
| College or Associate's Degree | 0 (0.0%) | 0 (0.0%) |
| Bachelor's Degree | 0 (0.0%) | 0 (0.0%) |
| Graduate Degree | 0 (0.0%) | 0 (0.0%) |
| Total | 0 (0.0%) | 0 (0.0%) |
Employment Characteristics in Yolo
Employment by Class of Employer in Yolo
Among the 99 employed individuals in Yolo, , and private company employees (99 | 100.0%) make up the most common classes of employment.
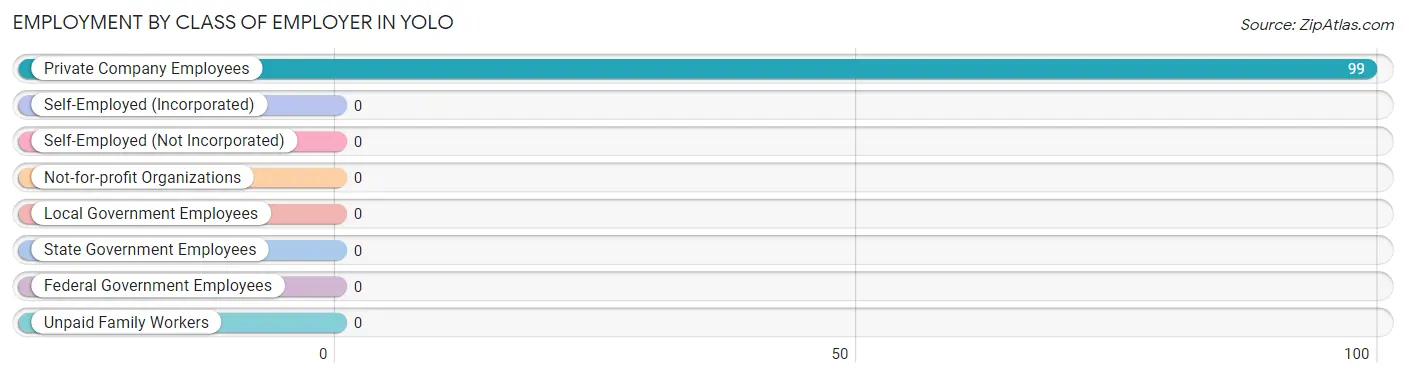
| Employer Class | # Employees | % Employees |
| Private Company Employees | 99 | 100.0% |
| Self-Employed (Incorporated) | 0 | 0.0% |
| Self-Employed (Not Incorporated) | 0 | 0.0% |
| Not-for-profit Organizations | 0 | 0.0% |
| Local Government Employees | 0 | 0.0% |
| State Government Employees | 0 | 0.0% |
| Federal Government Employees | 0 | 0.0% |
| Unpaid Family Workers | 0 | 0.0% |
| Total | 99 | 100.0% |
Employment Status by Age in Yolo
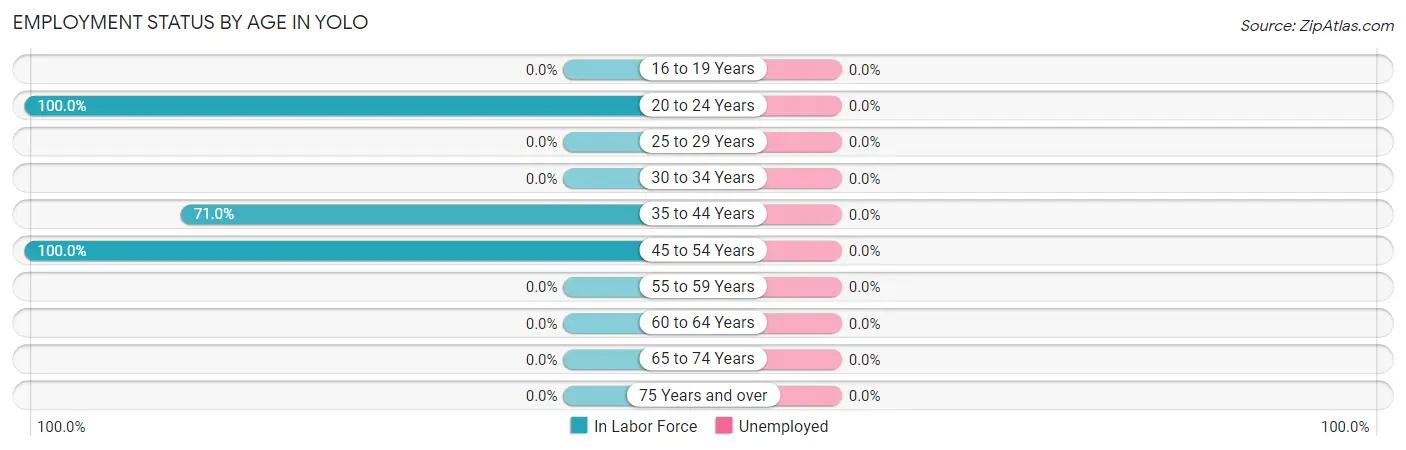
| Age Bracket | In Labor Force | Unemployed |
| 16 to 19 Years | 0 (0.0%) | 0 (0.0%) |
| 20 to 24 Years | 41 (100.0%) | 0 (0.0%) |
| 25 to 29 Years | 0 (0.0%) | 0 (0.0%) |
| 30 to 34 Years | 0 (0.0%) | 0 (0.0%) |
| 35 to 44 Years | 44 (71.0%) | 0 (0.0%) |
| 45 to 54 Years | 14 (100.0%) | 0 (0.0%) |
| 55 to 59 Years | 0 (0.0%) | 0 (0.0%) |
| 60 to 64 Years | 0 (0.0%) | 0 (0.0%) |
| 65 to 74 Years | 0 (0.0%) | 0 (0.0%) |
| 75 Years and over | 0 (0.0%) | 0 (0.0%) |
| Total | 99 (64.3%) | 0 (0.0%) |
Employment Status by Educational Attainment in Yolo
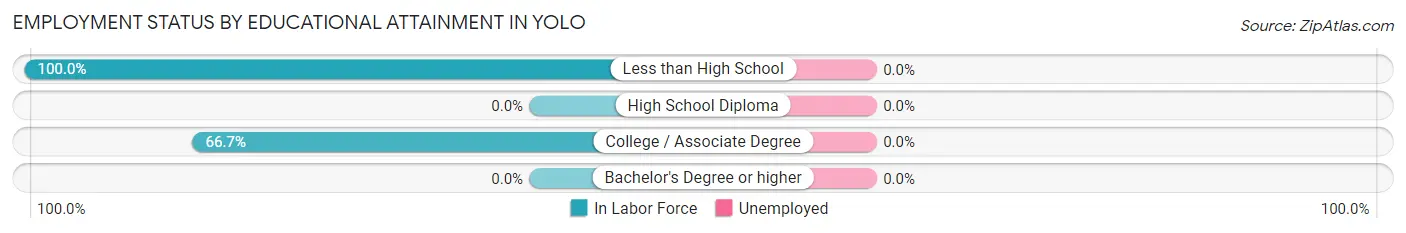
| Educational Attainment | In Labor Force | Unemployed |
| Less than High School | 22 (100.0%) | 0 (0.0%) |
| High School Diploma | 0 (0.0%) | 0 (0.0%) |
| College / Associate Degree | 36 (66.7%) | 0 (0.0%) |
| Bachelor's Degree or higher | 0 (0.0%) | 0 (0.0%) |
| Total | 58 (76.3%) | 0 (0.0%) |
Employment Occupations by Sex in Yolo
Management, Business, Science and Arts Occupations
The most common Management, Business, Science and Arts occupations in Yolo are Health Diagnosing & Treating (14 | 14.1%), and Health Technologists (14 | 14.1%).
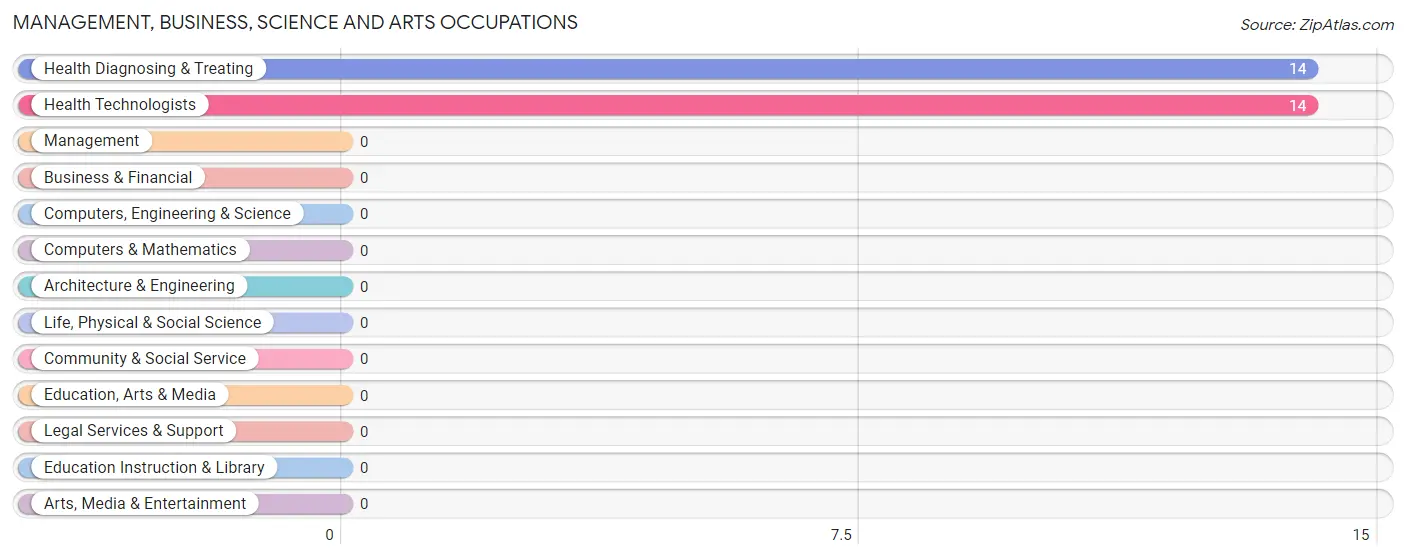
Management, Business, Science and Arts Occupations by Sex
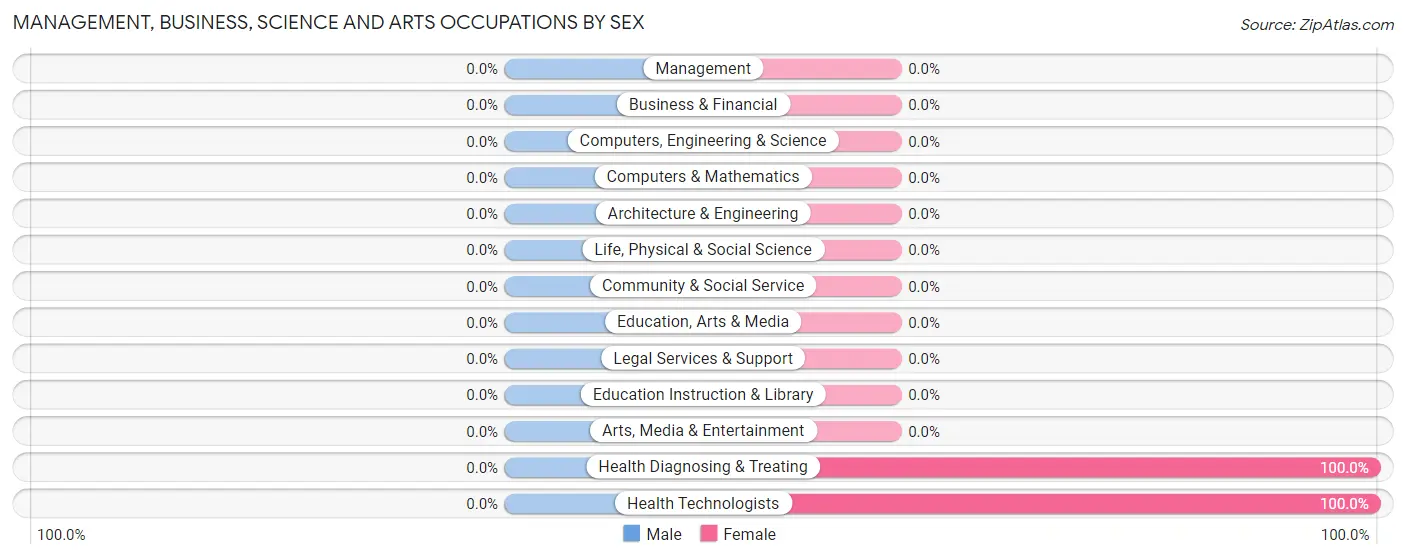
| Occupation | Male | Female |
| Management | 0 (0.0%) | 0 (0.0%) |
| Business & Financial | 0 (0.0%) | 0 (0.0%) |
| Computers, Engineering & Science | 0 (0.0%) | 0 (0.0%) |
| Computers & Mathematics | 0 (0.0%) | 0 (0.0%) |
| Architecture & Engineering | 0 (0.0%) | 0 (0.0%) |
| Life, Physical & Social Science | 0 (0.0%) | 0 (0.0%) |
| Community & Social Service | 0 (0.0%) | 0 (0.0%) |
| Education, Arts & Media | 0 (0.0%) | 0 (0.0%) |
| Legal Services & Support | 0 (0.0%) | 0 (0.0%) |
| Education Instruction & Library | 0 (0.0%) | 0 (0.0%) |
| Arts, Media & Entertainment | 0 (0.0%) | 0 (0.0%) |
| Health Diagnosing & Treating | 0 (0.0%) | 14 (100.0%) |
| Health Technologists | 0 (0.0%) | 14 (100.0%) |
| Total (Category) | 0 (0.0%) | 14 (100.0%) |
| Total (Overall) | 41 (41.4%) | 58 (58.6%) |
Services Occupations
The most common Services occupations in Yolo are Healthcare Support (22 | 22.2%), and Cleaning & Maintenance (22 | 22.2%).
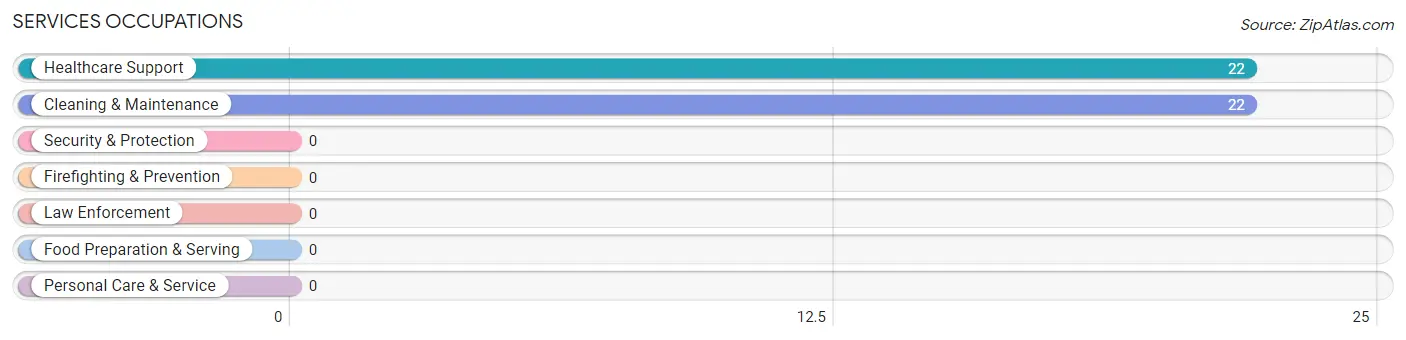
Services Occupations by Sex
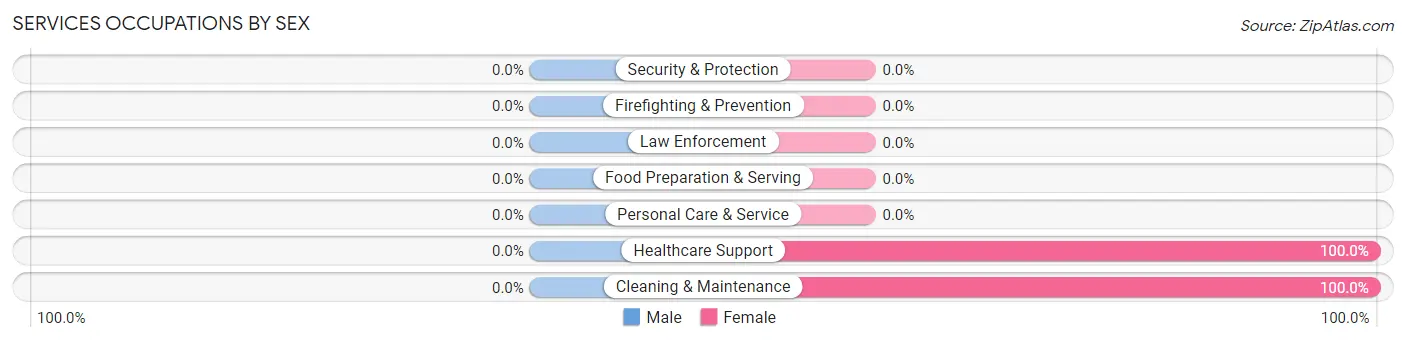
| Occupation | Male | Female |
| Healthcare Support | 0 (0.0%) | 22 (100.0%) |
| Security & Protection | 0 (0.0%) | 0 (0.0%) |
| Firefighting & Prevention | 0 (0.0%) | 0 (0.0%) |
| Law Enforcement | 0 (0.0%) | 0 (0.0%) |
| Food Preparation & Serving | 0 (0.0%) | 0 (0.0%) |
| Cleaning & Maintenance | 0 (0.0%) | 22 (100.0%) |
| Personal Care & Service | 0 (0.0%) | 0 (0.0%) |
| Total (Category) | 0 (0.0%) | 44 (100.0%) |
| Total (Overall) | 41 (41.4%) | 58 (58.6%) |
Sales and Office Occupations
Sales and Office Occupations by Sex
| Occupation | Male | Female |
| Sales & Related | 0 (0.0%) | 0 (0.0%) |
| Office & Administration | 0 (0.0%) | 0 (0.0%) |
| Total (Category) | 0 (0.0%) | 0 (0.0%) |
| Total (Overall) | 41 (41.4%) | 58 (58.6%) |
Natural Resources, Construction and Maintenance Occupations
The most common Natural Resources, Construction and Maintenance occupations in Yolo are , and Installation, Maintenance & Repair (23 | 23.2%).
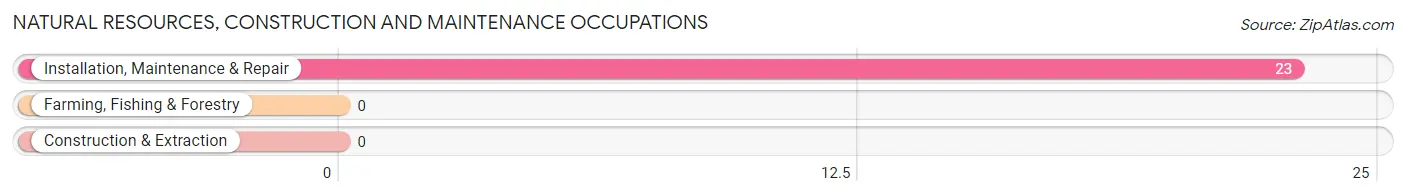
Natural Resources, Construction and Maintenance Occupations by Sex
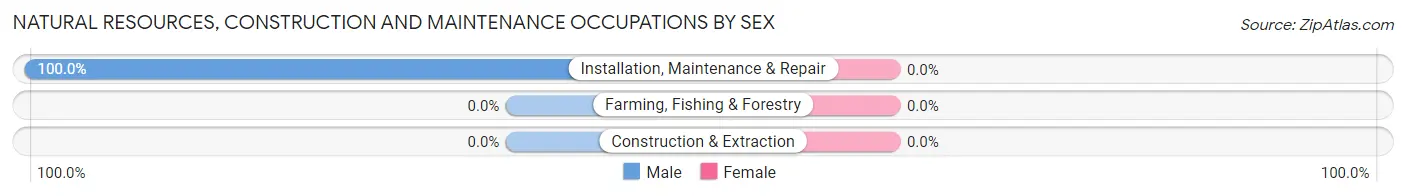
| Occupation | Male | Female |
| Farming, Fishing & Forestry | 0 (0.0%) | 0 (0.0%) |
| Construction & Extraction | 0 (0.0%) | 0 (0.0%) |
| Installation, Maintenance & Repair | 23 (100.0%) | 0 (0.0%) |
| Total (Category) | 23 (100.0%) | 0 (0.0%) |
| Total (Overall) | 41 (41.4%) | 58 (58.6%) |
Production, Transportation and Moving Occupations
The most common Production, Transportation and Moving occupations in Yolo are , and Material Moving (18 | 18.2%).
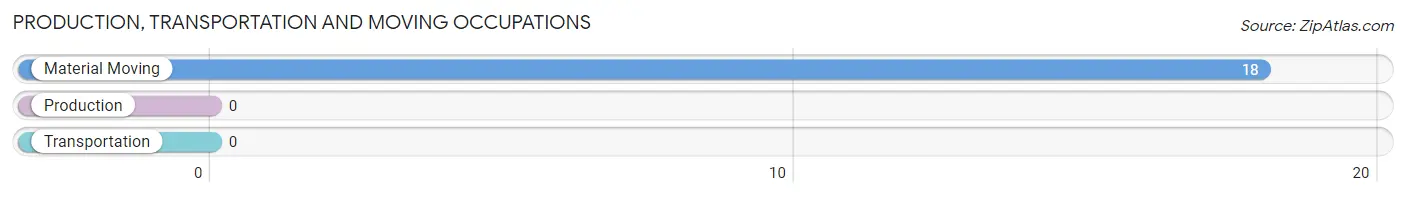
Production, Transportation and Moving Occupations by Sex
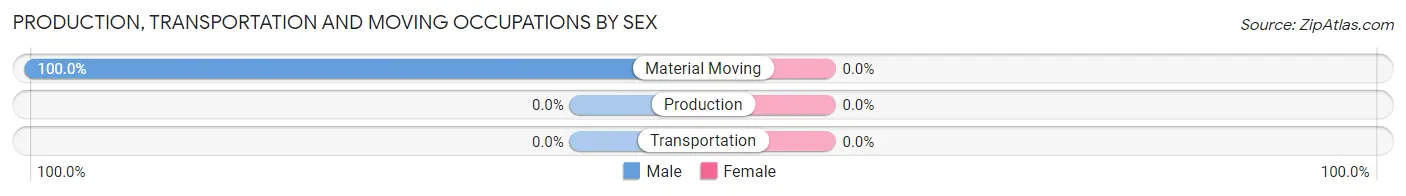
| Occupation | Male | Female |
| Production | 0 (0.0%) | 0 (0.0%) |
| Transportation | 0 (0.0%) | 0 (0.0%) |
| Material Moving | 18 (100.0%) | 0 (0.0%) |
| Total (Category) | 18 (100.0%) | 0 (0.0%) |
| Total (Overall) | 41 (41.4%) | 58 (58.6%) |
Employment Industries by Sex in Yolo
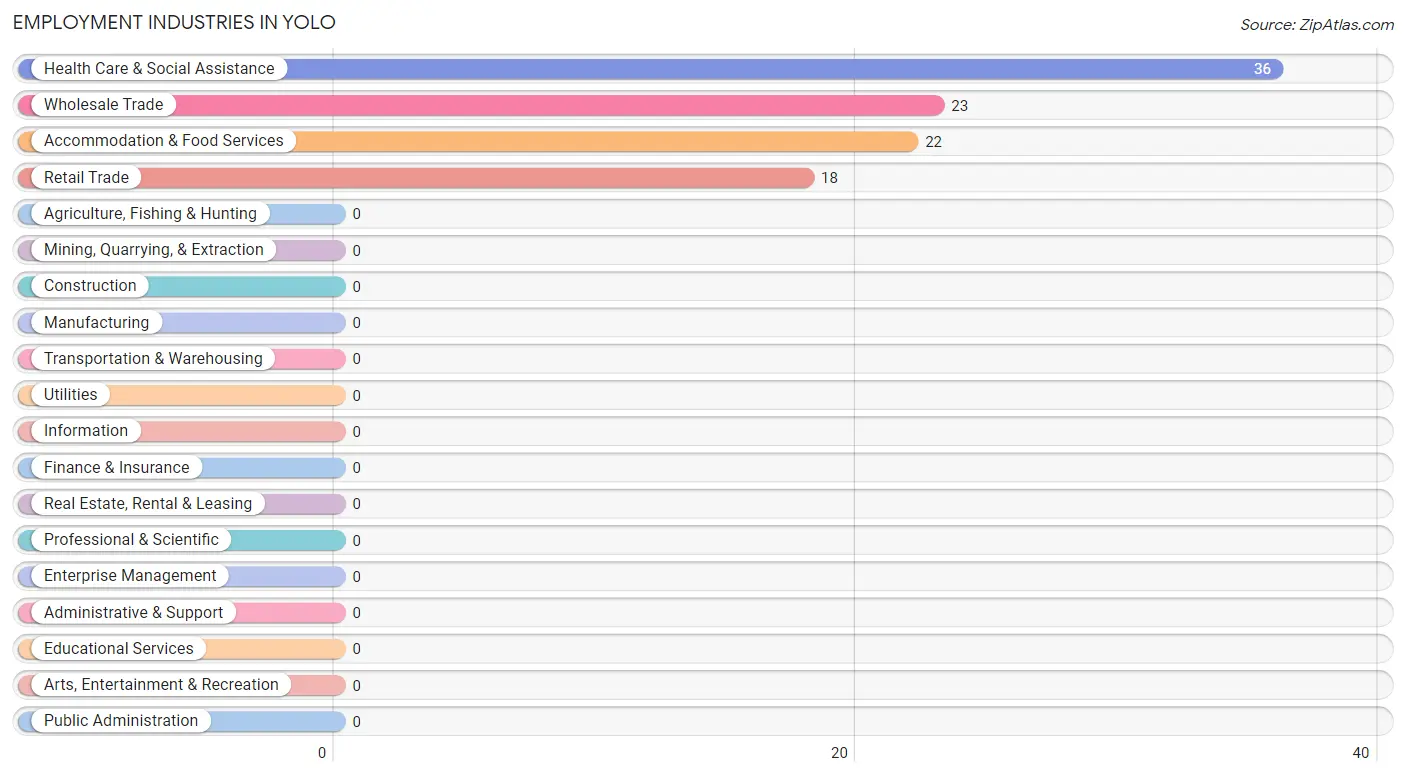
Employment Industries in Yolo
The major employment industries in Yolo include Health Care & Social Assistance (36 | 36.4%), Wholesale Trade (23 | 23.2%), Accommodation & Food Services (22 | 22.2%), and Retail Trade (18 | 18.2%).
Employment Industries by Sex in Yolo
The Yolo industries that see more men than women are Wholesale Trade (100.0%), and Retail Trade (100.0%), whereas the industries that tend to have a higher number of women are Health Care & Social Assistance (100.0%), and Accommodation & Food Services (100.0%).
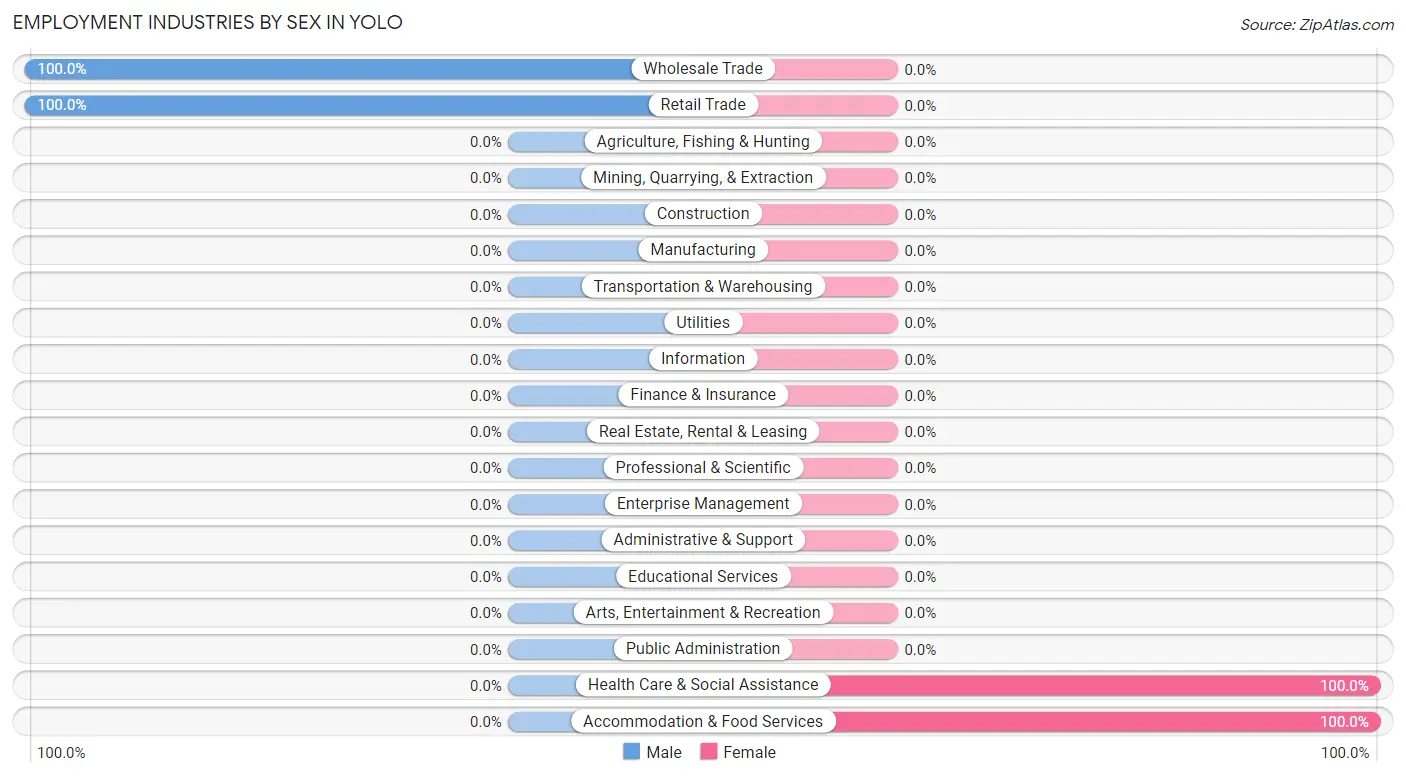
| Industry | Male | Female |
| Agriculture, Fishing & Hunting | 0 (0.0%) | 0 (0.0%) |
| Mining, Quarrying, & Extraction | 0 (0.0%) | 0 (0.0%) |
| Construction | 0 (0.0%) | 0 (0.0%) |
| Manufacturing | 0 (0.0%) | 0 (0.0%) |
| Wholesale Trade | 23 (100.0%) | 0 (0.0%) |
| Retail Trade | 18 (100.0%) | 0 (0.0%) |
| Transportation & Warehousing | 0 (0.0%) | 0 (0.0%) |
| Utilities | 0 (0.0%) | 0 (0.0%) |
| Information | 0 (0.0%) | 0 (0.0%) |
| Finance & Insurance | 0 (0.0%) | 0 (0.0%) |
| Real Estate, Rental & Leasing | 0 (0.0%) | 0 (0.0%) |
| Professional & Scientific | 0 (0.0%) | 0 (0.0%) |
| Enterprise Management | 0 (0.0%) | 0 (0.0%) |
| Administrative & Support | 0 (0.0%) | 0 (0.0%) |
| Educational Services | 0 (0.0%) | 0 (0.0%) |
| Health Care & Social Assistance | 0 (0.0%) | 36 (100.0%) |
| Arts, Entertainment & Recreation | 0 (0.0%) | 0 (0.0%) |
| Accommodation & Food Services | 0 (0.0%) | 22 (100.0%) |
| Public Administration | 0 (0.0%) | 0 (0.0%) |
| Total | 41 (41.4%) | 58 (58.6%) |
Education in Yolo
School Enrollment in Yolo
The most common levels of schooling among the 121 students in Yolo are high school (52 | 43.0%), middle school (46 | 38.0%), and elementary school (23 | 19.0%).
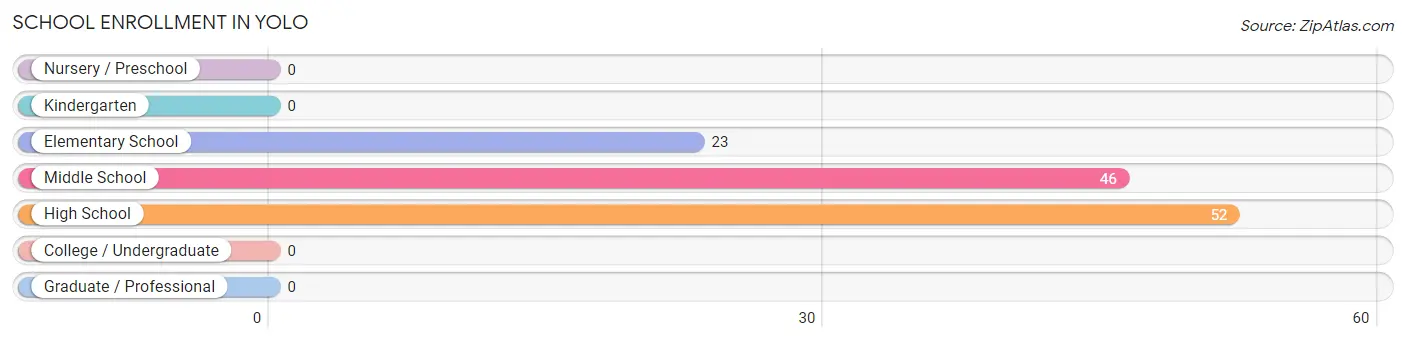
| School Level | # Students | % Students |
| Nursery / Preschool | 0 | 0.0% |
| Kindergarten | 0 | 0.0% |
| Elementary School | 23 | 19.0% |
| Middle School | 46 | 38.0% |
| High School | 52 | 43.0% |
| College / Undergraduate | 0 | 0.0% |
| Graduate / Professional | 0 | 0.0% |
| Total | 121 | 100.0% |
School Enrollment by Age by Funding Source in Yolo
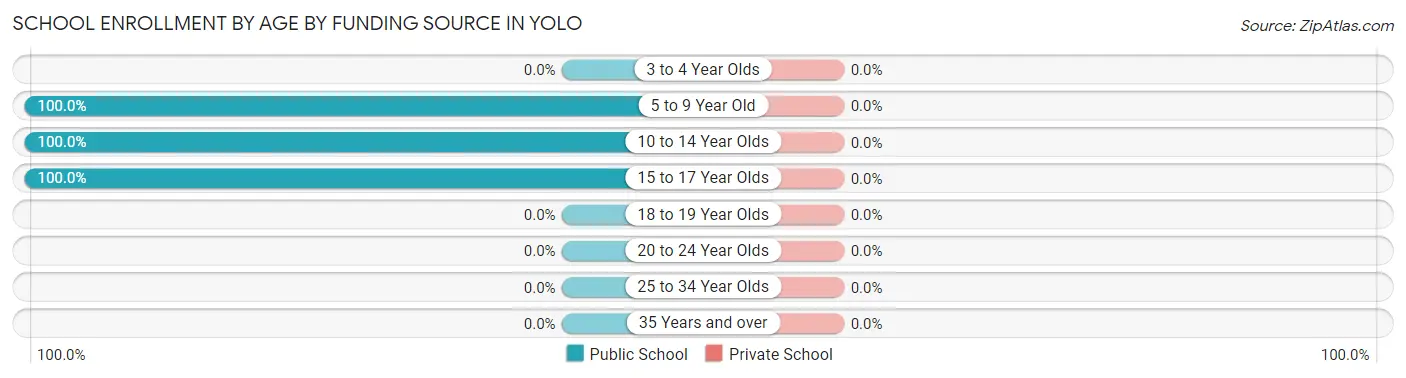
| Age Bracket | Public School | Private School |
| 3 to 4 Year Olds | 0 (0.0%) | 0 (0.0%) |
| 5 to 9 Year Old | 23 (100.0%) | 0 (0.0%) |
| 10 to 14 Year Olds | 46 (100.0%) | 0 (0.0%) |
| 15 to 17 Year Olds | 52 (100.0%) | 0 (0.0%) |
| 18 to 19 Year Olds | 0 (0.0%) | 0 (0.0%) |
| 20 to 24 Year Olds | 0 (0.0%) | 0 (0.0%) |
| 25 to 34 Year Olds | 0 (0.0%) | 0 (0.0%) |
| 35 Years and over | 0 (0.0%) | 0 (0.0%) |
| Total | 121 (100.0%) | 0 (0.0%) |
Educational Attainment by Field of Study in Yolo
Social sciences (10 | 33.3%), liberal arts & history (10 | 33.3%), and visual & performing arts (10 | 33.3%) are the most common fields of study among 30 individuals in Yolo who have obtained a bachelor's degree or higher.
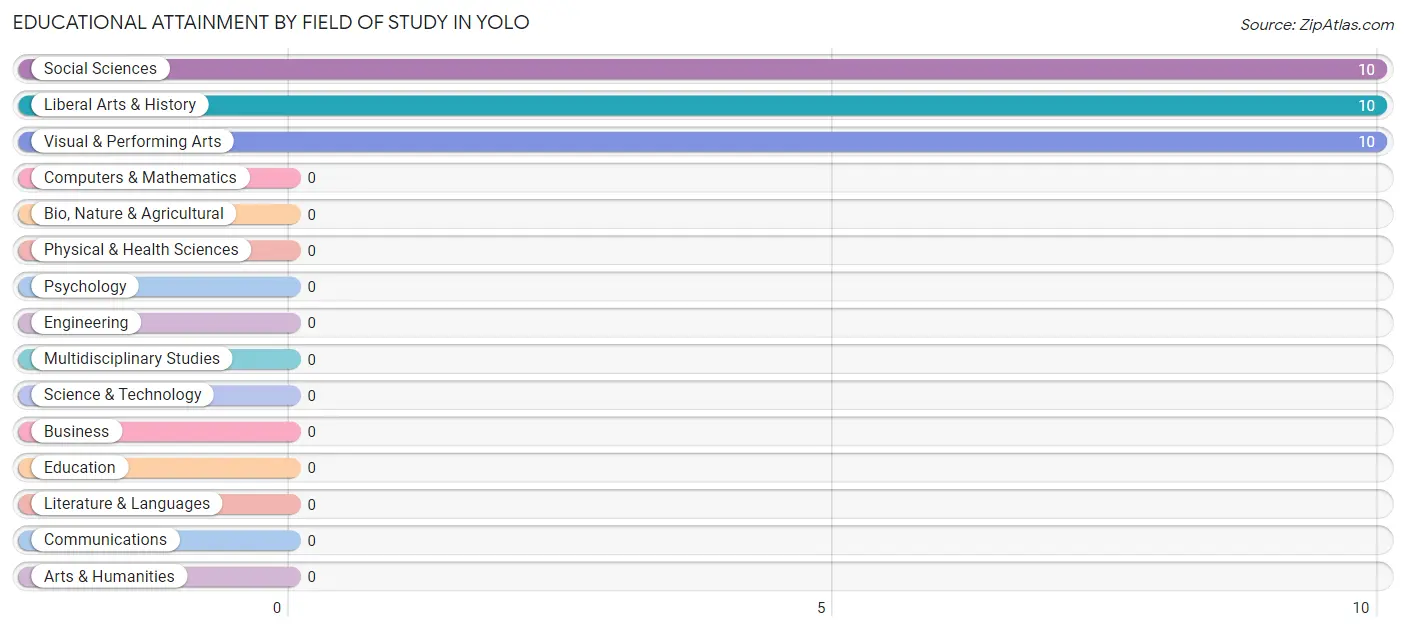
| Field of Study | # Graduates | % Graduates |
| Computers & Mathematics | 0 | 0.0% |
| Bio, Nature & Agricultural | 0 | 0.0% |
| Physical & Health Sciences | 0 | 0.0% |
| Psychology | 0 | 0.0% |
| Social Sciences | 10 | 33.3% |
| Engineering | 0 | 0.0% |
| Multidisciplinary Studies | 0 | 0.0% |
| Science & Technology | 0 | 0.0% |
| Business | 0 | 0.0% |
| Education | 0 | 0.0% |
| Literature & Languages | 0 | 0.0% |
| Liberal Arts & History | 10 | 33.3% |
| Visual & Performing Arts | 10 | 33.3% |
| Communications | 0 | 0.0% |
| Arts & Humanities | 0 | 0.0% |
| Total | 30 | 100.0% |
Transportation & Commute in Yolo
Vehicle Availability by Sex in Yolo
The most prevalent vehicle ownership categories in Yolo are males with 4 vehicles (23, accounting for 56.1%) and females with 4 vehicles (0, making up 39.7%).
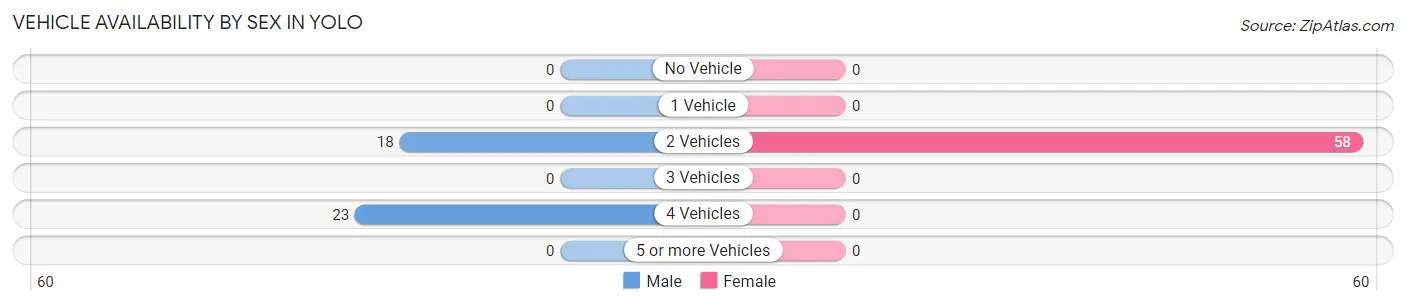
| Vehicles Available | Male | Female |
| No Vehicle | 0 (0.0%) | 0 (0.0%) |
| 1 Vehicle | 0 (0.0%) | 0 (0.0%) |
| 2 Vehicles | 18 (43.9%) | 58 (100.0%) |
| 3 Vehicles | 0 (0.0%) | 0 (0.0%) |
| 4 Vehicles | 23 (56.1%) | 0 (0.0%) |
| 5 or more Vehicles | 0 (0.0%) | 0 (0.0%) |
| Total | 41 (100.0%) | 58 (100.0%) |
Commute Time in Yolo
The most frequently occuring commute durations in Yolo are 10 to 14 minutes (32 commuters, 32.3%), 5 to 9 minutes (23 commuters, 23.2%), and 20 to 24 minutes (22 commuters, 22.2%).
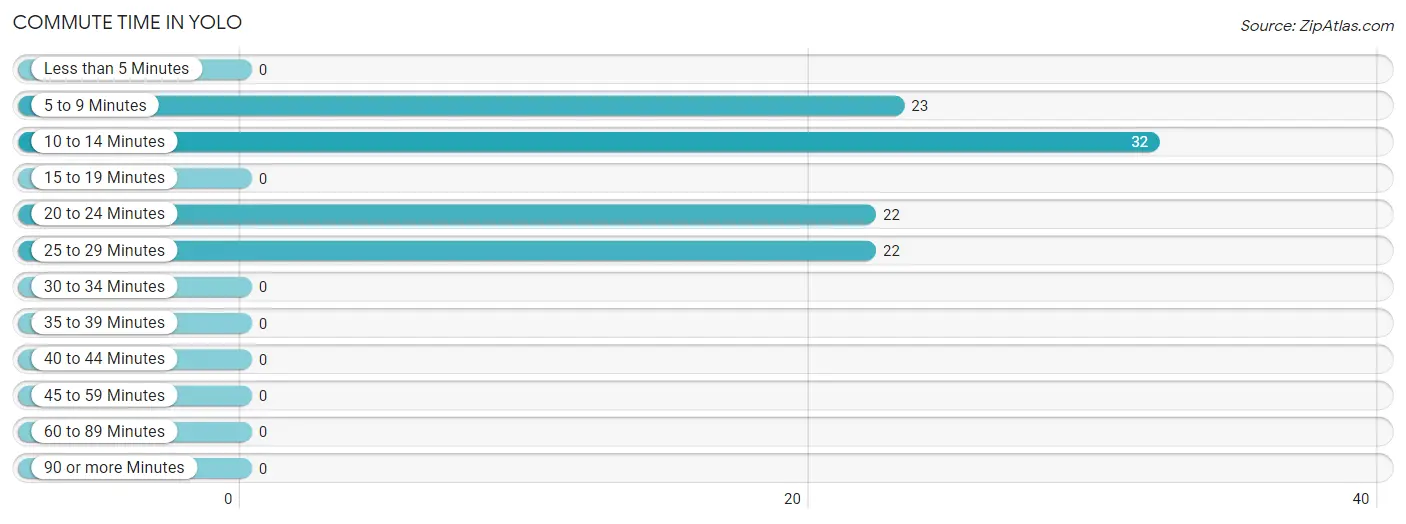
| Commute Time | # Commuters | % Commuters |
| Less than 5 Minutes | 0 | 0.0% |
| 5 to 9 Minutes | 23 | 23.2% |
| 10 to 14 Minutes | 32 | 32.3% |
| 15 to 19 Minutes | 0 | 0.0% |
| 20 to 24 Minutes | 22 | 22.2% |
| 25 to 29 Minutes | 22 | 22.2% |
| 30 to 34 Minutes | 0 | 0.0% |
| 35 to 39 Minutes | 0 | 0.0% |
| 40 to 44 Minutes | 0 | 0.0% |
| 45 to 59 Minutes | 0 | 0.0% |
| 60 to 89 Minutes | 0 | 0.0% |
| 90 or more Minutes | 0 | 0.0% |
Commute Time by Sex in Yolo
The most common commute times in Yolo are 5 to 9 minutes (23 commuters, 56.1%) for males and 20 to 24 minutes (22 commuters, 37.9%) for females.
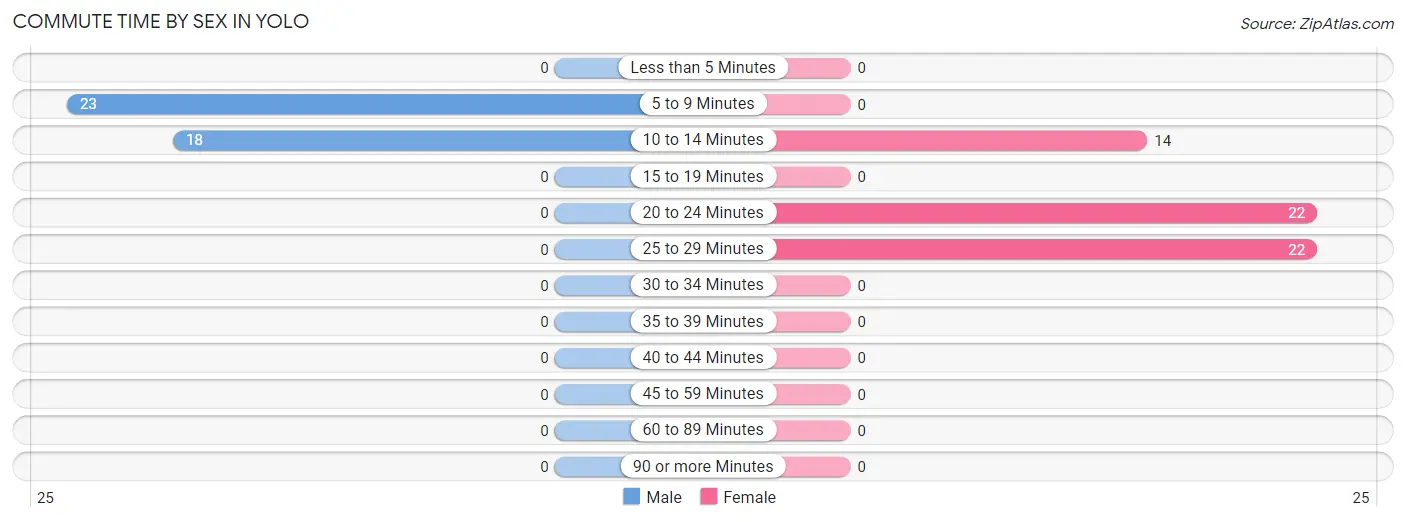
| Commute Time | Male | Female |
| Less than 5 Minutes | 0 (0.0%) | 0 (0.0%) |
| 5 to 9 Minutes | 23 (56.1%) | 0 (0.0%) |
| 10 to 14 Minutes | 18 (43.9%) | 14 (24.1%) |
| 15 to 19 Minutes | 0 (0.0%) | 0 (0.0%) |
| 20 to 24 Minutes | 0 (0.0%) | 22 (37.9%) |
| 25 to 29 Minutes | 0 (0.0%) | 22 (37.9%) |
| 30 to 34 Minutes | 0 (0.0%) | 0 (0.0%) |
| 35 to 39 Minutes | 0 (0.0%) | 0 (0.0%) |
| 40 to 44 Minutes | 0 (0.0%) | 0 (0.0%) |
| 45 to 59 Minutes | 0 (0.0%) | 0 (0.0%) |
| 60 to 89 Minutes | 0 (0.0%) | 0 (0.0%) |
| 90 or more Minutes | 0 (0.0%) | 0 (0.0%) |
Time of Departure to Work by Sex in Yolo
The most frequent times of departure to work in Yolo are 6:30 AM to 6:59 AM (23, 56.1%) for males and 7:00 AM to 7:29 AM (22, 37.9%) for females.
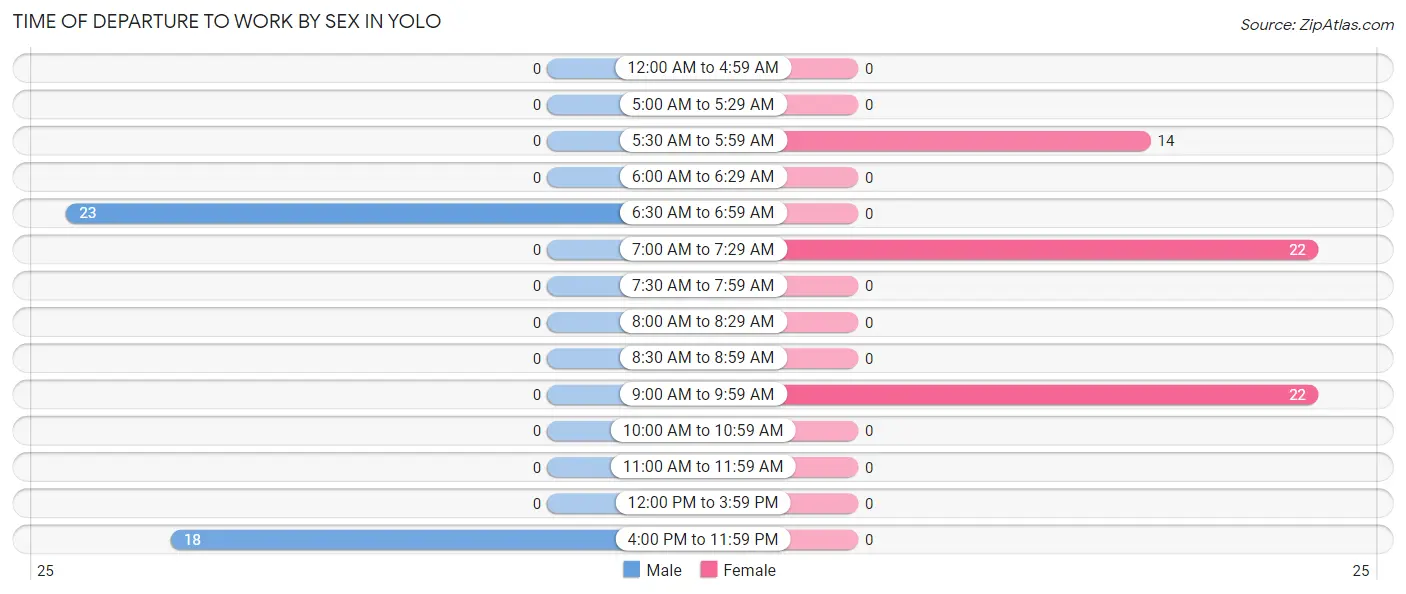
| Time of Departure | Male | Female |
| 12:00 AM to 4:59 AM | 0 (0.0%) | 0 (0.0%) |
| 5:00 AM to 5:29 AM | 0 (0.0%) | 0 (0.0%) |
| 5:30 AM to 5:59 AM | 0 (0.0%) | 14 (24.1%) |
| 6:00 AM to 6:29 AM | 0 (0.0%) | 0 (0.0%) |
| 6:30 AM to 6:59 AM | 23 (56.1%) | 0 (0.0%) |
| 7:00 AM to 7:29 AM | 0 (0.0%) | 22 (37.9%) |
| 7:30 AM to 7:59 AM | 0 (0.0%) | 0 (0.0%) |
| 8:00 AM to 8:29 AM | 0 (0.0%) | 0 (0.0%) |
| 8:30 AM to 8:59 AM | 0 (0.0%) | 0 (0.0%) |
| 9:00 AM to 9:59 AM | 0 (0.0%) | 22 (37.9%) |
| 10:00 AM to 10:59 AM | 0 (0.0%) | 0 (0.0%) |
| 11:00 AM to 11:59 AM | 0 (0.0%) | 0 (0.0%) |
| 12:00 PM to 3:59 PM | 0 (0.0%) | 0 (0.0%) |
| 4:00 PM to 11:59 PM | 18 (43.9%) | 0 (0.0%) |
| Total | 41 (100.0%) | 58 (100.0%) |
Housing Occupancy in Yolo
Occupancy by Ownership in Yolo
Of the total 89 dwellings in Yolo, owner-occupied units account for 22 (24.7%), while renter-occupied units make up 67 (75.3%).
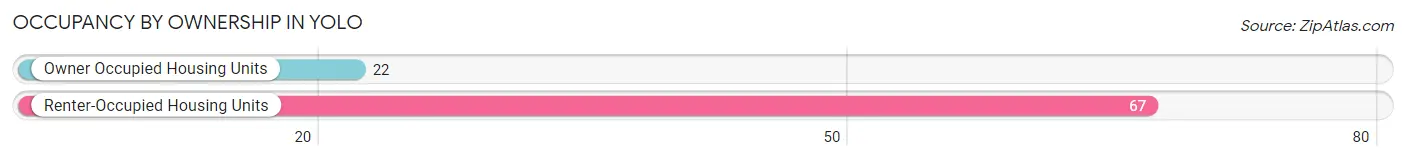
| Occupancy | # Housing Units | % Housing Units |
| Owner Occupied Housing Units | 22 | 24.7% |
| Renter-Occupied Housing Units | 67 | 75.3% |
| Total Occupied Housing Units | 89 | 100.0% |
Occupancy by Household Size in Yolo
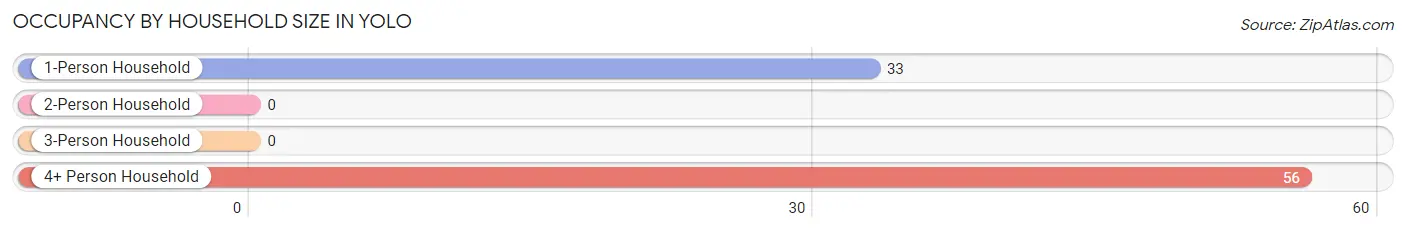
| Household Size | # Housing Units | % Housing Units |
| 1-Person Household | 33 | 37.1% |
| 2-Person Household | 0 | 0.0% |
| 3-Person Household | 0 | 0.0% |
| 4+ Person Household | 56 | 62.9% |
| Total Housing Units | 89 | 100.0% |
Occupancy by Ownership by Household Size in Yolo
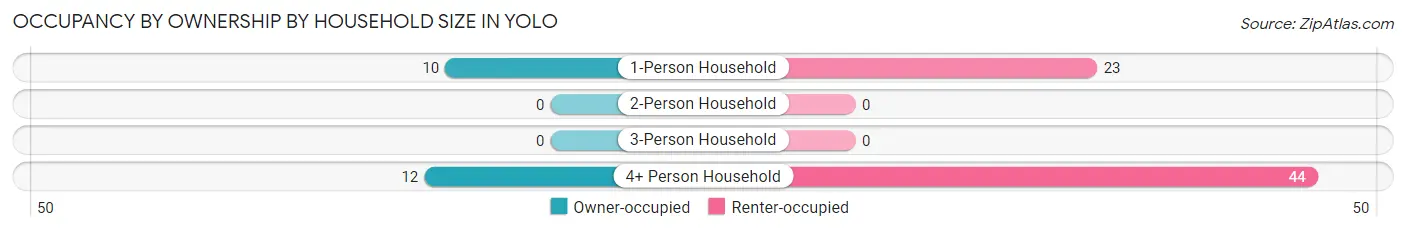
| Household Size | Owner-occupied | Renter-occupied |
| 1-Person Household | 10 (30.3%) | 23 (69.7%) |
| 2-Person Household | 0 (0.0%) | 0 (0.0%) |
| 3-Person Household | 0 (0.0%) | 0 (0.0%) |
| 4+ Person Household | 12 (21.4%) | 44 (78.6%) |
| Total Housing Units | 22 (24.7%) | 67 (75.3%) |
Occupancy by Educational Attainment in Yolo
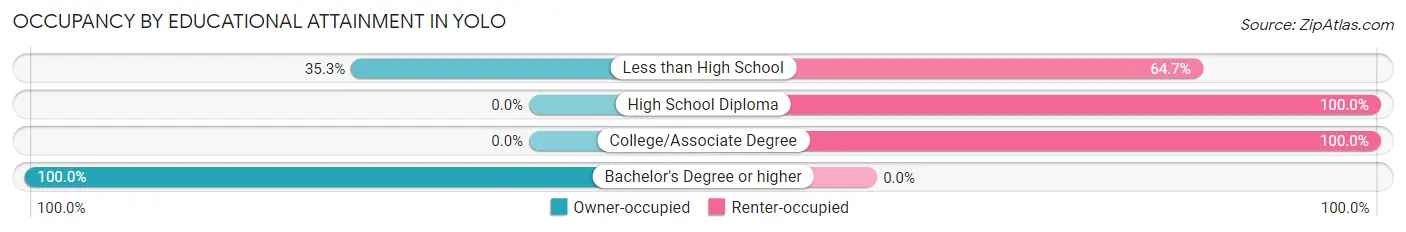
| Household Size | Owner-occupied | Renter-occupied |
| Less than High School | 12 (35.3%) | 22 (64.7%) |
| High School Diploma | 0 (0.0%) | 23 (100.0%) |
| College/Associate Degree | 0 (0.0%) | 22 (100.0%) |
| Bachelor's Degree or higher | 10 (100.0%) | 0 (0.0%) |
Occupancy by Age of Householder in Yolo
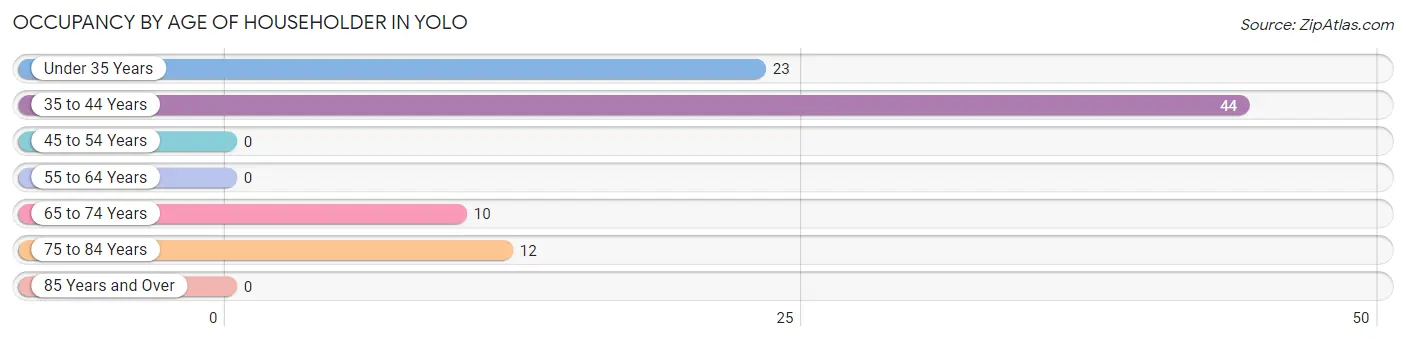
| Age Bracket | # Households | % Households |
| Under 35 Years | 23 | 25.8% |
| 35 to 44 Years | 44 | 49.4% |
| 45 to 54 Years | 0 | 0.0% |
| 55 to 64 Years | 0 | 0.0% |
| 65 to 74 Years | 10 | 11.2% |
| 75 to 84 Years | 12 | 13.5% |
| 85 Years and Over | 0 | 0.0% |
| Total | 89 | 100.0% |
Housing Finances in Yolo
Median Income by Occupancy in Yolo
| Occupancy Type | # Households | Median Income |
| Owner-Occupied | 22 (24.7%) | $0 |
| Renter-Occupied | 67 (75.3%) | $0 |
| Average | 89 (100.0%) | $0 |
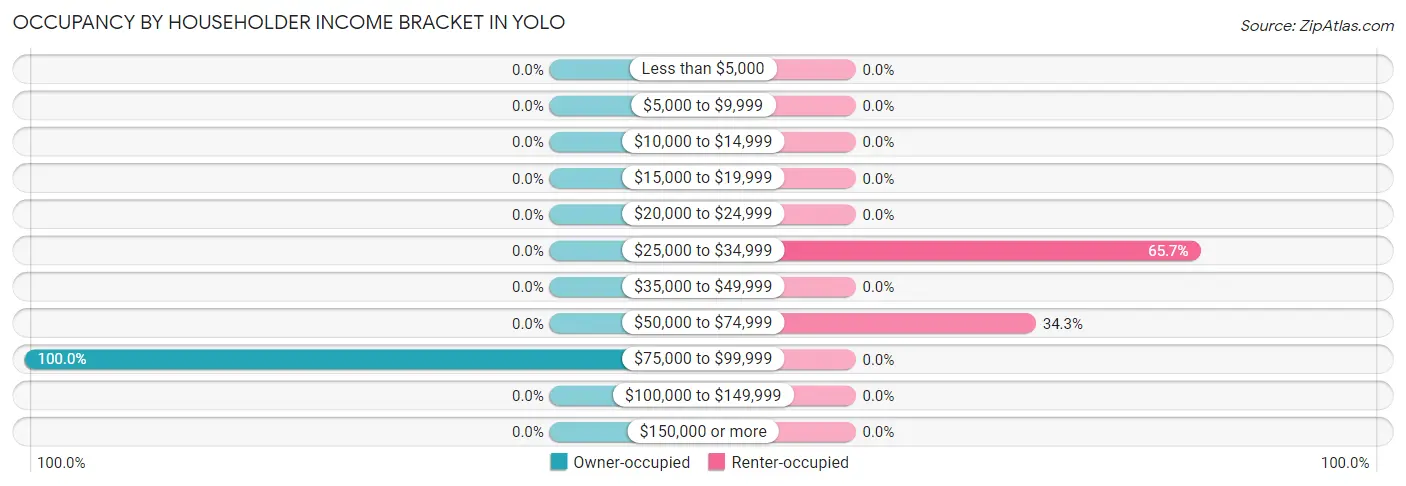
Occupancy by Householder Income Bracket in Yolo
| Income Bracket | Owner-occupied | Renter-occupied |
| Less than $5,000 | 0 (0.0%) | 0 (0.0%) |
| $5,000 to $9,999 | 0 (0.0%) | 0 (0.0%) |
| $10,000 to $14,999 | 0 (0.0%) | 0 (0.0%) |
| $15,000 to $19,999 | 0 (0.0%) | 0 (0.0%) |
| $20,000 to $24,999 | 0 (0.0%) | 0 (0.0%) |
| $25,000 to $34,999 | 0 (0.0%) | 44 (65.7%) |
| $35,000 to $49,999 | 0 (0.0%) | 0 (0.0%) |
| $50,000 to $74,999 | 0 (0.0%) | 23 (34.3%) |
| $75,000 to $99,999 | 22 (100.0%) | 0 (0.0%) |
| $100,000 to $149,999 | 0 (0.0%) | 0 (0.0%) |
| $150,000 or more | 0 (0.0%) | 0 (0.0%) |
| Total | 22 (100.0%) | 67 (100.0%) |
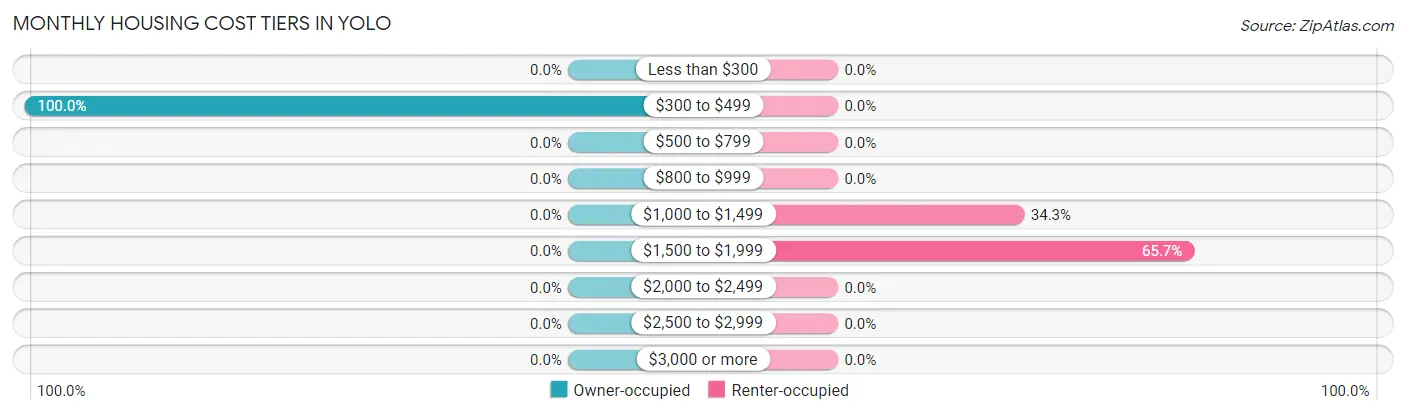
Monthly Housing Cost Tiers in Yolo
| Monthly Cost | Owner-occupied | Renter-occupied |
| Less than $300 | 0 (0.0%) | 0 (0.0%) |
| $300 to $499 | 22 (100.0%) | 0 (0.0%) |
| $500 to $799 | 0 (0.0%) | 0 (0.0%) |
| $800 to $999 | 0 (0.0%) | 0 (0.0%) |
| $1,000 to $1,499 | 0 (0.0%) | 23 (34.3%) |
| $1,500 to $1,999 | 0 (0.0%) | 44 (65.7%) |
| $2,000 to $2,499 | 0 (0.0%) | 0 (0.0%) |
| $2,500 to $2,999 | 0 (0.0%) | 0 (0.0%) |
| $3,000 or more | 0 (0.0%) | 0 (0.0%) |
| Total | 22 (100.0%) | 67 (100.0%) |
Physical Housing Characteristics in Yolo
Housing Structures in Yolo
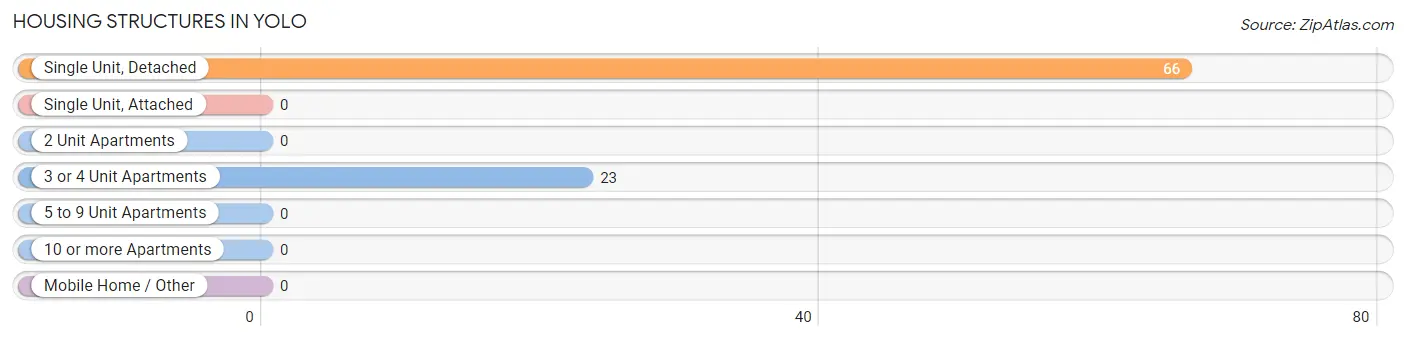
| Structure Type | # Housing Units | % Housing Units |
| Single Unit, Detached | 66 | 74.2% |
| Single Unit, Attached | 0 | 0.0% |
| 2 Unit Apartments | 0 | 0.0% |
| 3 or 4 Unit Apartments | 23 | 25.8% |
| 5 to 9 Unit Apartments | 0 | 0.0% |
| 10 or more Apartments | 0 | 0.0% |
| Mobile Home / Other | 0 | 0.0% |
| Total | 89 | 100.0% |
Housing Structures by Occupancy in Yolo
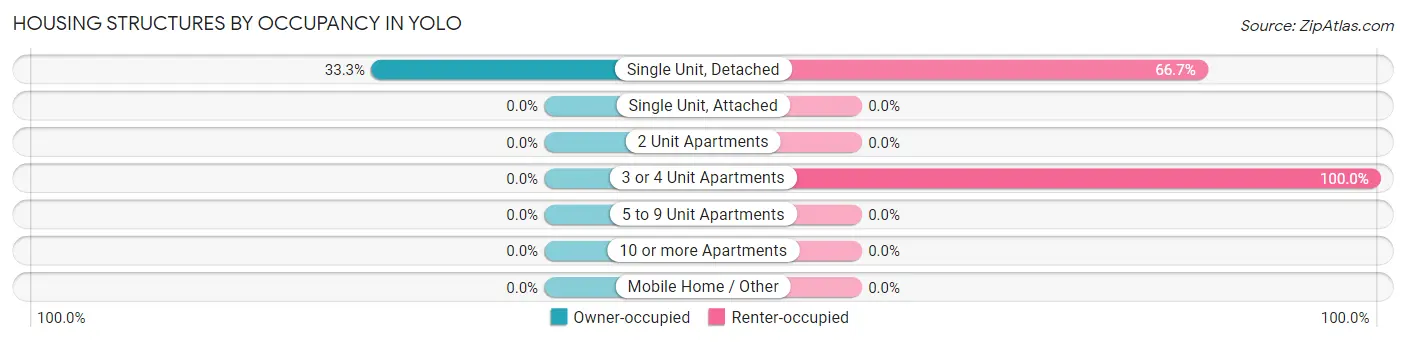
| Structure Type | Owner-occupied | Renter-occupied |
| Single Unit, Detached | 22 (33.3%) | 44 (66.7%) |
| Single Unit, Attached | 0 (0.0%) | 0 (0.0%) |
| 2 Unit Apartments | 0 (0.0%) | 0 (0.0%) |
| 3 or 4 Unit Apartments | 0 (0.0%) | 23 (100.0%) |
| 5 to 9 Unit Apartments | 0 (0.0%) | 0 (0.0%) |
| 10 or more Apartments | 0 (0.0%) | 0 (0.0%) |
| Mobile Home / Other | 0 (0.0%) | 0 (0.0%) |
| Total | 22 (24.7%) | 67 (75.3%) |
Housing Structures by Number of Rooms in Yolo
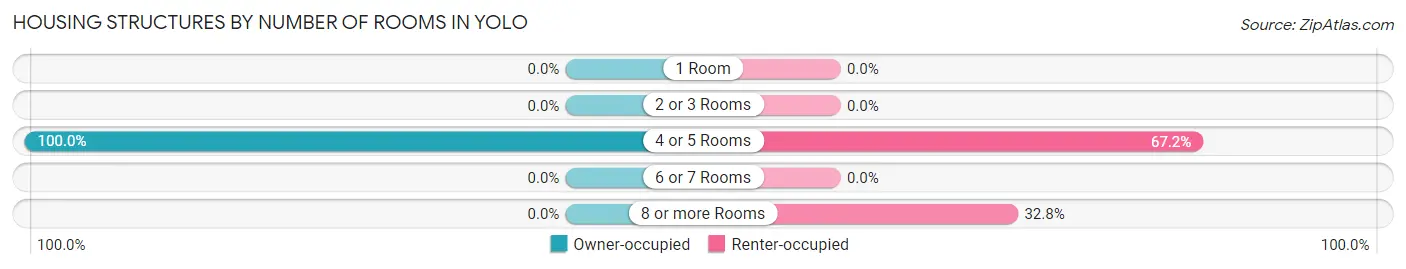
| Number of Rooms | Owner-occupied | Renter-occupied |
| 1 Room | 0 (0.0%) | 0 (0.0%) |
| 2 or 3 Rooms | 0 (0.0%) | 0 (0.0%) |
| 4 or 5 Rooms | 22 (100.0%) | 45 (67.2%) |
| 6 or 7 Rooms | 0 (0.0%) | 0 (0.0%) |
| 8 or more Rooms | 0 (0.0%) | 22 (32.8%) |
| Total | 22 (100.0%) | 67 (100.0%) |
Housing Structure by Heating Type in Yolo
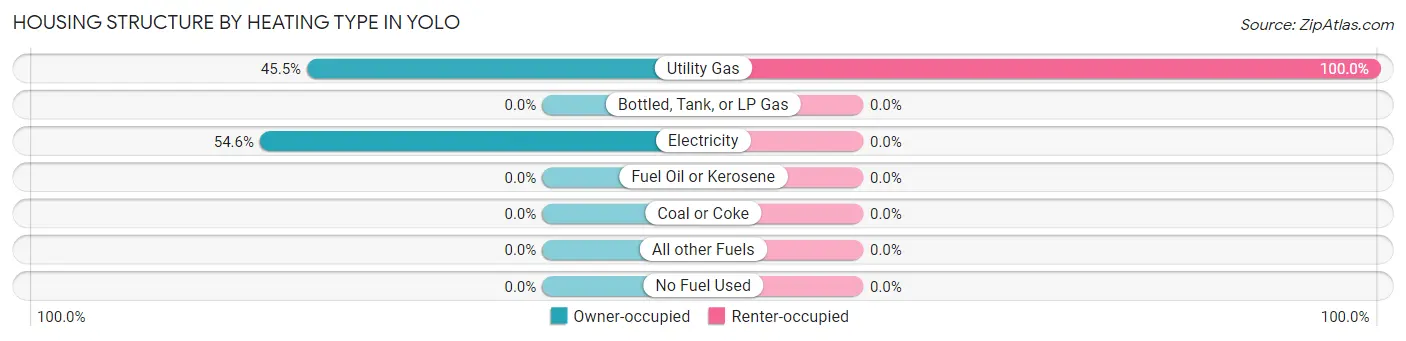
| Heating Type | Owner-occupied | Renter-occupied |
| Utility Gas | 10 (45.5%) | 67 (100.0%) |
| Bottled, Tank, or LP Gas | 0 (0.0%) | 0 (0.0%) |
| Electricity | 12 (54.5%) | 0 (0.0%) |
| Fuel Oil or Kerosene | 0 (0.0%) | 0 (0.0%) |
| Coal or Coke | 0 (0.0%) | 0 (0.0%) |
| All other Fuels | 0 (0.0%) | 0 (0.0%) |
| No Fuel Used | 0 (0.0%) | 0 (0.0%) |
| Total | 22 (100.0%) | 67 (100.0%) |
Household Vehicle Usage in Yolo
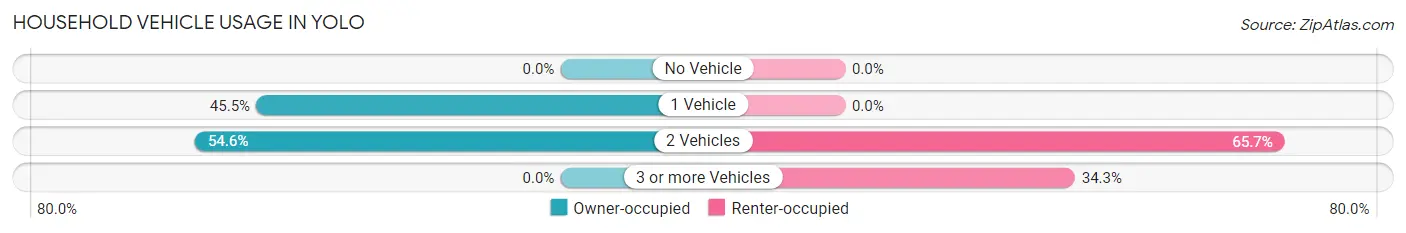
| Vehicles per Household | Owner-occupied | Renter-occupied |
| No Vehicle | 0 (0.0%) | 0 (0.0%) |
| 1 Vehicle | 10 (45.5%) | 0 (0.0%) |
| 2 Vehicles | 12 (54.5%) | 44 (65.7%) |
| 3 or more Vehicles | 0 (0.0%) | 23 (34.3%) |
| Total | 22 (100.0%) | 67 (100.0%) |
Real Estate & Mortgages in Yolo
Real Estate and Mortgage Overview in Yolo
| Characteristic | Without Mortgage | With Mortgage |
| Housing Units | 22 | 0 |
| Median Property Value | - | - |
| Median Household Income | - | - |
| Monthly Housing Costs | - | - |
| Real Estate Taxes | - | - |
Property Value by Mortgage Status in Yolo
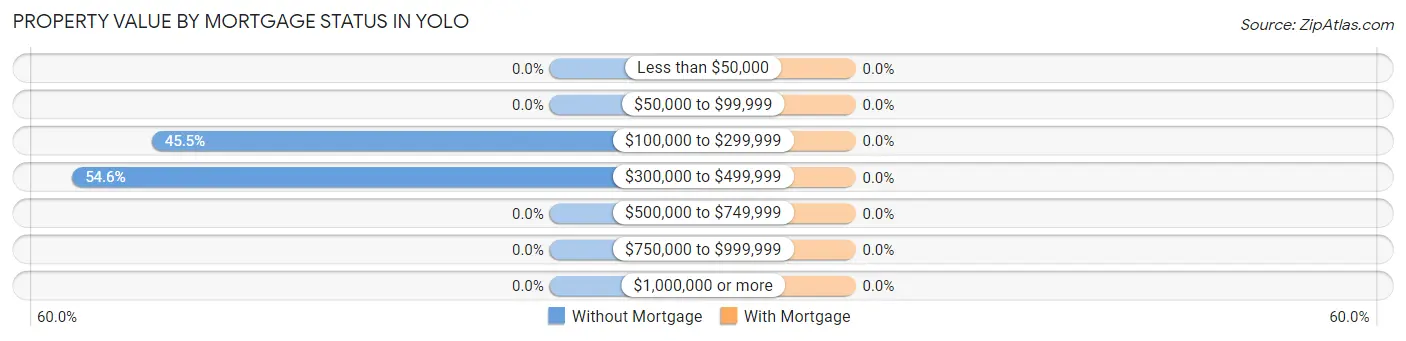
| Property Value | Without Mortgage | With Mortgage |
| Less than $50,000 | 0 (0.0%) | 0 (0.0%) |
| $50,000 to $99,999 | 0 (0.0%) | 0 (0.0%) |
| $100,000 to $299,999 | 10 (45.5%) | 0 (0.0%) |
| $300,000 to $499,999 | 12 (54.5%) | 0 (0.0%) |
| $500,000 to $749,999 | 0 (0.0%) | 0 (0.0%) |
| $750,000 to $999,999 | 0 (0.0%) | 0 (0.0%) |
| $1,000,000 or more | 0 (0.0%) | 0 (0.0%) |
| Total | 22 (100.0%) | 0 (0.0%) |
Household Income by Mortgage Status in Yolo
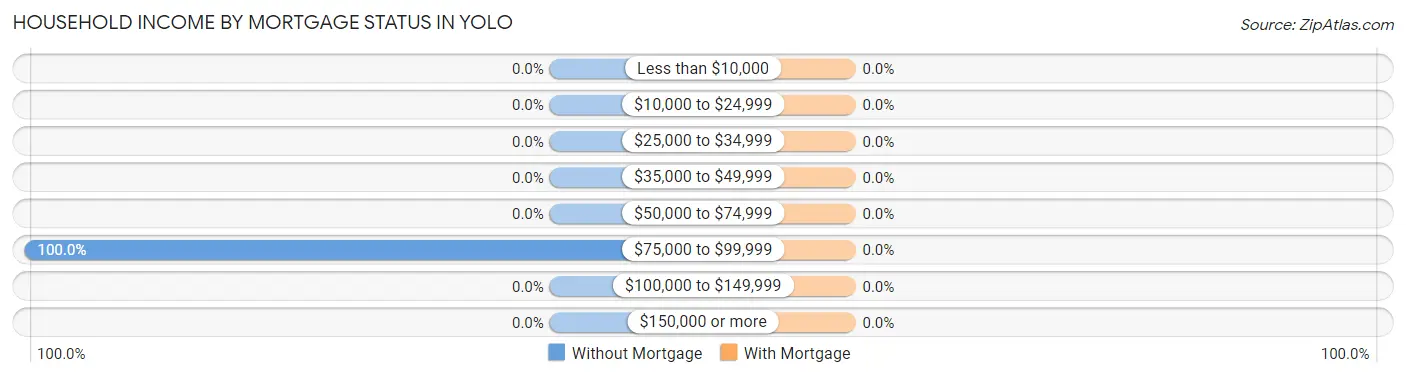
| Household Income | Without Mortgage | With Mortgage |
| Less than $10,000 | 0 (0.0%) | 0 (0.0%) |
| $10,000 to $24,999 | 0 (0.0%) | 0 (0.0%) |
| $25,000 to $34,999 | 0 (0.0%) | 0 (0.0%) |
| $35,000 to $49,999 | 0 (0.0%) | 0 (0.0%) |
| $50,000 to $74,999 | 0 (0.0%) | 0 (0.0%) |
| $75,000 to $99,999 | 22 (100.0%) | 0 (0.0%) |
| $100,000 to $149,999 | 0 (0.0%) | 0 (0.0%) |
| $150,000 or more | 0 (0.0%) | 0 (0.0%) |
| Total | 22 (100.0%) | 0 (0.0%) |
Property Value to Household Income Ratio in Yolo
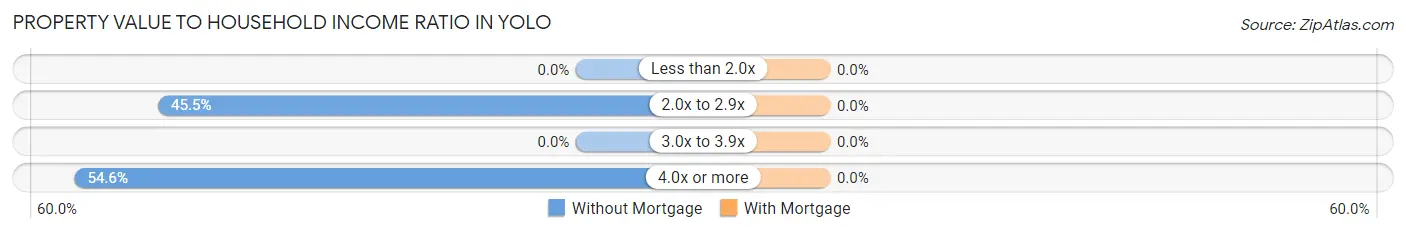
| Value-to-Income Ratio | Without Mortgage | With Mortgage |
| Less than 2.0x | 0 (0.0%) | 0 (0.0%) |
| 2.0x to 2.9x | 10 (45.5%) | 0 (0.0%) |
| 3.0x to 3.9x | 0 (0.0%) | 0 (0.0%) |
| 4.0x or more | 12 (54.5%) | 0 (0.0%) |
| Total | 22 (100.0%) | 0 (0.0%) |
Real Estate Taxes by Mortgage Status in Yolo
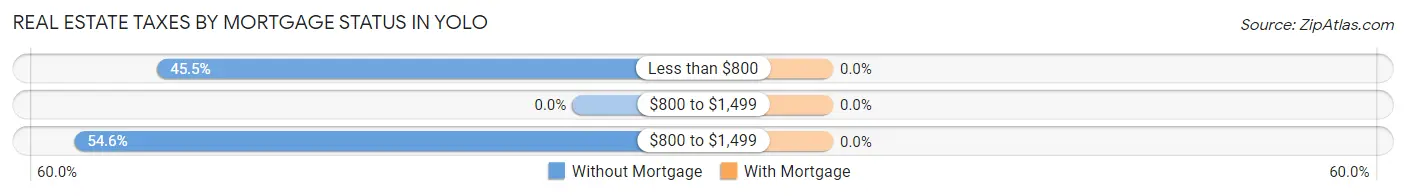
| Property Taxes | Without Mortgage | With Mortgage |
| Less than $800 | 10 (45.5%) | 0 (0.0%) |
| $800 to $1,499 | 0 (0.0%) | 0 (0.0%) |
| $800 to $1,499 | 12 (54.5%) | 0 (0.0%) |
| Total | 22 (100.0%) | 0 (0.0%) |
Health & Disability in Yolo
Health Insurance Coverage by Age in Yolo
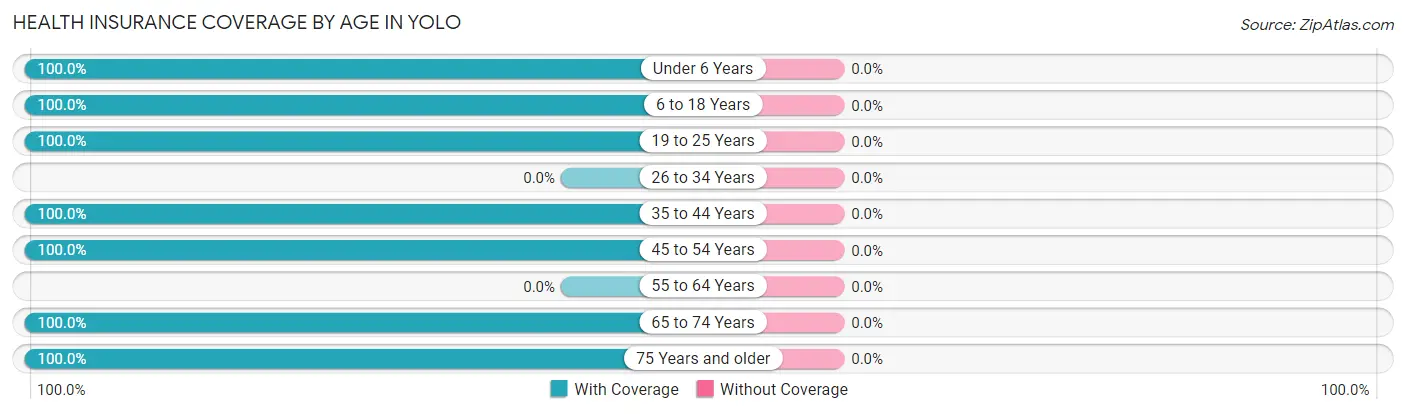
| Age Bracket | With Coverage | Without Coverage |
| Under 6 Years | 21 (100.0%) | 0 (0.0%) |
| 6 to 18 Years | 121 (100.0%) | 0 (0.0%) |
| 19 to 25 Years | 41 (100.0%) | 0 (0.0%) |
| 26 to 34 Years | 0 (0.0%) | 0 (0.0%) |
| 35 to 44 Years | 62 (100.0%) | 0 (0.0%) |
| 45 to 54 Years | 14 (100.0%) | 0 (0.0%) |
| 55 to 64 Years | 0 (0.0%) | 0 (0.0%) |
| 65 to 74 Years | 10 (100.0%) | 0 (0.0%) |
| 75 Years and older | 12 (100.0%) | 0 (0.0%) |
| Total | 281 (100.0%) | 0 (0.0%) |
Health Insurance Coverage by Citizenship Status in Yolo
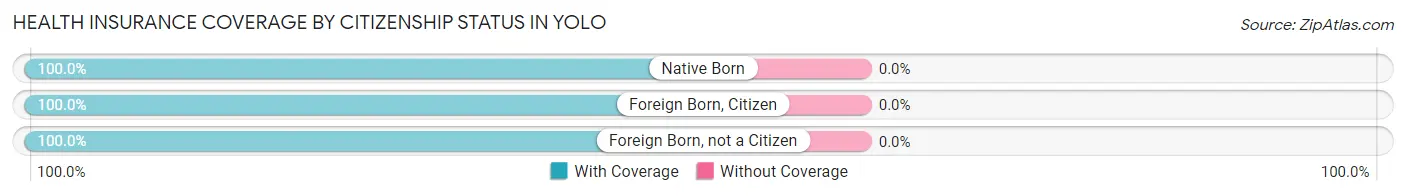
| Citizenship Status | With Coverage | Without Coverage |
| Native Born | 21 (100.0%) | 0 (0.0%) |
| Foreign Born, Citizen | 121 (100.0%) | 0 (0.0%) |
| Foreign Born, not a Citizen | 41 (100.0%) | 0 (0.0%) |
Health Insurance Coverage by Household Income in Yolo
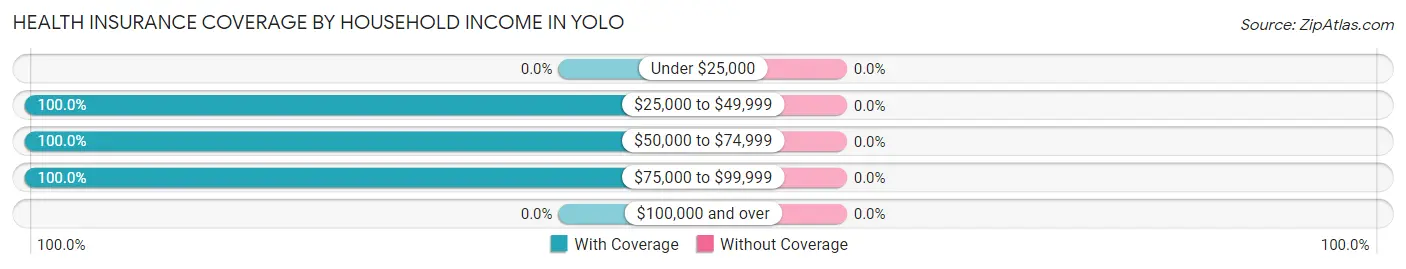
| Household Income | With Coverage | Without Coverage |
| Under $25,000 | 0 (0.0%) | 0 (0.0%) |
| $25,000 to $49,999 | 189 (100.0%) | 0 (0.0%) |
| $50,000 to $74,999 | 23 (100.0%) | 0 (0.0%) |
| $75,000 to $99,999 | 69 (100.0%) | 0 (0.0%) |
| $100,000 and over | 0 (0.0%) | 0 (0.0%) |
Public vs Private Health Insurance Coverage by Age in Yolo
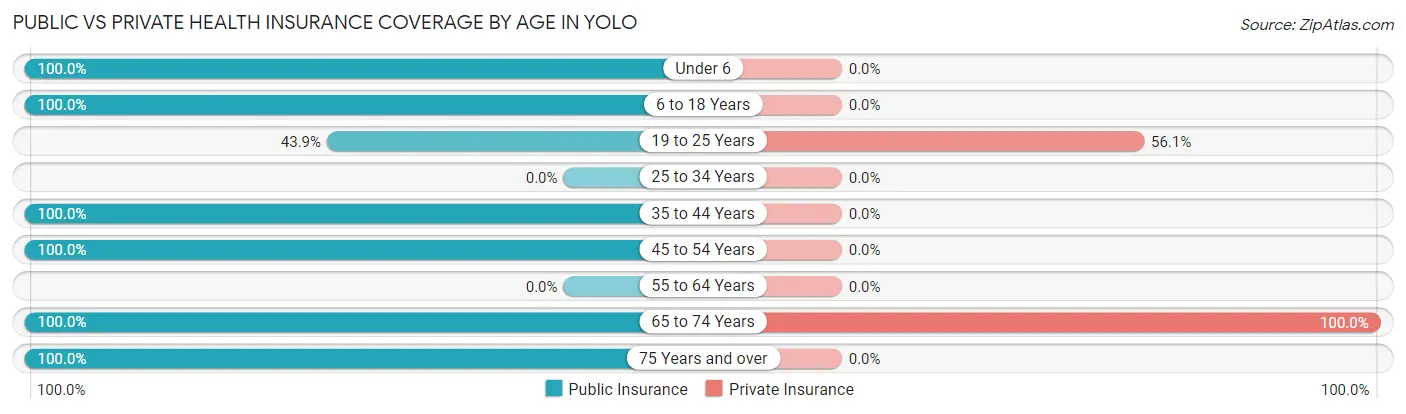
| Age Bracket | Public Insurance | Private Insurance |
| Under 6 | 21 (100.0%) | 0 (0.0%) |
| 6 to 18 Years | 121 (100.0%) | 0 (0.0%) |
| 19 to 25 Years | 18 (43.9%) | 23 (56.1%) |
| 25 to 34 Years | 0 (0.0%) | 0 (0.0%) |
| 35 to 44 Years | 62 (100.0%) | 0 (0.0%) |
| 45 to 54 Years | 14 (100.0%) | 0 (0.0%) |
| 55 to 64 Years | 0 (0.0%) | 0 (0.0%) |
| 65 to 74 Years | 10 (100.0%) | 10 (100.0%) |
| 75 Years and over | 12 (100.0%) | 0 (0.0%) |
| Total | 258 (91.8%) | 33 (11.7%) |
Disability Status by Sex by Age in Yolo
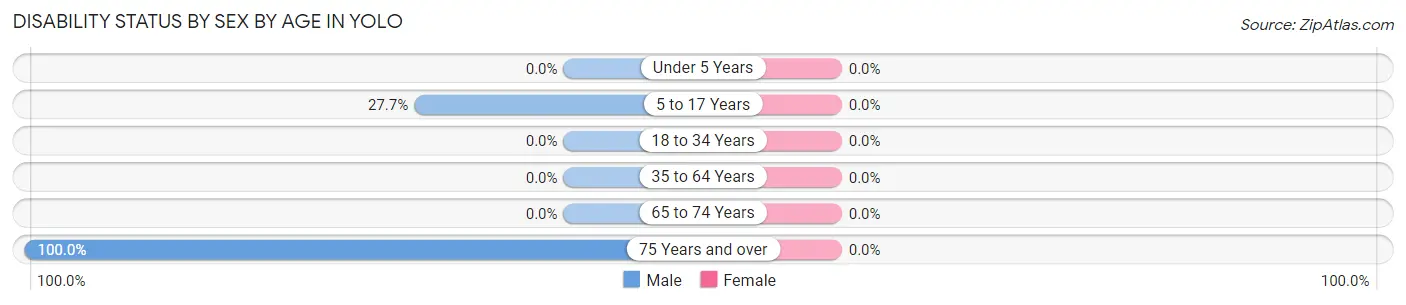
| Age Bracket | Male | Female |
| Under 5 Years | 0 (0.0%) | 0 (0.0%) |
| 5 to 17 Years | 23 (27.7%) | 0 (0.0%) |
| 18 to 34 Years | 0 (0.0%) | 0 (0.0%) |
| 35 to 64 Years | 0 (0.0%) | 0 (0.0%) |
| 65 to 74 Years | 0 (0.0%) | 0 (0.0%) |
| 75 Years and over | 12 (100.0%) | 0 (0.0%) |
Disability Class by Sex by Age in Yolo
Disability Class: Hearing Difficulty
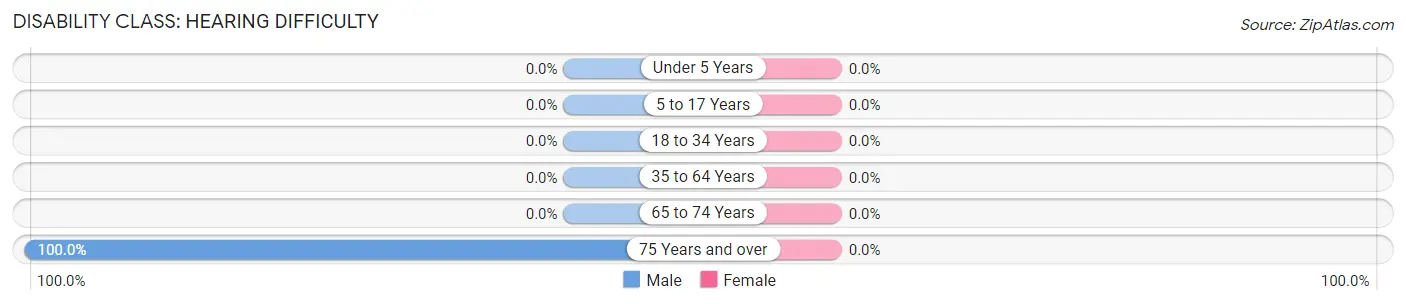
| Age Bracket | Male | Female |
| Under 5 Years | 0 (0.0%) | 0 (0.0%) |
| 5 to 17 Years | 0 (0.0%) | 0 (0.0%) |
| 18 to 34 Years | 0 (0.0%) | 0 (0.0%) |
| 35 to 64 Years | 0 (0.0%) | 0 (0.0%) |
| 65 to 74 Years | 0 (0.0%) | 0 (0.0%) |
| 75 Years and over | 12 (100.0%) | 0 (0.0%) |
Disability Class: Vision Difficulty
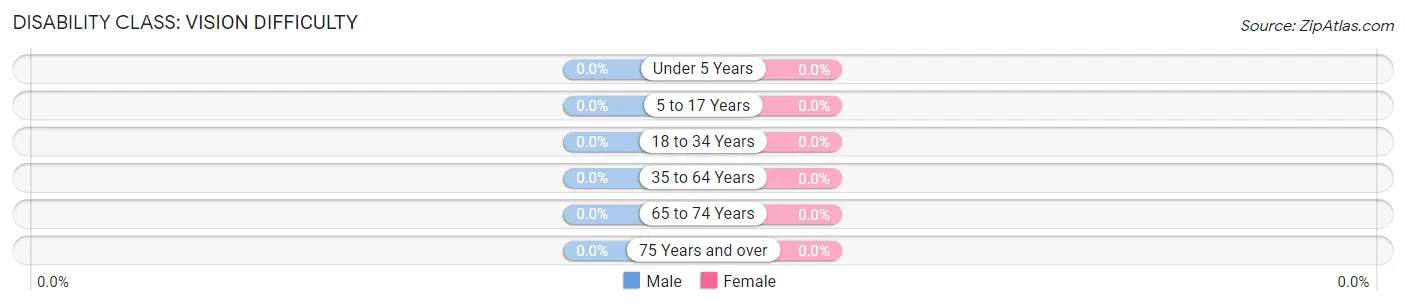
| Age Bracket | Male | Female |
| Under 5 Years | 0 (0.0%) | 0 (0.0%) |
| 5 to 17 Years | 0 (0.0%) | 0 (0.0%) |
| 18 to 34 Years | 0 (0.0%) | 0 (0.0%) |
| 35 to 64 Years | 0 (0.0%) | 0 (0.0%) |
| 65 to 74 Years | 0 (0.0%) | 0 (0.0%) |
| 75 Years and over | 0 (0.0%) | 0 (0.0%) |
Disability Class: Cognitive Difficulty
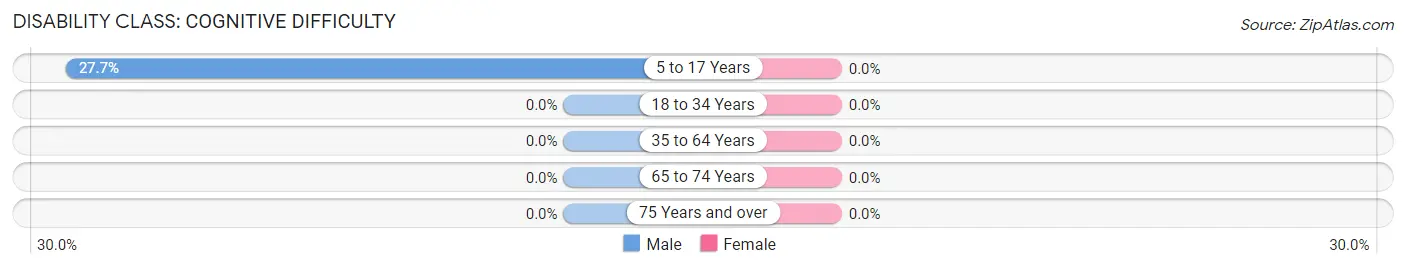
| Age Bracket | Male | Female |
| 5 to 17 Years | 23 (27.7%) | 0 (0.0%) |
| 18 to 34 Years | 0 (0.0%) | 0 (0.0%) |
| 35 to 64 Years | 0 (0.0%) | 0 (0.0%) |
| 65 to 74 Years | 0 (0.0%) | 0 (0.0%) |
| 75 Years and over | 0 (0.0%) | 0 (0.0%) |
Disability Class: Ambulatory Difficulty
| Age Bracket | Male | Female |
| 5 to 17 Years | 0 (0.0%) | 0 (0.0%) |
| 18 to 34 Years | 0 (0.0%) | 0 (0.0%) |
| 35 to 64 Years | 0 (0.0%) | 0 (0.0%) |
| 65 to 74 Years | 0 (0.0%) | 0 (0.0%) |
| 75 Years and over | 12 (100.0%) | 0 (0.0%) |
Disability Class: Self-Care Difficulty
| Age Bracket | Male | Female |
| 5 to 17 Years | 0 (0.0%) | 0 (0.0%) |
| 18 to 34 Years | 0 (0.0%) | 0 (0.0%) |
| 35 to 64 Years | 0 (0.0%) | 0 (0.0%) |
| 65 to 74 Years | 0 (0.0%) | 0 (0.0%) |
| 75 Years and over | 0 (0.0%) | 0 (0.0%) |
Technology Access in Yolo
Computing Device Access in Yolo
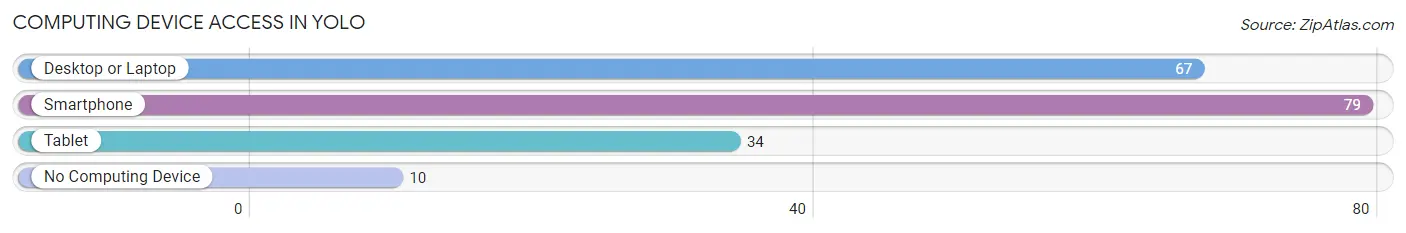
| Device Type | # Households | % Households |
| Desktop or Laptop | 67 | 75.3% |
| Smartphone | 79 | 88.8% |
| Tablet | 34 | 38.2% |
| No Computing Device | 10 | 11.2% |
| Total | 89 | 100.0% |
Internet Access in Yolo
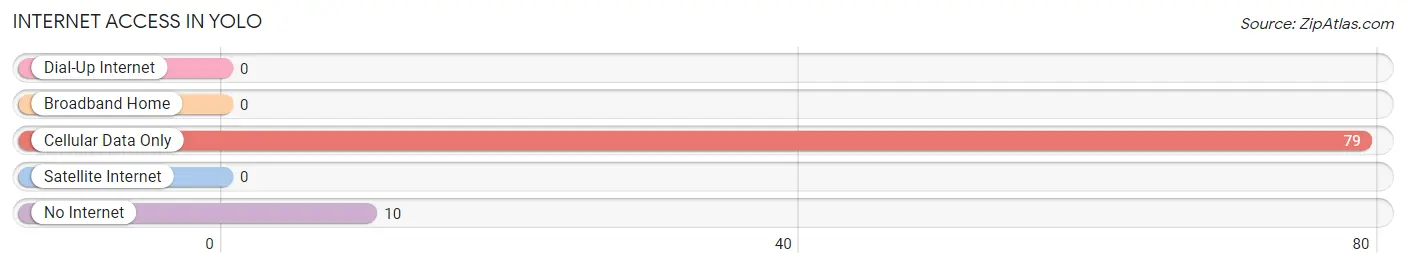
| Internet Type | # Households | % Households |
| Dial-Up Internet | 0 | 0.0% |
| Broadband Home | 0 | 0.0% |
| Cellular Data Only | 79 | 88.8% |
| Satellite Internet | 0 | 0.0% |
| No Internet | 10 | 11.2% |
| Total | 89 | 100.0% |
Yolo Summary
Yolo is a county located in the Central Valley of California, United States. It is bordered by the counties of Sacramento, Solano, Colusa, and Sutter. Yolo County is home to the cities of Davis, West Sacramento, Winters, Woodland, and the unincorporated communities of Esparto, Madison, and Knights Landing. The county seat is Woodland.
History
Yolo County was one of the original counties of California, created in 1850 at the time of statehood. The county is named after the Yolo tribe, which was a Native American tribe that lived in the area. The county was originally part of the Rancho El Pinole Mexican land grant.
In the early 19th century, the area was settled by American and European immigrants, who established farms and ranches. The county was also home to a large Chinese population, who worked in the area’s agricultural industry.
Geography
Yolo County covers an area of 1,024 square miles, making it the 15th largest county in California. The county is located in the Central Valley of California, and is bordered by the counties of Sacramento, Solano, Colusa, and Sutter.
The county is divided into two distinct regions: the northern region is characterized by rolling hills and oak woodlands, while the southern region is characterized by flat plains and grasslands. The county is home to several rivers, including the Sacramento River, Putah Creek, and Cache Creek.
Economy
Yolo County’s economy is largely based on agriculture. The county is home to a variety of crops, including tomatoes, corn, wheat, rice, and alfalfa. The county is also home to a thriving wine industry, with several wineries located in the area.
In addition to agriculture, Yolo County is home to a number of technology companies, including Intel, Hewlett-Packard, and Oracle. The county is also home to a number of government agencies, including the California Department of Transportation and the California Air Resources Board.
Demographics
As of the 2010 census, Yolo County had a population of 200,878. The racial makeup of the county was 68.2% White, 8.2% African American, 0.7% Native American, 11.3% Asian, 0.3% Pacific Islander, and 8.2% from other races. Hispanic or Latino of any race were 24.2% of the population.
The median household income in Yolo County was $60,879, and the median family income was $71,845. The per capita income was $27,837. About 11.2% of families and 15.3% of the population were below the poverty line, including 20.2% of those under age 18 and 6.2% of those age 65 or over.
Yolo County is home to a diverse population, with a variety of cultures and backgrounds. The county is home to a large Hispanic population, as well as a large Asian population. The county is also home to a large number of students, due to the presence of the University of California, Davis.
Common Questions
What is Per Capita Income in Yolo?
Per Capita income in Yolo is $16,508.
What is Inequality or Gini Index in Yolo?
Inequality or Gini Index in Yolo is 0.27.
What is the Total Population of Yolo?
Total Population of Yolo is 281.
What is the Total Male Population of Yolo?
Total Male Population of Yolo is 164.
What is the Total Female Population of Yolo?
Total Female Population of Yolo is 117.
What is the Ratio of Males per 100 Females in Yolo?
There are 140.17 Males per 100 Females in Yolo.
What is the Ratio of Females per 100 Males in Yolo?
There are 71.34 Females per 100 Males in Yolo.
What is the Median Population Age in Yolo?
Median Population Age in Yolo is 17.9 Years.
What is the Average Family Size in Yolo
Average Family Size in Yolo is 4.4 People.
What is the Average Household Size in Yolo
Average Household Size in Yolo is 3.2 People.
How Large is the Labor Force in Yolo?
There are 99 People in the Labor Forcein in Yolo.
What is the Percentage of People in the Labor Force in Yolo?
64.3% of People are in the Labor Force in Yolo.