Cities with the Highest Percentage of Families with Income Below $10,000 in California
RELATED REPORTS & OPTIONS
Family Income | $0-10k
California
Compare Cities
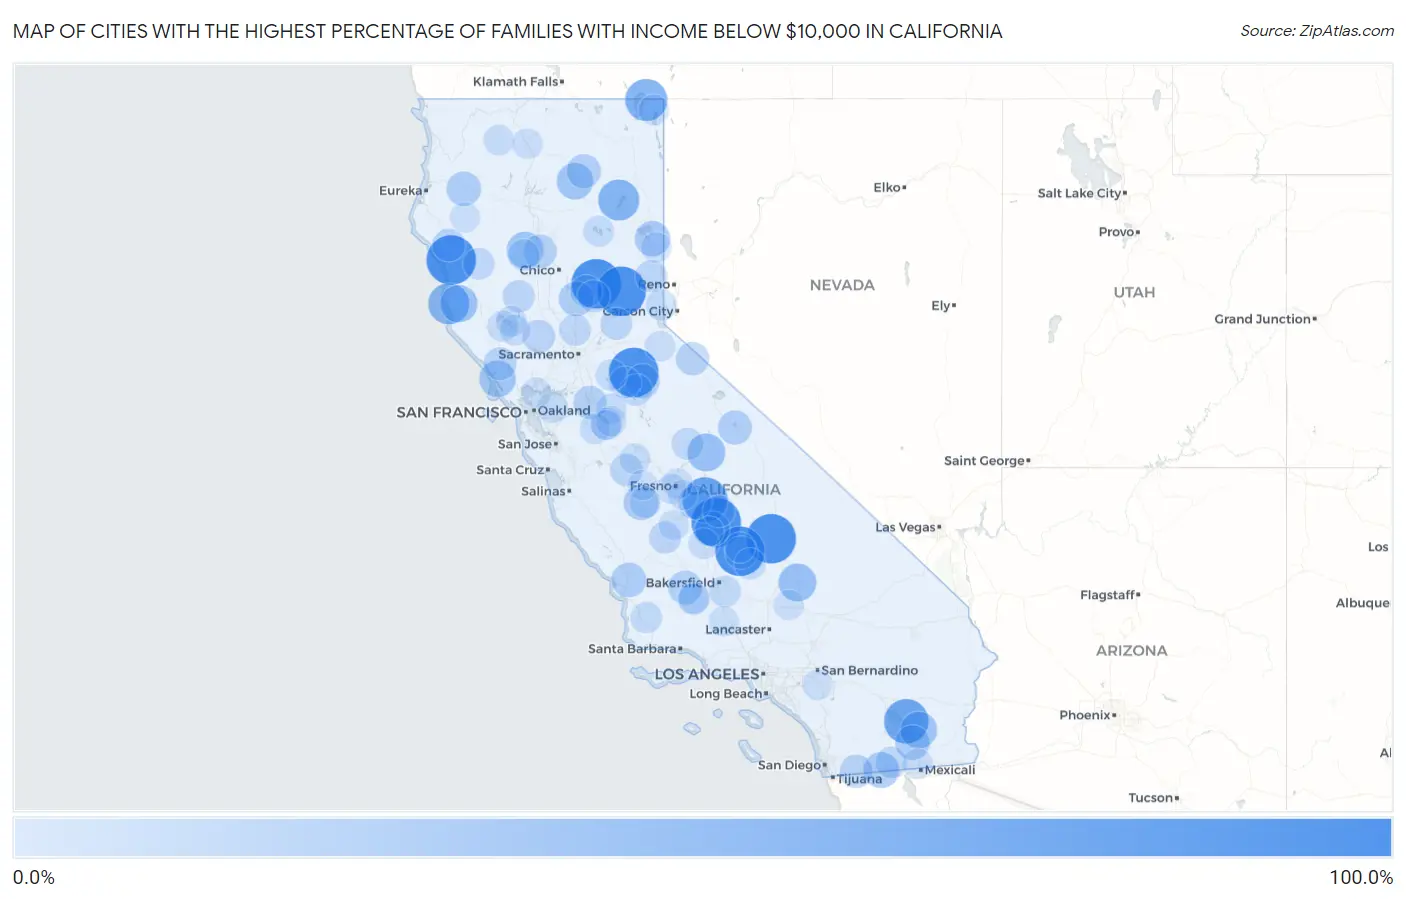
Map of Cities with the Highest Percentage of Families with Income Below $10,000 in California
0.0%
100.0%
Cities with the Highest Percentage of Families with Income Below $10,000 in California
| City | Families with Income < $10k | vs State | vs National | |
| 1. | Clipper Mills | 100.0% | 2.9%(+97.1)#1 | 3.1%(+96.9)#3 |
| 2. | Kennedy Meadows | 100.0% | 2.9%(+97.1)#2 | 3.1%(+96.9)#14 |
| 3. | Dales | 100.0% | 2.9%(+97.1)#3 | 3.1%(+96.9)#15 |
| 4. | Rail Road Flat | 100.0% | 2.9%(+97.1)#4 | 3.1%(+96.9)#16 |
| 5. | El Rancho | 100.0% | 2.9%(+97.1)#5 | 3.1%(+96.9)#20 |
| 6. | Leggett | 100.0% | 2.9%(+97.1)#6 | 3.1%(+96.9)#24 |
| 7. | Mcclenney Tract | 100.0% | 2.9%(+97.1)#7 | 3.1%(+96.9)#34 |
| 8. | Graniteville | 100.0% | 2.9%(+97.1)#8 | 3.1%(+96.9)#36 |
| 9. | East Orosi | 80.0% | 2.9%(+77.1)#9 | 3.1%(+76.9)#49 |
| 10. | Bombay Beach | 75.9% | 2.9%(+73.0)#10 | 3.1%(+72.8)#55 |
| 11. | New Pine Creek | 64.7% | 2.9%(+61.8)#11 | 3.1%(+61.6)#73 |
| 12. | Spaulding | 60.4% | 2.9%(+57.5)#12 | 3.1%(+57.3)#82 |
| 13. | Little River | 60.3% | 2.9%(+57.4)#13 | 3.1%(+57.2)#84 |
| 14. | Big Creek | 45.8% | 2.9%(+42.9)#14 | 3.1%(+42.7)#158 |
| 15. | Johannesburg | 45.5% | 2.9%(+42.6)#15 | 3.1%(+42.4)#161 |
| 16. | Comptche | 43.5% | 2.9%(+40.6)#16 | 3.1%(+40.4)#176 |
| 17. | Niland | 40.3% | 2.9%(+37.4)#17 | 3.1%(+37.2)#208 |
| 18. | Rancho Tehama Reserve | 39.7% | 2.9%(+36.8)#18 | 3.1%(+36.6)#223 |
| 19. | Tomales | 39.6% | 2.9%(+36.7)#19 | 3.1%(+36.5)#225 |
| 20. | Cassel | 39.2% | 2.9%(+36.3)#20 | 3.1%(+36.1)#228 |
| 21. | Jacumba | 36.2% | 2.9%(+33.3)#21 | 3.1%(+33.1)#274 |
| 22. | Patton Village | 34.6% | 2.9%(+31.7)#22 | 3.1%(+31.5)#300 |
| 23. | Three Rocks | 33.3% | 2.9%(+30.4)#23 | 3.1%(+30.2)#320 |
| 24. | Honcut | 32.3% | 2.9%(+29.4)#24 | 3.1%(+29.2)#350 |
| 25. | Westmorland | 31.2% | 2.9%(+28.3)#25 | 3.1%(+28.1)#372 |
| 26. | Plainview | 30.9% | 2.9%(+28.0)#26 | 3.1%(+27.8)#383 |
| 27. | Garden Farms | 30.9% | 2.9%(+28.0)#27 | 3.1%(+27.8)#384 |
| 28. | Burnt Ranch | 30.3% | 2.9%(+27.4)#28 | 3.1%(+27.2)#400 |
| 29. | Avery | 29.8% | 2.9%(+26.9)#29 | 3.1%(+26.7)#415 |
| 30. | Mcarthur | 28.7% | 2.9%(+25.8)#30 | 3.1%(+25.6)#444 |
| 31. | Crowley Lake | 28.6% | 2.9%(+25.7)#31 | 3.1%(+25.5)#446 |
| 32. | Delft Colony | 27.4% | 2.9%(+24.5)#32 | 3.1%(+24.3)#492 |
| 33. | Mckittrick | 26.7% | 2.9%(+23.8)#33 | 3.1%(+23.6)#516 |
| 34. | Richfield | 26.5% | 2.9%(+23.6)#34 | 3.1%(+23.4)#525 |
| 35. | Taft Mosswood | 25.7% | 2.9%(+22.8)#35 | 3.1%(+22.6)#558 |
| 36. | Walker | 25.0% | 2.9%(+22.1)#36 | 3.1%(+21.9)#589 |
| 37. | Potrero | 24.6% | 2.9%(+21.7)#37 | 3.1%(+21.5)#613 |
| 38. | Guinda | 23.2% | 2.9%(+20.3)#38 | 3.1%(+20.1)#693 |
| 39. | Graton | 23.0% | 2.9%(+20.1)#39 | 3.1%(+19.9)#702 |
| 40. | Benbow | 22.9% | 2.9%(+20.0)#40 | 3.1%(+19.8)#707 |
| 41. | Panorama Heights | 22.2% | 2.9%(+19.3)#41 | 3.1%(+19.1)#752 |
| 42. | Rackerby | 21.7% | 2.9%(+18.8)#42 | 3.1%(+18.6)#777 |
| 43. | South Dos Palos | 21.4% | 2.9%(+18.5)#43 | 3.1%(+18.3)#794 |
| 44. | South Taft | 20.5% | 2.9%(+17.6)#44 | 3.1%(+17.4)#852 |
| 45. | Dobbins | 20.5% | 2.9%(+17.6)#45 | 3.1%(+17.4)#860 |
| 46. | Stonyford | 20.0% | 2.9%(+17.1)#46 | 3.1%(+16.9)#907 |
| 47. | Foresthill | 19.5% | 2.9%(+16.6)#47 | 3.1%(+16.4)#945 |
| 48. | Kettleman City | 19.5% | 2.9%(+16.6)#48 | 3.1%(+16.4)#947 |
| 49. | Sierra Brooks | 19.3% | 2.9%(+16.4)#49 | 3.1%(+16.2)#978 |
| 50. | Bass Lake | 19.2% | 2.9%(+16.3)#50 | 3.1%(+16.1)#990 |
| 51. | Lemon Cove | 19.0% | 2.9%(+16.1)#51 | 3.1%(+15.9)#1,004 |
| 52. | Vallecito | 18.6% | 2.9%(+15.7)#52 | 3.1%(+15.5)#1,039 |
| 53. | Rouse | 18.5% | 2.9%(+15.6)#53 | 3.1%(+15.4)#1,044 |
| 54. | Silverado | 18.3% | 2.9%(+15.4)#54 | 3.1%(+15.2)#1,064 |
| 55. | San Andreas | 18.1% | 2.9%(+15.2)#55 | 3.1%(+15.0)#1,095 |
| 56. | Ocotillo | 18.1% | 2.9%(+15.2)#56 | 3.1%(+15.0)#1,102 |
| 57. | La Grange | 17.9% | 2.9%(+15.0)#57 | 3.1%(+14.8)#1,123 |
| 58. | Covelo | 17.8% | 2.9%(+14.9)#58 | 3.1%(+14.7)#1,127 |
| 59. | East Nicolaus | 17.8% | 2.9%(+14.9)#59 | 3.1%(+14.7)#1,129 |
| 60. | Dixon Lane Meadow Creek | 16.9% | 2.9%(+14.0)#60 | 3.1%(+13.8)#1,214 |
| 61. | Weedpatch | 16.7% | 2.9%(+13.8)#61 | 3.1%(+13.6)#1,234 |
| 62. | Sisquoc | 16.7% | 2.9%(+13.8)#62 | 3.1%(+13.6)#1,248 |
| 63. | Flournoy | 16.7% | 2.9%(+13.8)#63 | 3.1%(+13.6)#1,251 |
| 64. | Lake Isabella | 16.5% | 2.9%(+13.6)#64 | 3.1%(+13.4)#1,263 |
| 65. | Lake Almanor Country Club | 15.9% | 2.9%(+13.0)#65 | 3.1%(+12.8)#1,338 |
| 66. | Buena Vista | 15.7% | 2.9%(+12.8)#66 | 3.1%(+12.6)#1,359 |
| 67. | Diablo | 15.2% | 2.9%(+12.3)#67 | 3.1%(+12.1)#1,440 |
| 68. | Kings Beach | 14.9% | 2.9%(+12.0)#68 | 3.1%(+11.8)#1,470 |
| 69. | Cantua Creek | 14.8% | 2.9%(+11.9)#69 | 3.1%(+11.7)#1,495 |
| 70. | East Bakersfield | 14.4% | 2.9%(+11.5)#70 | 3.1%(+11.3)#1,561 |
| 71. | Kelseyville | 14.0% | 2.9%(+11.1)#71 | 3.1%(+10.9)#1,665 |
| 72. | Teviston | 13.9% | 2.9%(+11.0)#72 | 3.1%(+10.8)#1,689 |
| 73. | Clearlake Oaks | 13.8% | 2.9%(+10.9)#73 | 3.1%(+10.7)#1,700 |
| 74. | El Nido | 13.7% | 2.9%(+10.8)#74 | 3.1%(+10.6)#1,727 |
| 75. | Lower Lake | 13.6% | 2.9%(+10.7)#75 | 3.1%(+10.5)#1,739 |
| 76. | Etna | 13.6% | 2.9%(+10.7)#76 | 3.1%(+10.5)#1,746 |
| 77. | Spring Valley Cdp Lake County | 13.5% | 2.9%(+10.6)#77 | 3.1%(+10.4)#1,770 |
| 78. | Valley Home | 13.5% | 2.9%(+10.6)#78 | 3.1%(+10.4)#1,778 |
| 79. | Westley | 13.4% | 2.9%(+10.5)#79 | 3.1%(+10.3)#1,795 |
| 80. | Kirkwood | 13.2% | 2.9%(+10.3)#80 | 3.1%(+10.1)#1,848 |
| 81. | Fort Bidwell | 13.2% | 2.9%(+10.3)#81 | 3.1%(+10.1)#1,849 |
| 82. | San Miguel Cdp San Luis Obispo County | 13.1% | 2.9%(+10.2)#82 | 3.1%(+10.00)#1,853 |
| 83. | Weed | 13.0% | 2.9%(+10.1)#83 | 3.1%(+9.90)#1,874 |
| 84. | Doyle | 12.7% | 2.9%(+9.80)#84 | 3.1%(+9.60)#1,948 |
| 85. | Mayfair | 12.6% | 2.9%(+9.70)#85 | 3.1%(+9.50)#1,967 |
| 86. | Stratford | 12.5% | 2.9%(+9.60)#86 | 3.1%(+9.40)#1,989 |
| 87. | Heber | 12.4% | 2.9%(+9.50)#87 | 3.1%(+9.30)#2,020 |
| 88. | Frazier Park | 12.1% | 2.9%(+9.20)#88 | 3.1%(+9.00)#2,095 |
| 89. | Empire | 12.0% | 2.9%(+9.10)#89 | 3.1%(+8.90)#2,124 |
| 90. | West Park | 11.8% | 2.9%(+8.90)#90 | 3.1%(+8.70)#2,189 |
| 91. | Crockett | 11.7% | 2.9%(+8.80)#91 | 3.1%(+8.60)#2,216 |
| 92. | Mad River | 11.7% | 2.9%(+8.80)#92 | 3.1%(+8.60)#2,235 |
| 93. | North Edwards | 11.5% | 2.9%(+8.60)#93 | 3.1%(+8.40)#2,291 |
| 94. | Pine Flat | 11.5% | 2.9%(+8.60)#94 | 3.1%(+8.40)#2,304 |
| 95. | Bret Harte | 11.4% | 2.9%(+8.50)#95 | 3.1%(+8.30)#2,317 |
| 96. | Taft Heights | 11.4% | 2.9%(+8.50)#96 | 3.1%(+8.30)#2,322 |
| 97. | March Arb | 11.4% | 2.9%(+8.50)#97 | 3.1%(+8.30)#2,326 |
| 98. | Mendota | 11.3% | 2.9%(+8.40)#98 | 3.1%(+8.20)#2,346 |
| 99. | Fowler | 11.1% | 2.9%(+8.20)#99 | 3.1%(+8.00)#2,407 |
| 100. | Woodville | 11.1% | 2.9%(+8.20)#100 | 3.1%(+8.00)#2,420 |
Common Questions
What are the Top 10 Cities with the Highest Percentage of Families with Income Below $10,000 in California?
Top 10 Cities with the Highest Percentage of Families with Income Below $10,000 in California are:
#1
100.0%
#2
100.0%
#3
100.0%
#4
100.0%
#5
100.0%
#6
100.0%
#7
100.0%
#8
80.0%
#9
75.9%
#10
64.7%
What city has the Highest Percentage of Families with Income Below $10,000 in California?
Clipper Mills has the Highest Percentage of Families with Income Below $10,000 in California with 100.0%.
What is the Percentage of Families with Income Below $10,000 in the State of California?
Percentage of Families with Income Below $10,000 in California is 2.9%.
What is the Percentage of Families with Income Below $10,000 in the United States?
Percentage of Families with Income Below $10,000 in the United States is 3.1%.