Cities with the Largest Central American Indian Community in California
RELATED REPORTS & OPTIONS
Central American Indian
California
Compare Cities
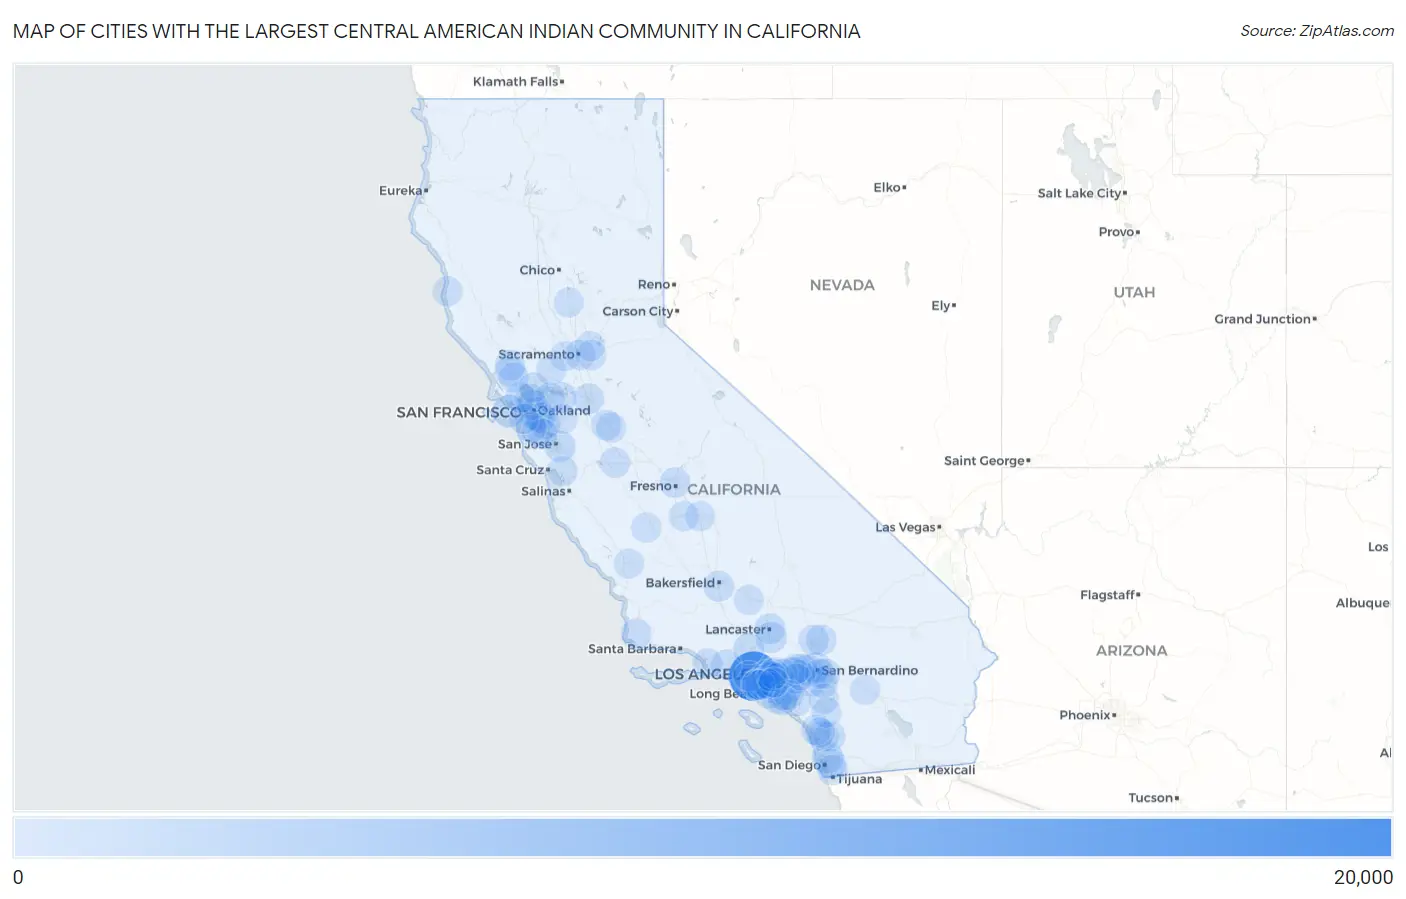
Map of Cities with the Largest Central American Indian Community in California
0
20,000
Cities with the Largest Central American Indian Community in California
| City | Central American Indian | vs State | vs National | |
| 1. | Los Angeles | 15,400 | 78,655(19.58%)#1 | 374,148(4.12%)#2 |
| 2. | Oakland | 2,195 | 78,655(2.79%)#2 | 374,148(0.59%)#8 |
| 3. | San Francisco | 1,918 | 78,655(2.44%)#3 | 374,148(0.51%)#11 |
| 4. | Long Beach | 1,174 | 78,655(1.49%)#4 | 374,148(0.31%)#19 |
| 5. | Anaheim | 1,155 | 78,655(1.47%)#5 | 374,148(0.31%)#21 |
| 6. | San Diego | 1,153 | 78,655(1.47%)#6 | 374,148(0.31%)#22 |
| 7. | San Jose | 1,073 | 78,655(1.36%)#7 | 374,148(0.29%)#25 |
| 8. | Palmdale | 903 | 78,655(1.15%)#8 | 374,148(0.24%)#36 |
| 9. | Santa Clarita | 879 | 78,655(1.12%)#9 | 374,148(0.23%)#37 |
| 10. | Redwood City | 795 | 78,655(1.01%)#10 | 374,148(0.21%)#41 |
| 11. | Pomona | 726 | 78,655(0.92%)#11 | 374,148(0.19%)#45 |
| 12. | Fontana | 707 | 78,655(0.90%)#12 | 374,148(0.19%)#48 |
| 13. | Hayward | 704 | 78,655(0.90%)#13 | 374,148(0.19%)#50 |
| 14. | Stockton | 701 | 78,655(0.89%)#14 | 374,148(0.19%)#52 |
| 15. | South Gate | 682 | 78,655(0.87%)#15 | 374,148(0.18%)#53 |
| 16. | Bakersfield | 677 | 78,655(0.86%)#16 | 374,148(0.18%)#54 |
| 17. | Lancaster | 668 | 78,655(0.85%)#17 | 374,148(0.18%)#57 |
| 18. | Escondido | 624 | 78,655(0.79%)#18 | 374,148(0.17%)#65 |
| 19. | El Monte | 597 | 78,655(0.76%)#19 | 374,148(0.16%)#70 |
| 20. | Downey | 582 | 78,655(0.74%)#20 | 374,148(0.16%)#71 |
| 21. | Riverside | 534 | 78,655(0.68%)#21 | 374,148(0.14%)#79 |
| 22. | Apple Valley | 522 | 78,655(0.66%)#22 | 374,148(0.14%)#86 |
| 23. | San Marcos | 503 | 78,655(0.64%)#23 | 374,148(0.13%)#90 |
| 24. | Moreno Valley | 502 | 78,655(0.64%)#24 | 374,148(0.13%)#91 |
| 25. | Fresno | 501 | 78,655(0.64%)#25 | 374,148(0.13%)#92 |
| 26. | San Leandro | 497 | 78,655(0.63%)#26 | 374,148(0.13%)#93 |
| 27. | Santa Ana | 482 | 78,655(0.61%)#27 | 374,148(0.13%)#101 |
| 28. | Antioch | 479 | 78,655(0.61%)#28 | 374,148(0.13%)#103 |
| 29. | Santa Rosa | 476 | 78,655(0.61%)#29 | 374,148(0.13%)#105 |
| 30. | Thousand Oaks | 467 | 78,655(0.59%)#30 | 374,148(0.12%)#108 |
| 31. | Oxnard | 429 | 78,655(0.55%)#31 | 374,148(0.11%)#122 |
| 32. | Lompoc | 427 | 78,655(0.54%)#32 | 374,148(0.11%)#124 |
| 33. | Los Banos | 425 | 78,655(0.54%)#33 | 374,148(0.11%)#127 |
| 34. | San Bernardino | 417 | 78,655(0.53%)#34 | 374,148(0.11%)#133 |
| 35. | Chula Vista | 416 | 78,655(0.53%)#35 | 374,148(0.11%)#134 |
| 36. | Modesto | 414 | 78,655(0.53%)#36 | 374,148(0.11%)#135 |
| 37. | Redlands | 414 | 78,655(0.53%)#37 | 374,148(0.11%)#136 |
| 38. | Florence Graham | 412 | 78,655(0.52%)#38 | 374,148(0.11%)#137 |
| 39. | Whittier | 410 | 78,655(0.52%)#39 | 374,148(0.11%)#138 |
| 40. | Victorville | 400 | 78,655(0.51%)#40 | 374,148(0.11%)#142 |
| 41. | Berkeley | 381 | 78,655(0.48%)#41 | 374,148(0.10%)#155 |
| 42. | Compton | 374 | 78,655(0.48%)#42 | 374,148(0.10%)#159 |
| 43. | Richmond | 367 | 78,655(0.47%)#43 | 374,148(0.10%)#164 |
| 44. | East Los Angeles | 362 | 78,655(0.46%)#44 | 374,148(0.10%)#169 |
| 45. | Lake Forest | 360 | 78,655(0.46%)#45 | 374,148(0.10%)#170 |
| 46. | Rohnert Park | 354 | 78,655(0.45%)#46 | 374,148(0.09%)#177 |
| 47. | Oceanside | 347 | 78,655(0.44%)#47 | 374,148(0.09%)#183 |
| 48. | Hawthorne | 340 | 78,655(0.43%)#48 | 374,148(0.09%)#187 |
| 49. | San Rafael | 336 | 78,655(0.43%)#49 | 374,148(0.09%)#188 |
| 50. | Sacramento | 327 | 78,655(0.42%)#50 | 374,148(0.09%)#194 |
| 51. | Rancho Cucamonga | 325 | 78,655(0.41%)#51 | 374,148(0.09%)#198 |
| 52. | Norwalk | 313 | 78,655(0.40%)#52 | 374,148(0.08%)#206 |
| 53. | Huntington Beach | 306 | 78,655(0.39%)#53 | 374,148(0.08%)#214 |
| 54. | Concord | 301 | 78,655(0.38%)#54 | 374,148(0.08%)#218 |
| 55. | Ontario | 300 | 78,655(0.38%)#55 | 374,148(0.08%)#219 |
| 56. | Rancho Cordova | 290 | 78,655(0.37%)#56 | 374,148(0.08%)#227 |
| 57. | Lynwood | 290 | 78,655(0.37%)#57 | 374,148(0.08%)#228 |
| 58. | Alondra Park | 289 | 78,655(0.37%)#58 | 374,148(0.08%)#229 |
| 59. | Coalinga | 281 | 78,655(0.36%)#59 | 374,148(0.08%)#239 |
| 60. | Lemon Grove | 278 | 78,655(0.35%)#60 | 374,148(0.07%)#242 |
| 61. | Bellflower | 277 | 78,655(0.35%)#61 | 374,148(0.07%)#245 |
| 62. | Montclair | 276 | 78,655(0.35%)#62 | 374,148(0.07%)#248 |
| 63. | Tehachapi | 273 | 78,655(0.35%)#63 | 374,148(0.07%)#250 |
| 64. | West Rancho Dominguez | 268 | 78,655(0.34%)#64 | 374,148(0.07%)#255 |
| 65. | East Palo Alto | 267 | 78,655(0.34%)#65 | 374,148(0.07%)#257 |
| 66. | Citrus Heights | 264 | 78,655(0.34%)#66 | 374,148(0.07%)#259 |
| 67. | Menifee | 262 | 78,655(0.33%)#67 | 374,148(0.07%)#260 |
| 68. | Chino | 259 | 78,655(0.33%)#68 | 374,148(0.07%)#264 |
| 69. | San Mateo | 256 | 78,655(0.33%)#69 | 374,148(0.07%)#268 |
| 70. | Petaluma | 255 | 78,655(0.32%)#70 | 374,148(0.07%)#269 |
| 71. | Hacienda Heights | 253 | 78,655(0.32%)#71 | 374,148(0.07%)#273 |
| 72. | Temecula | 252 | 78,655(0.32%)#72 | 374,148(0.07%)#275 |
| 73. | Daly City | 252 | 78,655(0.32%)#73 | 374,148(0.07%)#276 |
| 74. | Santa Monica | 249 | 78,655(0.32%)#74 | 374,148(0.07%)#281 |
| 75. | Vacaville | 247 | 78,655(0.31%)#75 | 374,148(0.07%)#282 |
| 76. | Davis | 245 | 78,655(0.31%)#76 | 374,148(0.07%)#286 |
| 77. | Pico Rivera | 243 | 78,655(0.31%)#77 | 374,148(0.06%)#288 |
| 78. | Loma Linda | 243 | 78,655(0.31%)#78 | 374,148(0.06%)#290 |
| 79. | Lakewood | 240 | 78,655(0.31%)#79 | 374,148(0.06%)#294 |
| 80. | West Covina | 236 | 78,655(0.30%)#80 | 374,148(0.06%)#300 |
| 81. | Hanford | 235 | 78,655(0.30%)#81 | 374,148(0.06%)#301 |
| 82. | Live Oak | 235 | 78,655(0.30%)#82 | 374,148(0.06%)#302 |
| 83. | Tustin | 232 | 78,655(0.29%)#83 | 374,148(0.06%)#309 |
| 84. | Costa Mesa | 227 | 78,655(0.29%)#84 | 374,148(0.06%)#319 |
| 85. | Keyes | 215 | 78,655(0.27%)#85 | 374,148(0.06%)#340 |
| 86. | Paramount | 213 | 78,655(0.27%)#86 | 374,148(0.06%)#342 |
| 87. | Vallejo | 210 | 78,655(0.27%)#87 | 374,148(0.06%)#347 |
| 88. | Lawndale | 210 | 78,655(0.27%)#88 | 374,148(0.06%)#349 |
| 89. | Visalia | 205 | 78,655(0.26%)#89 | 374,148(0.05%)#357 |
| 90. | Fort Bragg | 202 | 78,655(0.26%)#90 | 374,148(0.05%)#362 |
| 91. | Upland | 199 | 78,655(0.25%)#91 | 374,148(0.05%)#367 |
| 92. | South El Monte | 198 | 78,655(0.25%)#92 | 374,148(0.05%)#368 |
| 93. | Montebello | 194 | 78,655(0.25%)#93 | 374,148(0.05%)#373 |
| 94. | Gardena | 192 | 78,655(0.24%)#94 | 374,148(0.05%)#378 |
| 95. | Watsonville | 191 | 78,655(0.24%)#95 | 374,148(0.05%)#381 |
| 96. | El Paso De Robles Paso Robles | 188 | 78,655(0.24%)#96 | 374,148(0.05%)#386 |
| 97. | Vista | 187 | 78,655(0.24%)#97 | 374,148(0.05%)#387 |
| 98. | Santa Fe Springs | 186 | 78,655(0.24%)#98 | 374,148(0.05%)#388 |
| 99. | Cathedral City | 184 | 78,655(0.23%)#99 | 374,148(0.05%)#395 |
| 100. | Livermore | 181 | 78,655(0.23%)#100 | 374,148(0.05%)#402 |
Common Questions
What are the Top 10 Cities with the Largest Central American Indian Community in California?
Top 10 Cities with the Largest Central American Indian Community in California are:
#1
15,400
#2
2,195
#3
1,918
#4
1,174
#5
1,155
#6
1,153
#7
1,073
#8
903
#9
879
#10
795
What city has the Largest Central American Indian Community in California?
Los Angeles has the Largest Central American Indian Community in California with 15,400.
What is the Total Central American Indian Population in the State of California?
Total Central American Indian Population in California is 78,655.
What is the Total Central American Indian Population in the United States?
Total Central American Indian Population in the United States is 374,148.