Zip Codes with the Highest Percentage of Population Employed in Installation, Maintenance & Repair in Vacaville, CA
RELATED REPORTS & OPTIONS
Installation, Maintenance & Repair
Vacaville
Compare Zip Codes
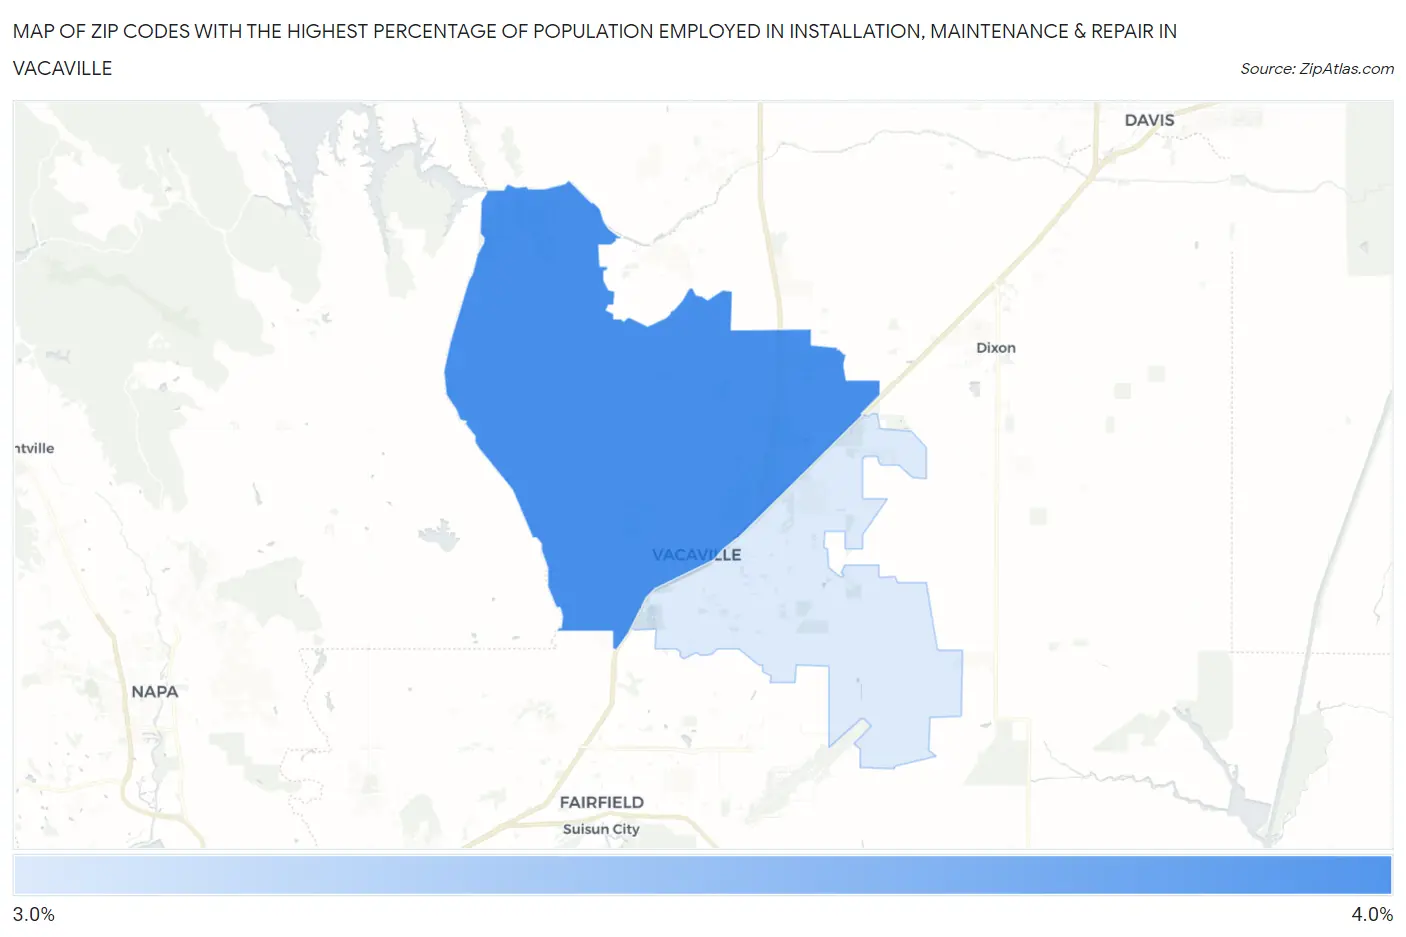
Map of Zip Codes with the Highest Percentage of Population Employed in Installation, Maintenance & Repair in Vacaville
3.1%
3.7%
Zip Codes with the Highest Percentage of Population Employed in Installation, Maintenance & Repair in Vacaville, CA
| Zip Code | % Employed | vs State | vs National | |
| 1. | 95688 | 3.7% | 2.6%(+1.16)#398 | 3.1%(+0.649)#13,604 |
| 2. | 95687 | 3.1% | 2.6%(+0.587)#550 | 3.1%(+0.075)#16,311 |
1
Common Questions
What are the Top Zip Codes with the Highest Percentage of Population Employed in Installation, Maintenance & Repair in Vacaville, CA?
Top Zip Codes with the Highest Percentage of Population Employed in Installation, Maintenance & Repair in Vacaville, CA are:
What zip code has the Highest Percentage of Population Employed in Installation, Maintenance & Repair in Vacaville, CA?
95688 has the Highest Percentage of Population Employed in Installation, Maintenance & Repair in Vacaville, CA with 3.7%.
What is the Percentage of Population Employed in Installation, Maintenance & Repair in Vacaville, CA?
Percentage of Population Employed in Installation, Maintenance & Repair in Vacaville is 3.3%.
What is the Percentage of Population Employed in Installation, Maintenance & Repair in California?
Percentage of Population Employed in Installation, Maintenance & Repair in California is 2.6%.
What is the Percentage of Population Employed in Installation, Maintenance & Repair in the United States?
Percentage of Population Employed in Installation, Maintenance & Repair in the United States is 3.1%.