Cities with the Highest Percentage of Ugandan Population in California
RELATED REPORTS & OPTIONS
Ugandan
California
Compare Cities
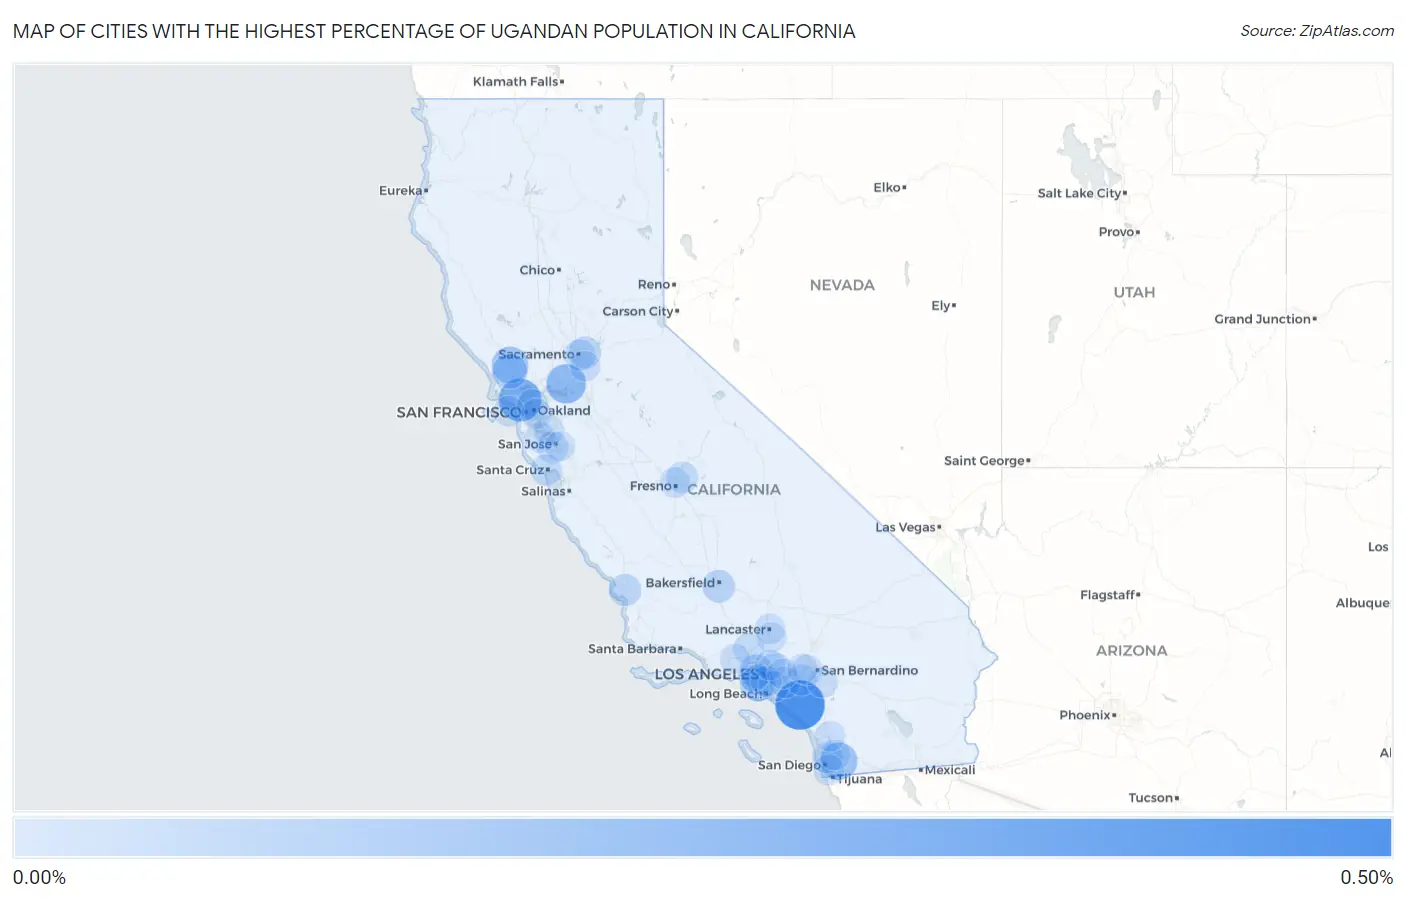
Map of Cities with the Highest Percentage of Ugandan Population in California
0.00%
0.50%
Cities with the Highest Percentage of Ugandan Population in California
| City | Ugandan | vs State | vs National | |
| 1. | Coto De Caza | 0.48% | 0.0063%(+0.473)#1 | 0.0076%(+0.472)#49 |
| 2. | Larkspur | 0.31% | 0.0063%(+0.302)#2 | 0.0076%(+0.301)#68 |
| 3. | Rio Vista | 0.23% | 0.0063%(+0.222)#3 | 0.0076%(+0.221)#92 |
| 4. | Rancho San Diego | 0.17% | 0.0063%(+0.168)#4 | 0.0076%(+0.166)#111 |
| 5. | Santa Rosa | 0.16% | 0.0063%(+0.153)#5 | 0.0076%(+0.152)#115 |
| 6. | Hawthorne | 0.12% | 0.0063%(+0.111)#6 | 0.0076%(+0.110)#129 |
| 7. | Rohnert Park | 0.11% | 0.0063%(+0.106)#7 | 0.0076%(+0.105)#132 |
| 8. | West Hollywood | 0.085% | 0.0063%(+0.079)#8 | 0.0076%(+0.077)#156 |
| 9. | Bakersfield | 0.063% | 0.0063%(+0.057)#9 | 0.0076%(+0.055)#180 |
| 10. | Arcadia | 0.059% | 0.0063%(+0.052)#10 | 0.0076%(+0.051)#186 |
| 11. | Arden Arcade | 0.049% | 0.0063%(+0.043)#11 | 0.0076%(+0.041)#205 |
| 12. | San Luis Obispo | 0.046% | 0.0063%(+0.040)#12 | 0.0076%(+0.039)#214 |
| 13. | Clovis | 0.035% | 0.0063%(+0.029)#13 | 0.0076%(+0.027)#230 |
| 14. | Campbell | 0.035% | 0.0063%(+0.028)#14 | 0.0076%(+0.027)#232 |
| 15. | Santa Cruz | 0.034% | 0.0063%(+0.028)#15 | 0.0076%(+0.027)#233 |
| 16. | Sacramento | 0.033% | 0.0063%(+0.027)#16 | 0.0076%(+0.026)#238 |
| 17. | Inglewood | 0.030% | 0.0063%(+0.024)#17 | 0.0076%(+0.022)#245 |
| 18. | Brea | 0.030% | 0.0063%(+0.023)#18 | 0.0076%(+0.022)#247 |
| 19. | Berkeley | 0.030% | 0.0063%(+0.023)#19 | 0.0076%(+0.022)#248 |
| 20. | Santa Clarita | 0.027% | 0.0063%(+0.021)#20 | 0.0076%(+0.019)#256 |
| 21. | San Diego | 0.025% | 0.0063%(+0.019)#21 | 0.0076%(+0.017)#267 |
| 22. | Eastvale | 0.022% | 0.0063%(+0.015)#22 | 0.0076%(+0.014)#277 |
| 23. | Cerritos | 0.018% | 0.0063%(+0.012)#23 | 0.0076%(+0.011)#290 |
| 24. | National City | 0.018% | 0.0063%(+0.011)#24 | 0.0076%(+0.010)#292 |
| 25. | South Gate | 0.017% | 0.0063%(+0.011)#25 | 0.0076%(+0.010)#293 |
| 26. | San Francisco | 0.016% | 0.0063%(+0.010)#26 | 0.0076%(+0.008)#305 |
| 27. | Fresno | 0.014% | 0.0063%(+0.007)#27 | 0.0076%(+0.006)#317 |
| 28. | Santee | 0.012% | 0.0063%(+0.005)#28 | 0.0076%(+0.004)#323 |
| 29. | Elk Grove | 0.0091% | 0.0063%(+0.003)#29 | 0.0076%(+0.001)#335 |
| 30. | Fontana | 0.0086% | 0.0063%(+0.002)#30 | 0.0076%(+0.001)#338 |
| 31. | Los Angeles | 0.0080% | 0.0063%(+0.002)#31 | 0.0076%(+0.000)#348 |
| 32. | Escondido | 0.0073% | 0.0063%(+0.001)#32 | 0.0076%(-0.000)#353 |
| 33. | Moreno Valley | 0.0067% | 0.0063%(+0.000)#33 | 0.0076%(-0.001)#357 |
| 34. | Pasadena | 0.0065% | 0.0063%(+0.000)#34 | 0.0076%(-0.001)#358 |
| 35. | West Covina | 0.0065% | 0.0063%(+0.000)#35 | 0.0076%(-0.001)#360 |
| 36. | Simi Valley | 0.0063% | 0.0063%(+0.000)#36 | 0.0076%(-0.001)#363 |
| 37. | Lancaster | 0.0058% | 0.0063%(-0.000)#37 | 0.0076%(-0.002)#369 |
| 38. | Stanford | 0.0058% | 0.0063%(-0.001)#38 | 0.0076%(-0.002)#371 |
| 39. | Oakland | 0.0053% | 0.0063%(-0.001)#39 | 0.0076%(-0.002)#382 |
| 40. | Fremont | 0.0052% | 0.0063%(-0.001)#40 | 0.0076%(-0.002)#384 |
| 41. | Palmdale | 0.0042% | 0.0063%(-0.002)#41 | 0.0076%(-0.003)#393 |
| 42. | San Jose | 0.00090% | 0.0063%(-0.005)#42 | 0.0076%(-0.007)#419 |
| 43. | Rancho Cucamonga | 0.00057% | 0.0063%(-0.006)#43 | 0.0076%(-0.007)#423 |
Common Questions
What are the Top 10 Cities with the Highest Percentage of Ugandan Population in California?
Top 10 Cities with the Highest Percentage of Ugandan Population in California are:
#1
0.48%
#2
0.31%
#3
0.23%
#4
0.17%
#5
0.16%
#6
0.12%
#7
0.11%
#8
0.085%
#9
0.063%
#10
0.059%
What city has the Highest Percentage of Ugandan Population in California?
Coto de Caza has the Highest Percentage of Ugandan Population in California with 0.48%.
What is the Percentage of Ugandan Population in the State of California?
Percentage of Ugandan Population in California is 0.0063%.
What is the Percentage of Ugandan Population in the United States?
Percentage of Ugandan Population in the United States is 0.0076%.