Zip Codes with the Highest Percentage of Population Employed in Installation, Maintenance & Repair in Santa Clarita, CA
RELATED REPORTS & OPTIONS
Installation, Maintenance & Repair
Santa Clarita
Compare Zip Codes
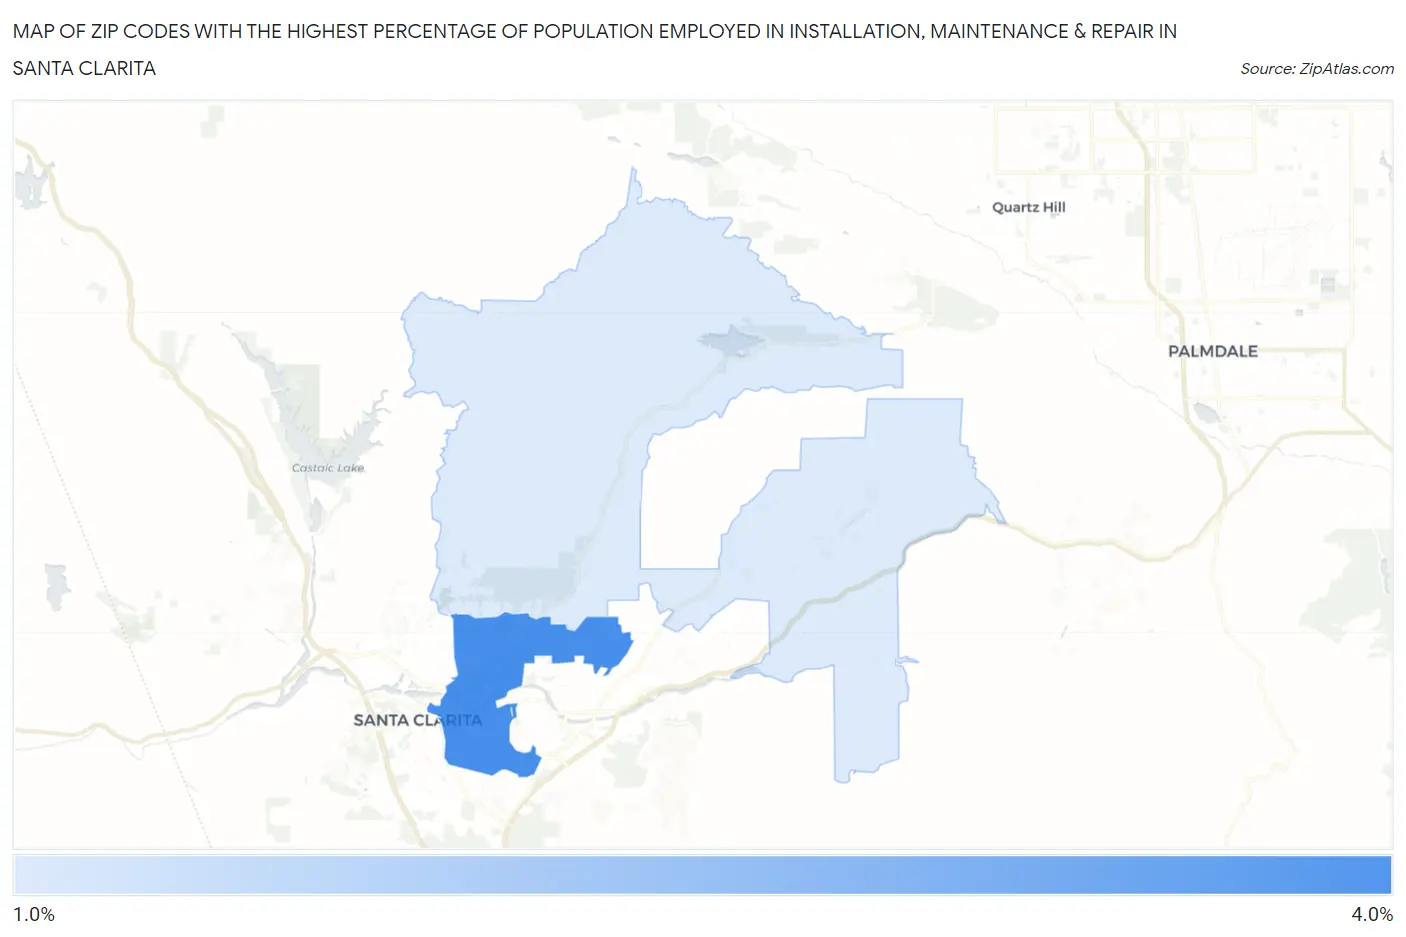
Map of Zip Codes with the Highest Percentage of Population Employed in Installation, Maintenance & Repair in Santa Clarita
1.6%
3.7%
Zip Codes with the Highest Percentage of Population Employed in Installation, Maintenance & Repair in Santa Clarita, CA
| Zip Code | % Employed | vs State | vs National | |
| 1. | 91350 | 3.7% | 2.6%(+1.15)#399 | 3.1%(+0.637)#13,641 |
| 2. | 91390 | 1.6% | 2.6%(-0.949)#1,094 | 3.1%(-1.46)#23,734 |
1
Common Questions
What are the Top Zip Codes with the Highest Percentage of Population Employed in Installation, Maintenance & Repair in Santa Clarita, CA?
Top Zip Codes with the Highest Percentage of Population Employed in Installation, Maintenance & Repair in Santa Clarita, CA are:
What zip code has the Highest Percentage of Population Employed in Installation, Maintenance & Repair in Santa Clarita, CA?
91350 has the Highest Percentage of Population Employed in Installation, Maintenance & Repair in Santa Clarita, CA with 3.7%.
What is the Percentage of Population Employed in Installation, Maintenance & Repair in Santa Clarita, CA?
Percentage of Population Employed in Installation, Maintenance & Repair in Santa Clarita is 2.5%.
What is the Percentage of Population Employed in Installation, Maintenance & Repair in California?
Percentage of Population Employed in Installation, Maintenance & Repair in California is 2.6%.
What is the Percentage of Population Employed in Installation, Maintenance & Repair in the United States?
Percentage of Population Employed in Installation, Maintenance & Repair in the United States is 3.1%.