Clear Creek, CA Map & Demographics
Clear Creek Map
Clear Creek Overview
$23,113
PER CAPITA INCOME
$48,694
AVG FAMILY INCOME
$48,472
AVG HOUSEHOLD INCOME
47.8%
WAGE / INCOME GAP [ % ]
52.2¢/ $1
WAGE / INCOME GAP [ $ ]
0.33
INEQUALITY / GINI INDEX
307
TOTAL POPULATION
139
MALE POPULATION
168
FEMALE POPULATION
82.74
MALES / 100 FEMALES
120.86
FEMALES / 100 MALES
42.9
MEDIAN AGE
2.8
AVG FAMILY SIZE
2.4
AVG HOUSEHOLD SIZE
130
LABOR FORCE [ PEOPLE ]
62.8%
PERCENT IN LABOR FORCE
Income in Clear Creek
Income Overview in Clear Creek
Per Capita Income in Clear Creek is $23,113, while median incomes of families and households are $48,694 and $48,472 respectively.
| Characteristic | Number | Measure |
| Per Capita Income | 307 | $23,113 |
| Median Family Income | 99 | $48,694 |
| Mean Family Income | 99 | $49,083 |
| Median Household Income | 127 | $48,472 |
| Mean Household Income | 127 | $52,053 |
| Income Deficit | 99 | $0 |
| Wage / Income Gap (%) | 307 | 47.81% |
| Wage / Income Gap ($) | 307 | 52.19¢ per $1 |
| Gini / Inequality Index | 307 | 0.33 |
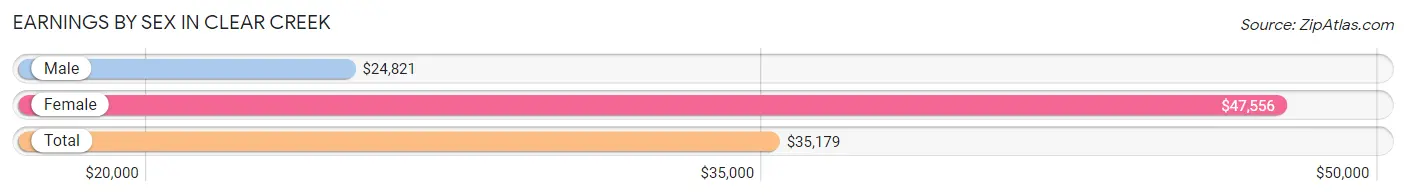
Earnings by Sex in Clear Creek
Average Earnings in Clear Creek are $35,179, $24,821 for men and $47,556 for women, a difference of 47.8%.
| Sex | Number | Average Earnings |
| Male | 39 (27.7%) | $24,821 |
| Female | 102 (72.3%) | $47,556 |
| Total | 141 (100.0%) | $35,179 |
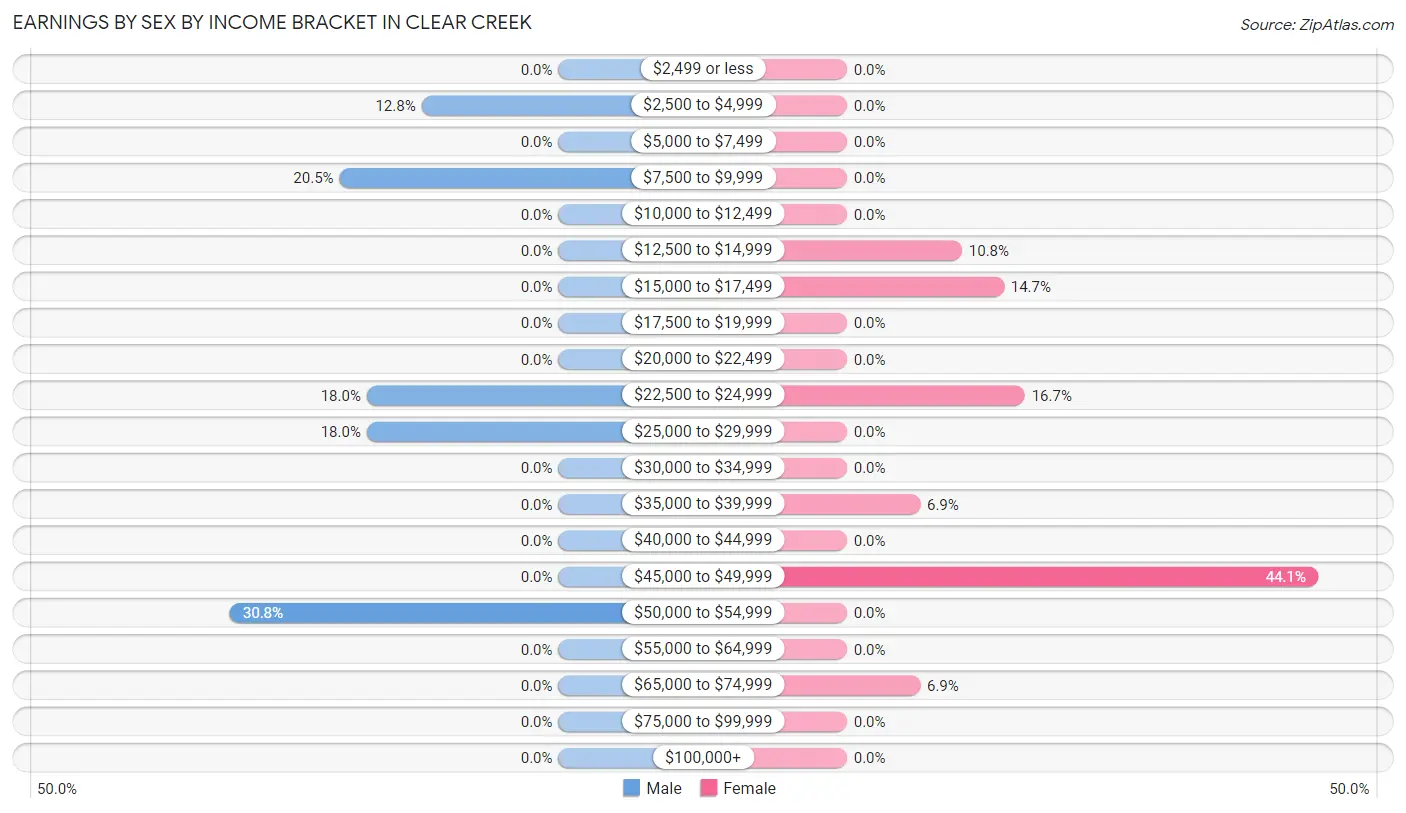
Earnings by Sex by Income Bracket in Clear Creek
The most common earnings brackets in Clear Creek are $50,000 to $54,999 for men (12 | 30.8%) and $45,000 to $49,999 for women (45 | 44.1%).
| Income | Male | Female |
| $2,499 or less | 0 (0.0%) | 0 (0.0%) |
| $2,500 to $4,999 | 5 (12.8%) | 0 (0.0%) |
| $5,000 to $7,499 | 0 (0.0%) | 0 (0.0%) |
| $7,500 to $9,999 | 8 (20.5%) | 0 (0.0%) |
| $10,000 to $12,499 | 0 (0.0%) | 0 (0.0%) |
| $12,500 to $14,999 | 0 (0.0%) | 11 (10.8%) |
| $15,000 to $17,499 | 0 (0.0%) | 15 (14.7%) |
| $17,500 to $19,999 | 0 (0.0%) | 0 (0.0%) |
| $20,000 to $22,499 | 0 (0.0%) | 0 (0.0%) |
| $22,500 to $24,999 | 7 (17.9%) | 17 (16.7%) |
| $25,000 to $29,999 | 7 (17.9%) | 0 (0.0%) |
| $30,000 to $34,999 | 0 (0.0%) | 0 (0.0%) |
| $35,000 to $39,999 | 0 (0.0%) | 7 (6.9%) |
| $40,000 to $44,999 | 0 (0.0%) | 0 (0.0%) |
| $45,000 to $49,999 | 0 (0.0%) | 45 (44.1%) |
| $50,000 to $54,999 | 12 (30.8%) | 0 (0.0%) |
| $55,000 to $64,999 | 0 (0.0%) | 0 (0.0%) |
| $65,000 to $74,999 | 0 (0.0%) | 7 (6.9%) |
| $75,000 to $99,999 | 0 (0.0%) | 0 (0.0%) |
| $100,000+ | 0 (0.0%) | 0 (0.0%) |
| Total | 39 (100.0%) | 102 (100.0%) |
Earnings by Sex by Educational Attainment in Clear Creek
| Educational Attainment | Male Income | Female Income |
| Less than High School | - | - |
| High School Diploma | - | - |
| College or Associate's Degree | - | - |
| Bachelor's Degree | - | - |
| Graduate Degree | - | - |
| Total | $24,821 | $47,972 |
Family Income in Clear Creek
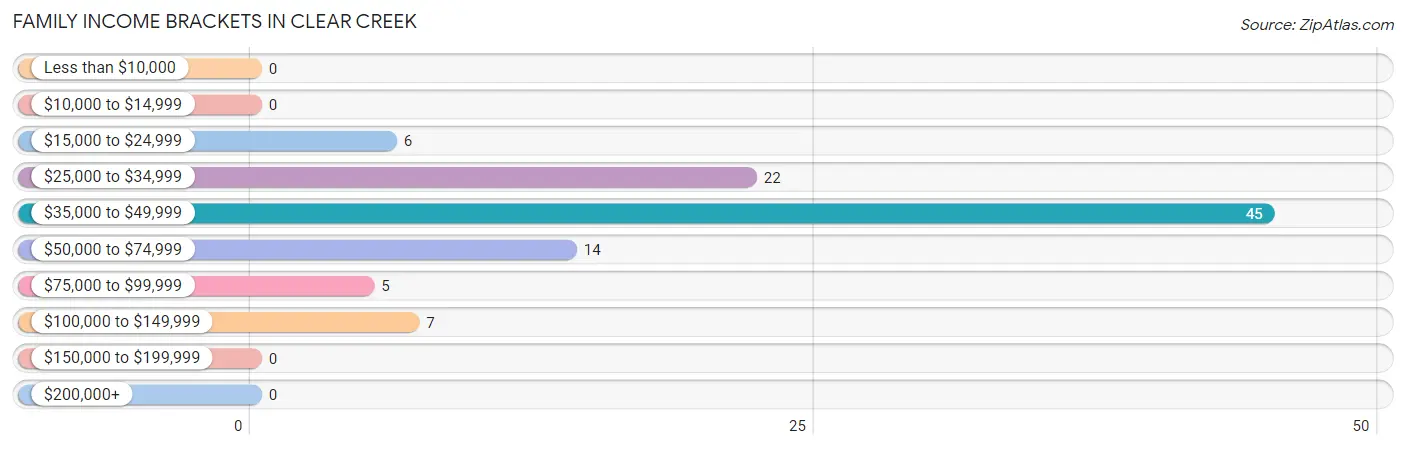
Family Income Brackets in Clear Creek
According to the Clear Creek family income data, there are 45 families falling into the $35,000 to $49,999 income range, which is the most common income bracket and makes up 45.5% of all families.
| Income Bracket | # Families | % Families |
| Less than $10,000 | 0 | 0.0% |
| $10,000 to $14,999 | 0 | 0.0% |
| $15,000 to $24,999 | 6 | 6.1% |
| $25,000 to $34,999 | 22 | 22.2% |
| $35,000 to $49,999 | 45 | 45.5% |
| $50,000 to $74,999 | 14 | 14.1% |
| $75,000 to $99,999 | 5 | 5.1% |
| $100,000 to $149,999 | 7 | 7.1% |
| $150,000 to $199,999 | 0 | 0.0% |
| $200,000+ | 0 | 0.0% |
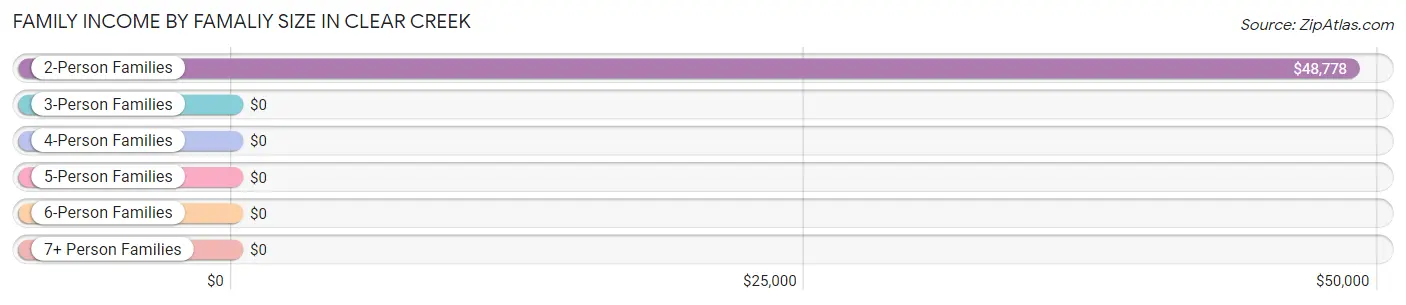
Family Income by Famaliy Size in Clear Creek
2-person families (68 | 68.7%) account for the highest median family income in Clear Creek with $48,778 per family, while 2-person families (68 | 68.7%) have the highest median income of $24,389 per family member.
| Income Bracket | # Families | Median Income |
| 2-Person Families | 68 (68.7%) | $48,778 |
| 3-Person Families | 31 (31.3%) | $0 |
| 4-Person Families | 0 (0.0%) | $0 |
| 5-Person Families | 0 (0.0%) | $0 |
| 6-Person Families | 0 (0.0%) | $0 |
| 7+ Person Families | 0 (0.0%) | $0 |
| Total | 99 (100.0%) | $48,694 |
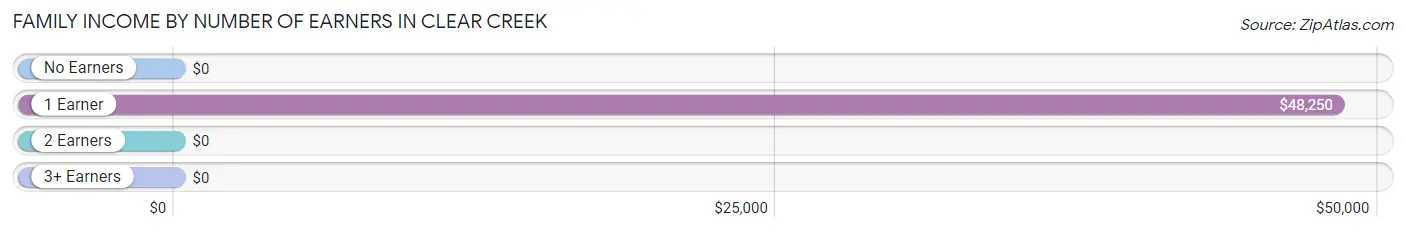
Family Income by Number of Earners in Clear Creek
| Number of Earners | # Families | Median Income |
| No Earners | 12 (12.1%) | $0 |
| 1 Earner | 73 (73.7%) | $48,250 |
| 2 Earners | 7 (7.1%) | $0 |
| 3+ Earners | 7 (7.1%) | $0 |
| Total | 99 (100.0%) | $48,694 |
Household Income in Clear Creek
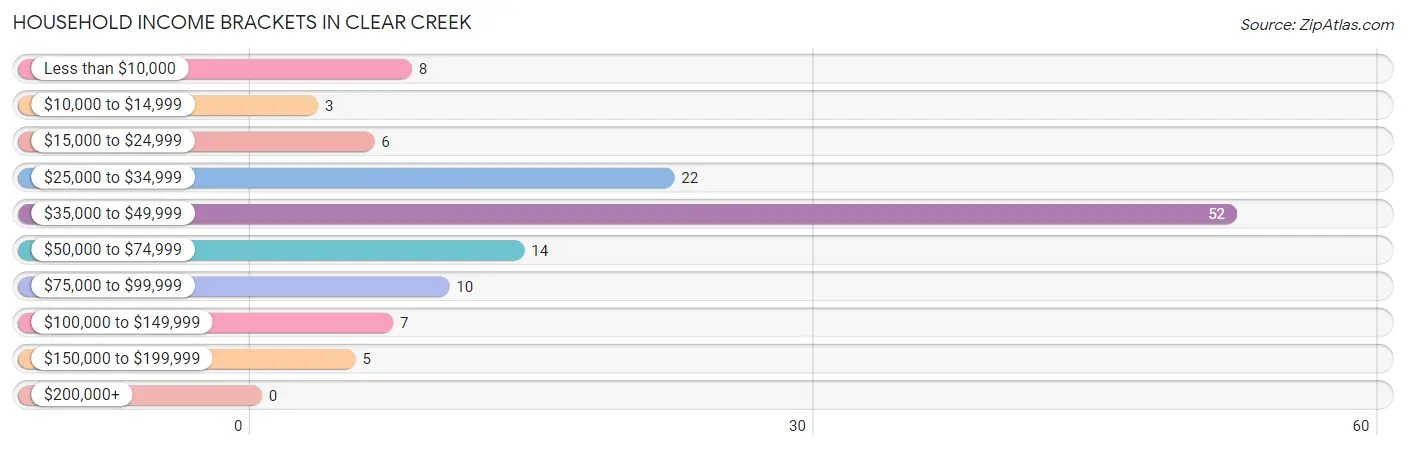
Household Income Brackets in Clear Creek
With 52 households falling in the category, the $35,000 to $49,999 income range is the most frequent in Clear Creek, accounting for 40.9% of all households.
| Income Bracket | # Households | % Households |
| Less than $10,000 | 8 | 6.3% |
| $10,000 to $14,999 | 3 | 2.4% |
| $15,000 to $24,999 | 6 | 4.7% |
| $25,000 to $34,999 | 22 | 17.3% |
| $35,000 to $49,999 | 52 | 40.9% |
| $50,000 to $74,999 | 14 | 11.0% |
| $75,000 to $99,999 | 10 | 7.9% |
| $100,000 to $149,999 | 7 | 5.5% |
| $150,000 to $199,999 | 5 | 3.9% |
| $200,000+ | 0 | 0.0% |
Household Income by Householder Age in Clear Creek
The median household income in Clear Creek is $48,472, with the highest median household income of $48,500 found in the 45 to 64 years age bracket for the primary householder. A total of 82 households (64.6%) fall into this category.
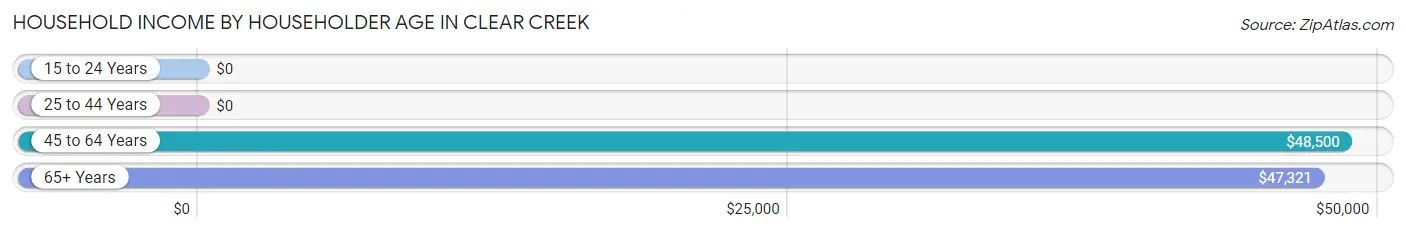
| Income Bracket | # Households | Median Income |
| 15 to 24 Years | 0 (0.0%) | $0 |
| 25 to 44 Years | 0 (0.0%) | $0 |
| 45 to 64 Years | 82 (64.6%) | $48,500 |
| 65+ Years | 45 (35.4%) | $47,321 |
| Total | 127 (100.0%) | $48,472 |
Poverty in Clear Creek
Income Below Poverty by Sex and Age in Clear Creek
With 10.8% poverty level for males and 5.4% for females among the residents of Clear Creek, 65 to 74 year old males and 65 to 74 year old females are the most vulnerable to poverty, with 15 males (68.2%) and 3 females (30.0%) in their respective age groups living below the poverty level.
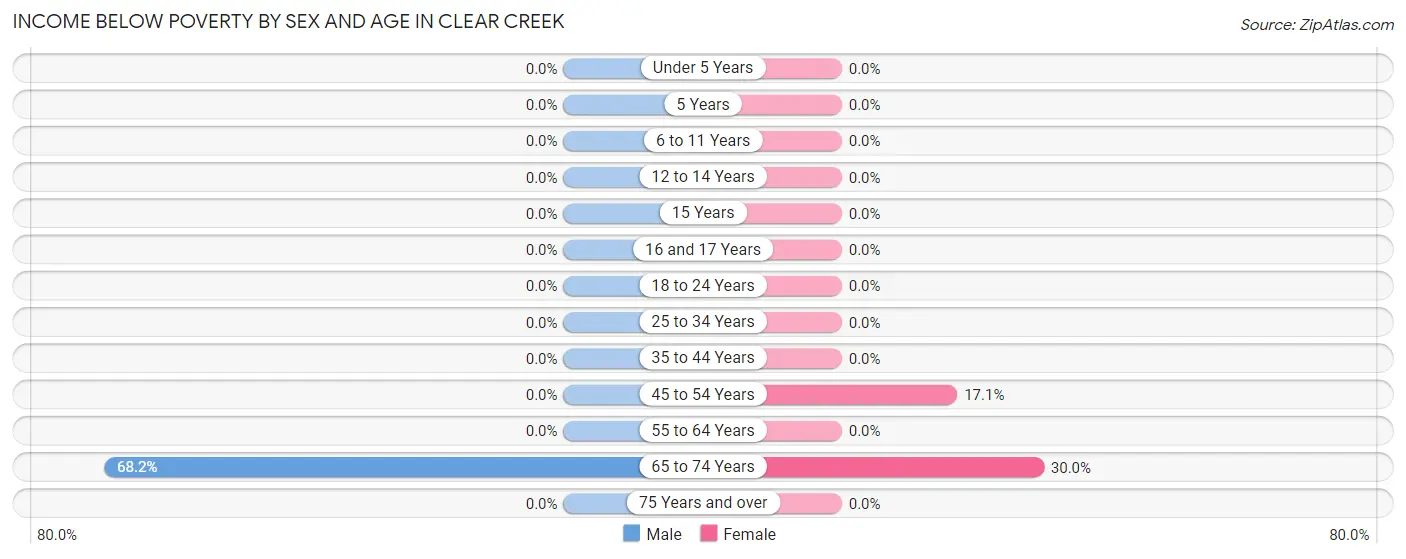
| Age Bracket | Male | Female |
| Under 5 Years | 0 (0.0%) | 0 (0.0%) |
| 5 Years | 0 (0.0%) | 0 (0.0%) |
| 6 to 11 Years | 0 (0.0%) | 0 (0.0%) |
| 12 to 14 Years | 0 (0.0%) | 0 (0.0%) |
| 15 Years | 0 (0.0%) | 0 (0.0%) |
| 16 and 17 Years | 0 (0.0%) | 0 (0.0%) |
| 18 to 24 Years | 0 (0.0%) | 0 (0.0%) |
| 25 to 34 Years | 0 (0.0%) | 0 (0.0%) |
| 35 to 44 Years | 0 (0.0%) | 0 (0.0%) |
| 45 to 54 Years | 0 (0.0%) | 6 (17.1%) |
| 55 to 64 Years | 0 (0.0%) | 0 (0.0%) |
| 65 to 74 Years | 15 (68.2%) | 3 (30.0%) |
| 75 Years and over | 0 (0.0%) | 0 (0.0%) |
| Total | 15 (10.8%) | 9 (5.4%) |
Income Above Poverty by Sex and Age in Clear Creek
According to the poverty statistics in Clear Creek, males aged 6 to 11 years and females aged 15 years are the age groups that are most secure financially, with 100.0% of males and 100.0% of females in these age groups living above the poverty line.
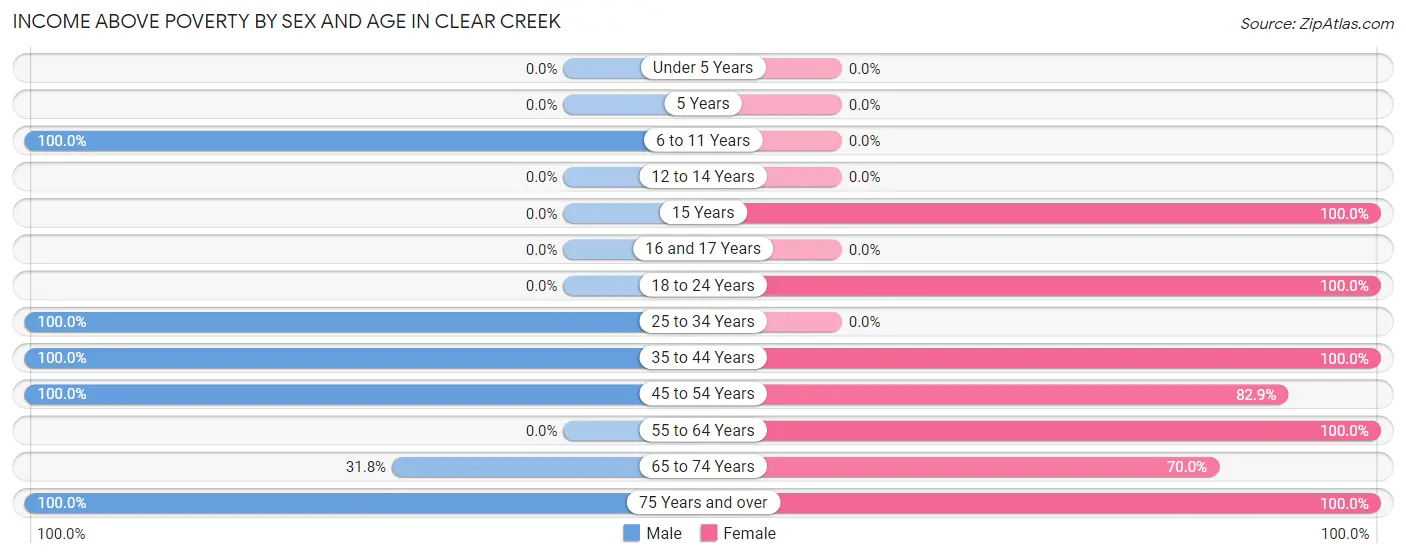
| Age Bracket | Male | Female |
| Under 5 Years | 0 (0.0%) | 0 (0.0%) |
| 5 Years | 0 (0.0%) | 0 (0.0%) |
| 6 to 11 Years | 49 (100.0%) | 0 (0.0%) |
| 12 to 14 Years | 0 (0.0%) | 0 (0.0%) |
| 15 Years | 0 (0.0%) | 51 (100.0%) |
| 16 and 17 Years | 0 (0.0%) | 0 (0.0%) |
| 18 to 24 Years | 0 (0.0%) | 15 (100.0%) |
| 25 to 34 Years | 12 (100.0%) | 0 (0.0%) |
| 35 to 44 Years | 29 (100.0%) | 7 (100.0%) |
| 45 to 54 Years | 7 (100.0%) | 29 (82.9%) |
| 55 to 64 Years | 0 (0.0%) | 45 (100.0%) |
| 65 to 74 Years | 7 (31.8%) | 7 (70.0%) |
| 75 Years and over | 20 (100.0%) | 5 (100.0%) |
| Total | 124 (89.2%) | 159 (94.6%) |
Income Below Poverty Among Married-Couple Families in Clear Creek
The poverty statistics for married-couple families in Clear Creek show that 24.0% or 6 of the total 25 families live below the poverty line. Families with no children have the highest poverty rate of 33.3%, comprising of 6 families. On the other hand, families with 1 or 2 children have the lowest poverty rate of 0.0%, which includes 0 families.
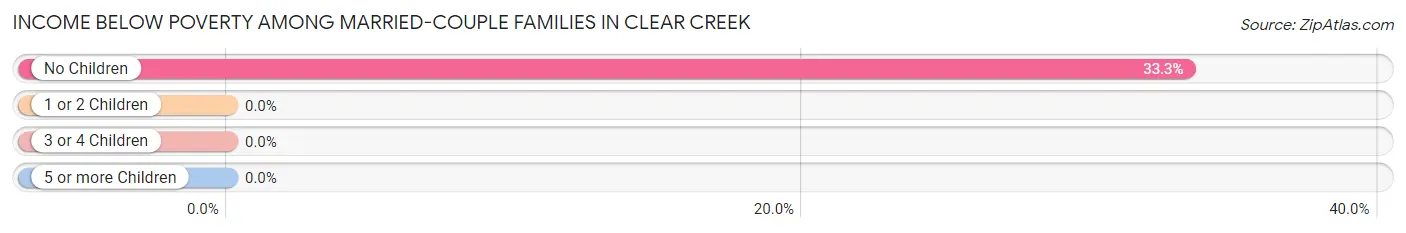
| Children | Above Poverty | Below Poverty |
| No Children | 12 (66.7%) | 6 (33.3%) |
| 1 or 2 Children | 7 (100.0%) | 0 (0.0%) |
| 3 or 4 Children | 0 (0.0%) | 0 (0.0%) |
| 5 or more Children | 0 (0.0%) | 0 (0.0%) |
| Total | 19 (76.0%) | 6 (24.0%) |
Income Below Poverty Among Single-Parent Households in Clear Creek
| Children | Single Father | Single Mother |
| No Children | 0 (0.0%) | 0 (0.0%) |
| 1 or 2 Children | 0 (0.0%) | 0 (0.0%) |
| 3 or 4 Children | 0 (0.0%) | 0 (0.0%) |
| 5 or more Children | 0 (0.0%) | 0 (0.0%) |
| Total | 0 (0.0%) | 0 (0.0%) |
Income Below Poverty Among Married-Couple vs Single-Parent Households in Clear Creek
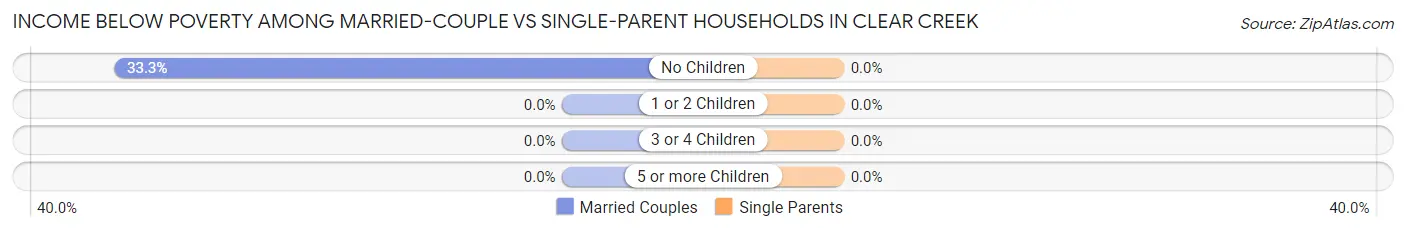
| Children | Married-Couple Families | Single-Parent Households |
| No Children | 6 (33.3%) | 0 (0.0%) |
| 1 or 2 Children | 0 (0.0%) | 0 (0.0%) |
| 3 or 4 Children | 0 (0.0%) | 0 (0.0%) |
| 5 or more Children | 0 (0.0%) | 0 (0.0%) |
| Total | 6 (24.0%) | 0 (0.0%) |
Race in Clear Creek
The most populous races in Clear Creek are White / Caucasian (229 | 74.6%), Two or more Races (78 | 25.4%), and Hispanic or Latino (19 | 6.2%).
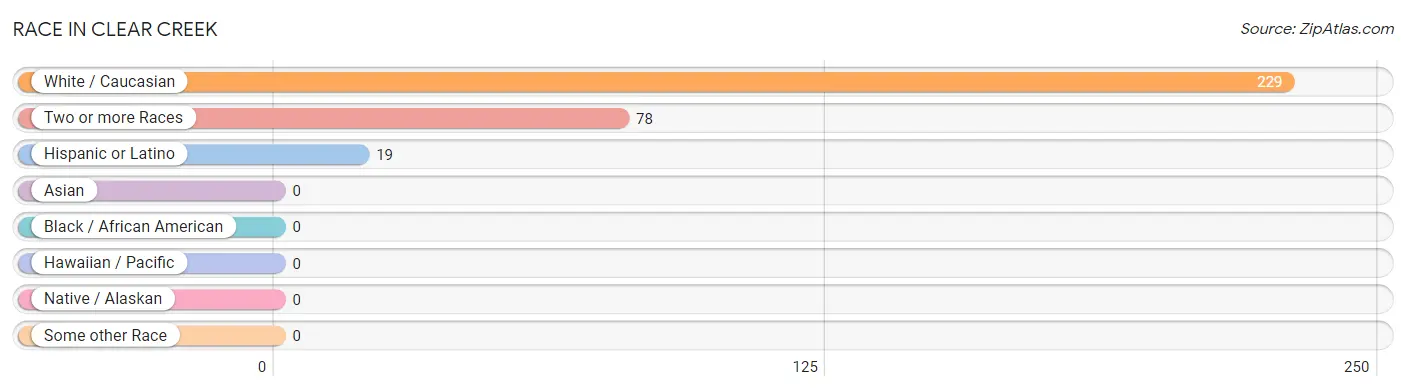
| Race | # Population | % Population |
| Asian | 0 | 0.0% |
| Black / African American | 0 | 0.0% |
| Hawaiian / Pacific | 0 | 0.0% |
| Hispanic or Latino | 19 | 6.2% |
| Native / Alaskan | 0 | 0.0% |
| White / Caucasian | 229 | 74.6% |
| Two or more Races | 78 | 25.4% |
| Some other Race | 0 | 0.0% |
| Total | 307 | 100.0% |
Ancestry in Clear Creek
The most populous ancestries reported in Clear Creek are German (91 | 29.6%), Swiss (61 | 19.9%), Blackfeet (51 | 16.6%), English (41 | 13.4%), and Italian (36 | 11.7%), together accounting for 91.2% of all Clear Creek residents.
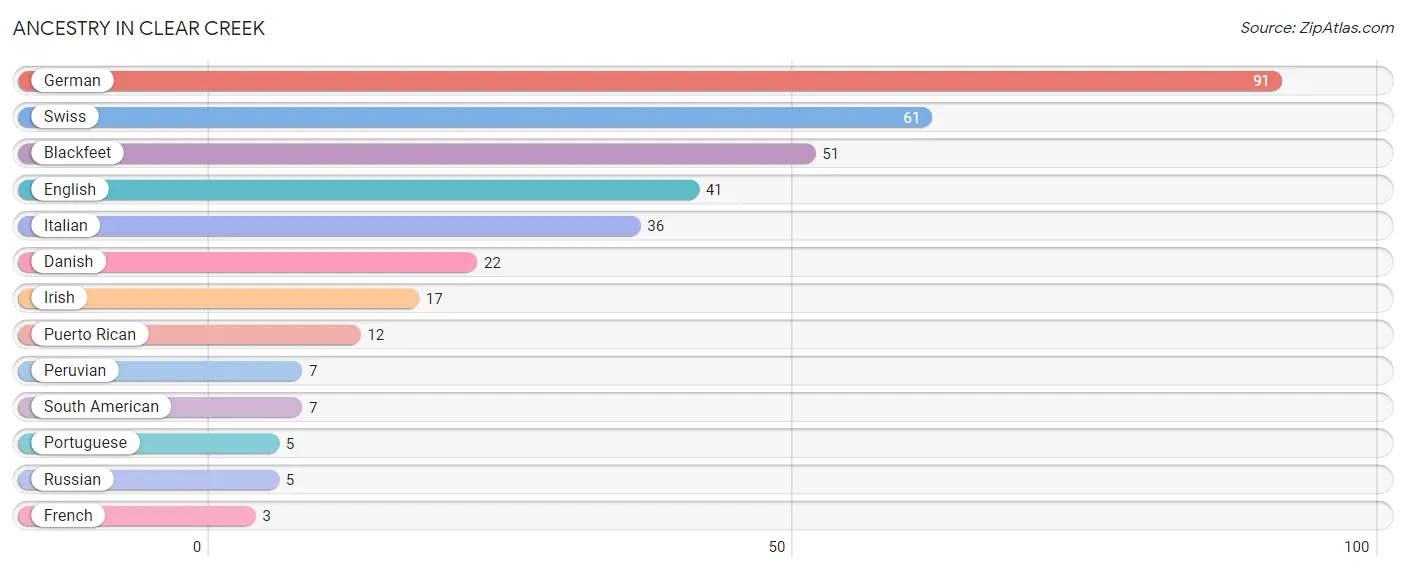
| Ancestry | # Population | % Population |
| Blackfeet | 51 | 16.6% |
| Danish | 22 | 7.2% |
| English | 41 | 13.4% |
| French | 3 | 1.0% |
| German | 91 | 29.6% |
| Irish | 17 | 5.5% |
| Italian | 36 | 11.7% |
| Peruvian | 7 | 2.3% |
| Portuguese | 5 | 1.6% |
| Puerto Rican | 12 | 3.9% |
| Russian | 5 | 1.6% |
| South American | 7 | 2.3% |
| Swiss | 61 | 19.9% | View All 13 Rows |
Immigrants in Clear Creek
The most numerous immigrant groups reported in Clear Creek came from Latin America (7 | 2.3%), Peru (7 | 2.3%), and South America (7 | 2.3%), together accounting for 6.8% of all Clear Creek residents.
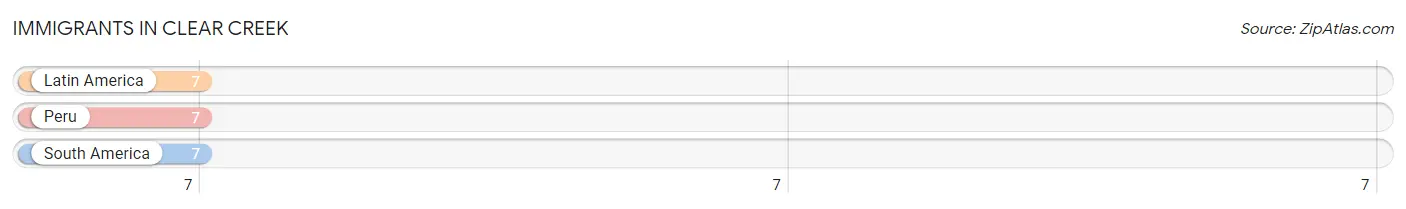
| Immigration Origin | # Population | % Population |
| Latin America | 7 | 2.3% |
| Peru | 7 | 2.3% |
| South America | 7 | 2.3% | View All 3 Rows |
Sex and Age in Clear Creek
Sex and Age in Clear Creek
The most populous age groups in Clear Creek are 5 to 9 Years (44 | 31.7%) for men and 15 to 19 Years (51 | 30.4%) for women.
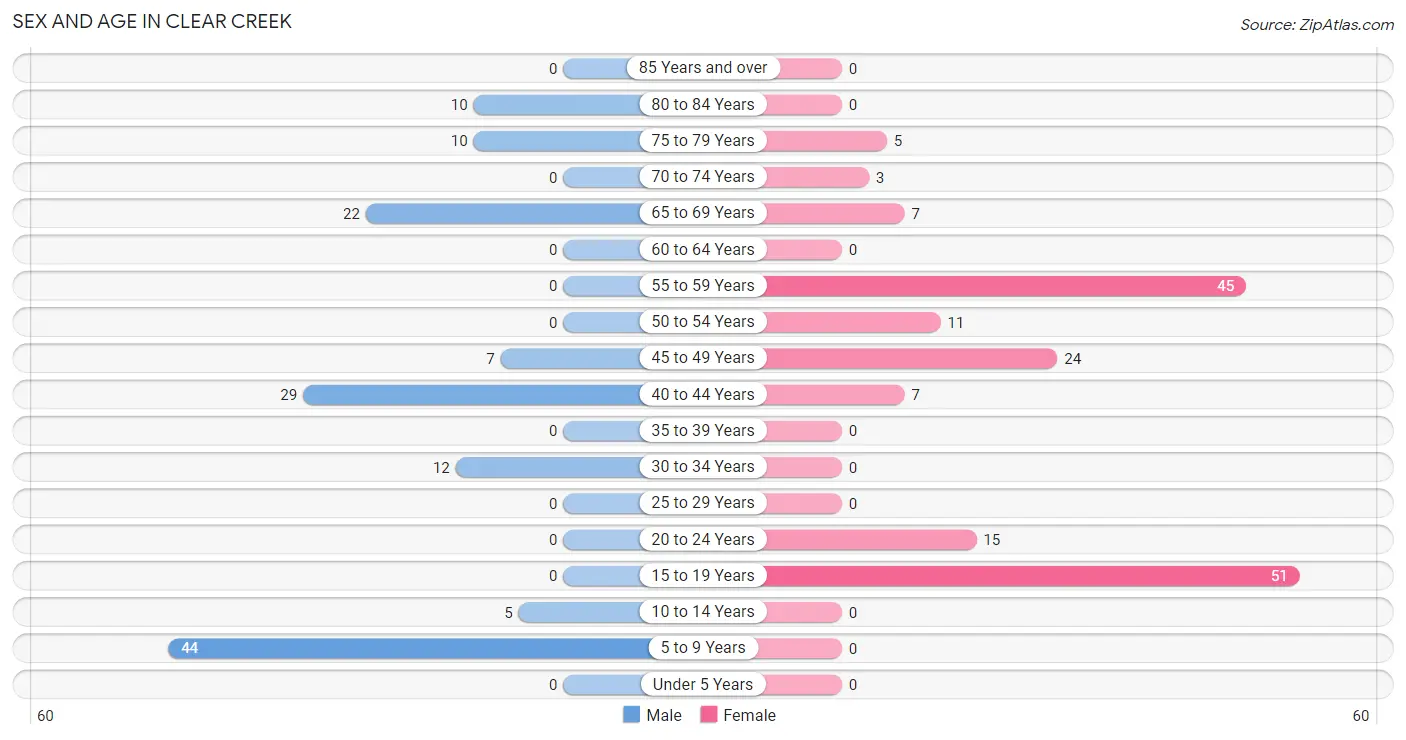
| Age Bracket | Male | Female |
| Under 5 Years | 0 (0.0%) | 0 (0.0%) |
| 5 to 9 Years | 44 (31.7%) | 0 (0.0%) |
| 10 to 14 Years | 5 (3.6%) | 0 (0.0%) |
| 15 to 19 Years | 0 (0.0%) | 51 (30.4%) |
| 20 to 24 Years | 0 (0.0%) | 15 (8.9%) |
| 25 to 29 Years | 0 (0.0%) | 0 (0.0%) |
| 30 to 34 Years | 12 (8.6%) | 0 (0.0%) |
| 35 to 39 Years | 0 (0.0%) | 0 (0.0%) |
| 40 to 44 Years | 29 (20.9%) | 7 (4.2%) |
| 45 to 49 Years | 7 (5.0%) | 24 (14.3%) |
| 50 to 54 Years | 0 (0.0%) | 11 (6.6%) |
| 55 to 59 Years | 0 (0.0%) | 45 (26.8%) |
| 60 to 64 Years | 0 (0.0%) | 0 (0.0%) |
| 65 to 69 Years | 22 (15.8%) | 7 (4.2%) |
| 70 to 74 Years | 0 (0.0%) | 3 (1.8%) |
| 75 to 79 Years | 10 (7.2%) | 5 (3.0%) |
| 80 to 84 Years | 10 (7.2%) | 0 (0.0%) |
| 85 Years and over | 0 (0.0%) | 0 (0.0%) |
| Total | 139 (100.0%) | 168 (100.0%) |
Families and Households in Clear Creek
Median Family Size in Clear Creek
The median family size in Clear Creek is 2.82 persons per family, with single male/father families (5 | 5.1%) accounting for the largest median family size of 3.4 persons per family. On the other hand, married-couple families (25 | 25.3%) represent the smallest median family size with 2.76 persons per family.
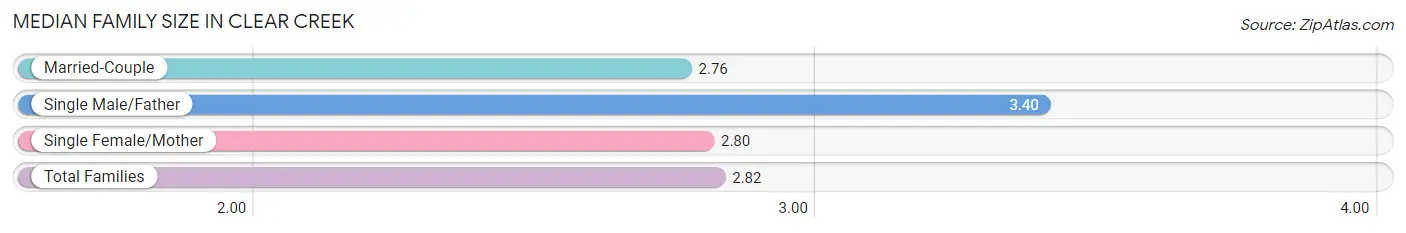
| Family Type | # Families | Family Size |
| Married-Couple | 25 (25.3%) | 2.76 |
| Single Male/Father | 5 (5.1%) | 3.40 |
| Single Female/Mother | 69 (69.7%) | 2.80 |
| Total Families | 99 (100.0%) | 2.82 |
Median Household Size in Clear Creek
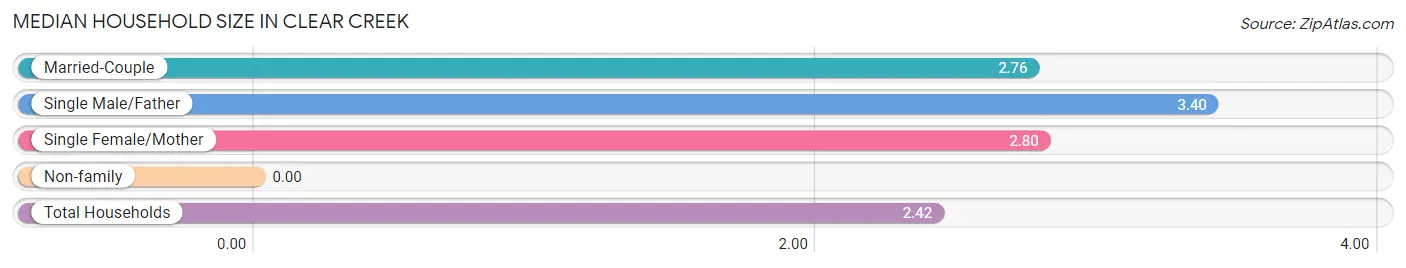
| Household Type | # Households | Household Size |
| Married-Couple | 25 (19.7%) | 2.76 |
| Single Male/Father | 5 (3.9%) | 3.40 |
| Single Female/Mother | 69 (54.3%) | 2.80 |
| Non-family | 28 (22.1%) | - |
| Total Households | 127 (100.0%) | 2.42 |
Household Size by Marriage Status in Clear Creek
Out of a total of 127 households in Clear Creek, 99 (77.9%) are family households, while 28 (22.1%) are nonfamily households. The most numerous type of family households are 2-person households, comprising 68, and the most common type of nonfamily households are 1-person households, comprising 28.
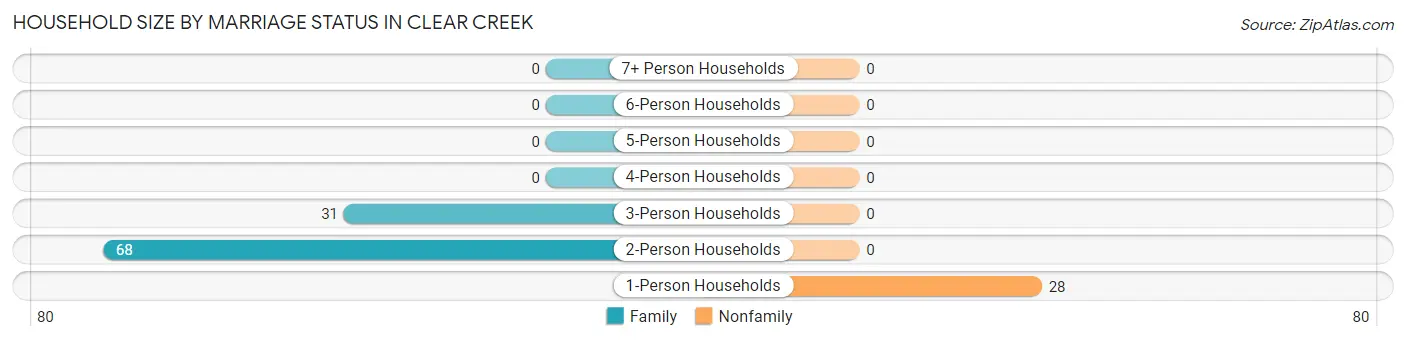
| Household Size | Family Households | Nonfamily Households |
| 1-Person Households | - | 28 (22.1%) |
| 2-Person Households | 68 (53.5%) | 0 (0.0%) |
| 3-Person Households | 31 (24.4%) | 0 (0.0%) |
| 4-Person Households | 0 (0.0%) | 0 (0.0%) |
| 5-Person Households | 0 (0.0%) | 0 (0.0%) |
| 6-Person Households | 0 (0.0%) | 0 (0.0%) |
| 7+ Person Households | 0 (0.0%) | 0 (0.0%) |
| Total | 99 (77.9%) | 28 (22.1%) |
Female Fertility in Clear Creek
Fertility by Age in Clear Creek
| Age Bracket | Women with Births | Births / 1,000 Women |
| 15 to 19 years | 0 (0.0%) | 0.0 |
| 20 to 34 years | 0 (0.0%) | 0.0 |
| 35 to 50 years | 0 (0.0%) | 0.0 |
| Total | 0 (0.0%) | 0.0 |
Fertility by Age by Marriage Status in Clear Creek
| Age Bracket | Married | Unmarried |
| 15 to 19 years | 0 (0.0%) | 0 (0.0%) |
| 20 to 34 years | 0 (0.0%) | 0 (0.0%) |
| 35 to 50 years | 0 (0.0%) | 0 (0.0%) |
| Total | 0 (0.0%) | 0 (0.0%) |
Fertility by Education in Clear Creek
| Educational Attainment | Women with Births | Births / 1,000 Women |
| Less than High School | 0 (0.0%) | 0.0 |
| High School Diploma | 0 (0.0%) | 0.0 |
| College or Associate's Degree | 0 (0.0%) | 0.0 |
| Bachelor's Degree | 0 (0.0%) | 0.0 |
| Graduate Degree | 0 (0.0%) | 0.0 |
| Total | 0 (0.0%) | 0.0 |
Fertility by Education by Marriage Status in Clear Creek
| Educational Attainment | Married | Unmarried |
| Less than High School | 0 (0.0%) | 0 (0.0%) |
| High School Diploma | 0 (0.0%) | 0 (0.0%) |
| College or Associate's Degree | 0 (0.0%) | 0 (0.0%) |
| Bachelor's Degree | 0 (0.0%) | 0 (0.0%) |
| Graduate Degree | 0 (0.0%) | 0 (0.0%) |
| Total | 0 (0.0%) | 0 (0.0%) |
Employment Characteristics in Clear Creek
Employment by Class of Employer in Clear Creek
Among the 130 employed individuals in Clear Creek, private company employees (56 | 43.1%), federal government employees (45 | 34.6%), and state government employees (17 | 13.1%) make up the most common classes of employment.
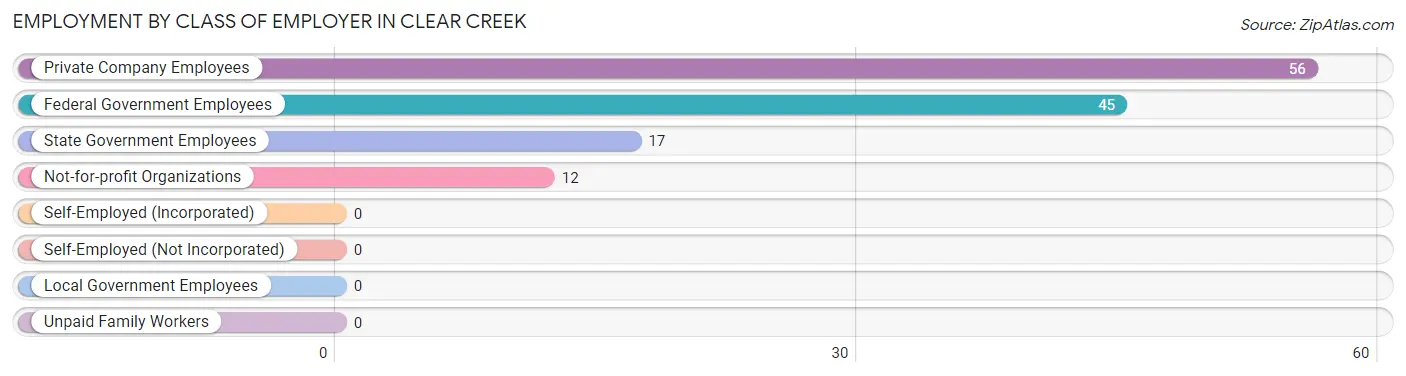
| Employer Class | # Employees | % Employees |
| Private Company Employees | 56 | 43.1% |
| Self-Employed (Incorporated) | 0 | 0.0% |
| Self-Employed (Not Incorporated) | 0 | 0.0% |
| Not-for-profit Organizations | 12 | 9.2% |
| Local Government Employees | 0 | 0.0% |
| State Government Employees | 17 | 13.1% |
| Federal Government Employees | 45 | 34.6% |
| Unpaid Family Workers | 0 | 0.0% |
| Total | 130 | 100.0% |
Employment Status by Age in Clear Creek
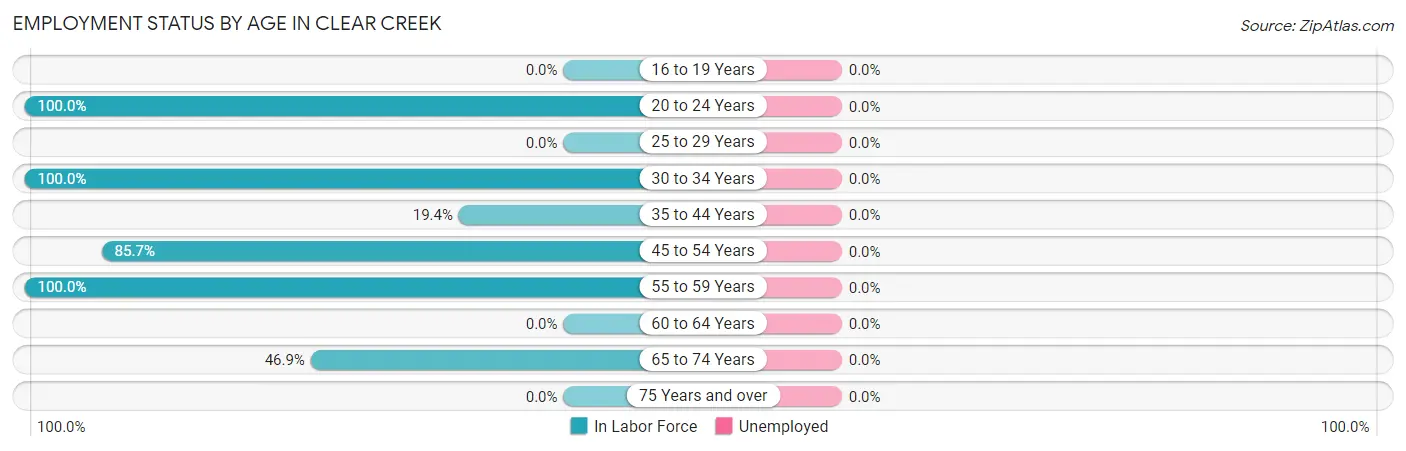
| Age Bracket | In Labor Force | Unemployed |
| 16 to 19 Years | 0 (0.0%) | 0 (0.0%) |
| 20 to 24 Years | 15 (100.0%) | 0 (0.0%) |
| 25 to 29 Years | 0 (0.0%) | 0 (0.0%) |
| 30 to 34 Years | 12 (100.0%) | 0 (0.0%) |
| 35 to 44 Years | 7 (19.4%) | 0 (0.0%) |
| 45 to 54 Years | 36 (85.7%) | 0 (0.0%) |
| 55 to 59 Years | 45 (100.0%) | 0 (0.0%) |
| 60 to 64 Years | 0 (0.0%) | 0 (0.0%) |
| 65 to 74 Years | 15 (46.9%) | 0 (0.0%) |
| 75 Years and over | 0 (0.0%) | 0 (0.0%) |
| Total | 130 (62.8%) | 0 (0.0%) |
Employment Status by Educational Attainment in Clear Creek
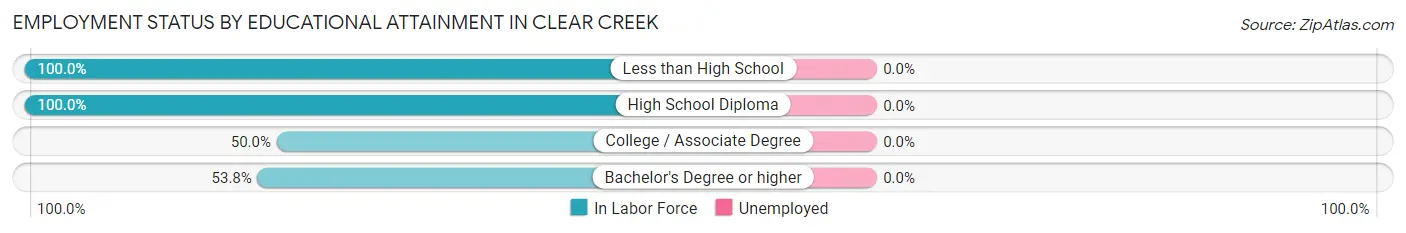
| Educational Attainment | In Labor Force | Unemployed |
| Less than High School | 7 (100.0%) | 0 (0.0%) |
| High School Diploma | 57 (100.0%) | 0 (0.0%) |
| College / Associate Degree | 29 (50.0%) | 0 (0.0%) |
| Bachelor's Degree or higher | 7 (53.8%) | 0 (0.0%) |
| Total | 100 (74.1%) | 0 (0.0%) |
Employment Occupations by Sex in Clear Creek
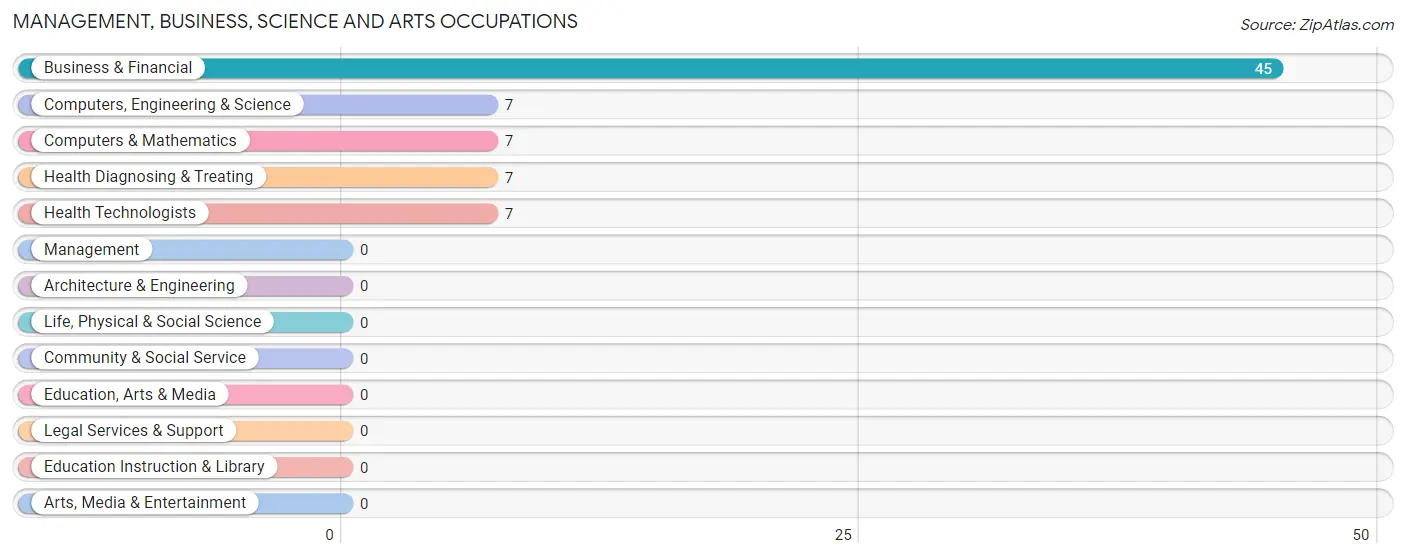
Management, Business, Science and Arts Occupations
The most common Management, Business, Science and Arts occupations in Clear Creek are Business & Financial (45 | 34.6%), Computers, Engineering & Science (7 | 5.4%), Computers & Mathematics (7 | 5.4%), Health Diagnosing & Treating (7 | 5.4%), and Health Technologists (7 | 5.4%).
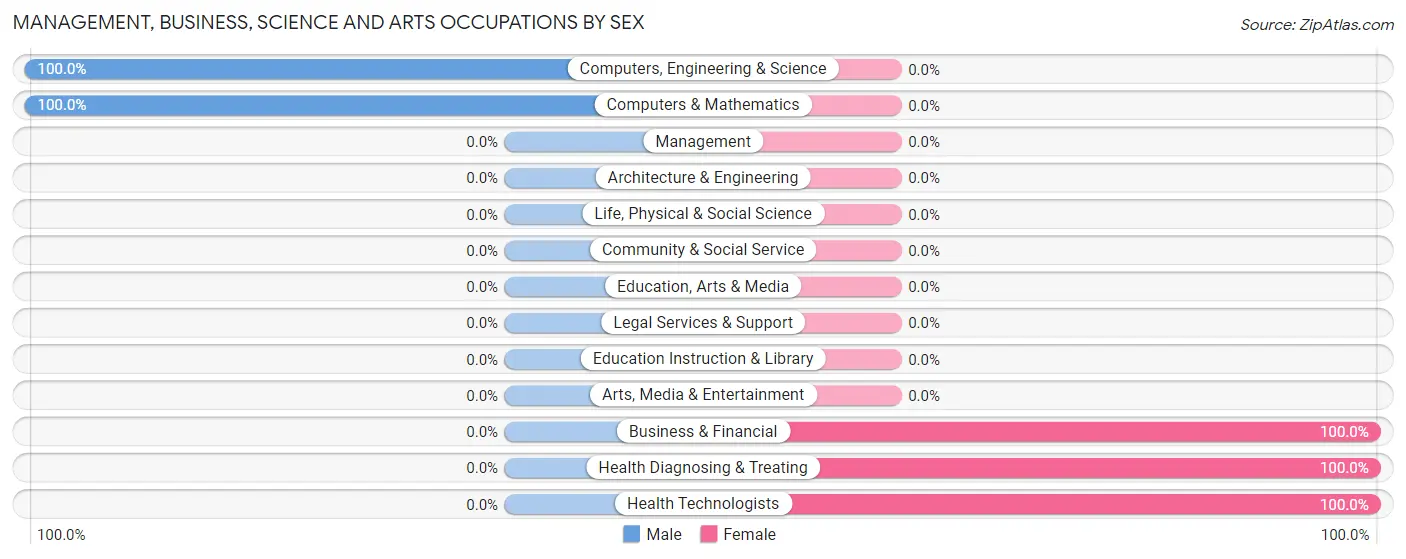
Management, Business, Science and Arts Occupations by Sex
Within the Management, Business, Science and Arts occupations in Clear Creek, the most male-oriented occupations are Computers, Engineering & Science (100.0%), and Computers & Mathematics (100.0%), while the most female-oriented occupations are Business & Financial (100.0%), Health Diagnosing & Treating (100.0%), and Health Technologists (100.0%).
| Occupation | Male | Female |
| Management | 0 (0.0%) | 0 (0.0%) |
| Business & Financial | 0 (0.0%) | 45 (100.0%) |
| Computers, Engineering & Science | 7 (100.0%) | 0 (0.0%) |
| Computers & Mathematics | 7 (100.0%) | 0 (0.0%) |
| Architecture & Engineering | 0 (0.0%) | 0 (0.0%) |
| Life, Physical & Social Science | 0 (0.0%) | 0 (0.0%) |
| Community & Social Service | 0 (0.0%) | 0 (0.0%) |
| Education, Arts & Media | 0 (0.0%) | 0 (0.0%) |
| Legal Services & Support | 0 (0.0%) | 0 (0.0%) |
| Education Instruction & Library | 0 (0.0%) | 0 (0.0%) |
| Arts, Media & Entertainment | 0 (0.0%) | 0 (0.0%) |
| Health Diagnosing & Treating | 0 (0.0%) | 7 (100.0%) |
| Health Technologists | 0 (0.0%) | 7 (100.0%) |
| Total (Category) | 7 (11.9%) | 52 (88.1%) |
| Total (Overall) | 34 (26.2%) | 96 (73.9%) |
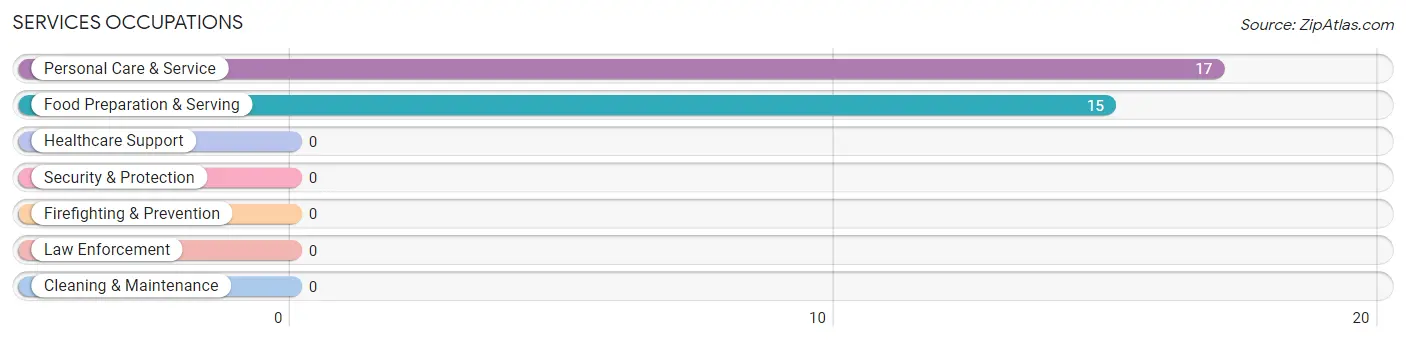
Services Occupations
The most common Services occupations in Clear Creek are Personal Care & Service (17 | 13.1%), and Food Preparation & Serving (15 | 11.5%).
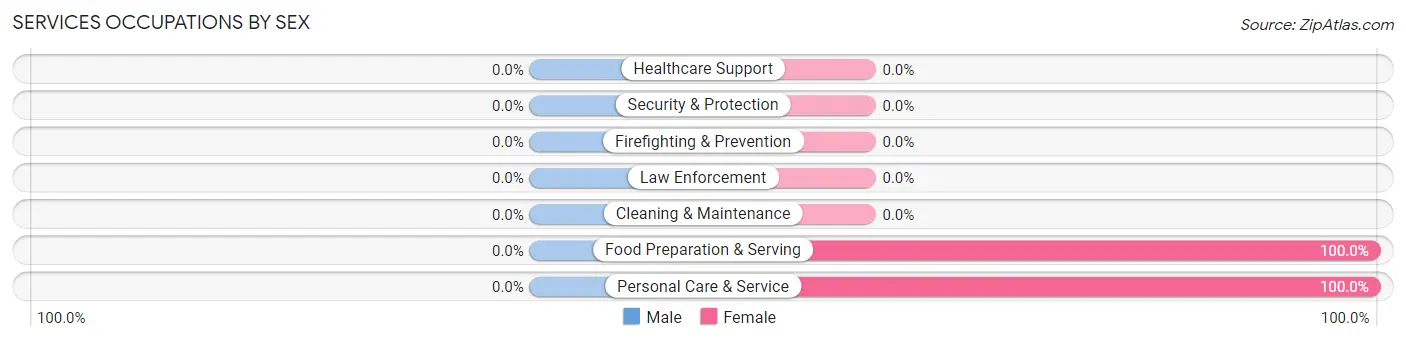
Services Occupations by Sex
| Occupation | Male | Female |
| Healthcare Support | 0 (0.0%) | 0 (0.0%) |
| Security & Protection | 0 (0.0%) | 0 (0.0%) |
| Firefighting & Prevention | 0 (0.0%) | 0 (0.0%) |
| Law Enforcement | 0 (0.0%) | 0 (0.0%) |
| Food Preparation & Serving | 0 (0.0%) | 15 (100.0%) |
| Cleaning & Maintenance | 0 (0.0%) | 0 (0.0%) |
| Personal Care & Service | 0 (0.0%) | 17 (100.0%) |
| Total (Category) | 0 (0.0%) | 32 (100.0%) |
| Total (Overall) | 34 (26.2%) | 96 (73.9%) |
Sales and Office Occupations
The most common Sales and Office occupations in Clear Creek are , and Office & Administration (5 | 3.8%).
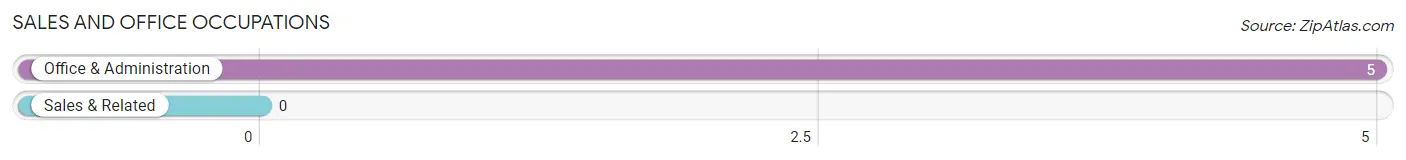
Sales and Office Occupations by Sex
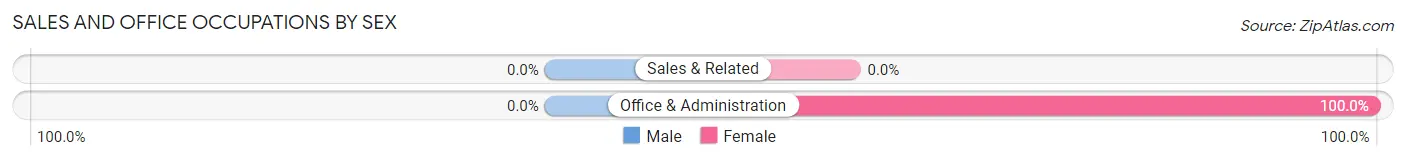
| Occupation | Male | Female |
| Sales & Related | 0 (0.0%) | 0 (0.0%) |
| Office & Administration | 0 (0.0%) | 5 (100.0%) |
| Total (Category) | 0 (0.0%) | 5 (100.0%) |
| Total (Overall) | 34 (26.2%) | 96 (73.9%) |
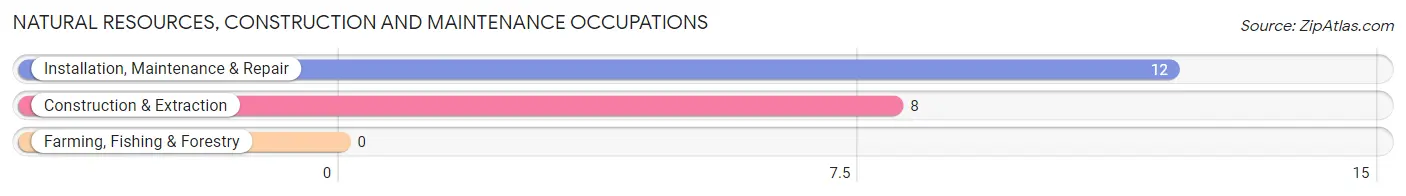
Natural Resources, Construction and Maintenance Occupations
The most common Natural Resources, Construction and Maintenance occupations in Clear Creek are Installation, Maintenance & Repair (12 | 9.2%), and Construction & Extraction (8 | 6.1%).
Natural Resources, Construction and Maintenance Occupations by Sex
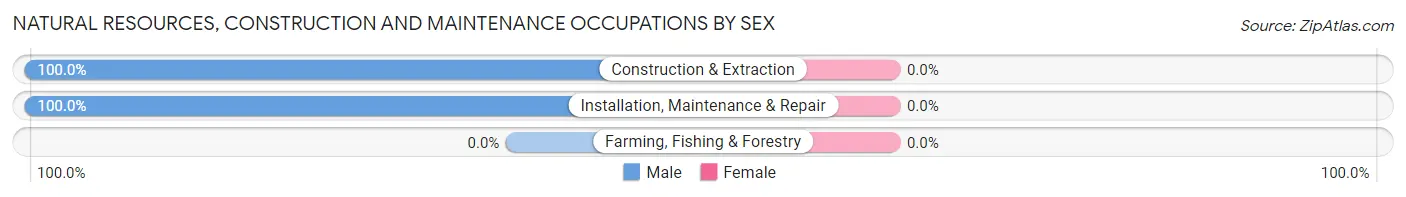
| Occupation | Male | Female |
| Farming, Fishing & Forestry | 0 (0.0%) | 0 (0.0%) |
| Construction & Extraction | 8 (100.0%) | 0 (0.0%) |
| Installation, Maintenance & Repair | 12 (100.0%) | 0 (0.0%) |
| Total (Category) | 20 (100.0%) | 0 (0.0%) |
| Total (Overall) | 34 (26.2%) | 96 (73.9%) |
Production, Transportation and Moving Occupations
The most common Production, Transportation and Moving occupations in Clear Creek are Production (7 | 5.4%), and Transportation (7 | 5.4%).
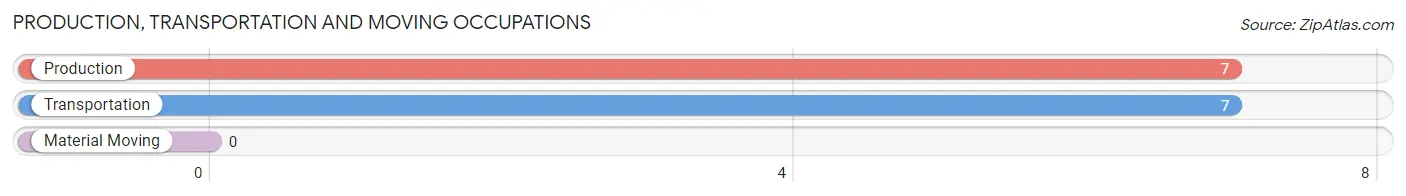
Production, Transportation and Moving Occupations by Sex
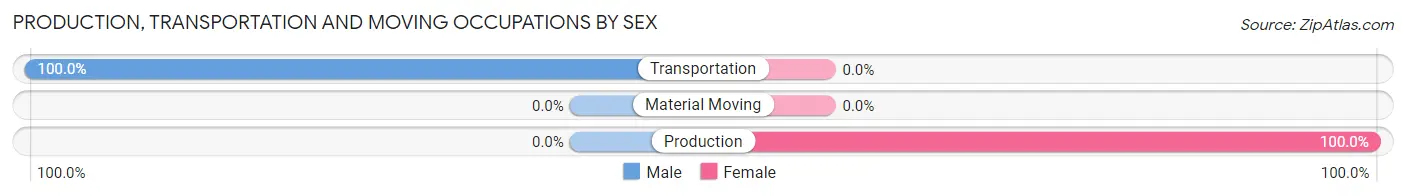
| Occupation | Male | Female |
| Production | 0 (0.0%) | 7 (100.0%) |
| Transportation | 7 (100.0%) | 0 (0.0%) |
| Material Moving | 0 (0.0%) | 0 (0.0%) |
| Total (Category) | 7 (50.0%) | 7 (50.0%) |
| Total (Overall) | 34 (26.2%) | 96 (73.9%) |
Employment Industries by Sex in Clear Creek
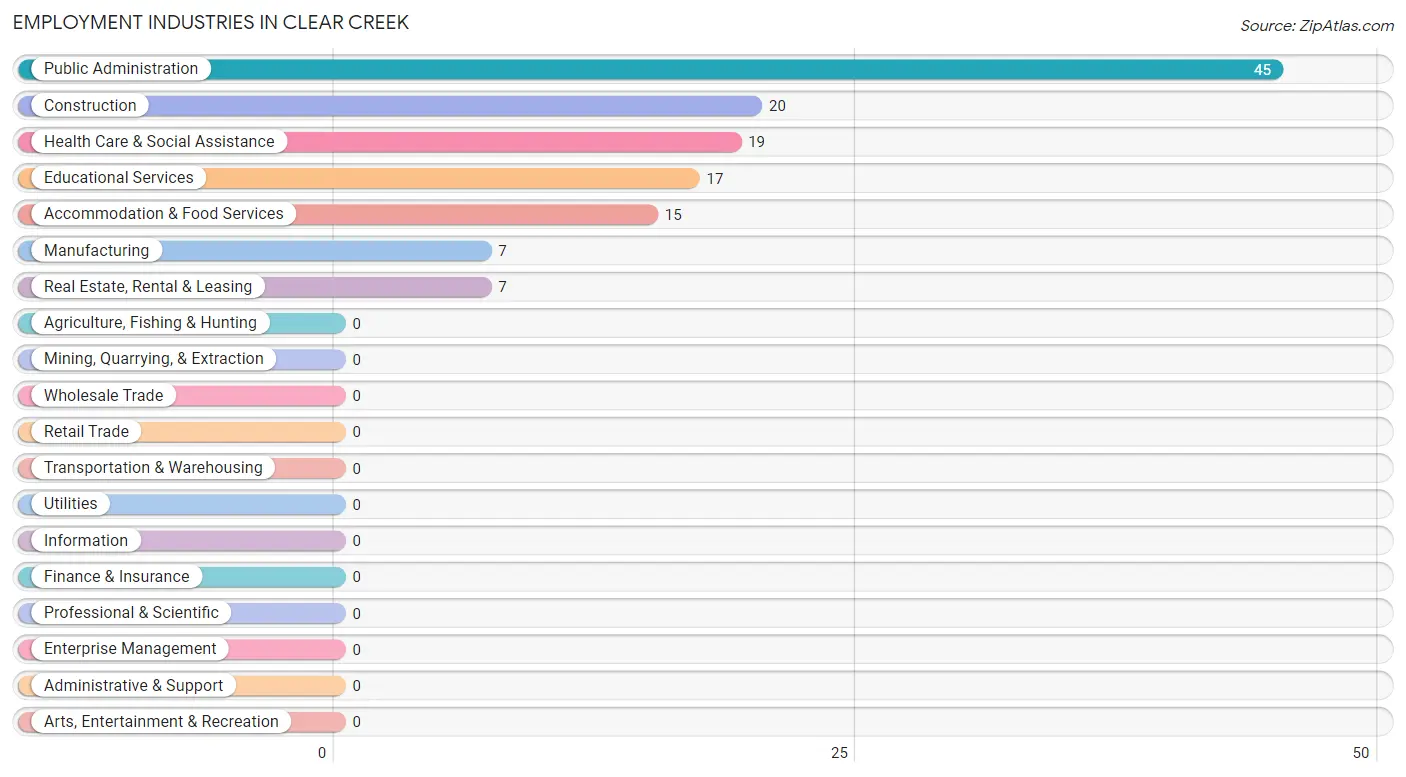
Employment Industries in Clear Creek
The major employment industries in Clear Creek include Public Administration (45 | 34.6%), Construction (20 | 15.4%), Health Care & Social Assistance (19 | 14.6%), Educational Services (17 | 13.1%), and Accommodation & Food Services (15 | 11.5%).
Employment Industries by Sex in Clear Creek
The Clear Creek industries that see more men than women are Construction (100.0%), Real Estate, Rental & Leasing (100.0%), and Health Care & Social Assistance (36.8%), whereas the industries that tend to have a higher number of women are Manufacturing (100.0%), Educational Services (100.0%), and Accommodation & Food Services (100.0%).
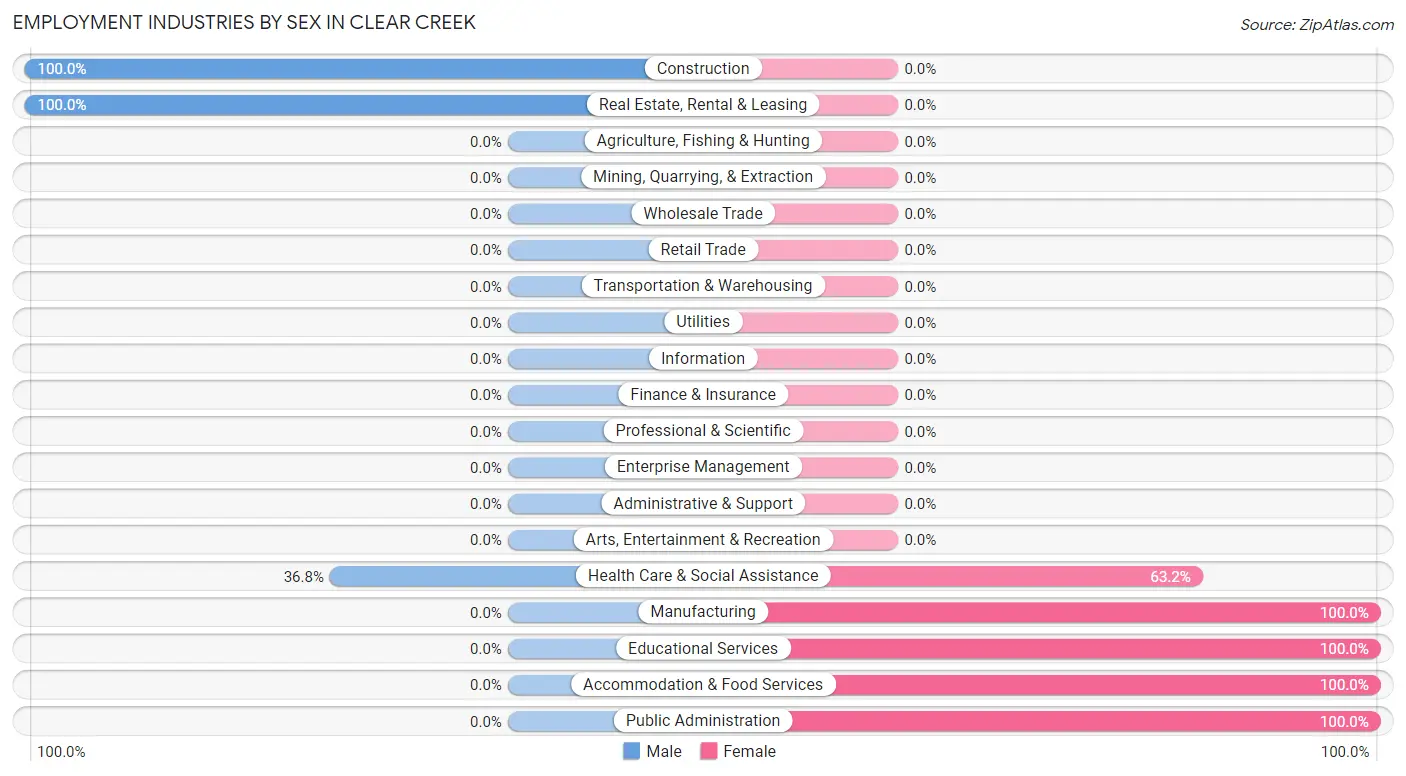
| Industry | Male | Female |
| Agriculture, Fishing & Hunting | 0 (0.0%) | 0 (0.0%) |
| Mining, Quarrying, & Extraction | 0 (0.0%) | 0 (0.0%) |
| Construction | 20 (100.0%) | 0 (0.0%) |
| Manufacturing | 0 (0.0%) | 7 (100.0%) |
| Wholesale Trade | 0 (0.0%) | 0 (0.0%) |
| Retail Trade | 0 (0.0%) | 0 (0.0%) |
| Transportation & Warehousing | 0 (0.0%) | 0 (0.0%) |
| Utilities | 0 (0.0%) | 0 (0.0%) |
| Information | 0 (0.0%) | 0 (0.0%) |
| Finance & Insurance | 0 (0.0%) | 0 (0.0%) |
| Real Estate, Rental & Leasing | 7 (100.0%) | 0 (0.0%) |
| Professional & Scientific | 0 (0.0%) | 0 (0.0%) |
| Enterprise Management | 0 (0.0%) | 0 (0.0%) |
| Administrative & Support | 0 (0.0%) | 0 (0.0%) |
| Educational Services | 0 (0.0%) | 17 (100.0%) |
| Health Care & Social Assistance | 7 (36.8%) | 12 (63.2%) |
| Arts, Entertainment & Recreation | 0 (0.0%) | 0 (0.0%) |
| Accommodation & Food Services | 0 (0.0%) | 15 (100.0%) |
| Public Administration | 0 (0.0%) | 45 (100.0%) |
| Total | 34 (26.2%) | 96 (73.9%) |
Education in Clear Creek
School Enrollment in Clear Creek
The most common levels of schooling among the 107 students in Clear Creek are high school (51 | 47.7%), elementary school (44 | 41.1%), and graduate / professional (7 | 6.5%).
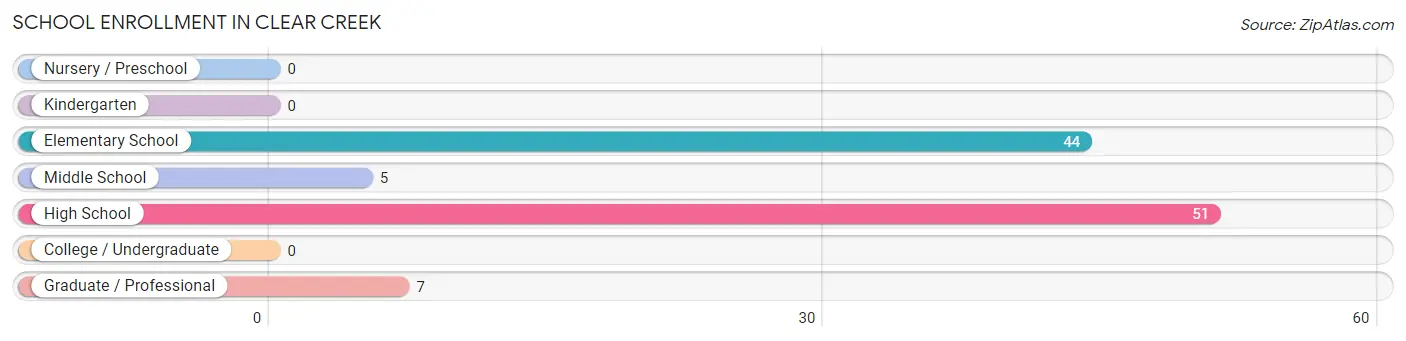
| School Level | # Students | % Students |
| Nursery / Preschool | 0 | 0.0% |
| Kindergarten | 0 | 0.0% |
| Elementary School | 44 | 41.1% |
| Middle School | 5 | 4.7% |
| High School | 51 | 47.7% |
| College / Undergraduate | 0 | 0.0% |
| Graduate / Professional | 7 | 6.5% |
| Total | 107 | 100.0% |
School Enrollment by Age by Funding Source in Clear Creek
Out of a total of 107 students who are enrolled in schools in Clear Creek, 7 (6.5%) attend a private institution, while the remaining 100 (93.5%) are enrolled in public schools. The age group of 35 years and over has the highest likelihood of being enrolled in private schools, with 7 (100.0% in the age bracket) enrolled. Conversely, the age group of 5 to 9 year old has the lowest likelihood of being enrolled in a private school, with 44 (100.0% in the age bracket) attending a public institution.
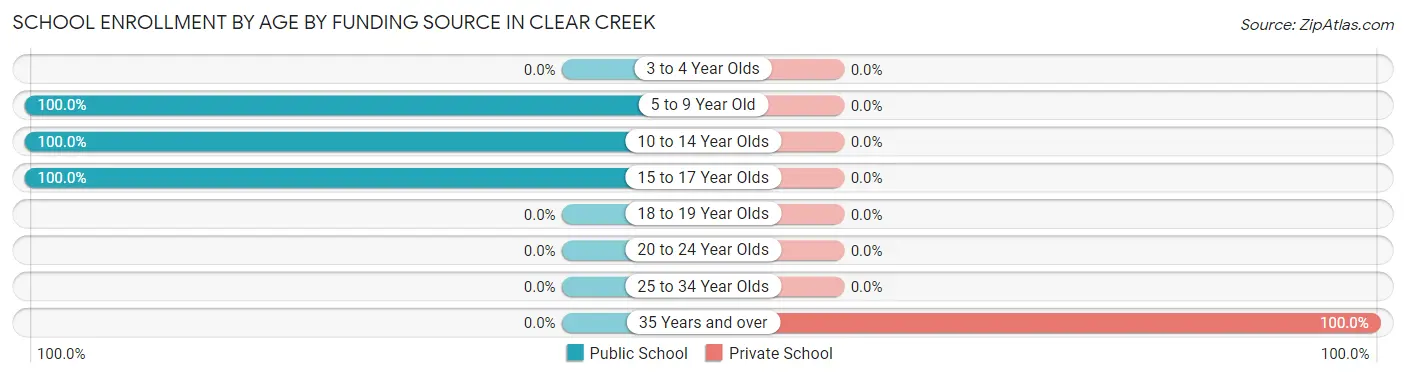
| Age Bracket | Public School | Private School |
| 3 to 4 Year Olds | 0 (0.0%) | 0 (0.0%) |
| 5 to 9 Year Old | 44 (100.0%) | 0 (0.0%) |
| 10 to 14 Year Olds | 5 (100.0%) | 0 (0.0%) |
| 15 to 17 Year Olds | 51 (100.0%) | 0 (0.0%) |
| 18 to 19 Year Olds | 0 (0.0%) | 0 (0.0%) |
| 20 to 24 Year Olds | 0 (0.0%) | 0 (0.0%) |
| 25 to 34 Year Olds | 0 (0.0%) | 0 (0.0%) |
| 35 Years and over | 0 (0.0%) | 7 (100.0%) |
| Total | 100 (93.5%) | 7 (6.5%) |
Educational Attainment by Field of Study in Clear Creek
Social sciences (19 | 35.2%), computers & mathematics (12 | 22.2%), science & technology (7 | 13.0%), business (6 | 11.1%), and bio, nature & agricultural (5 | 9.3%) are the most common fields of study among 54 individuals in Clear Creek who have obtained a bachelor's degree or higher.
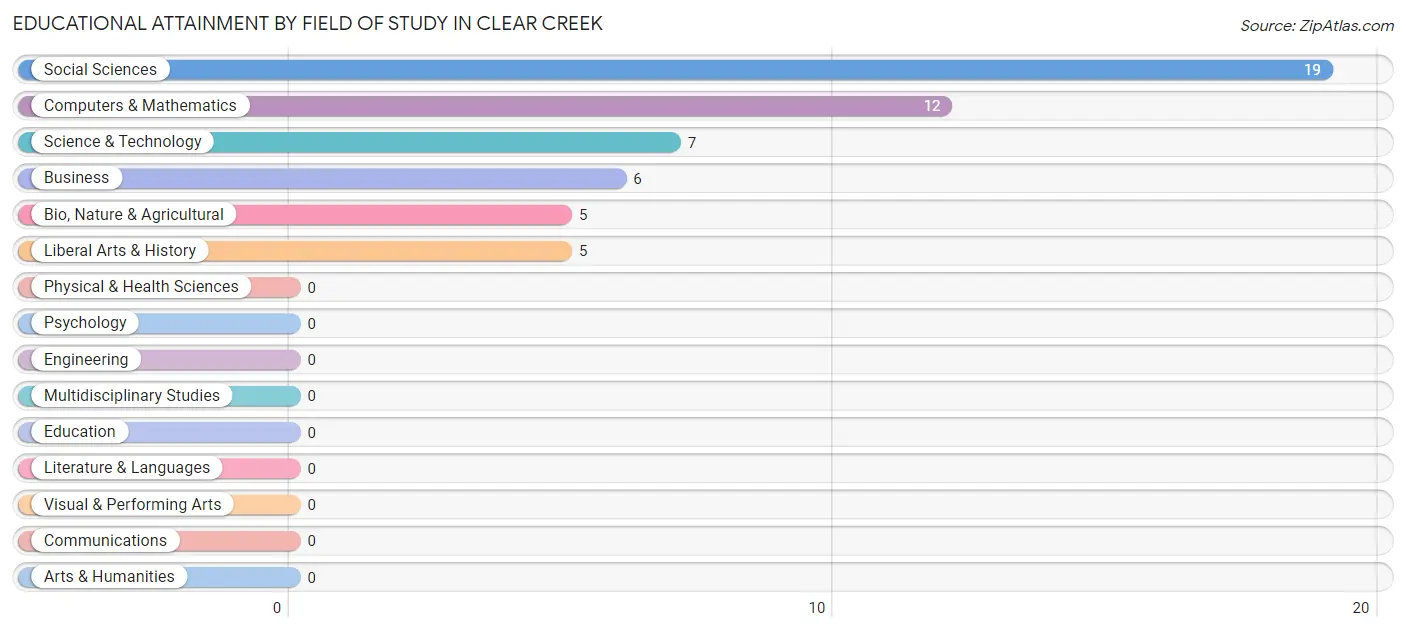
| Field of Study | # Graduates | % Graduates |
| Computers & Mathematics | 12 | 22.2% |
| Bio, Nature & Agricultural | 5 | 9.3% |
| Physical & Health Sciences | 0 | 0.0% |
| Psychology | 0 | 0.0% |
| Social Sciences | 19 | 35.2% |
| Engineering | 0 | 0.0% |
| Multidisciplinary Studies | 0 | 0.0% |
| Science & Technology | 7 | 13.0% |
| Business | 6 | 11.1% |
| Education | 0 | 0.0% |
| Literature & Languages | 0 | 0.0% |
| Liberal Arts & History | 5 | 9.3% |
| Visual & Performing Arts | 0 | 0.0% |
| Communications | 0 | 0.0% |
| Arts & Humanities | 0 | 0.0% |
| Total | 54 | 100.0% |
Transportation & Commute in Clear Creek
Vehicle Availability by Sex in Clear Creek
The most prevalent vehicle ownership categories in Clear Creek are males with 1 vehicle (15, accounting for 44.1%) and females with 1 vehicle (62, making up 15.6%).
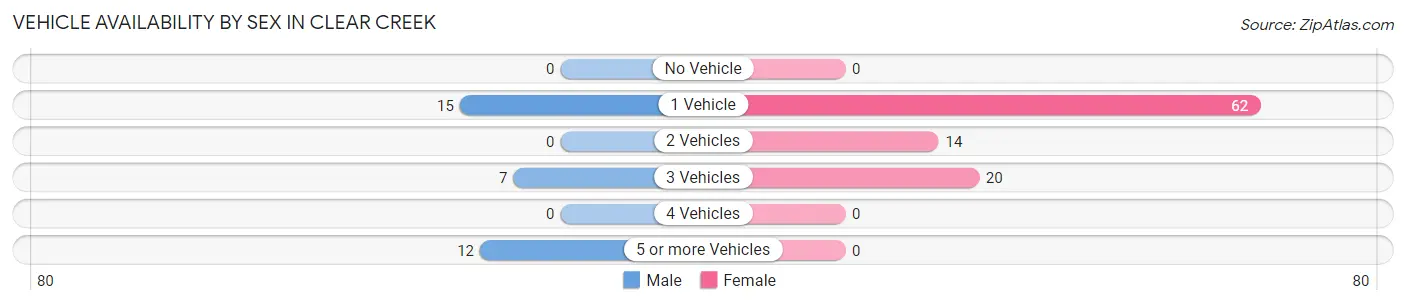
| Vehicles Available | Male | Female |
| No Vehicle | 0 (0.0%) | 0 (0.0%) |
| 1 Vehicle | 15 (44.1%) | 62 (64.6%) |
| 2 Vehicles | 0 (0.0%) | 14 (14.6%) |
| 3 Vehicles | 7 (20.6%) | 20 (20.8%) |
| 4 Vehicles | 0 (0.0%) | 0 (0.0%) |
| 5 or more Vehicles | 12 (35.3%) | 0 (0.0%) |
| Total | 34 (100.0%) | 96 (100.0%) |
Commute Time in Clear Creek
The most frequently occuring commute durations in Clear Creek are 45 to 59 minutes (45 commuters, 36.6%), 10 to 14 minutes (22 commuters, 17.9%), and 20 to 24 minutes (17 commuters, 13.8%).
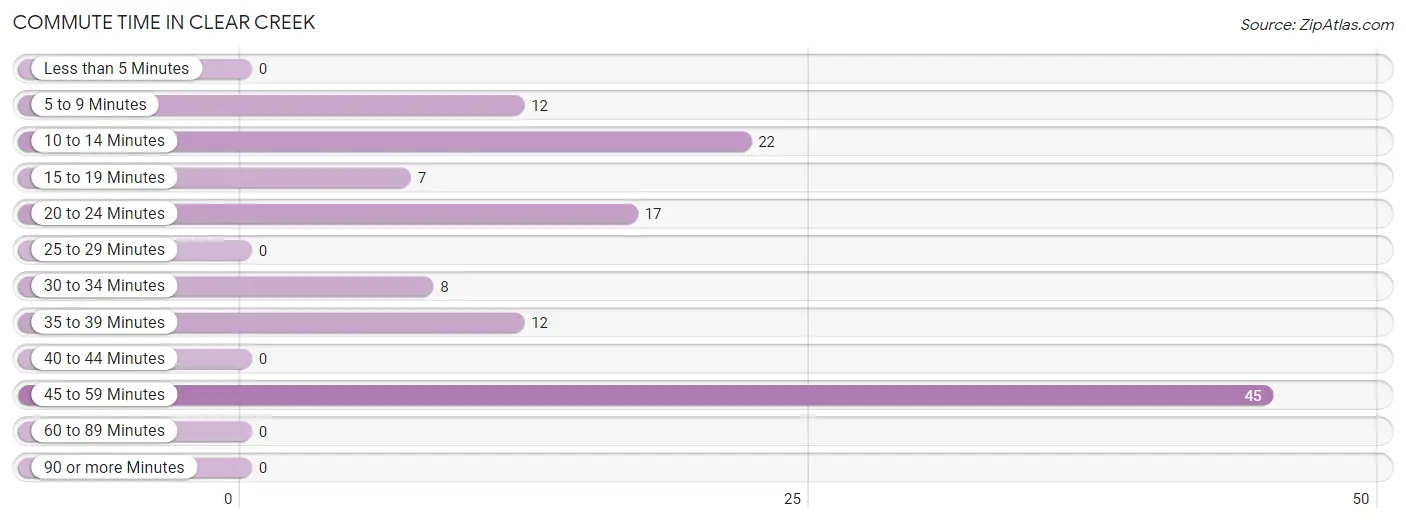
| Commute Time | # Commuters | % Commuters |
| Less than 5 Minutes | 0 | 0.0% |
| 5 to 9 Minutes | 12 | 9.8% |
| 10 to 14 Minutes | 22 | 17.9% |
| 15 to 19 Minutes | 7 | 5.7% |
| 20 to 24 Minutes | 17 | 13.8% |
| 25 to 29 Minutes | 0 | 0.0% |
| 30 to 34 Minutes | 8 | 6.5% |
| 35 to 39 Minutes | 12 | 9.8% |
| 40 to 44 Minutes | 0 | 0.0% |
| 45 to 59 Minutes | 45 | 36.6% |
| 60 to 89 Minutes | 0 | 0.0% |
| 90 or more Minutes | 0 | 0.0% |
Commute Time by Sex in Clear Creek
The most common commute times in Clear Creek are 5 to 9 minutes (12 commuters, 44.4%) for males and 45 to 59 minutes (45 commuters, 46.9%) for females.
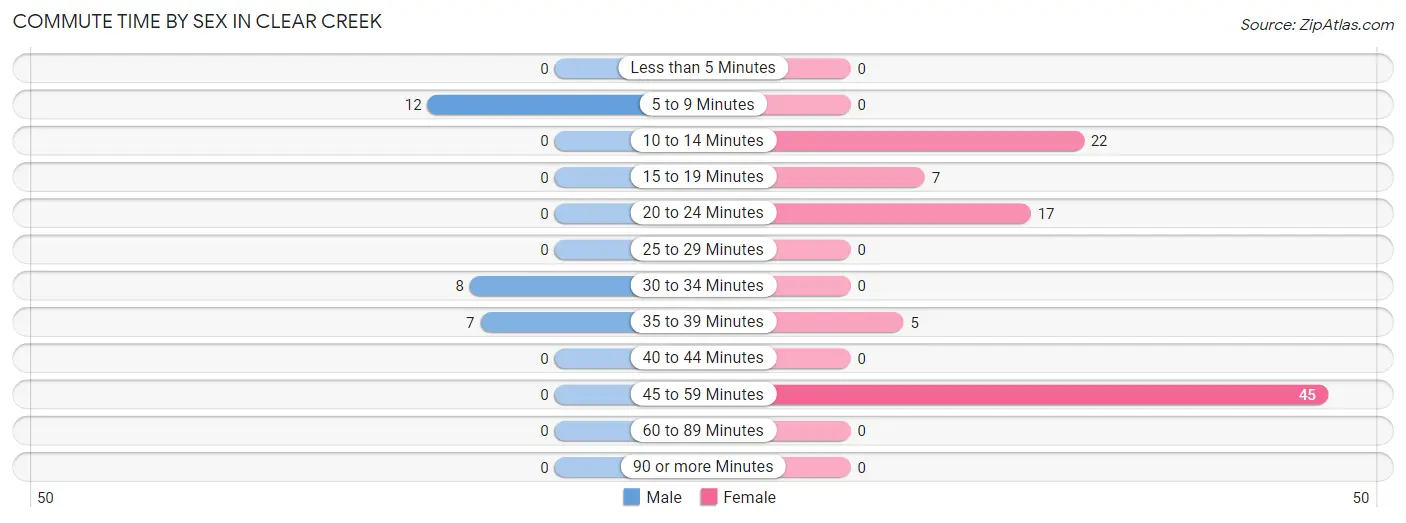
| Commute Time | Male | Female |
| Less than 5 Minutes | 0 (0.0%) | 0 (0.0%) |
| 5 to 9 Minutes | 12 (44.4%) | 0 (0.0%) |
| 10 to 14 Minutes | 0 (0.0%) | 22 (22.9%) |
| 15 to 19 Minutes | 0 (0.0%) | 7 (7.3%) |
| 20 to 24 Minutes | 0 (0.0%) | 17 (17.7%) |
| 25 to 29 Minutes | 0 (0.0%) | 0 (0.0%) |
| 30 to 34 Minutes | 8 (29.6%) | 0 (0.0%) |
| 35 to 39 Minutes | 7 (25.9%) | 5 (5.2%) |
| 40 to 44 Minutes | 0 (0.0%) | 0 (0.0%) |
| 45 to 59 Minutes | 0 (0.0%) | 45 (46.9%) |
| 60 to 89 Minutes | 0 (0.0%) | 0 (0.0%) |
| 90 or more Minutes | 0 (0.0%) | 0 (0.0%) |
Time of Departure to Work by Sex in Clear Creek
The most frequent times of departure to work in Clear Creek are 6:30 AM to 6:59 AM (12, 44.4%) for males and 6:30 AM to 6:59 AM (45, 46.9%) for females.
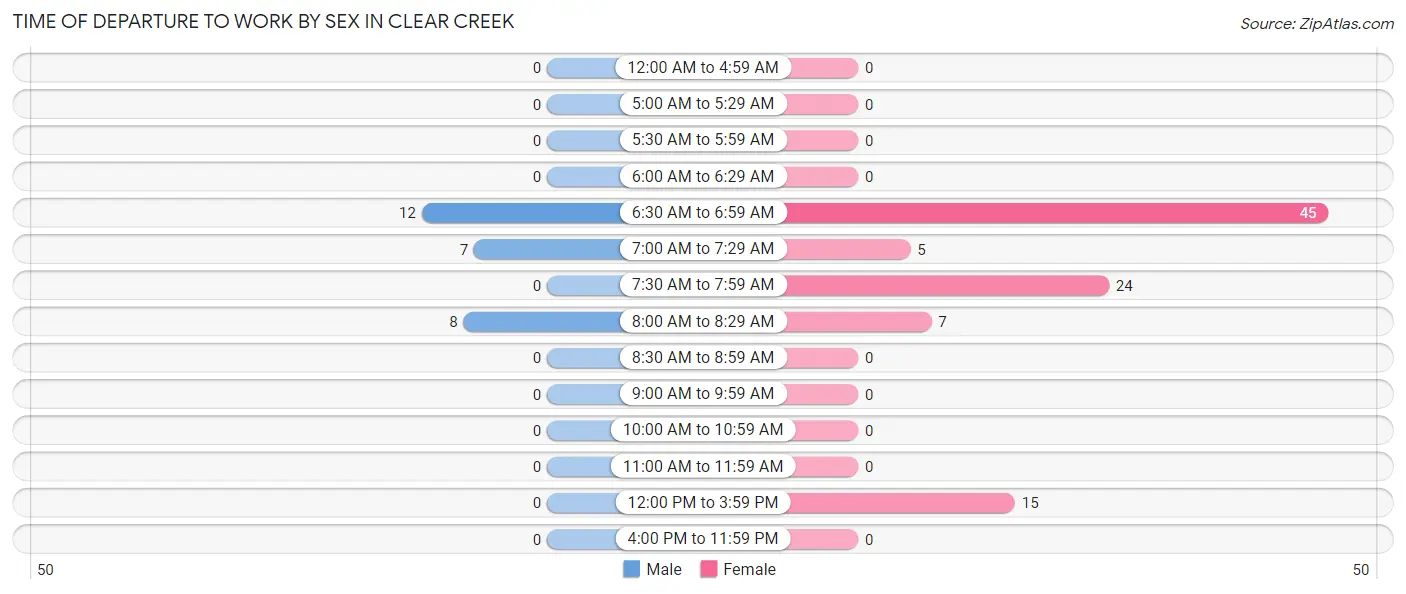
| Time of Departure | Male | Female |
| 12:00 AM to 4:59 AM | 0 (0.0%) | 0 (0.0%) |
| 5:00 AM to 5:29 AM | 0 (0.0%) | 0 (0.0%) |
| 5:30 AM to 5:59 AM | 0 (0.0%) | 0 (0.0%) |
| 6:00 AM to 6:29 AM | 0 (0.0%) | 0 (0.0%) |
| 6:30 AM to 6:59 AM | 12 (44.4%) | 45 (46.9%) |
| 7:00 AM to 7:29 AM | 7 (25.9%) | 5 (5.2%) |
| 7:30 AM to 7:59 AM | 0 (0.0%) | 24 (25.0%) |
| 8:00 AM to 8:29 AM | 8 (29.6%) | 7 (7.3%) |
| 8:30 AM to 8:59 AM | 0 (0.0%) | 0 (0.0%) |
| 9:00 AM to 9:59 AM | 0 (0.0%) | 0 (0.0%) |
| 10:00 AM to 10:59 AM | 0 (0.0%) | 0 (0.0%) |
| 11:00 AM to 11:59 AM | 0 (0.0%) | 0 (0.0%) |
| 12:00 PM to 3:59 PM | 0 (0.0%) | 15 (15.6%) |
| 4:00 PM to 11:59 PM | 0 (0.0%) | 0 (0.0%) |
| Total | 27 (100.0%) | 96 (100.0%) |
Housing Occupancy in Clear Creek
Occupancy by Ownership in Clear Creek
Of the total 127 dwellings in Clear Creek, owner-occupied units account for 88 (69.3%), while renter-occupied units make up 39 (30.7%).
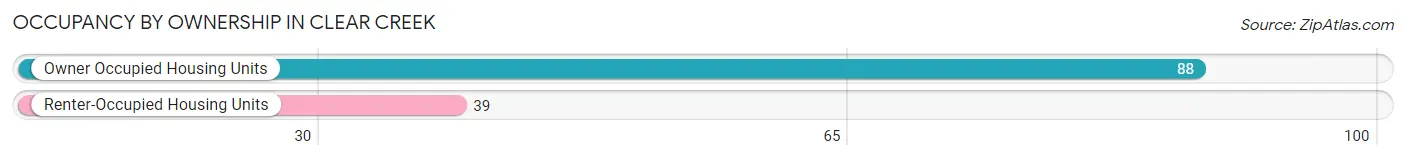
| Occupancy | # Housing Units | % Housing Units |
| Owner Occupied Housing Units | 88 | 69.3% |
| Renter-Occupied Housing Units | 39 | 30.7% |
| Total Occupied Housing Units | 127 | 100.0% |
Occupancy by Household Size in Clear Creek
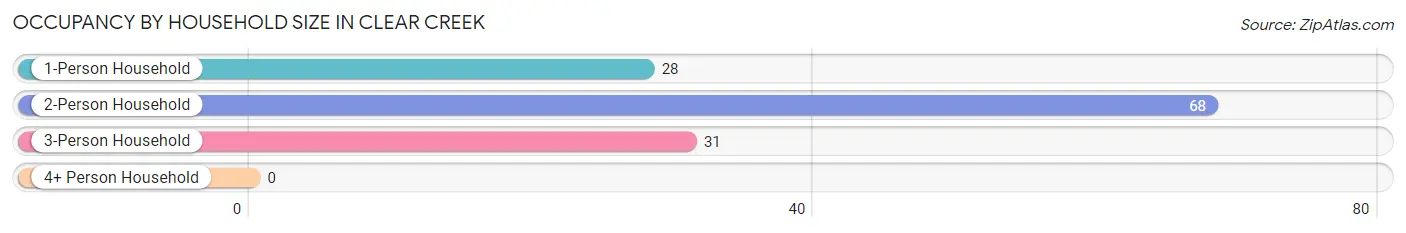
| Household Size | # Housing Units | % Housing Units |
| 1-Person Household | 28 | 22.1% |
| 2-Person Household | 68 | 53.5% |
| 3-Person Household | 31 | 24.4% |
| 4+ Person Household | 0 | 0.0% |
| Total Housing Units | 127 | 100.0% |
Occupancy by Ownership by Household Size in Clear Creek
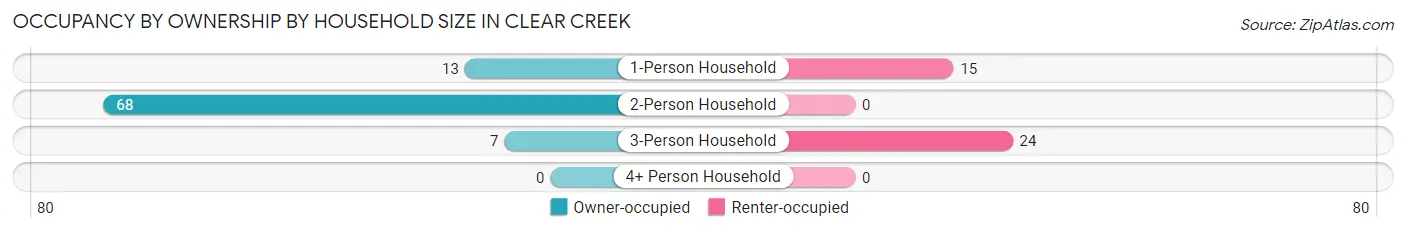
| Household Size | Owner-occupied | Renter-occupied |
| 1-Person Household | 13 (46.4%) | 15 (53.6%) |
| 2-Person Household | 68 (100.0%) | 0 (0.0%) |
| 3-Person Household | 7 (22.6%) | 24 (77.4%) |
| 4+ Person Household | 0 (0.0%) | 0 (0.0%) |
| Total Housing Units | 88 (69.3%) | 39 (30.7%) |
Occupancy by Educational Attainment in Clear Creek
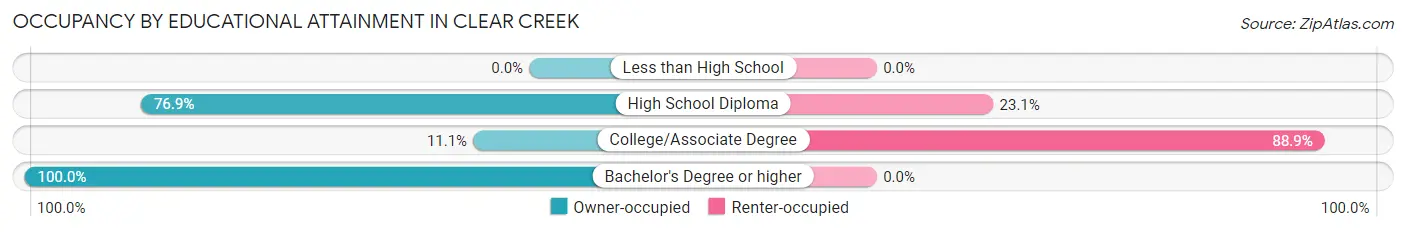
| Household Size | Owner-occupied | Renter-occupied |
| Less than High School | 0 (0.0%) | 0 (0.0%) |
| High School Diploma | 50 (76.9%) | 15 (23.1%) |
| College/Associate Degree | 3 (11.1%) | 24 (88.9%) |
| Bachelor's Degree or higher | 35 (100.0%) | 0 (0.0%) |
Occupancy by Age of Householder in Clear Creek
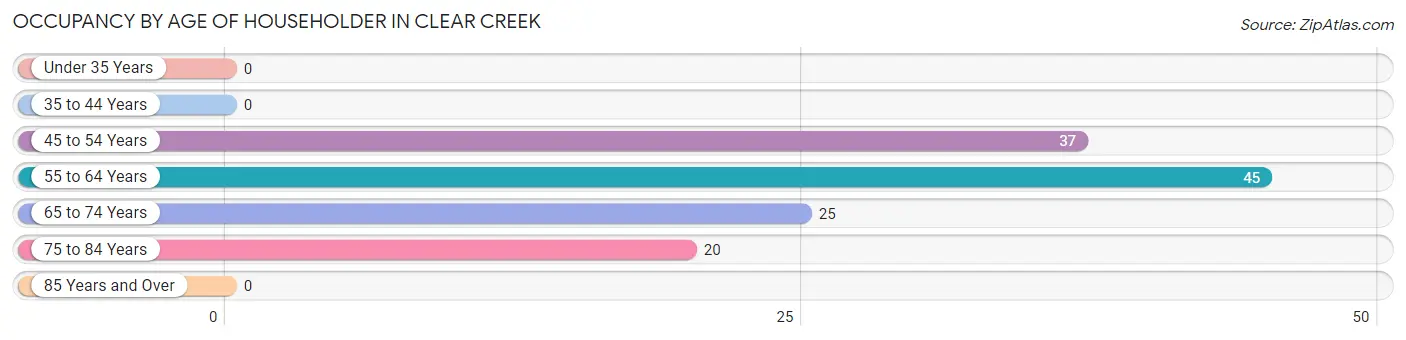
| Age Bracket | # Households | % Households |
| Under 35 Years | 0 | 0.0% |
| 35 to 44 Years | 0 | 0.0% |
| 45 to 54 Years | 37 | 29.1% |
| 55 to 64 Years | 45 | 35.4% |
| 65 to 74 Years | 25 | 19.7% |
| 75 to 84 Years | 20 | 15.8% |
| 85 Years and Over | 0 | 0.0% |
| Total | 127 | 100.0% |
Housing Finances in Clear Creek
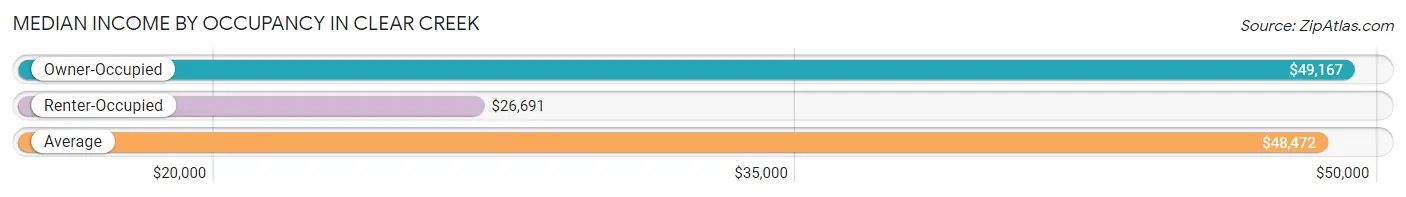
Median Income by Occupancy in Clear Creek
| Occupancy Type | # Households | Median Income |
| Owner-Occupied | 88 (69.3%) | $49,167 |
| Renter-Occupied | 39 (30.7%) | $26,691 |
| Average | 127 (100.0%) | $48,472 |
Occupancy by Householder Income Bracket in Clear Creek
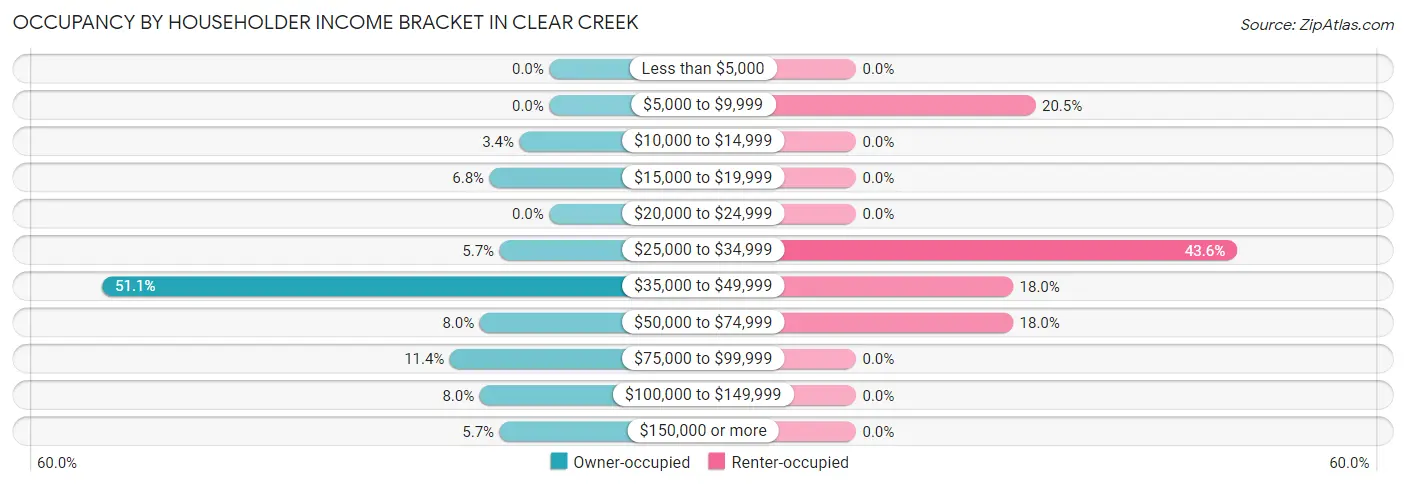
| Income Bracket | Owner-occupied | Renter-occupied |
| Less than $5,000 | 0 (0.0%) | 0 (0.0%) |
| $5,000 to $9,999 | 0 (0.0%) | 8 (20.5%) |
| $10,000 to $14,999 | 3 (3.4%) | 0 (0.0%) |
| $15,000 to $19,999 | 6 (6.8%) | 0 (0.0%) |
| $20,000 to $24,999 | 0 (0.0%) | 0 (0.0%) |
| $25,000 to $34,999 | 5 (5.7%) | 17 (43.6%) |
| $35,000 to $49,999 | 45 (51.1%) | 7 (17.9%) |
| $50,000 to $74,999 | 7 (8.0%) | 7 (17.9%) |
| $75,000 to $99,999 | 10 (11.4%) | 0 (0.0%) |
| $100,000 to $149,999 | 7 (8.0%) | 0 (0.0%) |
| $150,000 or more | 5 (5.7%) | 0 (0.0%) |
| Total | 88 (100.0%) | 39 (100.0%) |
Monthly Housing Cost Tiers in Clear Creek
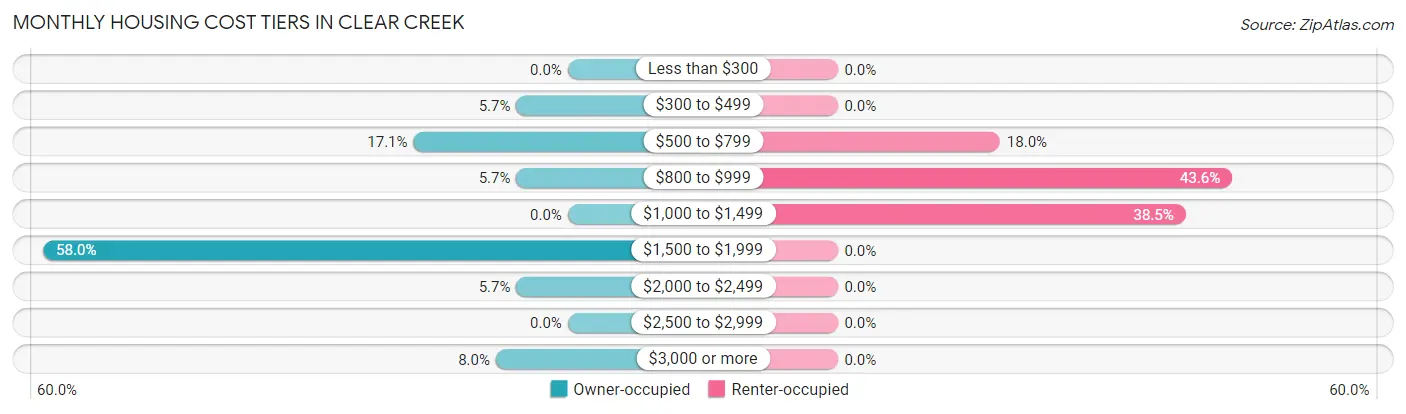
| Monthly Cost | Owner-occupied | Renter-occupied |
| Less than $300 | 0 (0.0%) | 0 (0.0%) |
| $300 to $499 | 5 (5.7%) | 0 (0.0%) |
| $500 to $799 | 15 (17.1%) | 7 (17.9%) |
| $800 to $999 | 5 (5.7%) | 17 (43.6%) |
| $1,000 to $1,499 | 0 (0.0%) | 15 (38.5%) |
| $1,500 to $1,999 | 51 (58.0%) | 0 (0.0%) |
| $2,000 to $2,499 | 5 (5.7%) | 0 (0.0%) |
| $2,500 to $2,999 | 0 (0.0%) | 0 (0.0%) |
| $3,000 or more | 7 (8.0%) | 0 (0.0%) |
| Total | 88 (100.0%) | 39 (100.0%) |
Physical Housing Characteristics in Clear Creek
Housing Structures in Clear Creek
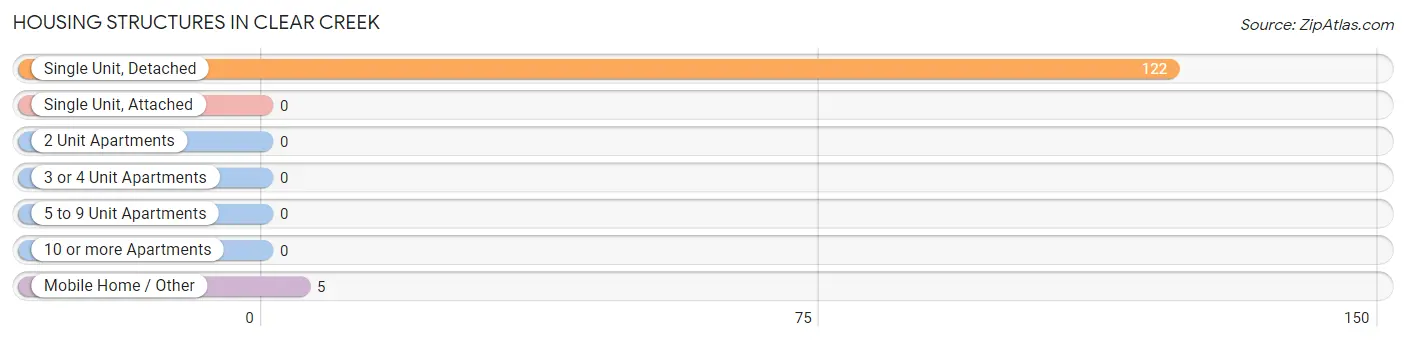
| Structure Type | # Housing Units | % Housing Units |
| Single Unit, Detached | 122 | 96.1% |
| Single Unit, Attached | 0 | 0.0% |
| 2 Unit Apartments | 0 | 0.0% |
| 3 or 4 Unit Apartments | 0 | 0.0% |
| 5 to 9 Unit Apartments | 0 | 0.0% |
| 10 or more Apartments | 0 | 0.0% |
| Mobile Home / Other | 5 | 3.9% |
| Total | 127 | 100.0% |
Housing Structures by Occupancy in Clear Creek
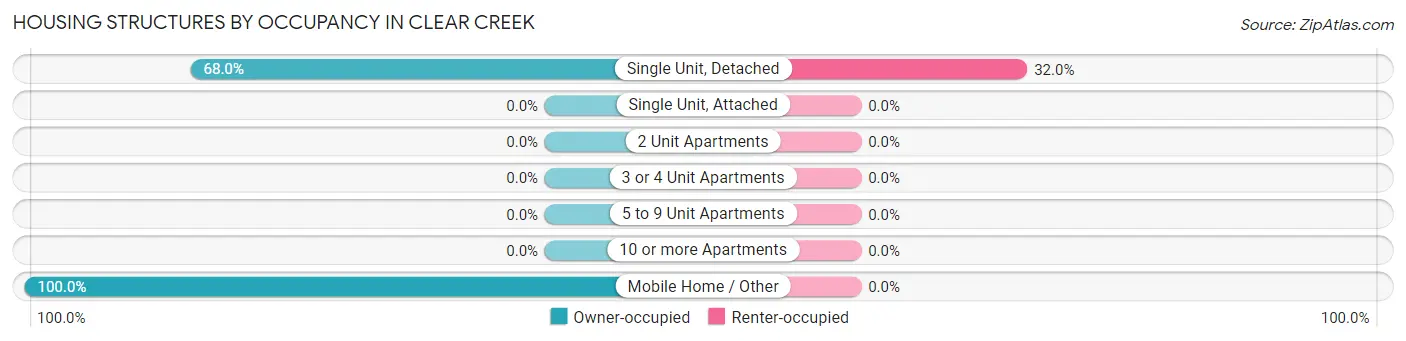
| Structure Type | Owner-occupied | Renter-occupied |
| Single Unit, Detached | 83 (68.0%) | 39 (32.0%) |
| Single Unit, Attached | 0 (0.0%) | 0 (0.0%) |
| 2 Unit Apartments | 0 (0.0%) | 0 (0.0%) |
| 3 or 4 Unit Apartments | 0 (0.0%) | 0 (0.0%) |
| 5 to 9 Unit Apartments | 0 (0.0%) | 0 (0.0%) |
| 10 or more Apartments | 0 (0.0%) | 0 (0.0%) |
| Mobile Home / Other | 5 (100.0%) | 0 (0.0%) |
| Total | 88 (69.3%) | 39 (30.7%) |
Housing Structures by Number of Rooms in Clear Creek
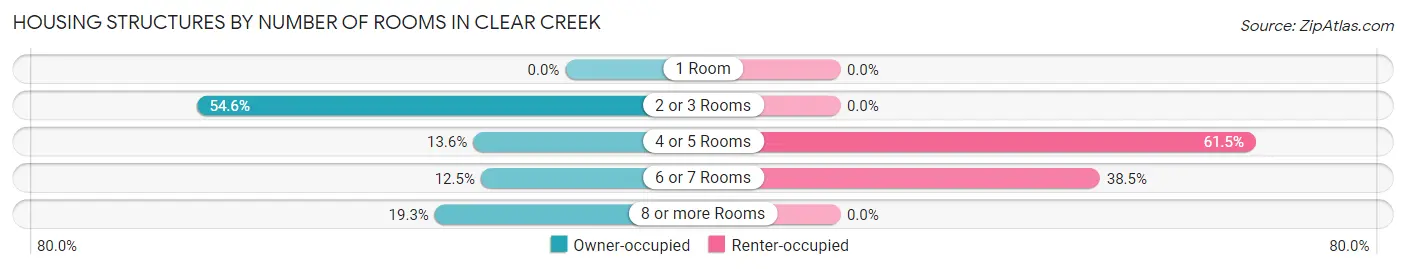
| Number of Rooms | Owner-occupied | Renter-occupied |
| 1 Room | 0 (0.0%) | 0 (0.0%) |
| 2 or 3 Rooms | 48 (54.5%) | 0 (0.0%) |
| 4 or 5 Rooms | 12 (13.6%) | 24 (61.5%) |
| 6 or 7 Rooms | 11 (12.5%) | 15 (38.5%) |
| 8 or more Rooms | 17 (19.3%) | 0 (0.0%) |
| Total | 88 (100.0%) | 39 (100.0%) |
Housing Structure by Heating Type in Clear Creek
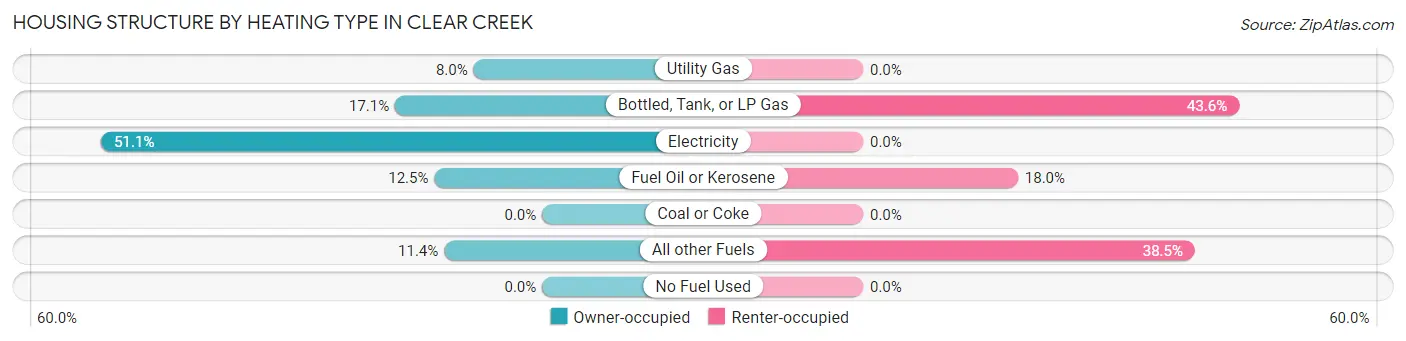
| Heating Type | Owner-occupied | Renter-occupied |
| Utility Gas | 7 (8.0%) | 0 (0.0%) |
| Bottled, Tank, or LP Gas | 15 (17.1%) | 17 (43.6%) |
| Electricity | 45 (51.1%) | 0 (0.0%) |
| Fuel Oil or Kerosene | 11 (12.5%) | 7 (17.9%) |
| Coal or Coke | 0 (0.0%) | 0 (0.0%) |
| All other Fuels | 10 (11.4%) | 15 (38.5%) |
| No Fuel Used | 0 (0.0%) | 0 (0.0%) |
| Total | 88 (100.0%) | 39 (100.0%) |
Household Vehicle Usage in Clear Creek
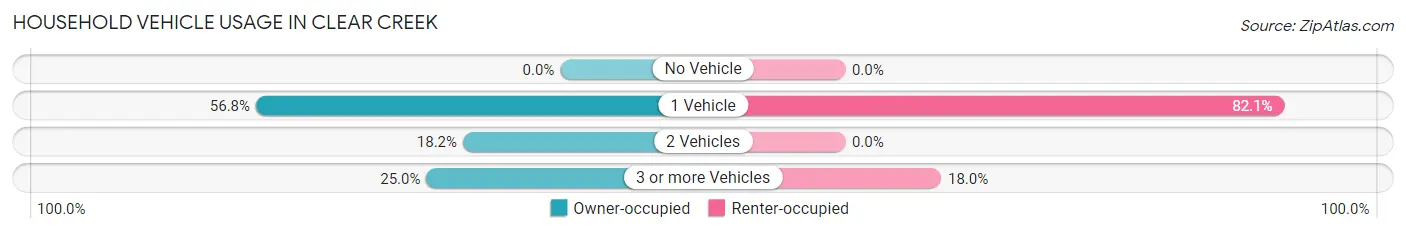
| Vehicles per Household | Owner-occupied | Renter-occupied |
| No Vehicle | 0 (0.0%) | 0 (0.0%) |
| 1 Vehicle | 50 (56.8%) | 32 (82.1%) |
| 2 Vehicles | 16 (18.2%) | 0 (0.0%) |
| 3 or more Vehicles | 22 (25.0%) | 7 (17.9%) |
| Total | 88 (100.0%) | 39 (100.0%) |
Real Estate & Mortgages in Clear Creek
Real Estate and Mortgage Overview in Clear Creek
| Characteristic | Without Mortgage | With Mortgage |
| Housing Units | 31 | 57 |
| Median Property Value | $236,800 | $231,700 |
| Median Household Income | $58,036 | $0 |
| Monthly Housing Costs | $763 | $7 |
| Real Estate Taxes | $1,284 | $0 |
Property Value by Mortgage Status in Clear Creek
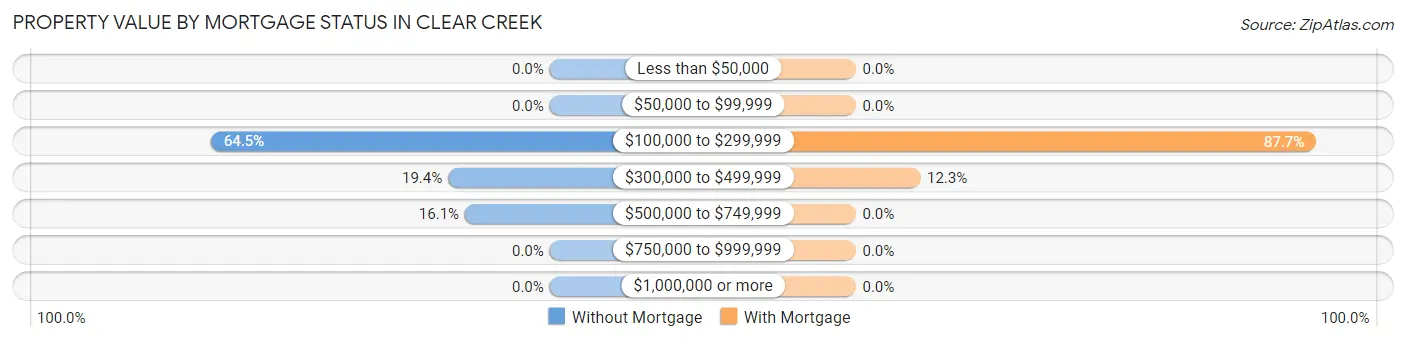
| Property Value | Without Mortgage | With Mortgage |
| Less than $50,000 | 0 (0.0%) | 0 (0.0%) |
| $50,000 to $99,999 | 0 (0.0%) | 0 (0.0%) |
| $100,000 to $299,999 | 20 (64.5%) | 50 (87.7%) |
| $300,000 to $499,999 | 6 (19.4%) | 7 (12.3%) |
| $500,000 to $749,999 | 5 (16.1%) | 0 (0.0%) |
| $750,000 to $999,999 | 0 (0.0%) | 0 (0.0%) |
| $1,000,000 or more | 0 (0.0%) | 0 (0.0%) |
| Total | 31 (100.0%) | 57 (100.0%) |
Household Income by Mortgage Status in Clear Creek
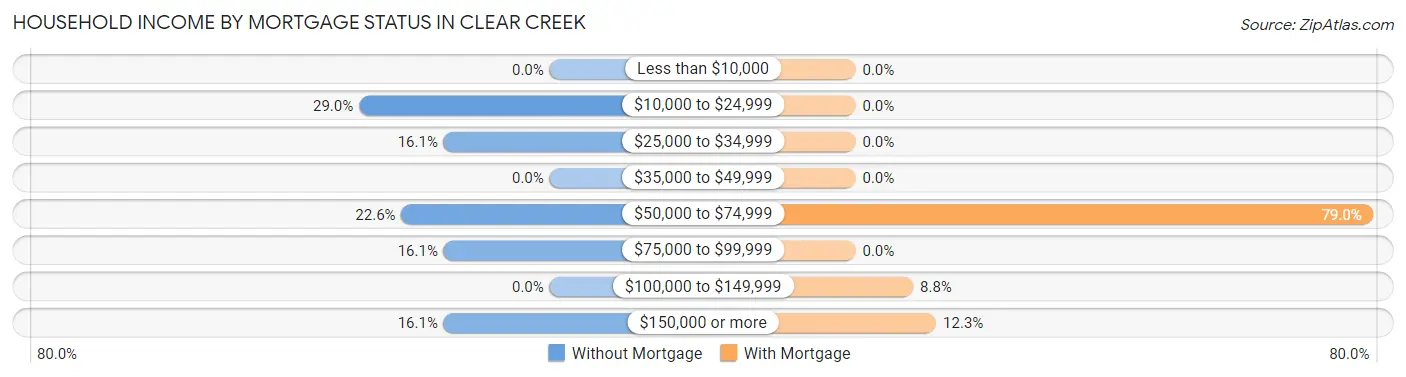
| Household Income | Without Mortgage | With Mortgage |
| Less than $10,000 | 0 (0.0%) | 0 (0.0%) |
| $10,000 to $24,999 | 9 (29.0%) | 0 (0.0%) |
| $25,000 to $34,999 | 5 (16.1%) | 0 (0.0%) |
| $35,000 to $49,999 | 0 (0.0%) | 0 (0.0%) |
| $50,000 to $74,999 | 7 (22.6%) | 45 (78.9%) |
| $75,000 to $99,999 | 5 (16.1%) | 0 (0.0%) |
| $100,000 to $149,999 | 0 (0.0%) | 5 (8.8%) |
| $150,000 or more | 5 (16.1%) | 7 (12.3%) |
| Total | 31 (100.0%) | 57 (100.0%) |
Property Value to Household Income Ratio in Clear Creek
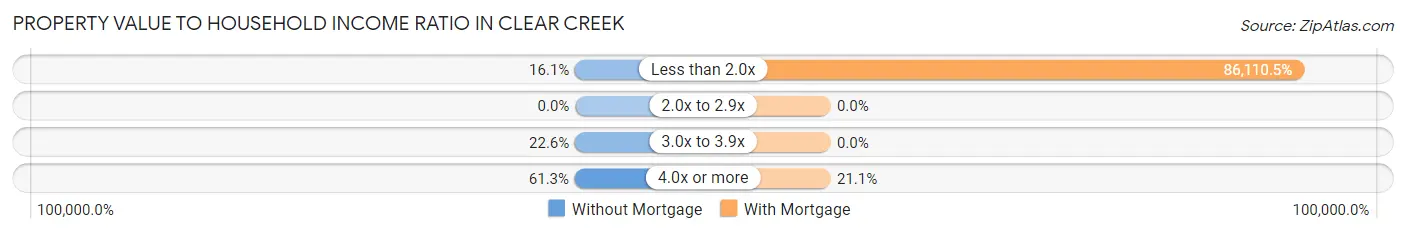
| Value-to-Income Ratio | Without Mortgage | With Mortgage |
| Less than 2.0x | 5 (16.1%) | 49,083 (86,110.5%) |
| 2.0x to 2.9x | 0 (0.0%) | 0 (0.0%) |
| 3.0x to 3.9x | 7 (22.6%) | 0 (0.0%) |
| 4.0x or more | 19 (61.3%) | 12 (21.0%) |
| Total | 31 (100.0%) | 57 (100.0%) |
Real Estate Taxes by Mortgage Status in Clear Creek
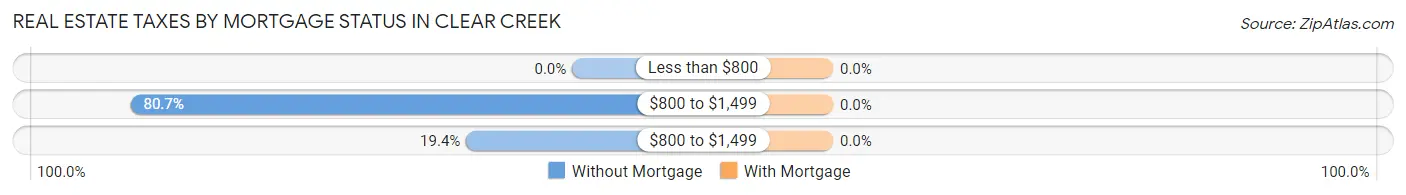
| Property Taxes | Without Mortgage | With Mortgage |
| Less than $800 | 0 (0.0%) | 0 (0.0%) |
| $800 to $1,499 | 25 (80.6%) | 0 (0.0%) |
| $800 to $1,499 | 6 (19.4%) | 0 (0.0%) |
| Total | 31 (100.0%) | 57 (100.0%) |
Health & Disability in Clear Creek
Health Insurance Coverage by Age in Clear Creek
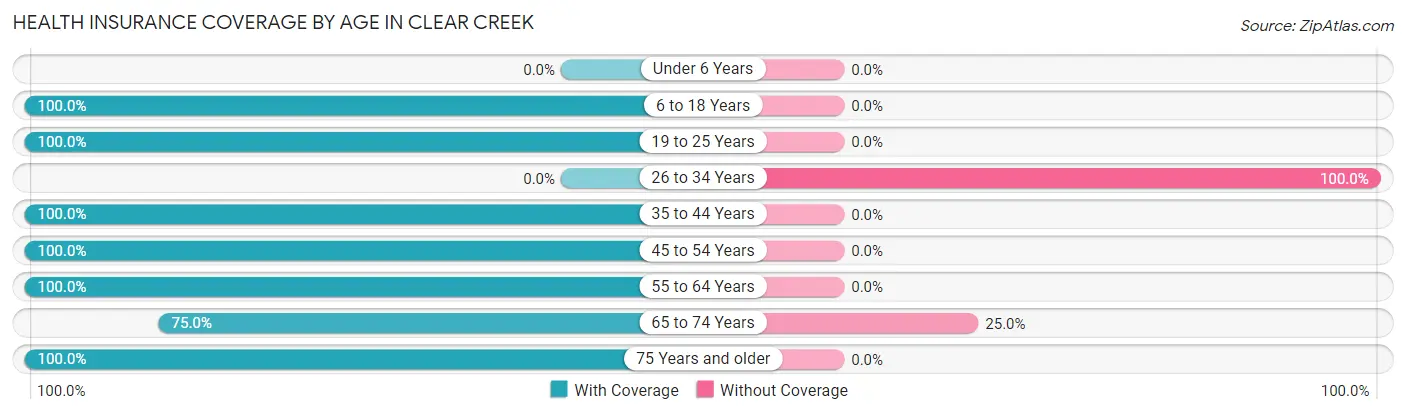
| Age Bracket | With Coverage | Without Coverage |
| Under 6 Years | 0 (0.0%) | 0 (0.0%) |
| 6 to 18 Years | 100 (100.0%) | 0 (0.0%) |
| 19 to 25 Years | 15 (100.0%) | 0 (0.0%) |
| 26 to 34 Years | 0 (0.0%) | 12 (100.0%) |
| 35 to 44 Years | 36 (100.0%) | 0 (0.0%) |
| 45 to 54 Years | 42 (100.0%) | 0 (0.0%) |
| 55 to 64 Years | 45 (100.0%) | 0 (0.0%) |
| 65 to 74 Years | 24 (75.0%) | 8 (25.0%) |
| 75 Years and older | 25 (100.0%) | 0 (0.0%) |
| Total | 287 (93.5%) | 20 (6.5%) |
Health Insurance Coverage by Citizenship Status in Clear Creek
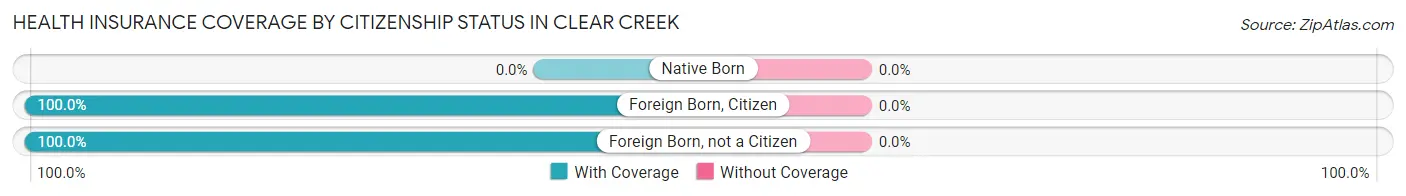
| Citizenship Status | With Coverage | Without Coverage |
| Native Born | 0 (0.0%) | 0 (0.0%) |
| Foreign Born, Citizen | 100 (100.0%) | 0 (0.0%) |
| Foreign Born, not a Citizen | 15 (100.0%) | 0 (0.0%) |
Health Insurance Coverage by Household Income in Clear Creek
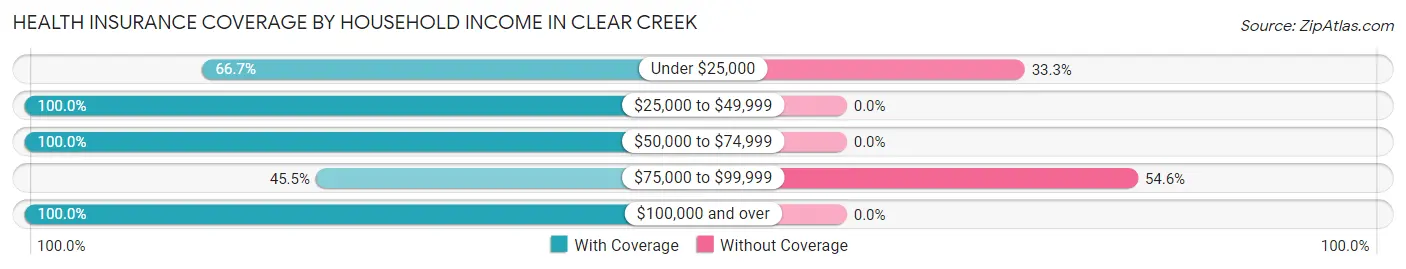
| Household Income | With Coverage | Without Coverage |
| Under $25,000 | 16 (66.7%) | 8 (33.3%) |
| $25,000 to $49,999 | 174 (100.0%) | 0 (0.0%) |
| $50,000 to $74,999 | 63 (100.0%) | 0 (0.0%) |
| $75,000 to $99,999 | 10 (45.5%) | 12 (54.5%) |
| $100,000 and over | 24 (100.0%) | 0 (0.0%) |
Public vs Private Health Insurance Coverage by Age in Clear Creek
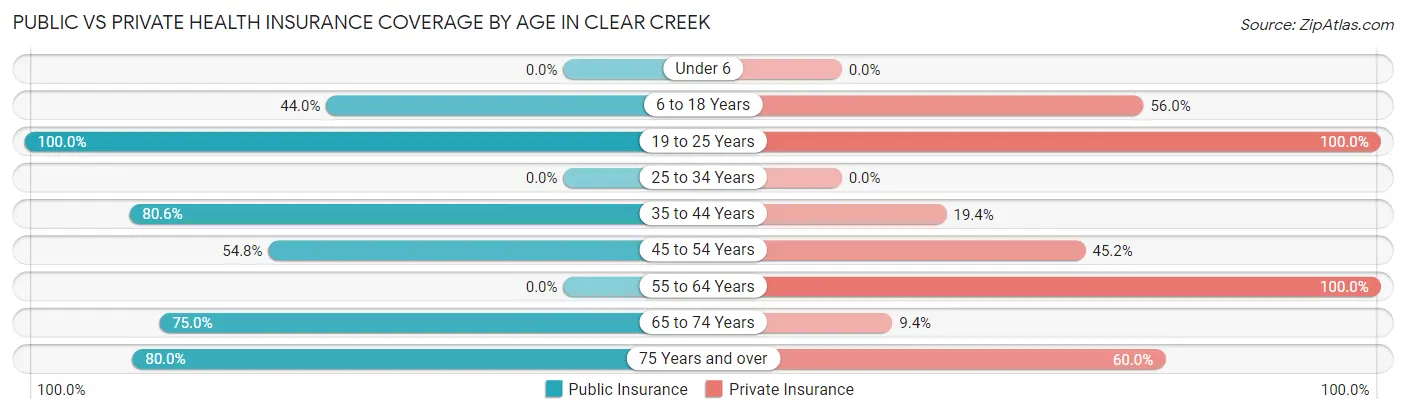
| Age Bracket | Public Insurance | Private Insurance |
| Under 6 | 0 (0.0%) | 0 (0.0%) |
| 6 to 18 Years | 44 (44.0%) | 56 (56.0%) |
| 19 to 25 Years | 15 (100.0%) | 15 (100.0%) |
| 25 to 34 Years | 0 (0.0%) | 0 (0.0%) |
| 35 to 44 Years | 29 (80.6%) | 7 (19.4%) |
| 45 to 54 Years | 23 (54.8%) | 19 (45.2%) |
| 55 to 64 Years | 0 (0.0%) | 45 (100.0%) |
| 65 to 74 Years | 24 (75.0%) | 3 (9.4%) |
| 75 Years and over | 20 (80.0%) | 15 (60.0%) |
| Total | 155 (50.5%) | 160 (52.1%) |
Disability Status by Sex by Age in Clear Creek
| Age Bracket | Male | Female |
| Under 5 Years | 0 (0.0%) | 0 (0.0%) |
| 5 to 17 Years | 0 (0.0%) | 0 (0.0%) |
| 18 to 34 Years | 0 (0.0%) | 0 (0.0%) |
| 35 to 64 Years | 0 (0.0%) | 0 (0.0%) |
| 65 to 74 Years | 0 (0.0%) | 0 (0.0%) |
| 75 Years and over | 0 (0.0%) | 0 (0.0%) |
Disability Class by Sex by Age in Clear Creek
Disability Class: Hearing Difficulty
| Age Bracket | Male | Female |
| Under 5 Years | 0 (0.0%) | 0 (0.0%) |
| 5 to 17 Years | 0 (0.0%) | 0 (0.0%) |
| 18 to 34 Years | 0 (0.0%) | 0 (0.0%) |
| 35 to 64 Years | 0 (0.0%) | 0 (0.0%) |
| 65 to 74 Years | 0 (0.0%) | 0 (0.0%) |
| 75 Years and over | 0 (0.0%) | 0 (0.0%) |
Disability Class: Vision Difficulty
| Age Bracket | Male | Female |
| Under 5 Years | 0 (0.0%) | 0 (0.0%) |
| 5 to 17 Years | 0 (0.0%) | 0 (0.0%) |
| 18 to 34 Years | 0 (0.0%) | 0 (0.0%) |
| 35 to 64 Years | 0 (0.0%) | 0 (0.0%) |
| 65 to 74 Years | 0 (0.0%) | 0 (0.0%) |
| 75 Years and over | 0 (0.0%) | 0 (0.0%) |
Disability Class: Cognitive Difficulty
| Age Bracket | Male | Female |
| 5 to 17 Years | 0 (0.0%) | 0 (0.0%) |
| 18 to 34 Years | 0 (0.0%) | 0 (0.0%) |
| 35 to 64 Years | 0 (0.0%) | 0 (0.0%) |
| 65 to 74 Years | 0 (0.0%) | 0 (0.0%) |
| 75 Years and over | 0 (0.0%) | 0 (0.0%) |
Disability Class: Ambulatory Difficulty
| Age Bracket | Male | Female |
| 5 to 17 Years | 0 (0.0%) | 0 (0.0%) |
| 18 to 34 Years | 0 (0.0%) | 0 (0.0%) |
| 35 to 64 Years | 0 (0.0%) | 0 (0.0%) |
| 65 to 74 Years | 0 (0.0%) | 0 (0.0%) |
| 75 Years and over | 0 (0.0%) | 0 (0.0%) |
Disability Class: Self-Care Difficulty
| Age Bracket | Male | Female |
| 5 to 17 Years | 0 (0.0%) | 0 (0.0%) |
| 18 to 34 Years | 0 (0.0%) | 0 (0.0%) |
| 35 to 64 Years | 0 (0.0%) | 0 (0.0%) |
| 65 to 74 Years | 0 (0.0%) | 0 (0.0%) |
| 75 Years and over | 0 (0.0%) | 0 (0.0%) |
Technology Access in Clear Creek
Computing Device Access in Clear Creek
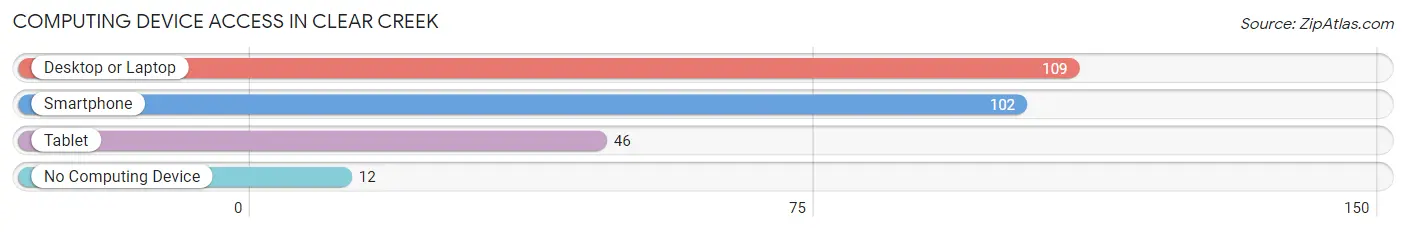
| Device Type | # Households | % Households |
| Desktop or Laptop | 109 | 85.8% |
| Smartphone | 102 | 80.3% |
| Tablet | 46 | 36.2% |
| No Computing Device | 12 | 9.5% |
| Total | 127 | 100.0% |
Internet Access in Clear Creek
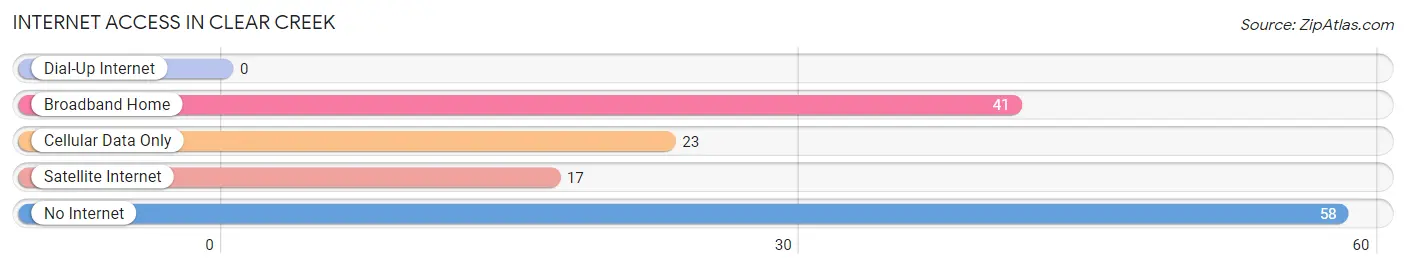
| Internet Type | # Households | % Households |
| Dial-Up Internet | 0 | 0.0% |
| Broadband Home | 41 | 32.3% |
| Cellular Data Only | 23 | 18.1% |
| Satellite Internet | 17 | 13.4% |
| No Internet | 58 | 45.7% |
| Total | 127 | 100.0% |
Clear Creek Summary
Introduction
Clear Creek is a small unincorporated community located in the Sierra Nevada foothills of El Dorado County, California. It is situated in the western part of the county, approximately 25 miles east of Placerville and 40 miles west of South Lake Tahoe. The community is nestled in a picturesque valley surrounded by rolling hills and is home to a population of approximately 500 people.
History
Clear Creek was first settled in the late 1800s by miners and loggers who were drawn to the area by the abundance of natural resources. The town was originally known as “Clear Creek Station” and was a stop on the stagecoach line that ran between Placerville and South Lake Tahoe. In the early 1900s, the town was renamed “Clear Creek” and became a popular destination for tourists and outdoor enthusiasts.
The town was officially incorporated in 1912 and the first post office was established in 1913. The town grew steadily throughout the 20th century and by the 1950s, it had become a popular destination for summer vacationers.
Geography
Clear Creek is located in the Sierra Nevada foothills of El Dorado County, California. It is situated in the western part of the county, approximately 25 miles east of Placerville and 40 miles west of South Lake Tahoe. The community is nestled in a picturesque valley surrounded by rolling hills and is home to a population of approximately 500 people.
The town is located at an elevation of 2,400 feet and is surrounded by the Eldorado National Forest. The area is known for its beautiful scenery and is a popular destination for outdoor activities such as hiking, camping, fishing, and hunting.
Economy
Clear Creek’s economy is largely based on tourism and outdoor recreation. The town is home to several small businesses, including restaurants, lodging, and retail stores. The town is also home to a number of small farms and ranches, which produce a variety of fruits and vegetables.
The town is also home to a number of small manufacturing businesses, which produce a variety of products such as furniture, clothing, and jewelry. The town is also home to a number of small service businesses, such as auto repair shops, hair salons, and pet groomers.
Demographics
As of the 2010 census, the population of Clear Creek was 498. The racial makeup of the town was 94.2% White, 0.2% African American, 0.4% Native American, 0.8% Asian, 0.2% Pacific Islander, 1.2% from other races, and 2.8% from two or more races. Hispanic or Latino of any race were 4.2% of the population.
The median income for a household in the town was $45,000 and the median income for a family was $50,000. The per capita income for the town was $20,000. About 10.2% of families and 12.2% of the population were below the poverty line, including 16.7% of those under age 18 and none of those age 65 or over.
Conclusion
Clear Creek is a small unincorporated community located in the Sierra Nevada foothills of El Dorado County, California. It is situated in the western part of the county, approximately 25 miles east of Placerville and 40 miles west of South Lake Tahoe. The community is nestled in a picturesque valley surrounded by rolling hills and is home to a population of approximately 500 people. The town’s economy is largely based on tourism and outdoor recreation and it is home to a number of small businesses, farms, and ranches. The population of Clear Creek is predominantly white and the median income for a household is $45,000.
Common Questions
What is Per Capita Income in Clear Creek?
Per Capita income in Clear Creek is $23,113.
What is the Median Family Income in Clear Creek?
Median Family Income in Clear Creek is $48,694.
What is the Median Household income in Clear Creek?
Median Household Income in Clear Creek is $48,472.
What is Income or Wage Gap in Clear Creek?
Income or Wage Gap in Clear Creek is 47.8%.
Women in Clear Creek earn 52.2 cents for every dollar earned by a man.
What is Inequality or Gini Index in Clear Creek?
Inequality or Gini Index in Clear Creek is 0.33.
What is the Total Population of Clear Creek?
Total Population of Clear Creek is 307.
What is the Total Male Population of Clear Creek?
Total Male Population of Clear Creek is 139.
What is the Total Female Population of Clear Creek?
Total Female Population of Clear Creek is 168.
What is the Ratio of Males per 100 Females in Clear Creek?
There are 82.74 Males per 100 Females in Clear Creek.
What is the Ratio of Females per 100 Males in Clear Creek?
There are 120.86 Females per 100 Males in Clear Creek.
What is the Median Population Age in Clear Creek?
Median Population Age in Clear Creek is 42.9 Years.
What is the Average Family Size in Clear Creek
Average Family Size in Clear Creek is 2.8 People.
What is the Average Household Size in Clear Creek
Average Household Size in Clear Creek is 2.4 People.
How Large is the Labor Force in Clear Creek?
There are 130 People in the Labor Forcein in Clear Creek.
What is the Percentage of People in the Labor Force in Clear Creek?
62.8% of People are in the Labor Force in Clear Creek.