Cold Springs CDP El Dorado County, CA Map & Demographics
Cold Springs CDP El Dorado County Overview
$40,821
PER CAPITA INCOME
$105,541
AVG FAMILY INCOME
$69,531
AVG HOUSEHOLD INCOME
0.32
INEQUALITY / GINI INDEX
612
TOTAL POPULATION
266
MALE POPULATION
346
FEMALE POPULATION
76.88
MALES / 100 FEMALES
130.08
FEMALES / 100 MALES
55.8
MEDIAN AGE
2.8
AVG FAMILY SIZE
2.4
AVG HOUSEHOLD SIZE
359
LABOR FORCE [ PEOPLE ]
62.5%
PERCENT IN LABOR FORCE
Income in Cold Springs CDP El Dorado County
Income Overview in Cold Springs CDP El Dorado County
Per Capita Income in Cold Springs CDP El Dorado County is $40,821, while median incomes of families and households are $105,541 and $69,531 respectively.
| Characteristic | Number | Measure |
| Per Capita Income | 612 | $40,821 |
| Median Family Income | 176 | $105,541 |
| Mean Family Income | 176 | $112,029 |
| Median Household Income | 251 | $69,531 |
| Mean Household Income | 251 | $98,709 |
| Income Deficit | 176 | $0 |
| Wage / Income Gap (%) | 612 | 0.00% |
| Wage / Income Gap ($) | 612 | 100.00¢ per $1 |
| Gini / Inequality Index | 612 | 0.32 |
Earnings by Sex in Cold Springs CDP El Dorado County
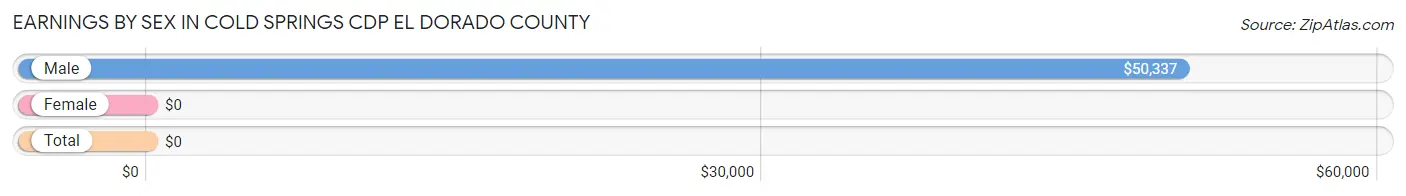
| Sex | Number | Average Earnings |
| Male | 153 (42.6%) | $50,337 |
| Female | 206 (57.4%) | $0 |
| Total | 359 (100.0%) | $0 |
Earnings by Sex by Income Bracket in Cold Springs CDP El Dorado County
The most common earnings brackets in Cold Springs CDP El Dorado County are $100,000+ for men (42 | 27.5%) and $10,000 to $12,499 for women (60 | 29.1%).
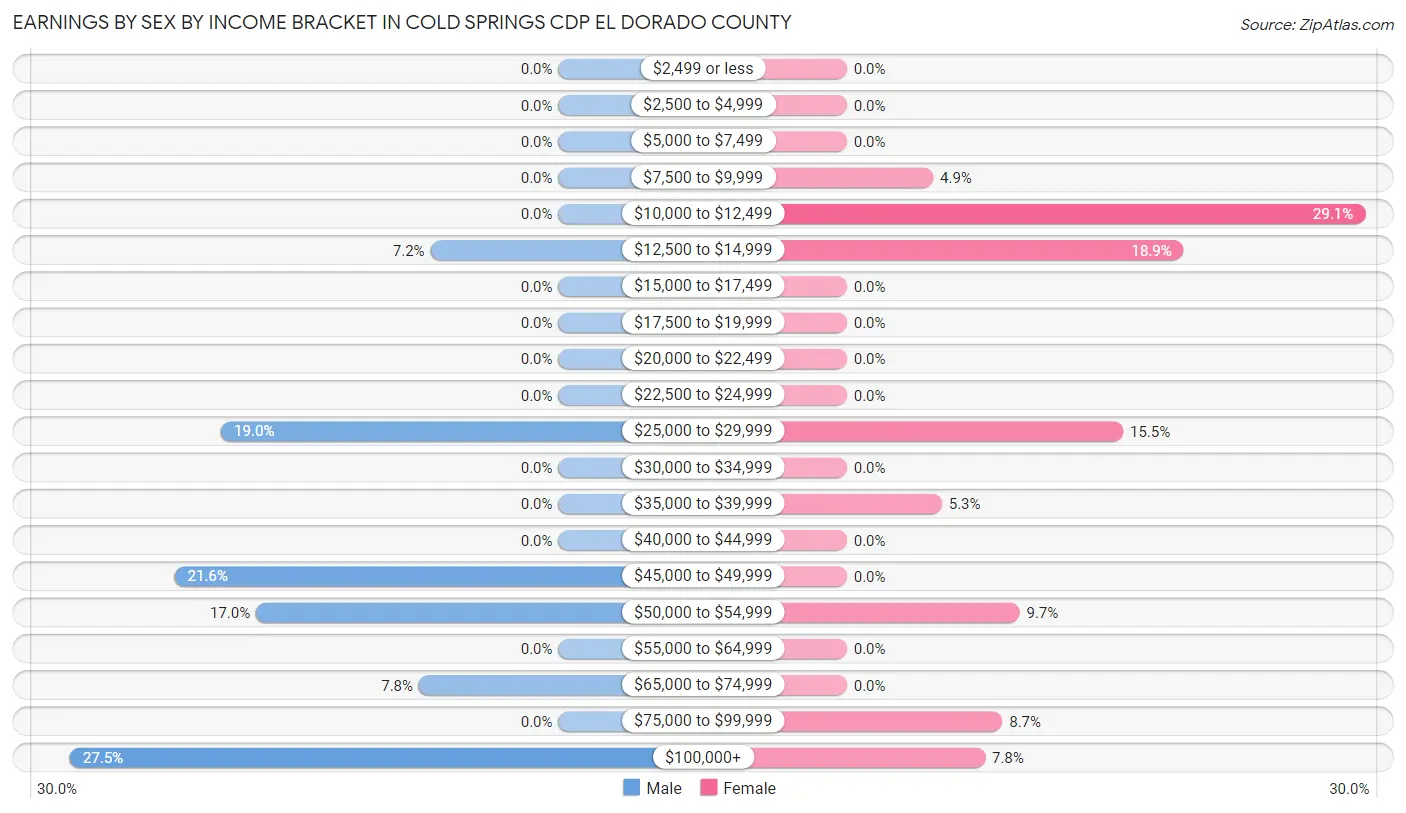
| Income | Male | Female |
| $2,499 or less | 0 (0.0%) | 0 (0.0%) |
| $2,500 to $4,999 | 0 (0.0%) | 0 (0.0%) |
| $5,000 to $7,499 | 0 (0.0%) | 0 (0.0%) |
| $7,500 to $9,999 | 0 (0.0%) | 10 (4.9%) |
| $10,000 to $12,499 | 0 (0.0%) | 60 (29.1%) |
| $12,500 to $14,999 | 11 (7.2%) | 39 (18.9%) |
| $15,000 to $17,499 | 0 (0.0%) | 0 (0.0%) |
| $17,500 to $19,999 | 0 (0.0%) | 0 (0.0%) |
| $20,000 to $22,499 | 0 (0.0%) | 0 (0.0%) |
| $22,500 to $24,999 | 0 (0.0%) | 0 (0.0%) |
| $25,000 to $29,999 | 29 (19.0%) | 32 (15.5%) |
| $30,000 to $34,999 | 0 (0.0%) | 0 (0.0%) |
| $35,000 to $39,999 | 0 (0.0%) | 11 (5.3%) |
| $40,000 to $44,999 | 0 (0.0%) | 0 (0.0%) |
| $45,000 to $49,999 | 33 (21.6%) | 0 (0.0%) |
| $50,000 to $54,999 | 26 (17.0%) | 20 (9.7%) |
| $55,000 to $64,999 | 0 (0.0%) | 0 (0.0%) |
| $65,000 to $74,999 | 12 (7.8%) | 0 (0.0%) |
| $75,000 to $99,999 | 0 (0.0%) | 18 (8.7%) |
| $100,000+ | 42 (27.5%) | 16 (7.8%) |
| Total | 153 (100.0%) | 206 (100.0%) |
Earnings by Sex by Educational Attainment in Cold Springs CDP El Dorado County
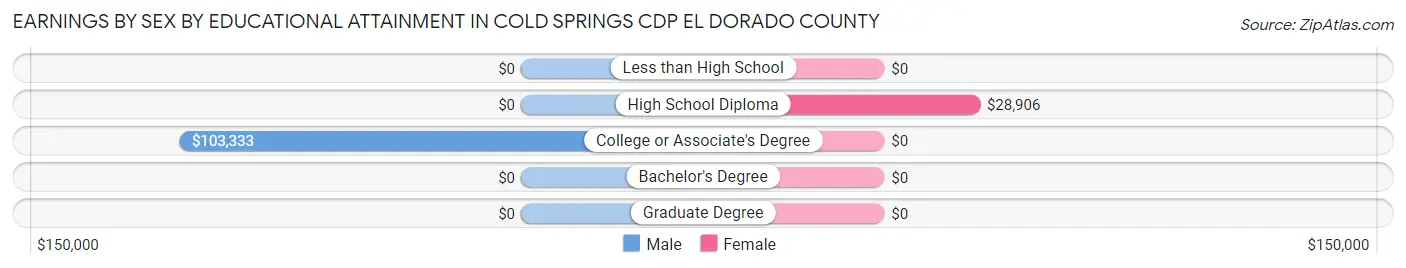
| Educational Attainment | Male Income | Female Income |
| Less than High School | - | - |
| High School Diploma | - | - |
| College or Associate's Degree | $103,333 | $0 |
| Bachelor's Degree | - | - |
| Graduate Degree | - | - |
| Total | $50,337 | $0 |
Family Income in Cold Springs CDP El Dorado County
Family Income Brackets in Cold Springs CDP El Dorado County
According to the Cold Springs CDP El Dorado County family income data, there are 63 families falling into the $100,000 to $149,999 income range, which is the most common income bracket and makes up 35.8% of all families.
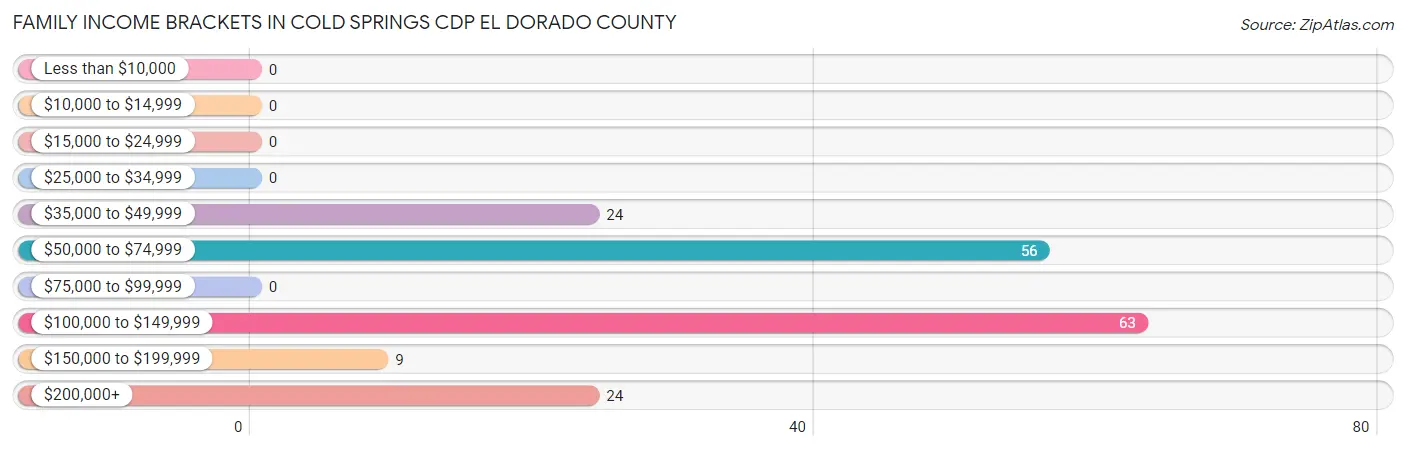
| Income Bracket | # Families | % Families |
| Less than $10,000 | 0 | 0.0% |
| $10,000 to $14,999 | 0 | 0.0% |
| $15,000 to $24,999 | 0 | 0.0% |
| $25,000 to $34,999 | 0 | 0.0% |
| $35,000 to $49,999 | 24 | 13.6% |
| $50,000 to $74,999 | 56 | 31.8% |
| $75,000 to $99,999 | 0 | 0.0% |
| $100,000 to $149,999 | 63 | 35.8% |
| $150,000 to $199,999 | 9 | 5.1% |
| $200,000+ | 24 | 13.6% |
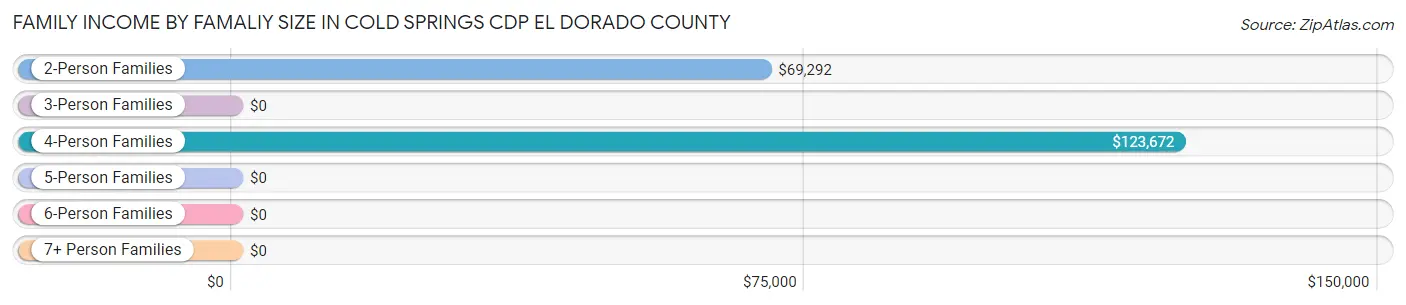
Family Income by Famaliy Size in Cold Springs CDP El Dorado County
4-person families (35 | 19.9%) account for the highest median family income in Cold Springs CDP El Dorado County with $123,672 per family, while 2-person families (91 | 51.7%) have the highest median income of $34,646 per family member.
| Income Bracket | # Families | Median Income |
| 2-Person Families | 91 (51.7%) | $69,292 |
| 3-Person Families | 50 (28.4%) | $0 |
| 4-Person Families | 35 (19.9%) | $123,672 |
| 5-Person Families | 0 (0.0%) | $0 |
| 6-Person Families | 0 (0.0%) | $0 |
| 7+ Person Families | 0 (0.0%) | $0 |
| Total | 176 (100.0%) | $105,541 |
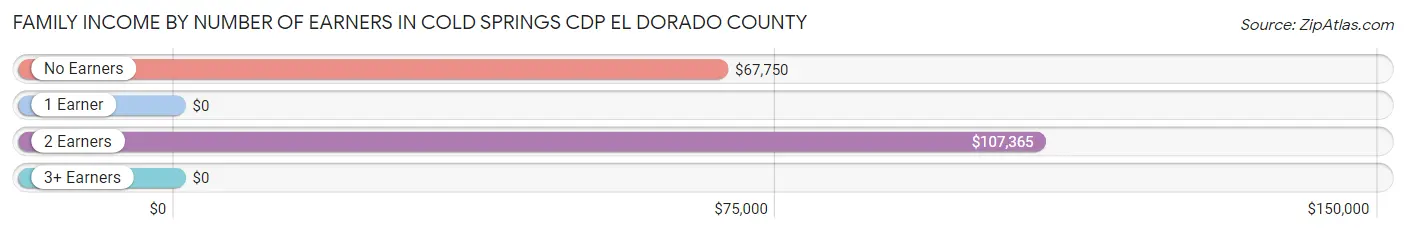
Family Income by Number of Earners in Cold Springs CDP El Dorado County
| Number of Earners | # Families | Median Income |
| No Earners | 54 (30.7%) | $67,750 |
| 1 Earner | 0 (0.0%) | $0 |
| 2 Earners | 122 (69.3%) | $107,365 |
| 3+ Earners | 0 (0.0%) | $0 |
| Total | 176 (100.0%) | $105,541 |
Household Income in Cold Springs CDP El Dorado County
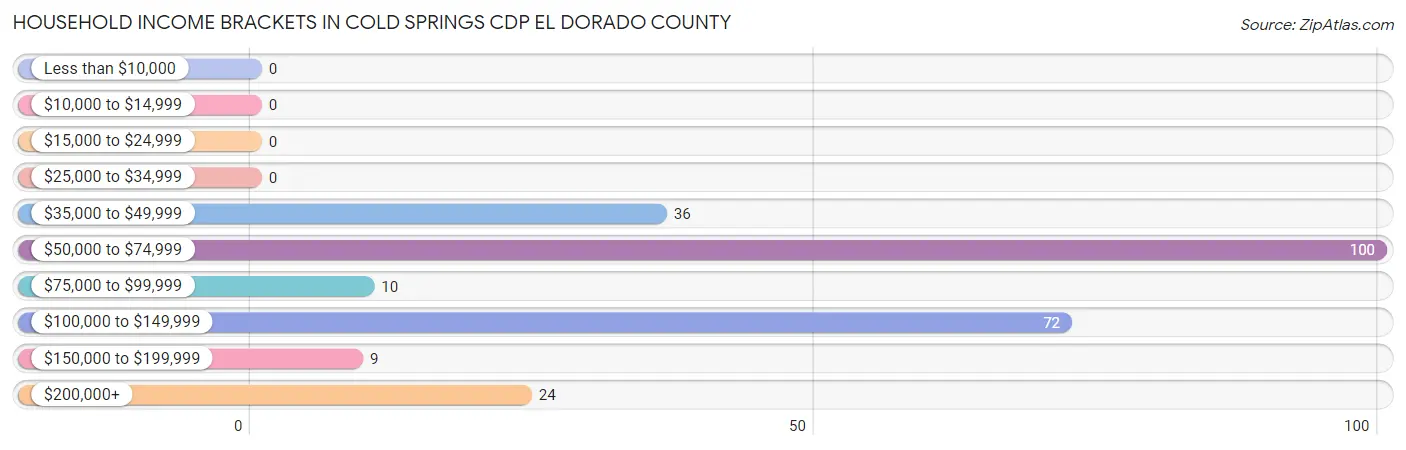
Household Income Brackets in Cold Springs CDP El Dorado County
With 100 households falling in the category, the $50,000 to $74,999 income range is the most frequent in Cold Springs CDP El Dorado County, accounting for 39.8% of all households.
| Income Bracket | # Households | % Households |
| Less than $10,000 | 0 | 0.0% |
| $10,000 to $14,999 | 0 | 0.0% |
| $15,000 to $24,999 | 0 | 0.0% |
| $25,000 to $34,999 | 0 | 0.0% |
| $35,000 to $49,999 | 36 | 14.3% |
| $50,000 to $74,999 | 100 | 39.8% |
| $75,000 to $99,999 | 10 | 4.0% |
| $100,000 to $149,999 | 72 | 28.7% |
| $150,000 to $199,999 | 9 | 3.6% |
| $200,000+ | 24 | 9.6% |
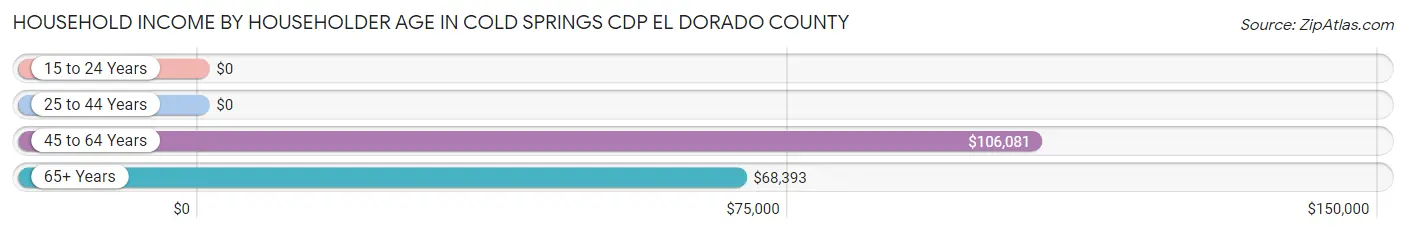
Household Income by Householder Age in Cold Springs CDP El Dorado County
The median household income in Cold Springs CDP El Dorado County is $69,531, with the highest median household income of $106,081 found in the 45 to 64 years age bracket for the primary householder. A total of 122 households (48.6%) fall into this category.
| Income Bracket | # Households | Median Income |
| 15 to 24 Years | 0 (0.0%) | $0 |
| 25 to 44 Years | 19 (7.6%) | $0 |
| 45 to 64 Years | 122 (48.6%) | $106,081 |
| 65+ Years | 110 (43.8%) | $68,393 |
| Total | 251 (100.0%) | $69,531 |
Poverty in Cold Springs CDP El Dorado County
Income Below Poverty by Sex and Age in Cold Springs CDP El Dorado County
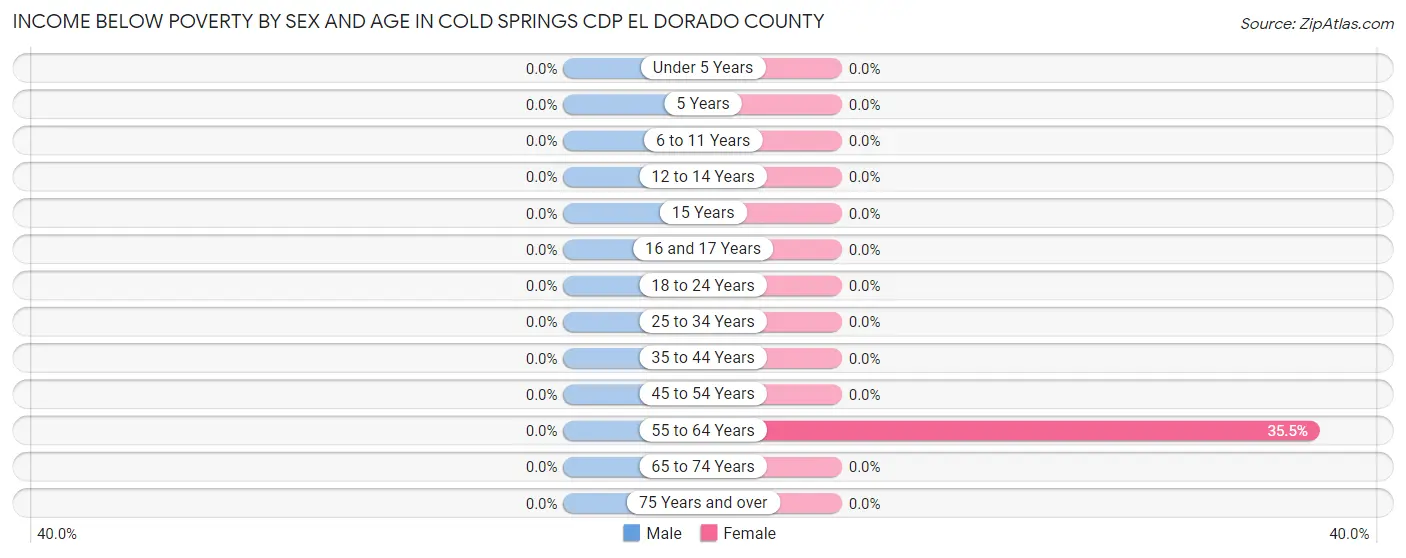
| Age Bracket | Male | Female |
| Under 5 Years | 0 (0.0%) | 0 (0.0%) |
| 5 Years | 0 (0.0%) | 0 (0.0%) |
| 6 to 11 Years | 0 (0.0%) | 0 (0.0%) |
| 12 to 14 Years | 0 (0.0%) | 0 (0.0%) |
| 15 Years | 0 (0.0%) | 0 (0.0%) |
| 16 and 17 Years | 0 (0.0%) | 0 (0.0%) |
| 18 to 24 Years | 0 (0.0%) | 0 (0.0%) |
| 25 to 34 Years | 0 (0.0%) | 0 (0.0%) |
| 35 to 44 Years | 0 (0.0%) | 0 (0.0%) |
| 45 to 54 Years | 0 (0.0%) | 0 (0.0%) |
| 55 to 64 Years | 0 (0.0%) | 33 (35.5%) |
| 65 to 74 Years | 0 (0.0%) | 0 (0.0%) |
| 75 Years and over | 0 (0.0%) | 0 (0.0%) |
| Total | 0 (0.0%) | 33 (9.5%) |
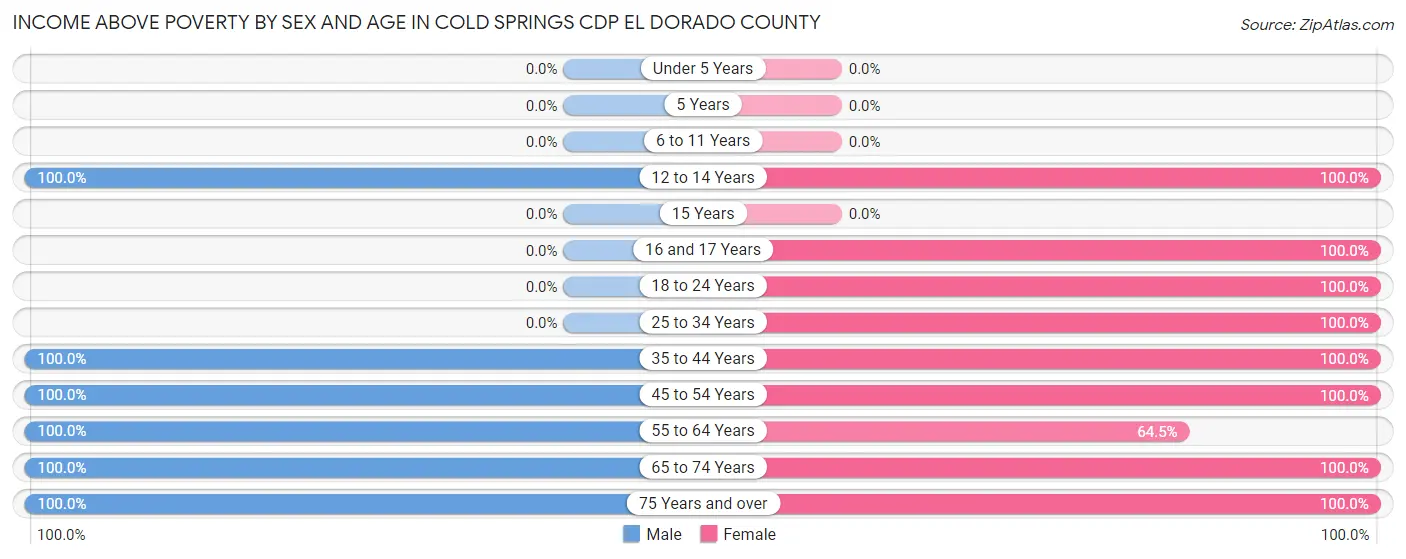
Income Above Poverty by Sex and Age in Cold Springs CDP El Dorado County
According to the poverty statistics in Cold Springs CDP El Dorado County, males aged 12 to 14 years and females aged 12 to 14 years are the age groups that are most secure financially, with 100.0% of males and 100.0% of females in these age groups living above the poverty line.
| Age Bracket | Male | Female |
| Under 5 Years | 0 (0.0%) | 0 (0.0%) |
| 5 Years | 0 (0.0%) | 0 (0.0%) |
| 6 to 11 Years | 0 (0.0%) | 0 (0.0%) |
| 12 to 14 Years | 5 (100.0%) | 33 (100.0%) |
| 15 Years | 0 (0.0%) | 0 (0.0%) |
| 16 and 17 Years | 0 (0.0%) | 8 (100.0%) |
| 18 to 24 Years | 0 (0.0%) | 39 (100.0%) |
| 25 to 34 Years | 0 (0.0%) | 8 (100.0%) |
| 35 to 44 Years | 18 (100.0%) | 10 (100.0%) |
| 45 to 54 Years | 85 (100.0%) | 58 (100.0%) |
| 55 to 64 Years | 85 (100.0%) | 60 (64.5%) |
| 65 to 74 Years | 29 (100.0%) | 73 (100.0%) |
| 75 Years and over | 44 (100.0%) | 24 (100.0%) |
| Total | 266 (100.0%) | 313 (90.5%) |
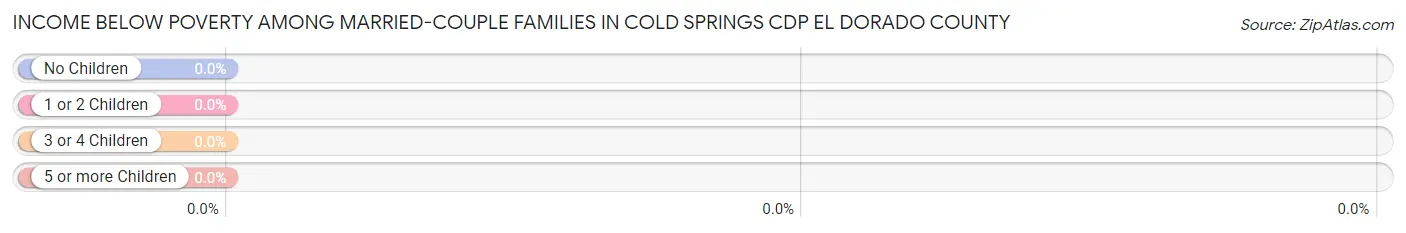
Income Below Poverty Among Married-Couple Families in Cold Springs CDP El Dorado County
| Children | Above Poverty | Below Poverty |
| No Children | 91 (100.0%) | 0 (0.0%) |
| 1 or 2 Children | 35 (100.0%) | 0 (0.0%) |
| 3 or 4 Children | 0 (0.0%) | 0 (0.0%) |
| 5 or more Children | 0 (0.0%) | 0 (0.0%) |
| Total | 126 (100.0%) | 0 (0.0%) |
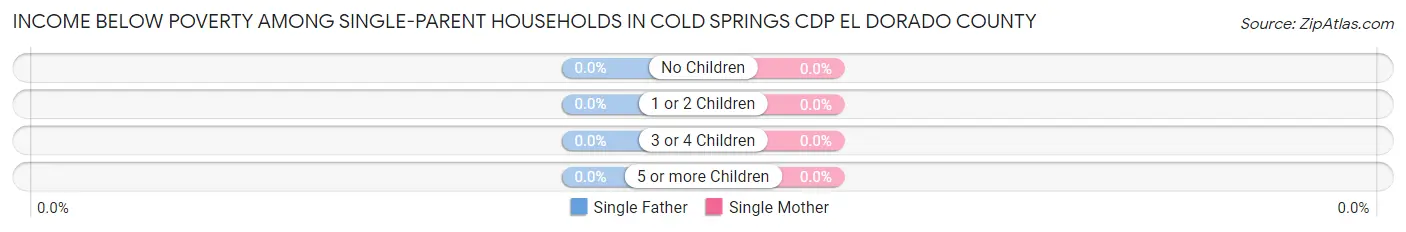
Income Below Poverty Among Single-Parent Households in Cold Springs CDP El Dorado County
| Children | Single Father | Single Mother |
| No Children | 0 (0.0%) | 0 (0.0%) |
| 1 or 2 Children | 0 (0.0%) | 0 (0.0%) |
| 3 or 4 Children | 0 (0.0%) | 0 (0.0%) |
| 5 or more Children | 0 (0.0%) | 0 (0.0%) |
| Total | 0 (0.0%) | 0 (0.0%) |
Income Below Poverty Among Married-Couple vs Single-Parent Households in Cold Springs CDP El Dorado County
| Children | Married-Couple Families | Single-Parent Households |
| No Children | 0 (0.0%) | 0 (0.0%) |
| 1 or 2 Children | 0 (0.0%) | 0 (0.0%) |
| 3 or 4 Children | 0 (0.0%) | 0 (0.0%) |
| 5 or more Children | 0 (0.0%) | 0 (0.0%) |
| Total | 0 (0.0%) | 0 (0.0%) |
Race in Cold Springs CDP El Dorado County
The most populous races in Cold Springs CDP El Dorado County are White / Caucasian (509 | 83.2%), Two or more Races (93 | 15.2%), and Hispanic or Latino (73 | 11.9%).
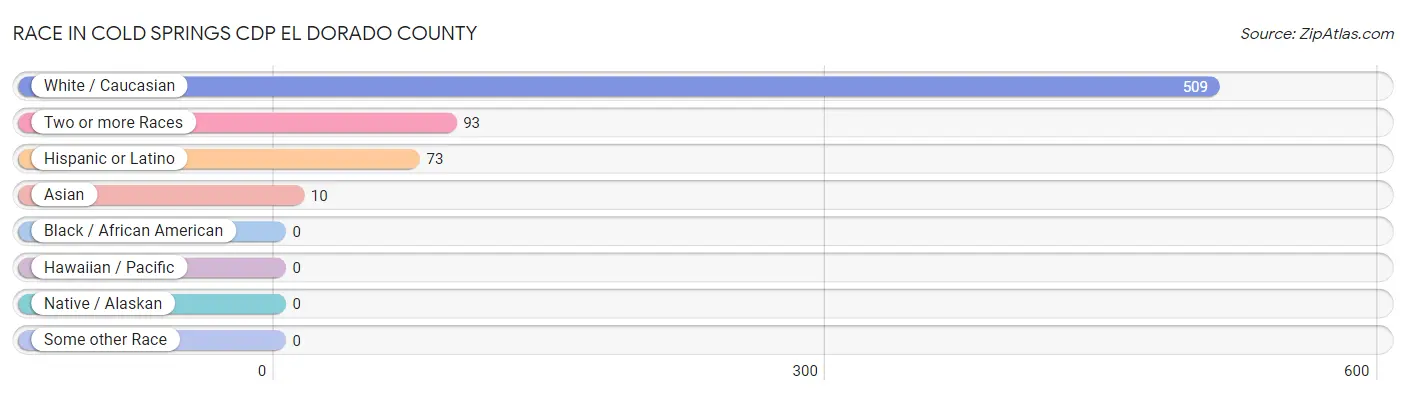
| Race | # Population | % Population |
| Asian | 10 | 1.6% |
| Black / African American | 0 | 0.0% |
| Hawaiian / Pacific | 0 | 0.0% |
| Hispanic or Latino | 73 | 11.9% |
| Native / Alaskan | 0 | 0.0% |
| White / Caucasian | 509 | 83.2% |
| Two or more Races | 93 | 15.2% |
| Some other Race | 0 | 0.0% |
| Total | 612 | 100.0% |
Ancestry in Cold Springs CDP El Dorado County
The most populous ancestries reported in Cold Springs CDP El Dorado County are Irish (128 | 20.9%), German (105 | 17.2%), Spanish (73 | 11.9%), European (58 | 9.5%), and Italian (38 | 6.2%), together accounting for 65.7% of all Cold Springs CDP El Dorado County residents.
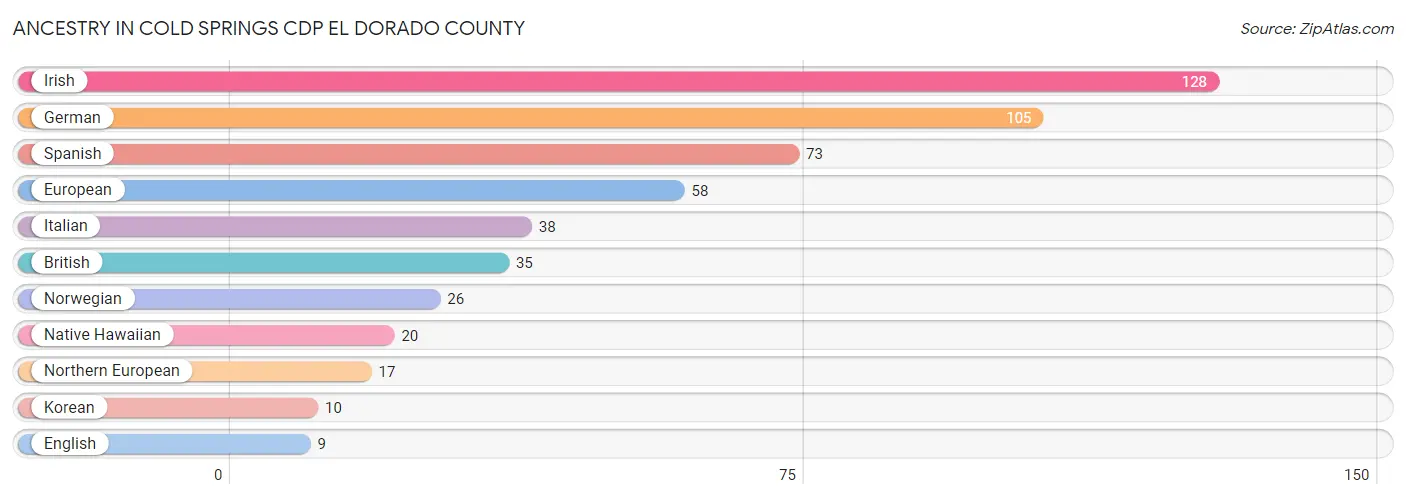
| Ancestry | # Population | % Population |
| British | 35 | 5.7% |
| English | 9 | 1.5% |
| European | 58 | 9.5% |
| German | 105 | 17.2% |
| Irish | 128 | 20.9% |
| Italian | 38 | 6.2% |
| Korean | 10 | 1.6% |
| Native Hawaiian | 20 | 3.3% |
| Northern European | 17 | 2.8% |
| Norwegian | 26 | 4.3% |
| Spanish | 73 | 11.9% | View All 11 Rows |
Immigrants in Cold Springs CDP El Dorado County
The most numerous immigrant groups reported in Cold Springs CDP El Dorado County came from England (24 | 3.9%), Europe (24 | 3.9%), Northern Europe (24 | 3.9%), Asia (10 | 1.6%), and Philippines (10 | 1.6%), together accounting for 15.0% of all Cold Springs CDP El Dorado County residents.
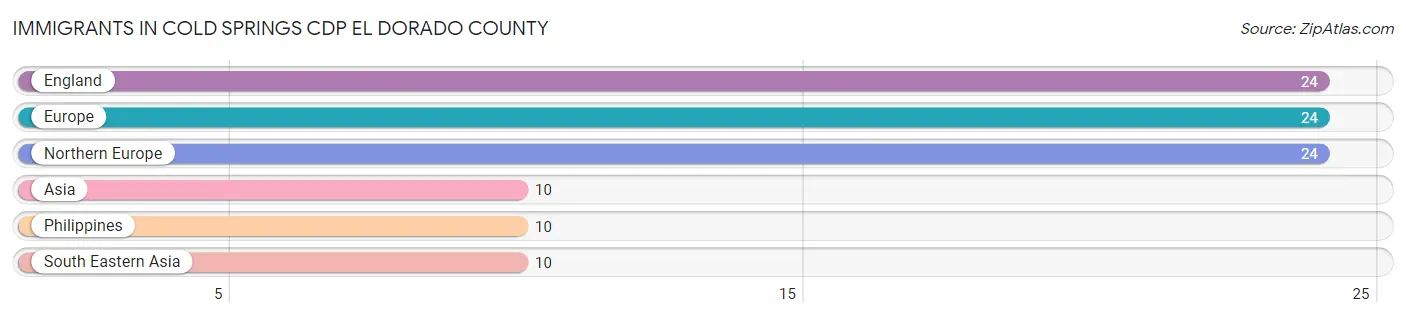
| Immigration Origin | # Population | % Population |
| Asia | 10 | 1.6% |
| England | 24 | 3.9% |
| Europe | 24 | 3.9% |
| Northern Europe | 24 | 3.9% |
| Philippines | 10 | 1.6% |
| South Eastern Asia | 10 | 1.6% | View All 6 Rows |
Sex and Age in Cold Springs CDP El Dorado County
Sex and Age in Cold Springs CDP El Dorado County
The most populous age groups in Cold Springs CDP El Dorado County are 50 to 54 Years (85 | 32.0%) for men and 60 to 64 Years (60 | 17.3%) for women.
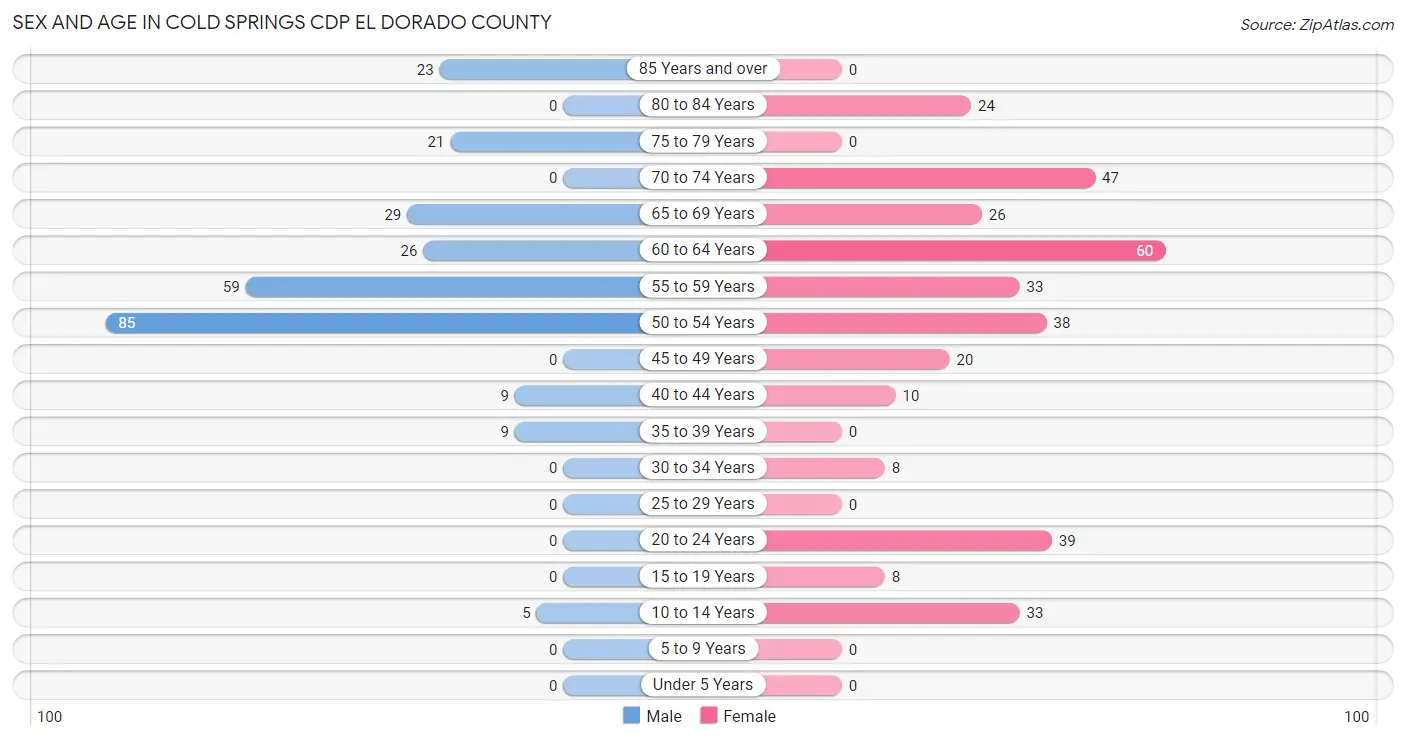
| Age Bracket | Male | Female |
| Under 5 Years | 0 (0.0%) | 0 (0.0%) |
| 5 to 9 Years | 0 (0.0%) | 0 (0.0%) |
| 10 to 14 Years | 5 (1.9%) | 33 (9.5%) |
| 15 to 19 Years | 0 (0.0%) | 8 (2.3%) |
| 20 to 24 Years | 0 (0.0%) | 39 (11.3%) |
| 25 to 29 Years | 0 (0.0%) | 0 (0.0%) |
| 30 to 34 Years | 0 (0.0%) | 8 (2.3%) |
| 35 to 39 Years | 9 (3.4%) | 0 (0.0%) |
| 40 to 44 Years | 9 (3.4%) | 10 (2.9%) |
| 45 to 49 Years | 0 (0.0%) | 20 (5.8%) |
| 50 to 54 Years | 85 (32.0%) | 38 (11.0%) |
| 55 to 59 Years | 59 (22.2%) | 33 (9.5%) |
| 60 to 64 Years | 26 (9.8%) | 60 (17.3%) |
| 65 to 69 Years | 29 (10.9%) | 26 (7.5%) |
| 70 to 74 Years | 0 (0.0%) | 47 (13.6%) |
| 75 to 79 Years | 21 (7.9%) | 0 (0.0%) |
| 80 to 84 Years | 0 (0.0%) | 24 (6.9%) |
| 85 Years and over | 23 (8.6%) | 0 (0.0%) |
| Total | 266 (100.0%) | 346 (100.0%) |
Families and Households in Cold Springs CDP El Dorado County
Median Family Size in Cold Springs CDP El Dorado County
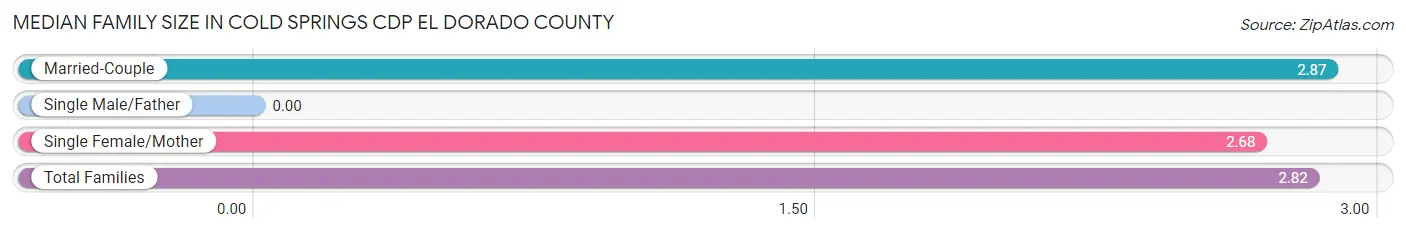
| Family Type | # Families | Family Size |
| Married-Couple | 126 (71.6%) | 2.87 |
| Single Male/Father | 0 (0.0%) | - |
| Single Female/Mother | 50 (28.4%) | 2.68 |
| Total Families | 176 (100.0%) | 2.82 |
Median Household Size in Cold Springs CDP El Dorado County
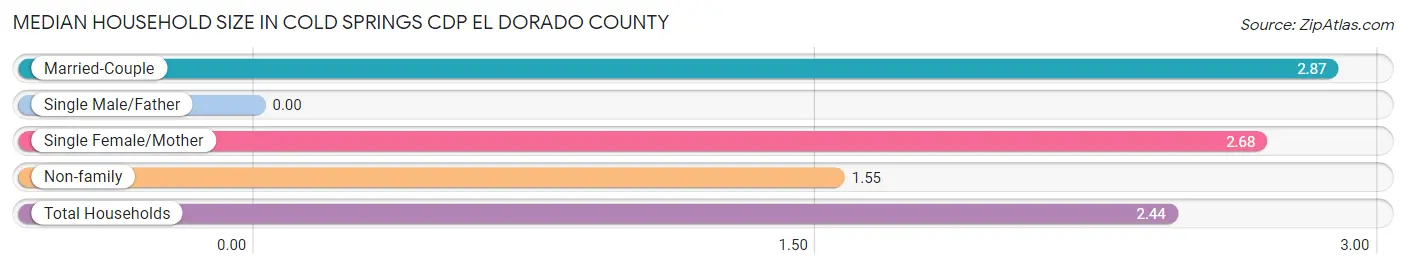
| Household Type | # Households | Household Size |
| Married-Couple | 126 (50.2%) | 2.87 |
| Single Male/Father | 0 (0.0%) | - |
| Single Female/Mother | 50 (19.9%) | 2.68 |
| Non-family | 75 (29.9%) | 1.55 |
| Total Households | 251 (100.0%) | 2.44 |
Household Size by Marriage Status in Cold Springs CDP El Dorado County
Out of a total of 251 households in Cold Springs CDP El Dorado County, 176 (70.1%) are family households, while 75 (29.9%) are nonfamily households. The most numerous type of family households are 2-person households, comprising 91, and the most common type of nonfamily households are 2-person households, comprising 42.
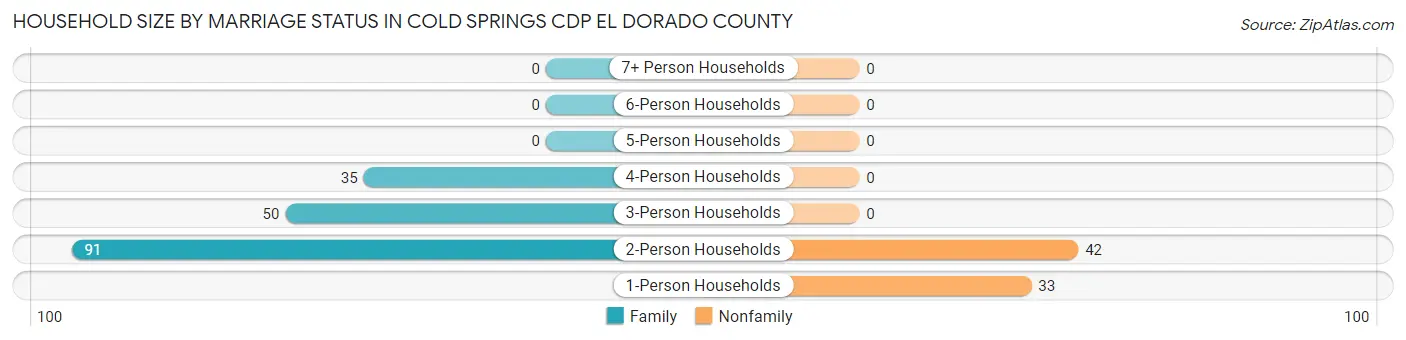
| Household Size | Family Households | Nonfamily Households |
| 1-Person Households | - | 33 (13.2%) |
| 2-Person Households | 91 (36.2%) | 42 (16.7%) |
| 3-Person Households | 50 (19.9%) | 0 (0.0%) |
| 4-Person Households | 35 (13.9%) | 0 (0.0%) |
| 5-Person Households | 0 (0.0%) | 0 (0.0%) |
| 6-Person Households | 0 (0.0%) | 0 (0.0%) |
| 7+ Person Households | 0 (0.0%) | 0 (0.0%) |
| Total | 176 (70.1%) | 75 (29.9%) |
Female Fertility in Cold Springs CDP El Dorado County
Fertility by Age in Cold Springs CDP El Dorado County
| Age Bracket | Women with Births | Births / 1,000 Women |
| 15 to 19 years | 0 (0.0%) | 0.0 |
| 20 to 34 years | 0 (0.0%) | 0.0 |
| 35 to 50 years | 0 (0.0%) | 0.0 |
| Total | 0 (0.0%) | 0.0 |
Fertility by Age by Marriage Status in Cold Springs CDP El Dorado County
| Age Bracket | Married | Unmarried |
| 15 to 19 years | 0 (0.0%) | 0 (0.0%) |
| 20 to 34 years | 0 (0.0%) | 0 (0.0%) |
| 35 to 50 years | 0 (0.0%) | 0 (0.0%) |
| Total | 0 (0.0%) | 0 (0.0%) |
Fertility by Education in Cold Springs CDP El Dorado County
| Educational Attainment | Women with Births | Births / 1,000 Women |
| Less than High School | 0 (0.0%) | 0.0 |
| High School Diploma | 0 (0.0%) | 0.0 |
| College or Associate's Degree | 0 (0.0%) | 0.0 |
| Bachelor's Degree | 0 (0.0%) | 0.0 |
| Graduate Degree | 0 (0.0%) | 0.0 |
| Total | 0 (0.0%) | 0.0 |
Fertility by Education by Marriage Status in Cold Springs CDP El Dorado County
| Educational Attainment | Married | Unmarried |
| Less than High School | 0 (0.0%) | 0 (0.0%) |
| High School Diploma | 0 (0.0%) | 0 (0.0%) |
| College or Associate's Degree | 0 (0.0%) | 0 (0.0%) |
| Bachelor's Degree | 0 (0.0%) | 0 (0.0%) |
| Graduate Degree | 0 (0.0%) | 0 (0.0%) |
| Total | 0 (0.0%) | 0 (0.0%) |
Employment Characteristics in Cold Springs CDP El Dorado County
Employment by Class of Employer in Cold Springs CDP El Dorado County
Among the 359 employed individuals in Cold Springs CDP El Dorado County, private company employees (149 | 41.5%), self-employed (not incorporated) (130 | 36.2%), and state government employees (61 | 17.0%) make up the most common classes of employment.
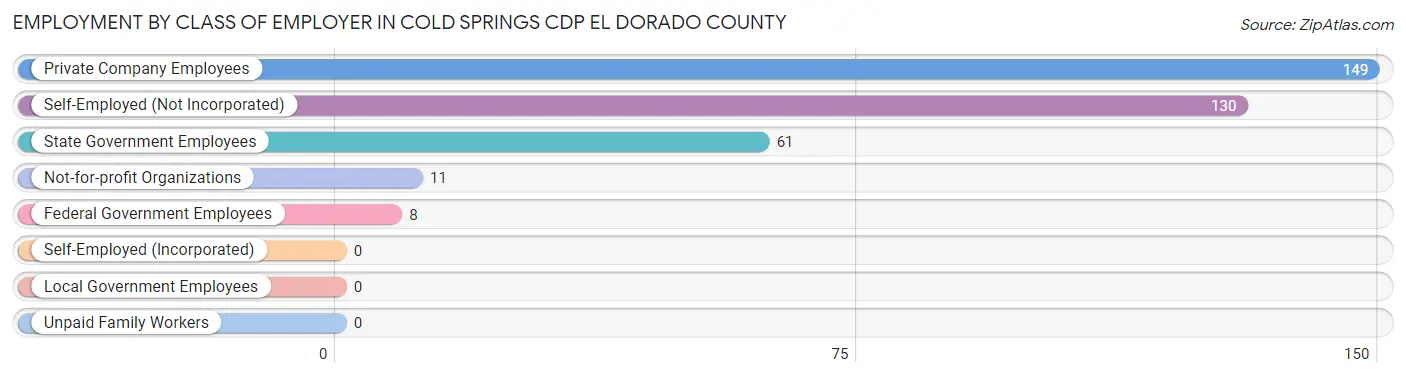
| Employer Class | # Employees | % Employees |
| Private Company Employees | 149 | 41.5% |
| Self-Employed (Incorporated) | 0 | 0.0% |
| Self-Employed (Not Incorporated) | 130 | 36.2% |
| Not-for-profit Organizations | 11 | 3.1% |
| Local Government Employees | 0 | 0.0% |
| State Government Employees | 61 | 17.0% |
| Federal Government Employees | 8 | 2.2% |
| Unpaid Family Workers | 0 | 0.0% |
| Total | 359 | 100.0% |
Employment Status by Age in Cold Springs CDP El Dorado County
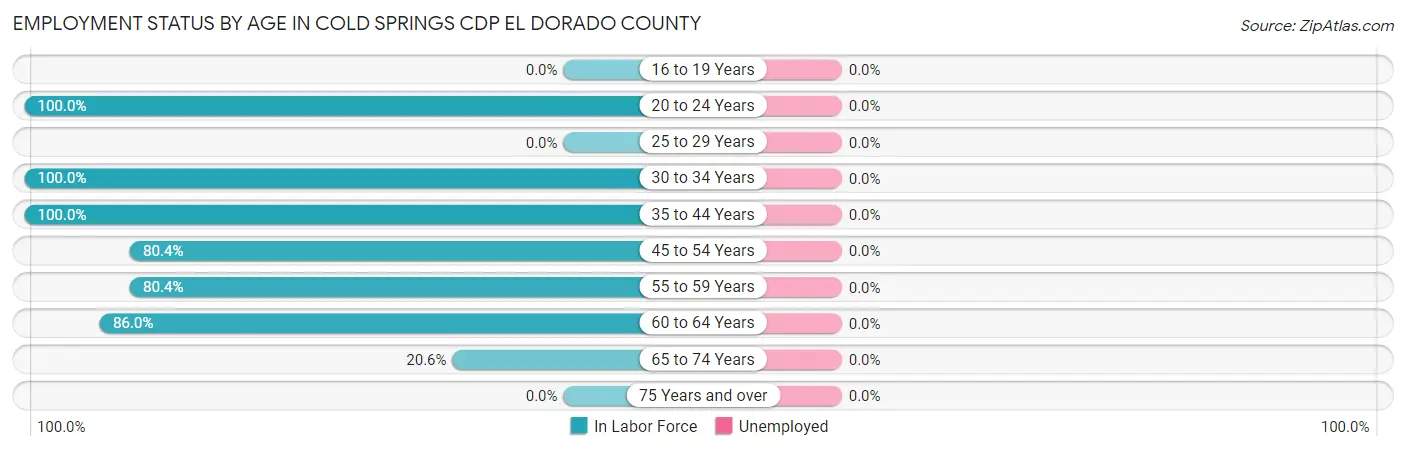
| Age Bracket | In Labor Force | Unemployed |
| 16 to 19 Years | 0 (0.0%) | 0 (0.0%) |
| 20 to 24 Years | 39 (100.0%) | 0 (0.0%) |
| 25 to 29 Years | 0 (0.0%) | 0 (0.0%) |
| 30 to 34 Years | 8 (100.0%) | 0 (0.0%) |
| 35 to 44 Years | 28 (100.0%) | 0 (0.0%) |
| 45 to 54 Years | 115 (80.4%) | 0 (0.0%) |
| 55 to 59 Years | 74 (80.4%) | 0 (0.0%) |
| 60 to 64 Years | 74 (86.0%) | 0 (0.0%) |
| 65 to 74 Years | 21 (20.6%) | 0 (0.0%) |
| 75 Years and over | 0 (0.0%) | 0 (0.0%) |
| Total | 359 (62.5%) | 0 (0.0%) |
Employment Status by Educational Attainment in Cold Springs CDP El Dorado County
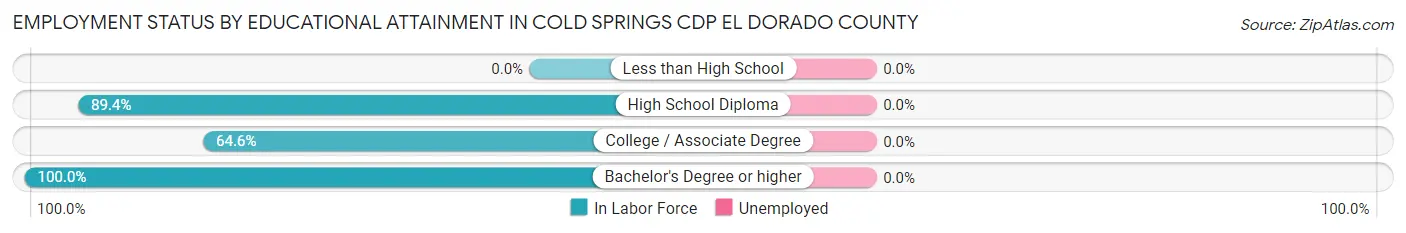
| Educational Attainment | In Labor Force | Unemployed |
| Less than High School | 0 (0.0%) | 0 (0.0%) |
| High School Diploma | 152 (89.4%) | 0 (0.0%) |
| College / Associate Degree | 73 (64.6%) | 0 (0.0%) |
| Bachelor's Degree or higher | 74 (100.0%) | 0 (0.0%) |
| Total | 299 (83.8%) | 0 (0.0%) |
Employment Occupations by Sex in Cold Springs CDP El Dorado County
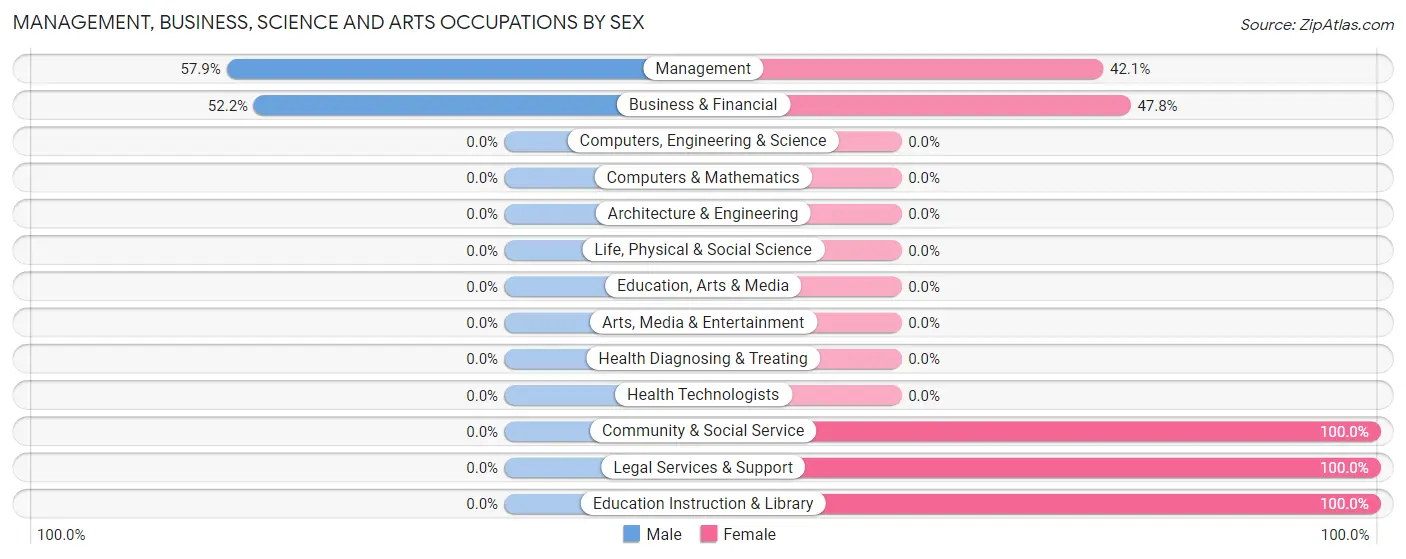
Management, Business, Science and Arts Occupations
The most common Management, Business, Science and Arts occupations in Cold Springs CDP El Dorado County are Management (76 | 21.2%), Community & Social Service (34 | 9.5%), Business & Financial (23 | 6.4%), Education Instruction & Library (18 | 5.0%), and Legal Services & Support (16 | 4.5%).
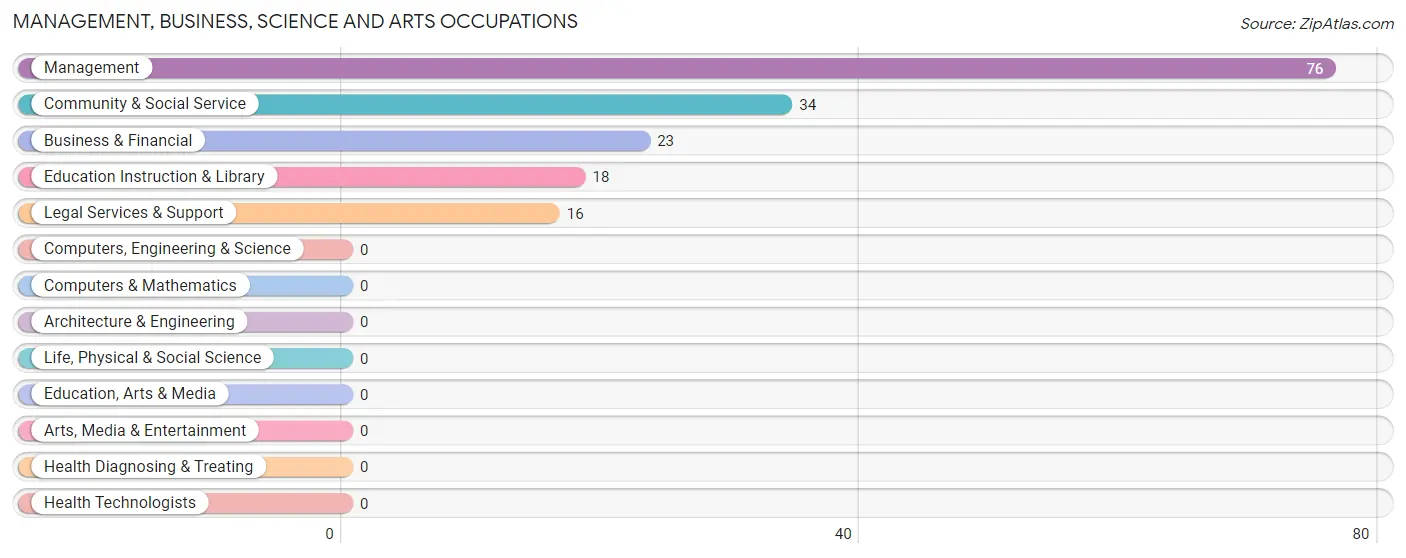
Management, Business, Science and Arts Occupations by Sex
Within the Management, Business, Science and Arts occupations in Cold Springs CDP El Dorado County, the most male-oriented occupations are Management (57.9%), and Business & Financial (52.2%), while the most female-oriented occupations are Community & Social Service (100.0%), Legal Services & Support (100.0%), and Education Instruction & Library (100.0%).
| Occupation | Male | Female |
| Management | 44 (57.9%) | 32 (42.1%) |
| Business & Financial | 12 (52.2%) | 11 (47.8%) |
| Computers, Engineering & Science | 0 (0.0%) | 0 (0.0%) |
| Computers & Mathematics | 0 (0.0%) | 0 (0.0%) |
| Architecture & Engineering | 0 (0.0%) | 0 (0.0%) |
| Life, Physical & Social Science | 0 (0.0%) | 0 (0.0%) |
| Community & Social Service | 0 (0.0%) | 34 (100.0%) |
| Education, Arts & Media | 0 (0.0%) | 0 (0.0%) |
| Legal Services & Support | 0 (0.0%) | 16 (100.0%) |
| Education Instruction & Library | 0 (0.0%) | 18 (100.0%) |
| Arts, Media & Entertainment | 0 (0.0%) | 0 (0.0%) |
| Health Diagnosing & Treating | 0 (0.0%) | 0 (0.0%) |
| Health Technologists | 0 (0.0%) | 0 (0.0%) |
| Total (Category) | 56 (42.1%) | 77 (57.9%) |
| Total (Overall) | 153 (42.6%) | 206 (57.4%) |
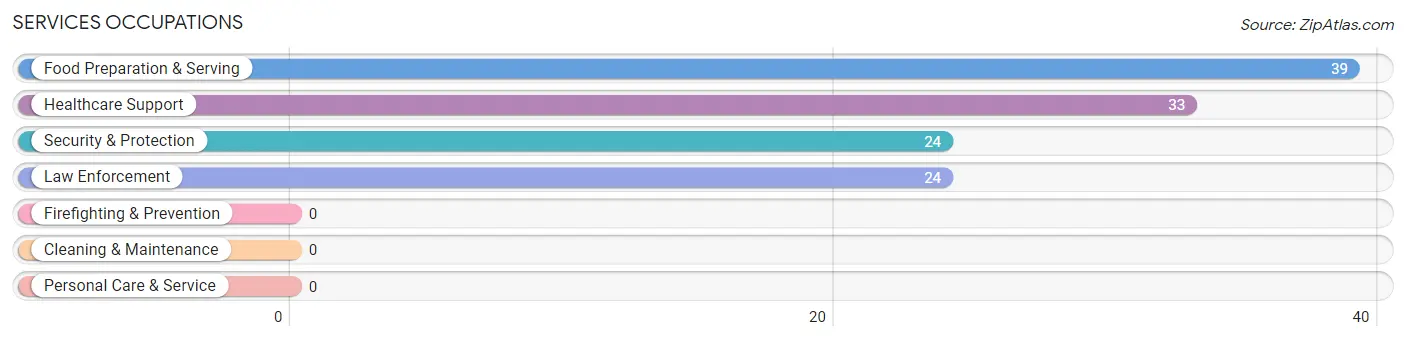
Services Occupations
The most common Services occupations in Cold Springs CDP El Dorado County are Food Preparation & Serving (39 | 10.9%), Healthcare Support (33 | 9.2%), Security & Protection (24 | 6.7%), and Law Enforcement (24 | 6.7%).
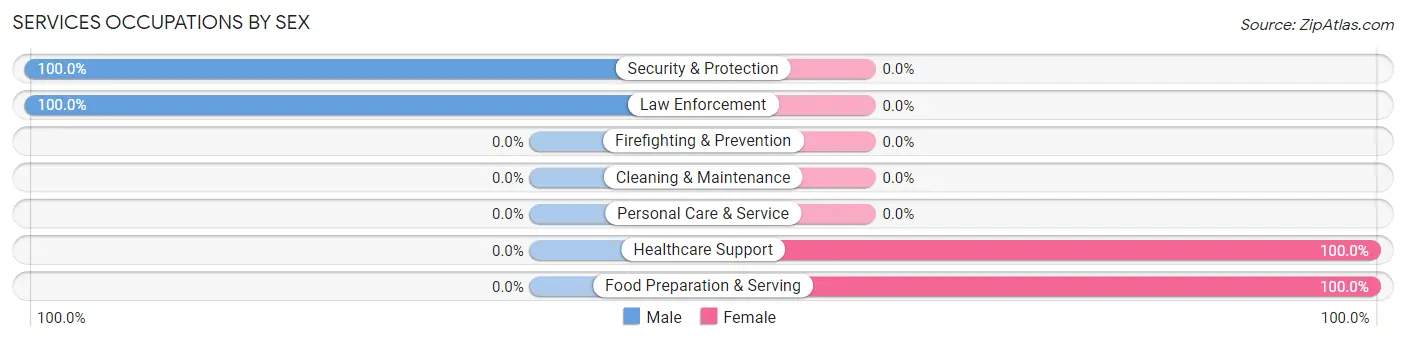
Services Occupations by Sex
Within the Services occupations in Cold Springs CDP El Dorado County, the most male-oriented occupations are Security & Protection (100.0%), and Law Enforcement (100.0%), while the most female-oriented occupations are Healthcare Support (100.0%), and Food Preparation & Serving (100.0%).
| Occupation | Male | Female |
| Healthcare Support | 0 (0.0%) | 33 (100.0%) |
| Security & Protection | 24 (100.0%) | 0 (0.0%) |
| Firefighting & Prevention | 0 (0.0%) | 0 (0.0%) |
| Law Enforcement | 24 (100.0%) | 0 (0.0%) |
| Food Preparation & Serving | 0 (0.0%) | 39 (100.0%) |
| Cleaning & Maintenance | 0 (0.0%) | 0 (0.0%) |
| Personal Care & Service | 0 (0.0%) | 0 (0.0%) |
| Total (Category) | 24 (25.0%) | 72 (75.0%) |
| Total (Overall) | 153 (42.6%) | 206 (57.4%) |
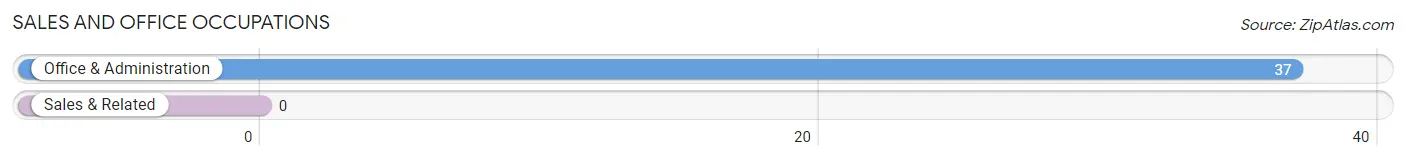
Sales and Office Occupations
The most common Sales and Office occupations in Cold Springs CDP El Dorado County are , and Office & Administration (37 | 10.3%).
Sales and Office Occupations by Sex
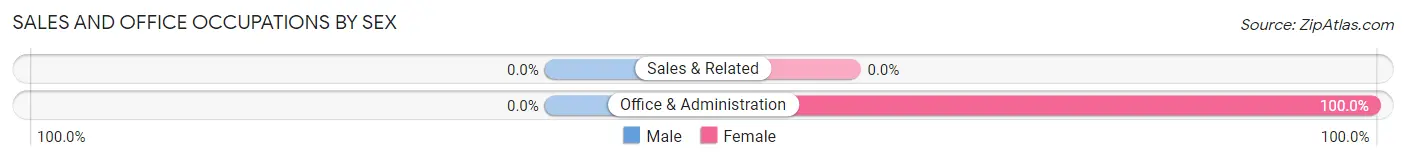
| Occupation | Male | Female |
| Sales & Related | 0 (0.0%) | 0 (0.0%) |
| Office & Administration | 0 (0.0%) | 37 (100.0%) |
| Total (Category) | 0 (0.0%) | 37 (100.0%) |
| Total (Overall) | 153 (42.6%) | 206 (57.4%) |
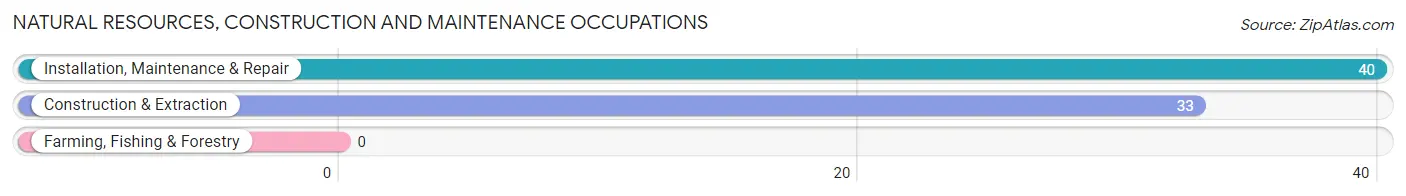
Natural Resources, Construction and Maintenance Occupations
The most common Natural Resources, Construction and Maintenance occupations in Cold Springs CDP El Dorado County are Installation, Maintenance & Repair (40 | 11.1%), and Construction & Extraction (33 | 9.2%).
Natural Resources, Construction and Maintenance Occupations by Sex
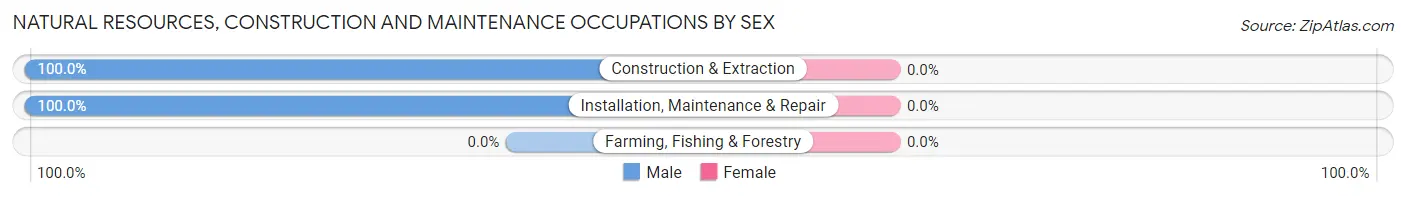
| Occupation | Male | Female |
| Farming, Fishing & Forestry | 0 (0.0%) | 0 (0.0%) |
| Construction & Extraction | 33 (100.0%) | 0 (0.0%) |
| Installation, Maintenance & Repair | 40 (100.0%) | 0 (0.0%) |
| Total (Category) | 73 (100.0%) | 0 (0.0%) |
| Total (Overall) | 153 (42.6%) | 206 (57.4%) |
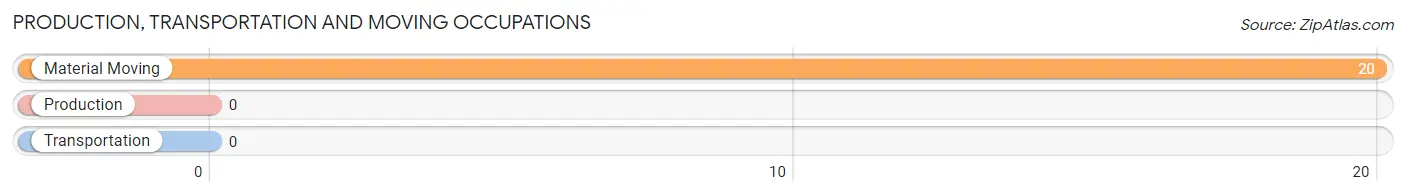
Production, Transportation and Moving Occupations
The most common Production, Transportation and Moving occupations in Cold Springs CDP El Dorado County are , and Material Moving (20 | 5.6%).
Production, Transportation and Moving Occupations by Sex
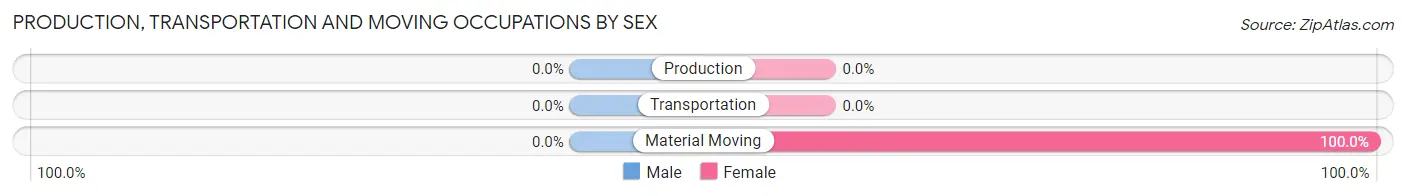
| Occupation | Male | Female |
| Production | 0 (0.0%) | 0 (0.0%) |
| Transportation | 0 (0.0%) | 0 (0.0%) |
| Material Moving | 0 (0.0%) | 20 (100.0%) |
| Total (Category) | 0 (0.0%) | 20 (100.0%) |
| Total (Overall) | 153 (42.6%) | 206 (57.4%) |
Employment Industries by Sex in Cold Springs CDP El Dorado County
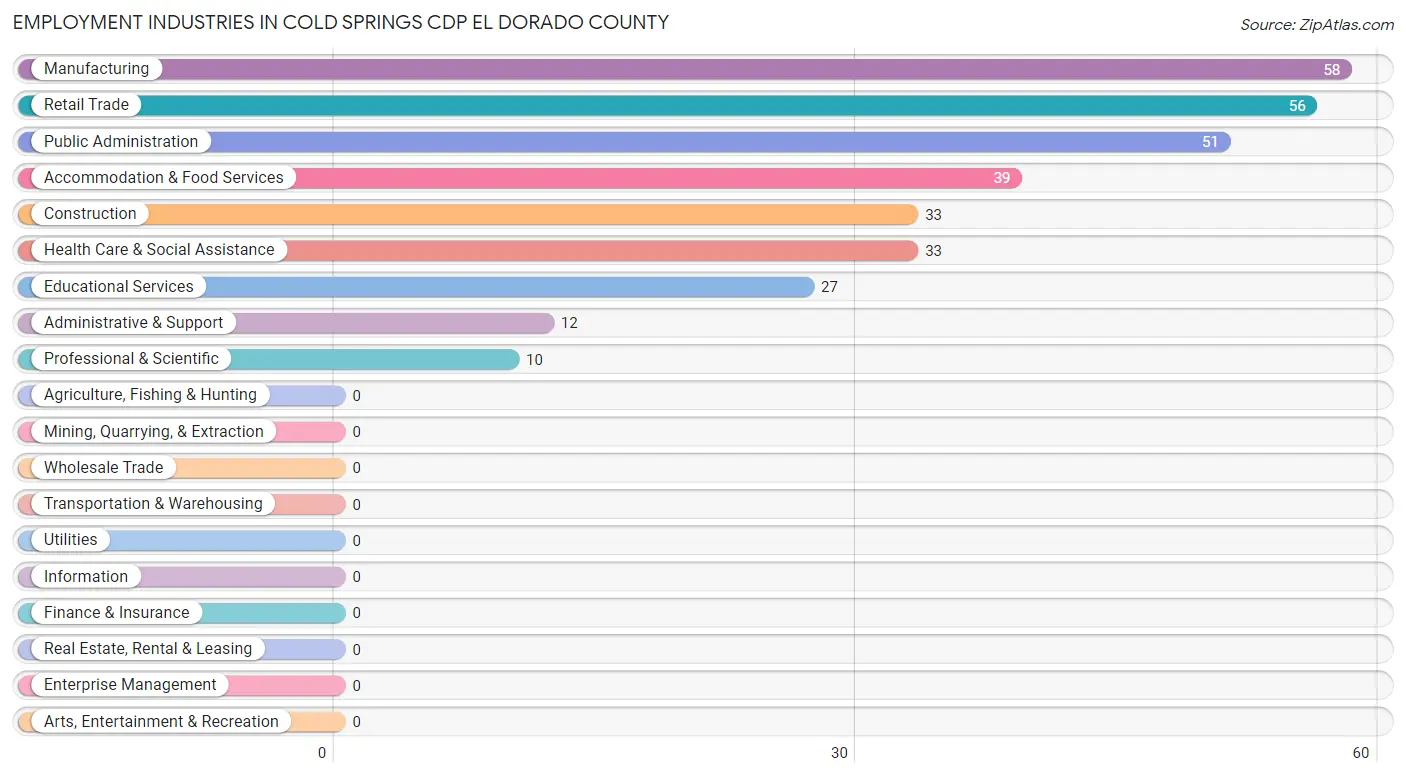
Employment Industries in Cold Springs CDP El Dorado County
The major employment industries in Cold Springs CDP El Dorado County include Manufacturing (58 | 16.2%), Retail Trade (56 | 15.6%), Public Administration (51 | 14.2%), Accommodation & Food Services (39 | 10.9%), and Construction (33 | 9.2%).
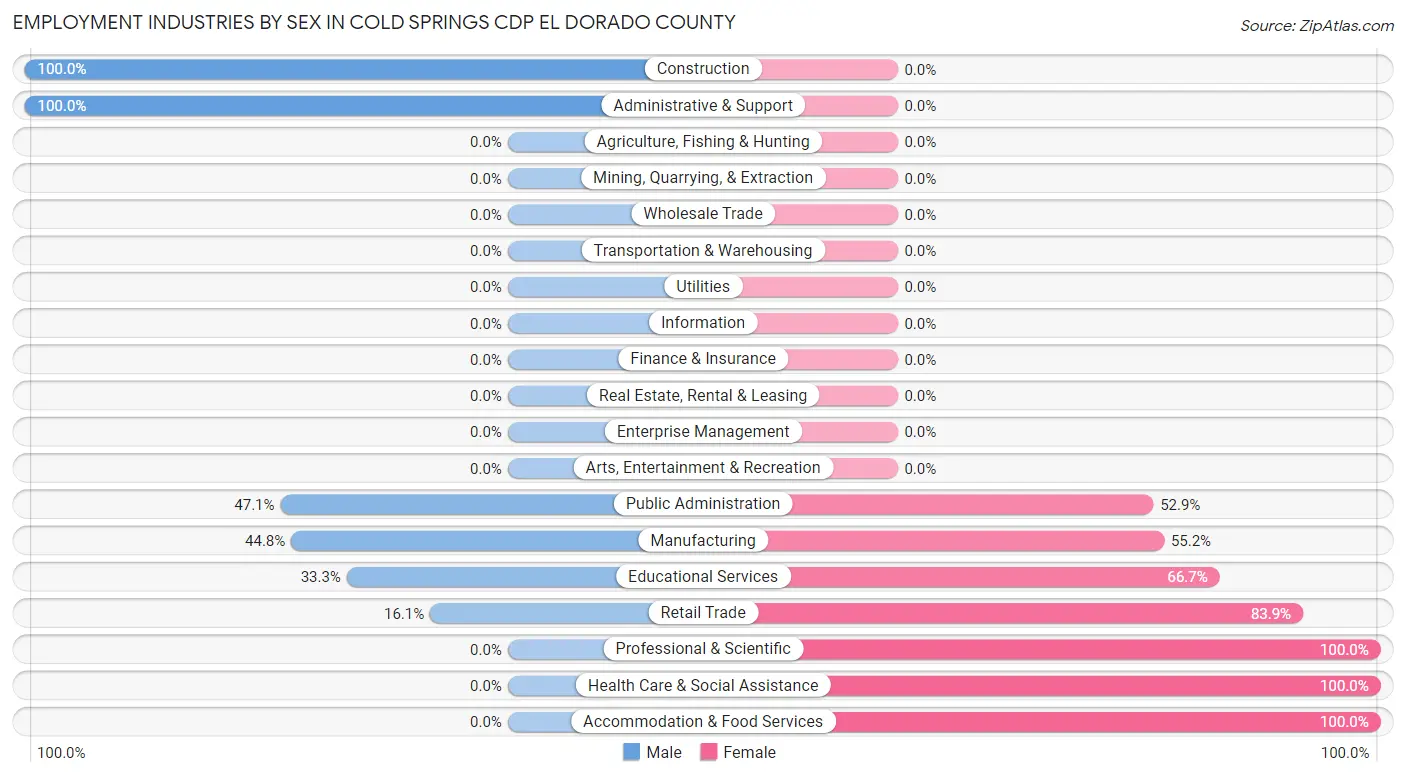
Employment Industries by Sex in Cold Springs CDP El Dorado County
The Cold Springs CDP El Dorado County industries that see more men than women are Construction (100.0%), Administrative & Support (100.0%), and Public Administration (47.1%), whereas the industries that tend to have a higher number of women are Professional & Scientific (100.0%), Health Care & Social Assistance (100.0%), and Accommodation & Food Services (100.0%).
| Industry | Male | Female |
| Agriculture, Fishing & Hunting | 0 (0.0%) | 0 (0.0%) |
| Mining, Quarrying, & Extraction | 0 (0.0%) | 0 (0.0%) |
| Construction | 33 (100.0%) | 0 (0.0%) |
| Manufacturing | 26 (44.8%) | 32 (55.2%) |
| Wholesale Trade | 0 (0.0%) | 0 (0.0%) |
| Retail Trade | 9 (16.1%) | 47 (83.9%) |
| Transportation & Warehousing | 0 (0.0%) | 0 (0.0%) |
| Utilities | 0 (0.0%) | 0 (0.0%) |
| Information | 0 (0.0%) | 0 (0.0%) |
| Finance & Insurance | 0 (0.0%) | 0 (0.0%) |
| Real Estate, Rental & Leasing | 0 (0.0%) | 0 (0.0%) |
| Professional & Scientific | 0 (0.0%) | 10 (100.0%) |
| Enterprise Management | 0 (0.0%) | 0 (0.0%) |
| Administrative & Support | 12 (100.0%) | 0 (0.0%) |
| Educational Services | 9 (33.3%) | 18 (66.7%) |
| Health Care & Social Assistance | 0 (0.0%) | 33 (100.0%) |
| Arts, Entertainment & Recreation | 0 (0.0%) | 0 (0.0%) |
| Accommodation & Food Services | 0 (0.0%) | 39 (100.0%) |
| Public Administration | 24 (47.1%) | 27 (52.9%) |
| Total | 153 (42.6%) | 206 (57.4%) |
Education in Cold Springs CDP El Dorado County
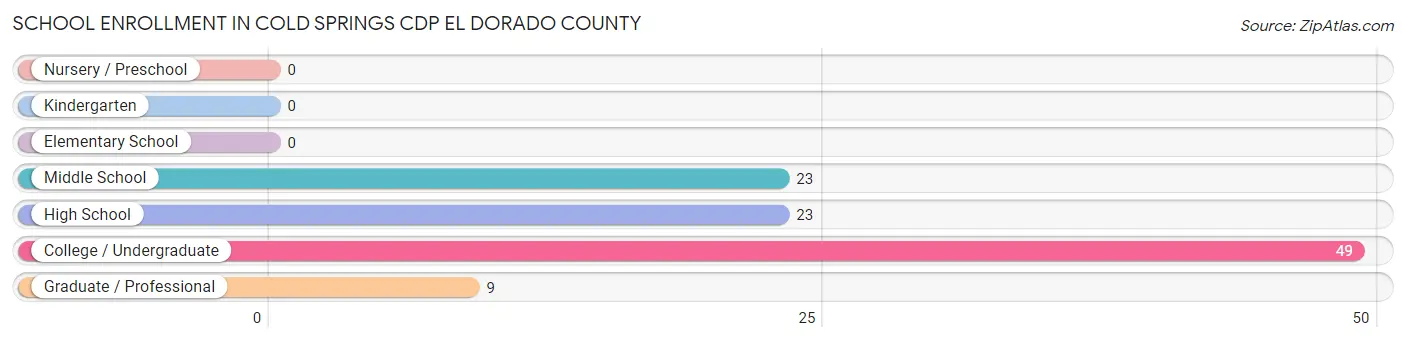
School Enrollment in Cold Springs CDP El Dorado County
The most common levels of schooling among the 104 students in Cold Springs CDP El Dorado County are college / undergraduate (49 | 47.1%), middle school (23 | 22.1%), and high school (23 | 22.1%).
| School Level | # Students | % Students |
| Nursery / Preschool | 0 | 0.0% |
| Kindergarten | 0 | 0.0% |
| Elementary School | 0 | 0.0% |
| Middle School | 23 | 22.1% |
| High School | 23 | 22.1% |
| College / Undergraduate | 49 | 47.1% |
| Graduate / Professional | 9 | 8.6% |
| Total | 104 | 100.0% |
School Enrollment by Age by Funding Source in Cold Springs CDP El Dorado County
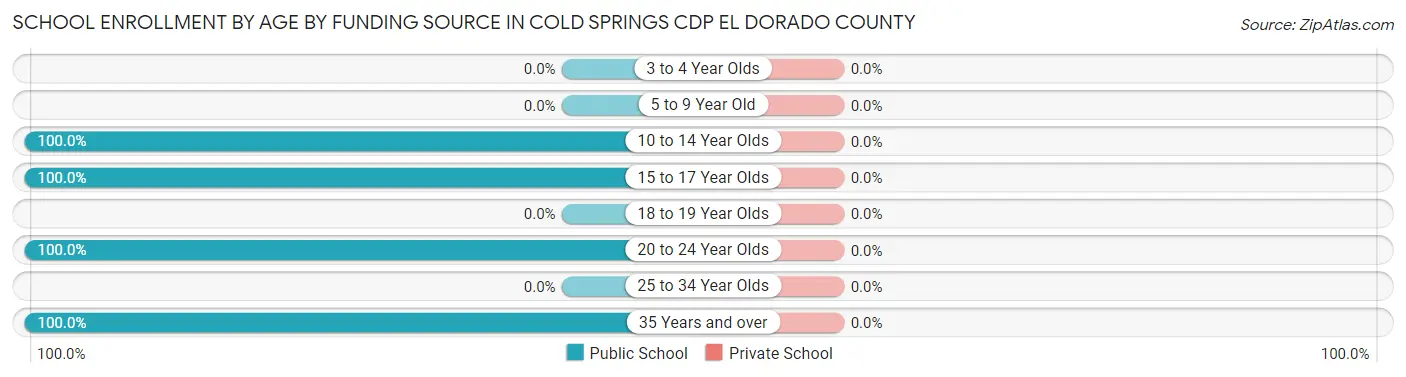
| Age Bracket | Public School | Private School |
| 3 to 4 Year Olds | 0 (0.0%) | 0 (0.0%) |
| 5 to 9 Year Old | 0 (0.0%) | 0 (0.0%) |
| 10 to 14 Year Olds | 38 (100.0%) | 0 (0.0%) |
| 15 to 17 Year Olds | 8 (100.0%) | 0 (0.0%) |
| 18 to 19 Year Olds | 0 (0.0%) | 0 (0.0%) |
| 20 to 24 Year Olds | 39 (100.0%) | 0 (0.0%) |
| 25 to 34 Year Olds | 0 (0.0%) | 0 (0.0%) |
| 35 Years and over | 19 (100.0%) | 0 (0.0%) |
| Total | 104 (100.0%) | 0 (0.0%) |
Educational Attainment by Field of Study in Cold Springs CDP El Dorado County
Business (33 | 30.0%), physical & health sciences (26 | 23.6%), computers & mathematics (24 | 21.8%), liberal arts & history (10 | 9.1%), and engineering (9 | 8.2%) are the most common fields of study among 110 individuals in Cold Springs CDP El Dorado County who have obtained a bachelor's degree or higher.
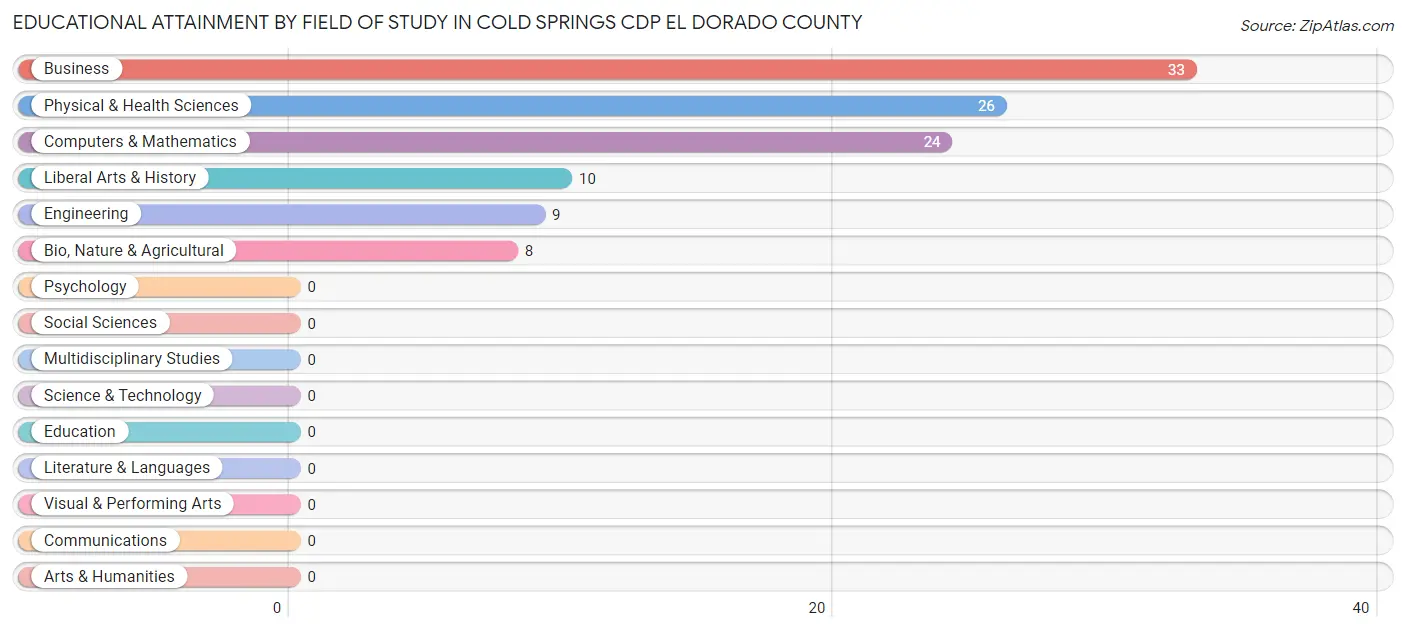
| Field of Study | # Graduates | % Graduates |
| Computers & Mathematics | 24 | 21.8% |
| Bio, Nature & Agricultural | 8 | 7.3% |
| Physical & Health Sciences | 26 | 23.6% |
| Psychology | 0 | 0.0% |
| Social Sciences | 0 | 0.0% |
| Engineering | 9 | 8.2% |
| Multidisciplinary Studies | 0 | 0.0% |
| Science & Technology | 0 | 0.0% |
| Business | 33 | 30.0% |
| Education | 0 | 0.0% |
| Literature & Languages | 0 | 0.0% |
| Liberal Arts & History | 10 | 9.1% |
| Visual & Performing Arts | 0 | 0.0% |
| Communications | 0 | 0.0% |
| Arts & Humanities | 0 | 0.0% |
| Total | 110 | 100.0% |
Transportation & Commute in Cold Springs CDP El Dorado County
Vehicle Availability by Sex in Cold Springs CDP El Dorado County
The most prevalent vehicle ownership categories in Cold Springs CDP El Dorado County are males with 3 vehicles (71, accounting for 46.4%) and females with 3 vehicles (120, making up 34.5%).
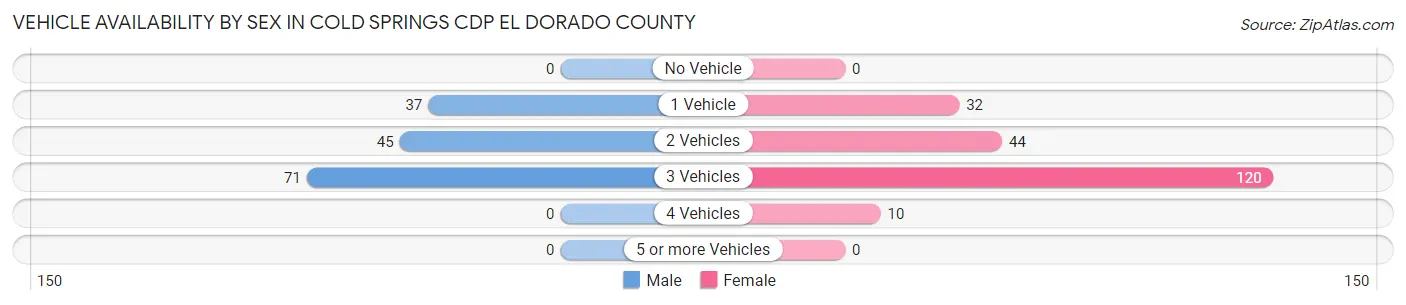
| Vehicles Available | Male | Female |
| No Vehicle | 0 (0.0%) | 0 (0.0%) |
| 1 Vehicle | 37 (24.2%) | 32 (15.5%) |
| 2 Vehicles | 45 (29.4%) | 44 (21.4%) |
| 3 Vehicles | 71 (46.4%) | 120 (58.3%) |
| 4 Vehicles | 0 (0.0%) | 10 (4.9%) |
| 5 or more Vehicles | 0 (0.0%) | 0 (0.0%) |
| Total | 153 (100.0%) | 206 (100.0%) |
Commute Time in Cold Springs CDP El Dorado County
The most frequently occuring commute durations in Cold Springs CDP El Dorado County are 10 to 14 minutes (124 commuters, 44.9%), 15 to 19 minutes (68 commuters, 24.6%), and 45 to 59 minutes (64 commuters, 23.2%).
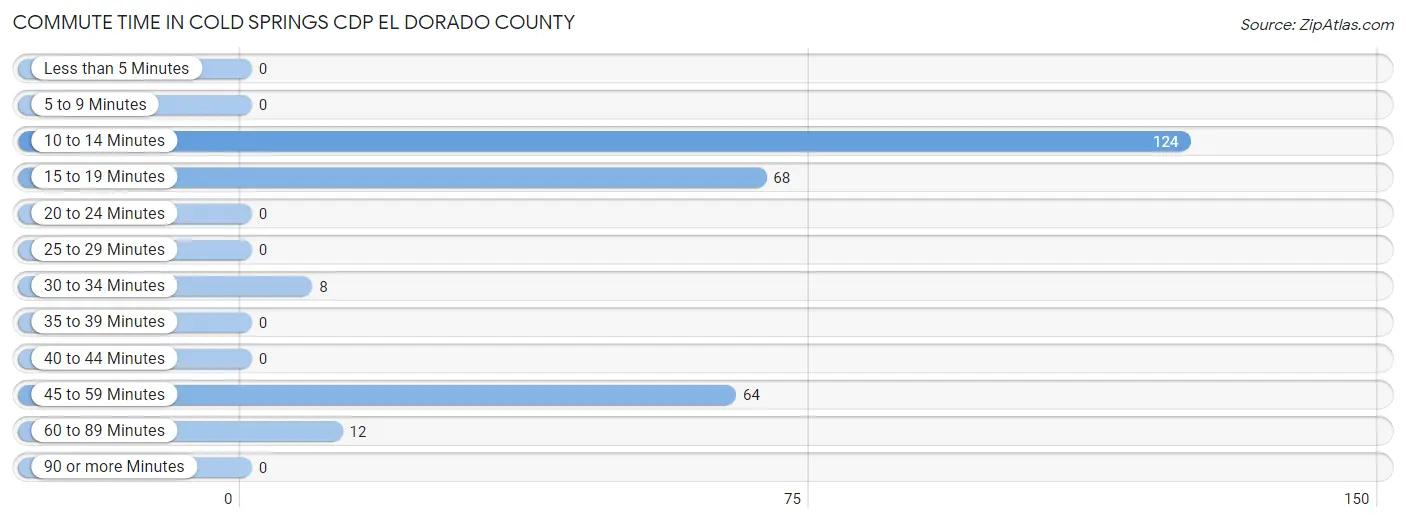
| Commute Time | # Commuters | % Commuters |
| Less than 5 Minutes | 0 | 0.0% |
| 5 to 9 Minutes | 0 | 0.0% |
| 10 to 14 Minutes | 124 | 44.9% |
| 15 to 19 Minutes | 68 | 24.6% |
| 20 to 24 Minutes | 0 | 0.0% |
| 25 to 29 Minutes | 0 | 0.0% |
| 30 to 34 Minutes | 8 | 2.9% |
| 35 to 39 Minutes | 0 | 0.0% |
| 40 to 44 Minutes | 0 | 0.0% |
| 45 to 59 Minutes | 64 | 23.2% |
| 60 to 89 Minutes | 12 | 4.3% |
| 90 or more Minutes | 0 | 0.0% |
Commute Time by Sex in Cold Springs CDP El Dorado County
The most common commute times in Cold Springs CDP El Dorado County are 10 to 14 minutes (38 commuters, 32.2%) for males and 10 to 14 minutes (86 commuters, 54.4%) for females.
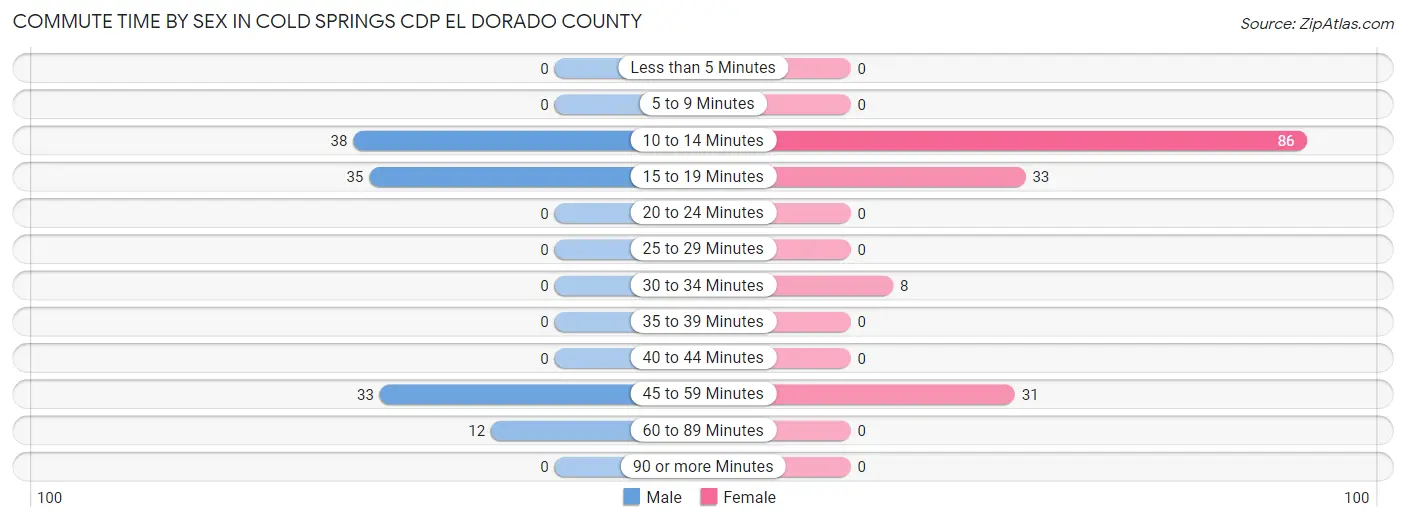
| Commute Time | Male | Female |
| Less than 5 Minutes | 0 (0.0%) | 0 (0.0%) |
| 5 to 9 Minutes | 0 (0.0%) | 0 (0.0%) |
| 10 to 14 Minutes | 38 (32.2%) | 86 (54.4%) |
| 15 to 19 Minutes | 35 (29.7%) | 33 (20.9%) |
| 20 to 24 Minutes | 0 (0.0%) | 0 (0.0%) |
| 25 to 29 Minutes | 0 (0.0%) | 0 (0.0%) |
| 30 to 34 Minutes | 0 (0.0%) | 8 (5.1%) |
| 35 to 39 Minutes | 0 (0.0%) | 0 (0.0%) |
| 40 to 44 Minutes | 0 (0.0%) | 0 (0.0%) |
| 45 to 59 Minutes | 33 (28.0%) | 31 (19.6%) |
| 60 to 89 Minutes | 12 (10.2%) | 0 (0.0%) |
| 90 or more Minutes | 0 (0.0%) | 0 (0.0%) |
Time of Departure to Work by Sex in Cold Springs CDP El Dorado County
The most frequent times of departure to work in Cold Springs CDP El Dorado County are 8:30 AM to 8:59 AM (53, 44.9%) for males and 11:00 AM to 11:59 AM (39, 24.7%) for females.
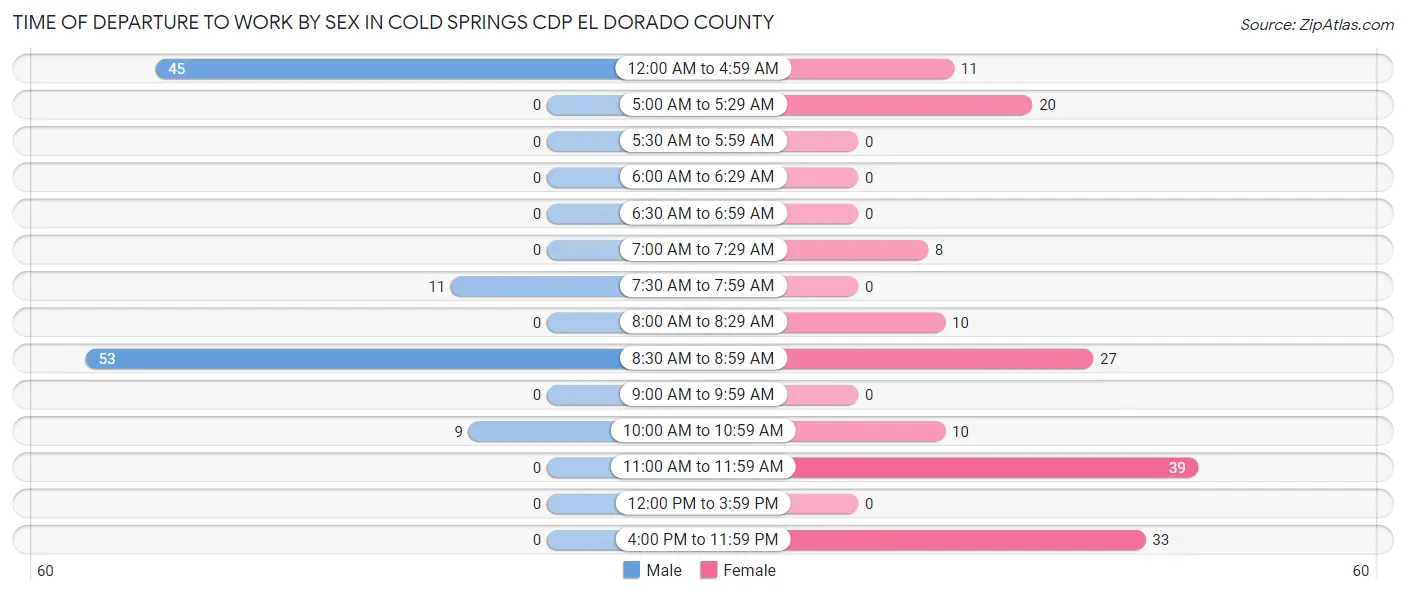
| Time of Departure | Male | Female |
| 12:00 AM to 4:59 AM | 45 (38.1%) | 11 (7.0%) |
| 5:00 AM to 5:29 AM | 0 (0.0%) | 20 (12.7%) |
| 5:30 AM to 5:59 AM | 0 (0.0%) | 0 (0.0%) |
| 6:00 AM to 6:29 AM | 0 (0.0%) | 0 (0.0%) |
| 6:30 AM to 6:59 AM | 0 (0.0%) | 0 (0.0%) |
| 7:00 AM to 7:29 AM | 0 (0.0%) | 8 (5.1%) |
| 7:30 AM to 7:59 AM | 11 (9.3%) | 0 (0.0%) |
| 8:00 AM to 8:29 AM | 0 (0.0%) | 10 (6.3%) |
| 8:30 AM to 8:59 AM | 53 (44.9%) | 27 (17.1%) |
| 9:00 AM to 9:59 AM | 0 (0.0%) | 0 (0.0%) |
| 10:00 AM to 10:59 AM | 9 (7.6%) | 10 (6.3%) |
| 11:00 AM to 11:59 AM | 0 (0.0%) | 39 (24.7%) |
| 12:00 PM to 3:59 PM | 0 (0.0%) | 0 (0.0%) |
| 4:00 PM to 11:59 PM | 0 (0.0%) | 33 (20.9%) |
| Total | 118 (100.0%) | 158 (100.0%) |
Housing Occupancy in Cold Springs CDP El Dorado County
Occupancy by Ownership in Cold Springs CDP El Dorado County
Of the total 251 dwellings in Cold Springs CDP El Dorado County, owner-occupied units account for 218 (86.9%), while renter-occupied units make up 33 (13.2%).
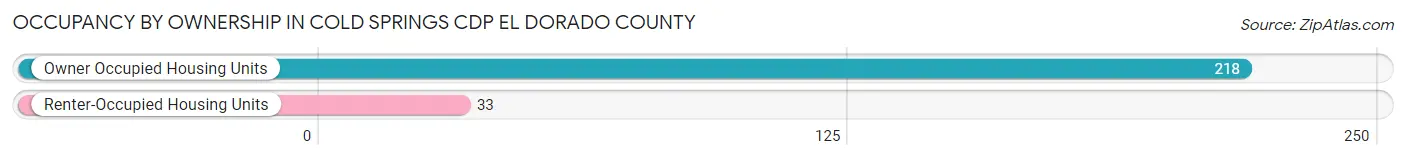
| Occupancy | # Housing Units | % Housing Units |
| Owner Occupied Housing Units | 218 | 86.9% |
| Renter-Occupied Housing Units | 33 | 13.2% |
| Total Occupied Housing Units | 251 | 100.0% |
Occupancy by Household Size in Cold Springs CDP El Dorado County
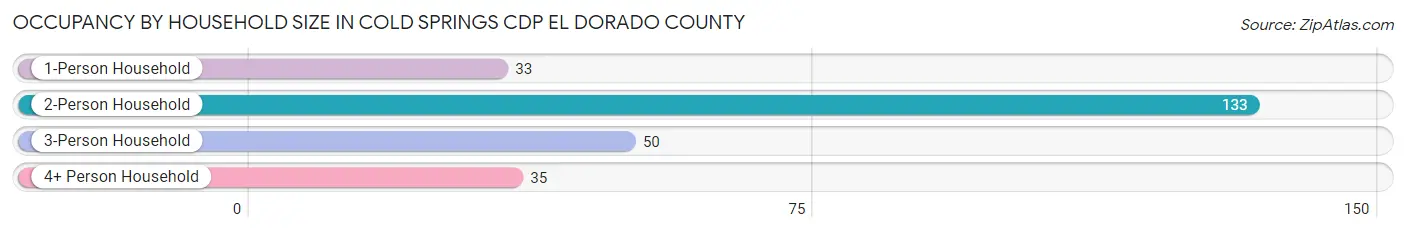
| Household Size | # Housing Units | % Housing Units |
| 1-Person Household | 33 | 13.2% |
| 2-Person Household | 133 | 53.0% |
| 3-Person Household | 50 | 19.9% |
| 4+ Person Household | 35 | 13.9% |
| Total Housing Units | 251 | 100.0% |
Occupancy by Ownership by Household Size in Cold Springs CDP El Dorado County
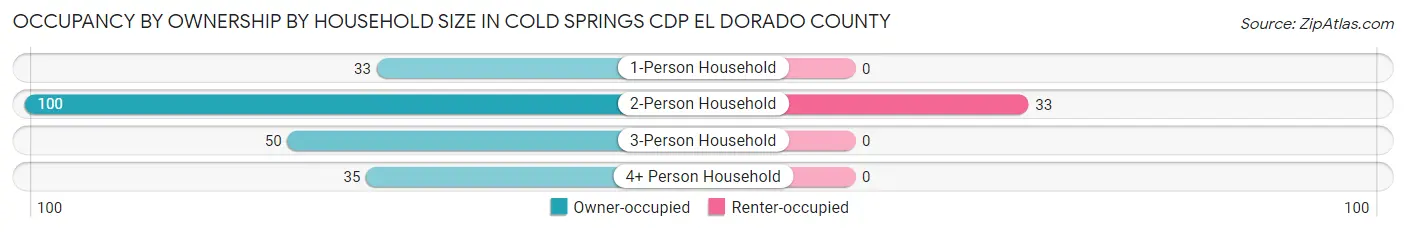
| Household Size | Owner-occupied | Renter-occupied |
| 1-Person Household | 33 (100.0%) | 0 (0.0%) |
| 2-Person Household | 100 (75.2%) | 33 (24.8%) |
| 3-Person Household | 50 (100.0%) | 0 (0.0%) |
| 4+ Person Household | 35 (100.0%) | 0 (0.0%) |
| Total Housing Units | 218 (86.9%) | 33 (13.2%) |
Occupancy by Educational Attainment in Cold Springs CDP El Dorado County
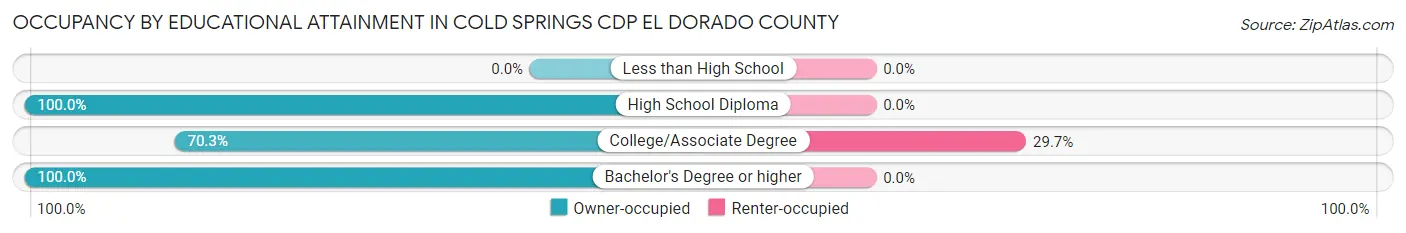
| Household Size | Owner-occupied | Renter-occupied |
| Less than High School | 0 (0.0%) | 0 (0.0%) |
| High School Diploma | 46 (100.0%) | 0 (0.0%) |
| College/Associate Degree | 78 (70.3%) | 33 (29.7%) |
| Bachelor's Degree or higher | 94 (100.0%) | 0 (0.0%) |
Occupancy by Age of Householder in Cold Springs CDP El Dorado County
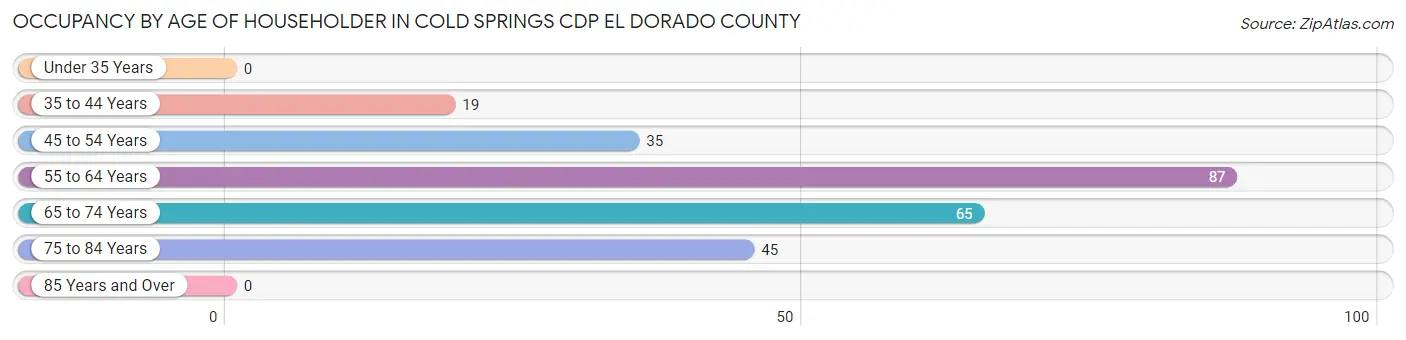
| Age Bracket | # Households | % Households |
| Under 35 Years | 0 | 0.0% |
| 35 to 44 Years | 19 | 7.6% |
| 45 to 54 Years | 35 | 13.9% |
| 55 to 64 Years | 87 | 34.7% |
| 65 to 74 Years | 65 | 25.9% |
| 75 to 84 Years | 45 | 17.9% |
| 85 Years and Over | 0 | 0.0% |
| Total | 251 | 100.0% |
Housing Finances in Cold Springs CDP El Dorado County
Median Income by Occupancy in Cold Springs CDP El Dorado County
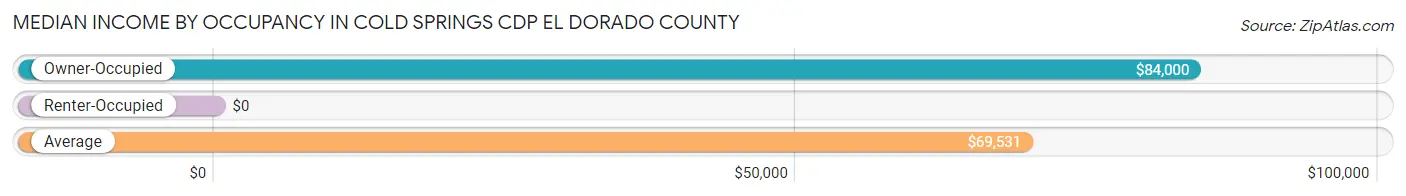
| Occupancy Type | # Households | Median Income |
| Owner-Occupied | 218 (86.9%) | $84,000 |
| Renter-Occupied | 33 (13.2%) | $0 |
| Average | 251 (100.0%) | $69,531 |
Occupancy by Householder Income Bracket in Cold Springs CDP El Dorado County
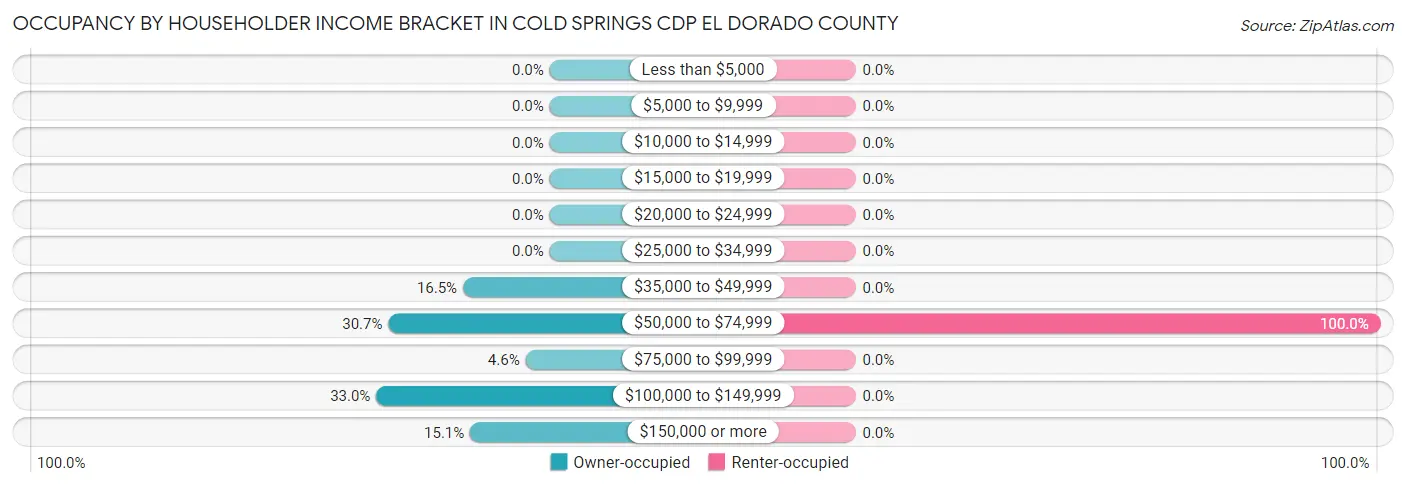
| Income Bracket | Owner-occupied | Renter-occupied |
| Less than $5,000 | 0 (0.0%) | 0 (0.0%) |
| $5,000 to $9,999 | 0 (0.0%) | 0 (0.0%) |
| $10,000 to $14,999 | 0 (0.0%) | 0 (0.0%) |
| $15,000 to $19,999 | 0 (0.0%) | 0 (0.0%) |
| $20,000 to $24,999 | 0 (0.0%) | 0 (0.0%) |
| $25,000 to $34,999 | 0 (0.0%) | 0 (0.0%) |
| $35,000 to $49,999 | 36 (16.5%) | 0 (0.0%) |
| $50,000 to $74,999 | 67 (30.7%) | 33 (100.0%) |
| $75,000 to $99,999 | 10 (4.6%) | 0 (0.0%) |
| $100,000 to $149,999 | 72 (33.0%) | 0 (0.0%) |
| $150,000 or more | 33 (15.1%) | 0 (0.0%) |
| Total | 218 (100.0%) | 33 (100.0%) |
Monthly Housing Cost Tiers in Cold Springs CDP El Dorado County
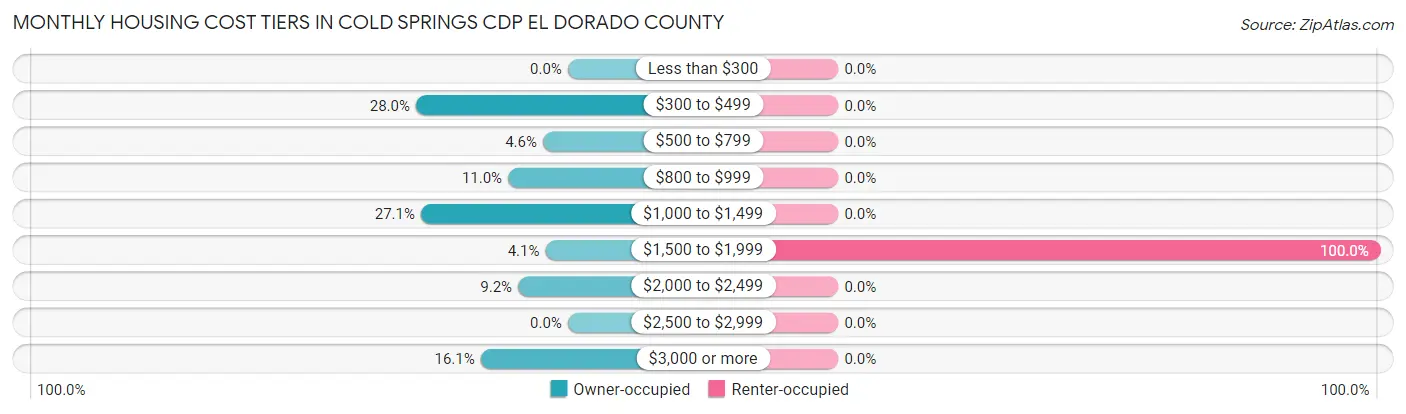
| Monthly Cost | Owner-occupied | Renter-occupied |
| Less than $300 | 0 (0.0%) | 0 (0.0%) |
| $300 to $499 | 61 (28.0%) | 0 (0.0%) |
| $500 to $799 | 10 (4.6%) | 0 (0.0%) |
| $800 to $999 | 24 (11.0%) | 0 (0.0%) |
| $1,000 to $1,499 | 59 (27.1%) | 0 (0.0%) |
| $1,500 to $1,999 | 9 (4.1%) | 33 (100.0%) |
| $2,000 to $2,499 | 20 (9.2%) | 0 (0.0%) |
| $2,500 to $2,999 | 0 (0.0%) | 0 (0.0%) |
| $3,000 or more | 35 (16.1%) | 0 (0.0%) |
| Total | 218 (100.0%) | 33 (100.0%) |
Physical Housing Characteristics in Cold Springs CDP El Dorado County
Housing Structures in Cold Springs CDP El Dorado County
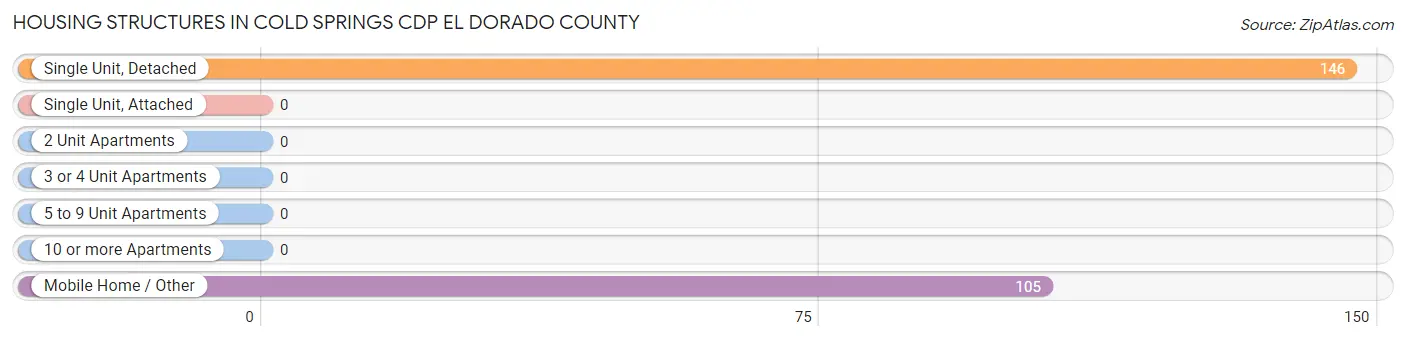
| Structure Type | # Housing Units | % Housing Units |
| Single Unit, Detached | 146 | 58.2% |
| Single Unit, Attached | 0 | 0.0% |
| 2 Unit Apartments | 0 | 0.0% |
| 3 or 4 Unit Apartments | 0 | 0.0% |
| 5 to 9 Unit Apartments | 0 | 0.0% |
| 10 or more Apartments | 0 | 0.0% |
| Mobile Home / Other | 105 | 41.8% |
| Total | 251 | 100.0% |
Housing Structures by Occupancy in Cold Springs CDP El Dorado County
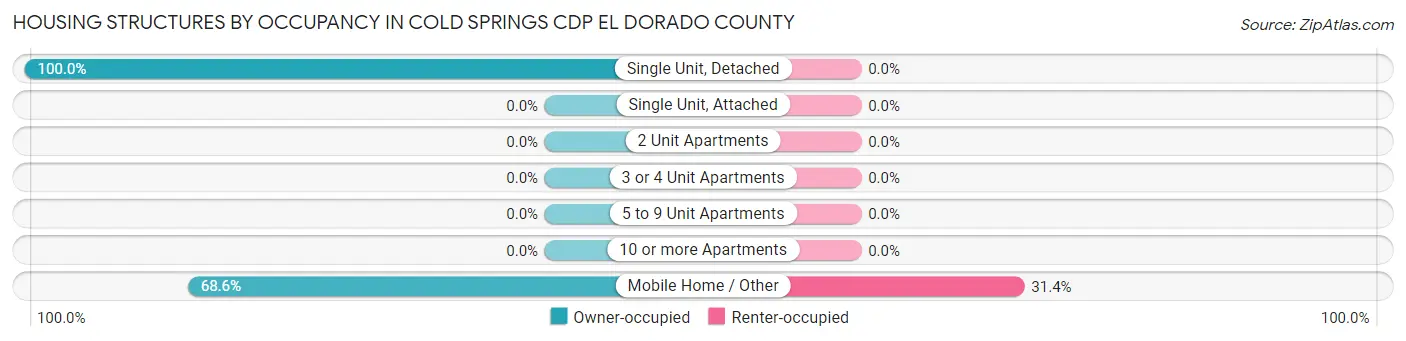
| Structure Type | Owner-occupied | Renter-occupied |
| Single Unit, Detached | 146 (100.0%) | 0 (0.0%) |
| Single Unit, Attached | 0 (0.0%) | 0 (0.0%) |
| 2 Unit Apartments | 0 (0.0%) | 0 (0.0%) |
| 3 or 4 Unit Apartments | 0 (0.0%) | 0 (0.0%) |
| 5 to 9 Unit Apartments | 0 (0.0%) | 0 (0.0%) |
| 10 or more Apartments | 0 (0.0%) | 0 (0.0%) |
| Mobile Home / Other | 72 (68.6%) | 33 (31.4%) |
| Total | 218 (86.9%) | 33 (13.2%) |
Housing Structures by Number of Rooms in Cold Springs CDP El Dorado County
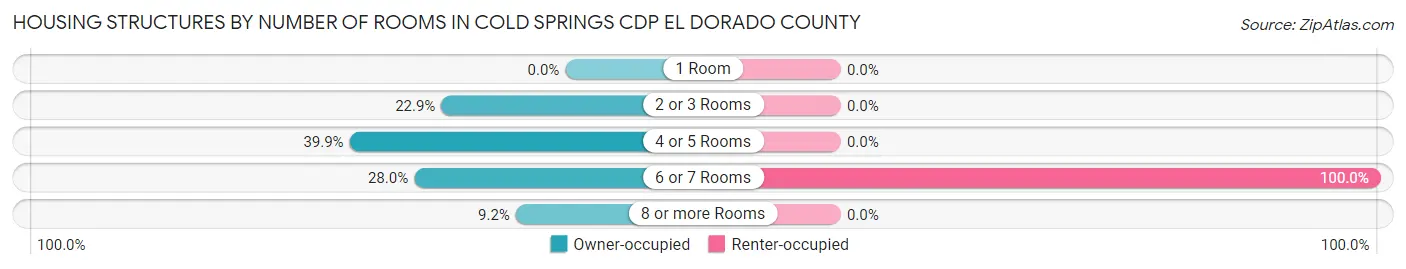
| Number of Rooms | Owner-occupied | Renter-occupied |
| 1 Room | 0 (0.0%) | 0 (0.0%) |
| 2 or 3 Rooms | 50 (22.9%) | 0 (0.0%) |
| 4 or 5 Rooms | 87 (39.9%) | 0 (0.0%) |
| 6 or 7 Rooms | 61 (28.0%) | 33 (100.0%) |
| 8 or more Rooms | 20 (9.2%) | 0 (0.0%) |
| Total | 218 (100.0%) | 33 (100.0%) |
Housing Structure by Heating Type in Cold Springs CDP El Dorado County
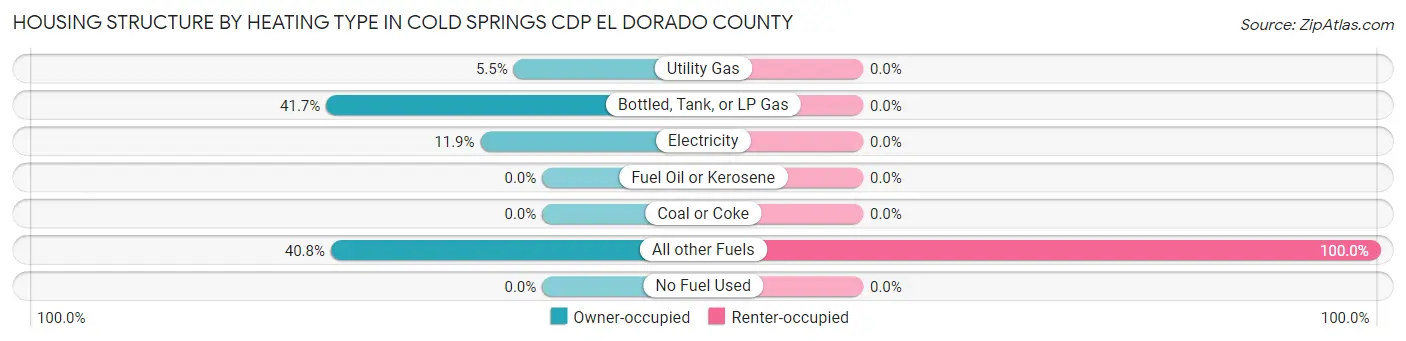
| Heating Type | Owner-occupied | Renter-occupied |
| Utility Gas | 12 (5.5%) | 0 (0.0%) |
| Bottled, Tank, or LP Gas | 91 (41.7%) | 0 (0.0%) |
| Electricity | 26 (11.9%) | 0 (0.0%) |
| Fuel Oil or Kerosene | 0 (0.0%) | 0 (0.0%) |
| Coal or Coke | 0 (0.0%) | 0 (0.0%) |
| All other Fuels | 89 (40.8%) | 33 (100.0%) |
| No Fuel Used | 0 (0.0%) | 0 (0.0%) |
| Total | 218 (100.0%) | 33 (100.0%) |
Household Vehicle Usage in Cold Springs CDP El Dorado County
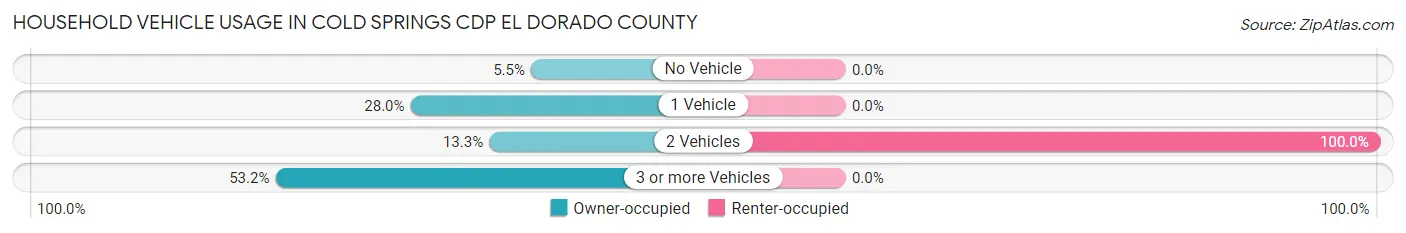
| Vehicles per Household | Owner-occupied | Renter-occupied |
| No Vehicle | 12 (5.5%) | 0 (0.0%) |
| 1 Vehicle | 61 (28.0%) | 0 (0.0%) |
| 2 Vehicles | 29 (13.3%) | 33 (100.0%) |
| 3 or more Vehicles | 116 (53.2%) | 0 (0.0%) |
| Total | 218 (100.0%) | 33 (100.0%) |
Real Estate & Mortgages in Cold Springs CDP El Dorado County
Real Estate and Mortgage Overview in Cold Springs CDP El Dorado County
| Characteristic | Without Mortgage | With Mortgage |
| Housing Units | 128 | 90 |
| Median Property Value | - | - |
| Median Household Income | $69,524 | $9 |
| Monthly Housing Costs | - | - |
| Real Estate Taxes | $199 | $11 |
Property Value by Mortgage Status in Cold Springs CDP El Dorado County
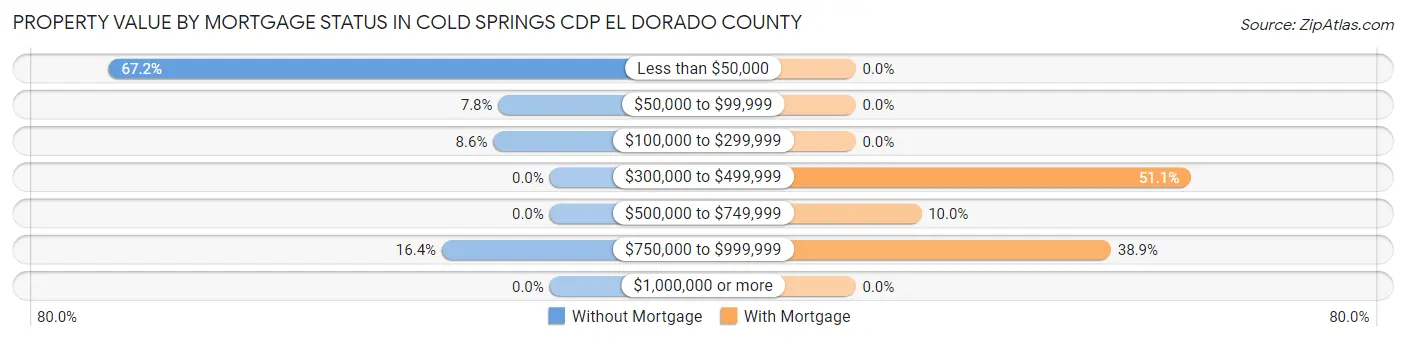
| Property Value | Without Mortgage | With Mortgage |
| Less than $50,000 | 86 (67.2%) | 0 (0.0%) |
| $50,000 to $99,999 | 10 (7.8%) | 0 (0.0%) |
| $100,000 to $299,999 | 11 (8.6%) | 0 (0.0%) |
| $300,000 to $499,999 | 0 (0.0%) | 46 (51.1%) |
| $500,000 to $749,999 | 0 (0.0%) | 9 (10.0%) |
| $750,000 to $999,999 | 21 (16.4%) | 35 (38.9%) |
| $1,000,000 or more | 0 (0.0%) | 0 (0.0%) |
| Total | 128 (100.0%) | 90 (100.0%) |
Household Income by Mortgage Status in Cold Springs CDP El Dorado County
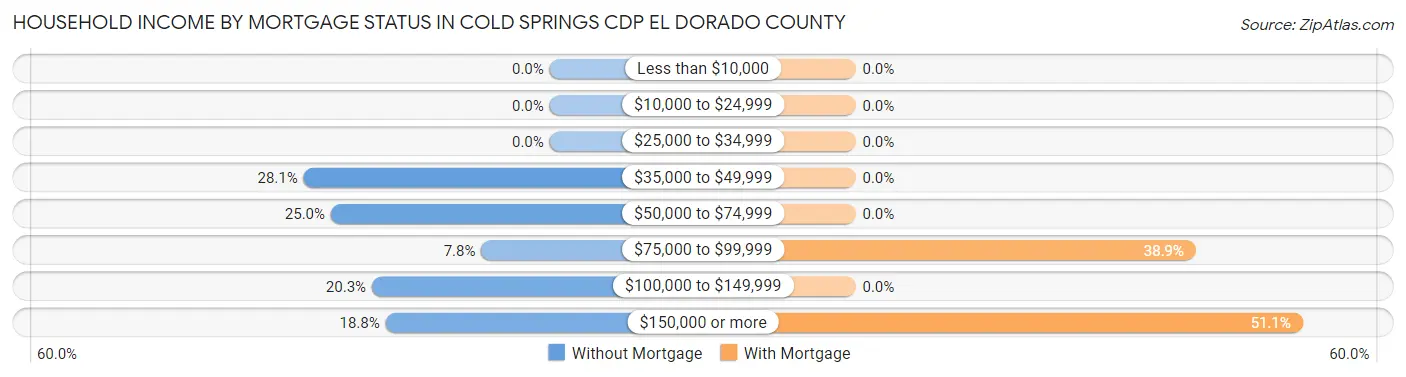
| Household Income | Without Mortgage | With Mortgage |
| Less than $10,000 | 0 (0.0%) | 0 (0.0%) |
| $10,000 to $24,999 | 0 (0.0%) | 0 (0.0%) |
| $25,000 to $34,999 | 0 (0.0%) | 0 (0.0%) |
| $35,000 to $49,999 | 36 (28.1%) | 0 (0.0%) |
| $50,000 to $74,999 | 32 (25.0%) | 0 (0.0%) |
| $75,000 to $99,999 | 10 (7.8%) | 35 (38.9%) |
| $100,000 to $149,999 | 26 (20.3%) | 0 (0.0%) |
| $150,000 or more | 24 (18.8%) | 46 (51.1%) |
| Total | 128 (100.0%) | 90 (100.0%) |
Property Value to Household Income Ratio in Cold Springs CDP El Dorado County
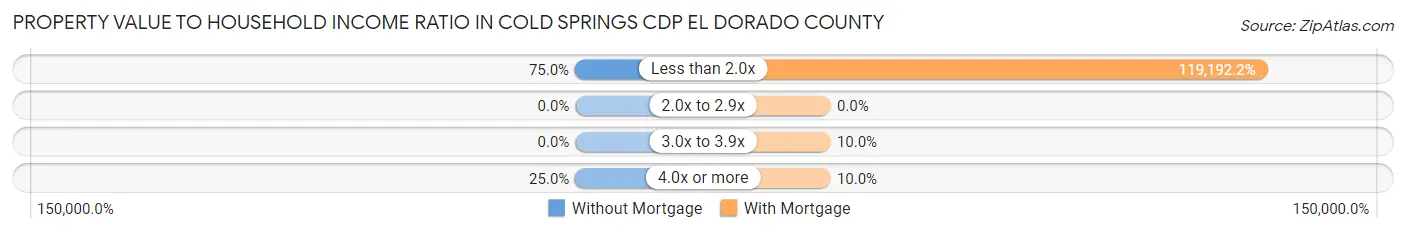
| Value-to-Income Ratio | Without Mortgage | With Mortgage |
| Less than 2.0x | 96 (75.0%) | 107,273 (119,192.2%) |
| 2.0x to 2.9x | 0 (0.0%) | 0 (0.0%) |
| 3.0x to 3.9x | 0 (0.0%) | 9 (10.0%) |
| 4.0x or more | 32 (25.0%) | 9 (10.0%) |
| Total | 128 (100.0%) | 90 (100.0%) |
Real Estate Taxes by Mortgage Status in Cold Springs CDP El Dorado County
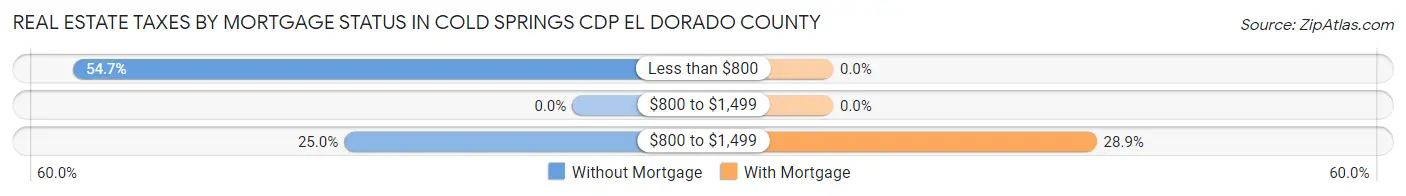
| Property Taxes | Without Mortgage | With Mortgage |
| Less than $800 | 70 (54.7%) | 0 (0.0%) |
| $800 to $1,499 | 0 (0.0%) | 0 (0.0%) |
| $800 to $1,499 | 32 (25.0%) | 26 (28.9%) |
| Total | 128 (100.0%) | 90 (100.0%) |
Health & Disability in Cold Springs CDP El Dorado County
Health Insurance Coverage by Age in Cold Springs CDP El Dorado County
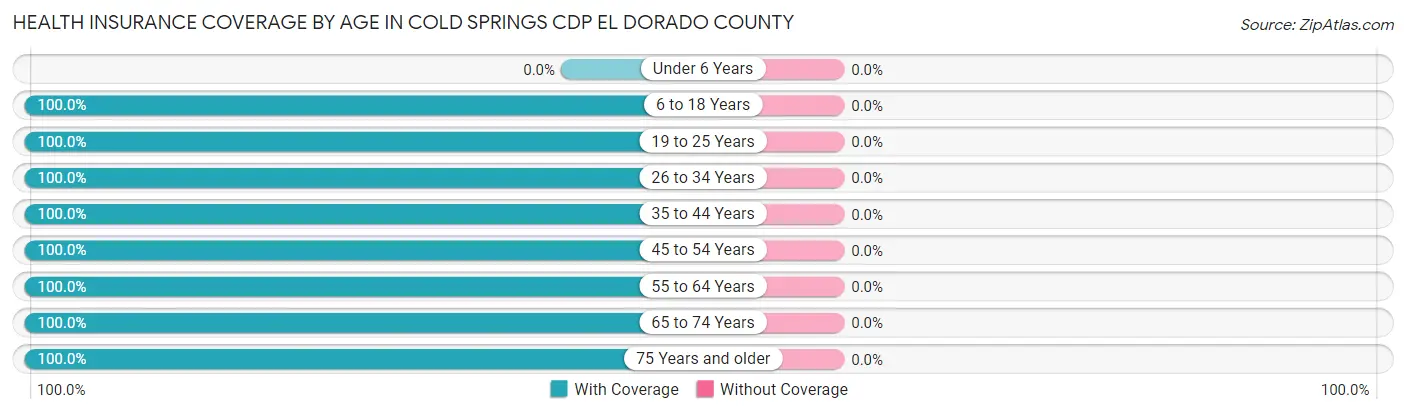
| Age Bracket | With Coverage | Without Coverage |
| Under 6 Years | 0 (0.0%) | 0 (0.0%) |
| 6 to 18 Years | 46 (100.0%) | 0 (0.0%) |
| 19 to 25 Years | 39 (100.0%) | 0 (0.0%) |
| 26 to 34 Years | 8 (100.0%) | 0 (0.0%) |
| 35 to 44 Years | 28 (100.0%) | 0 (0.0%) |
| 45 to 54 Years | 143 (100.0%) | 0 (0.0%) |
| 55 to 64 Years | 178 (100.0%) | 0 (0.0%) |
| 65 to 74 Years | 102 (100.0%) | 0 (0.0%) |
| 75 Years and older | 68 (100.0%) | 0 (0.0%) |
| Total | 612 (100.0%) | 0 (0.0%) |
Health Insurance Coverage by Citizenship Status in Cold Springs CDP El Dorado County
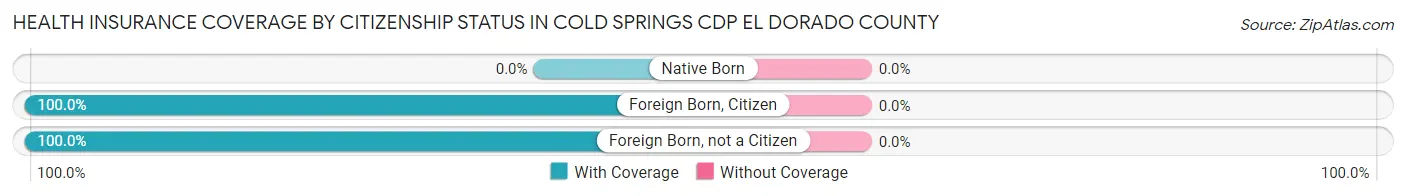
| Citizenship Status | With Coverage | Without Coverage |
| Native Born | 0 (0.0%) | 0 (0.0%) |
| Foreign Born, Citizen | 46 (100.0%) | 0 (0.0%) |
| Foreign Born, not a Citizen | 39 (100.0%) | 0 (0.0%) |
Health Insurance Coverage by Household Income in Cold Springs CDP El Dorado County
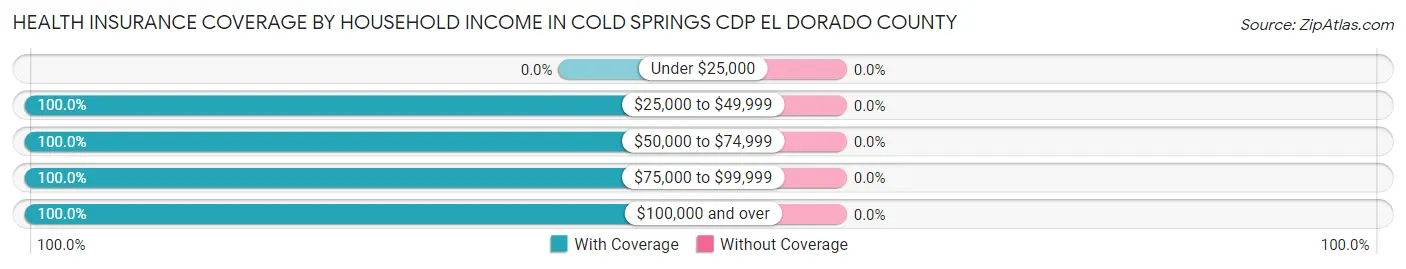
| Household Income | With Coverage | Without Coverage |
| Under $25,000 | 0 (0.0%) | 0 (0.0%) |
| $25,000 to $49,999 | 64 (100.0%) | 0 (0.0%) |
| $50,000 to $74,999 | 218 (100.0%) | 0 (0.0%) |
| $75,000 to $99,999 | 10 (100.0%) | 0 (0.0%) |
| $100,000 and over | 320 (100.0%) | 0 (0.0%) |
Public vs Private Health Insurance Coverage by Age in Cold Springs CDP El Dorado County
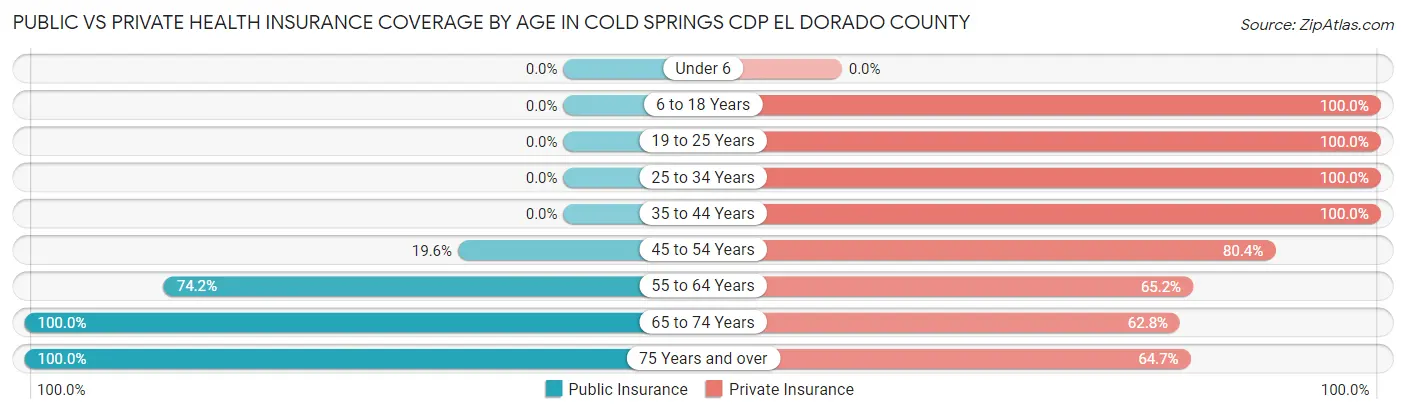
| Age Bracket | Public Insurance | Private Insurance |
| Under 6 | 0 (0.0%) | 0 (0.0%) |
| 6 to 18 Years | 0 (0.0%) | 46 (100.0%) |
| 19 to 25 Years | 0 (0.0%) | 39 (100.0%) |
| 25 to 34 Years | 0 (0.0%) | 8 (100.0%) |
| 35 to 44 Years | 0 (0.0%) | 28 (100.0%) |
| 45 to 54 Years | 28 (19.6%) | 115 (80.4%) |
| 55 to 64 Years | 132 (74.2%) | 116 (65.2%) |
| 65 to 74 Years | 102 (100.0%) | 64 (62.7%) |
| 75 Years and over | 68 (100.0%) | 44 (64.7%) |
| Total | 330 (53.9%) | 460 (75.2%) |
Disability Status by Sex by Age in Cold Springs CDP El Dorado County
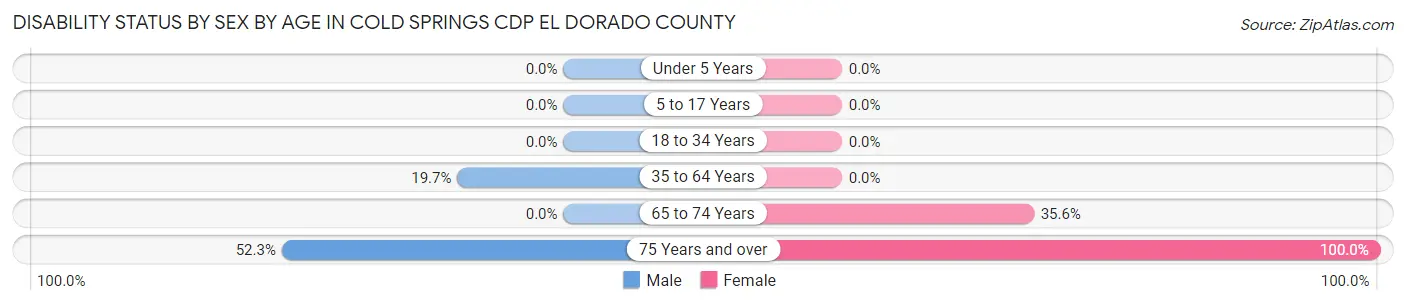
| Age Bracket | Male | Female |
| Under 5 Years | 0 (0.0%) | 0 (0.0%) |
| 5 to 17 Years | 0 (0.0%) | 0 (0.0%) |
| 18 to 34 Years | 0 (0.0%) | 0 (0.0%) |
| 35 to 64 Years | 37 (19.7%) | 0 (0.0%) |
| 65 to 74 Years | 0 (0.0%) | 26 (35.6%) |
| 75 Years and over | 23 (52.3%) | 24 (100.0%) |
Disability Class by Sex by Age in Cold Springs CDP El Dorado County
Disability Class: Hearing Difficulty
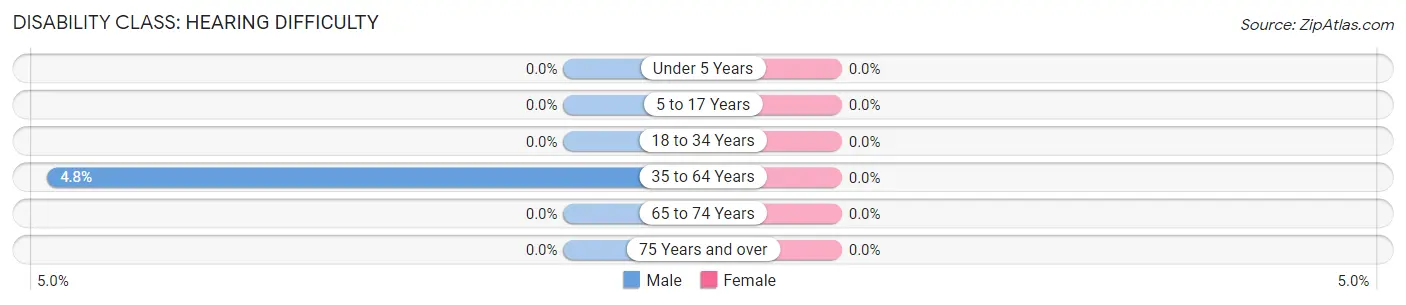
| Age Bracket | Male | Female |
| Under 5 Years | 0 (0.0%) | 0 (0.0%) |
| 5 to 17 Years | 0 (0.0%) | 0 (0.0%) |
| 18 to 34 Years | 0 (0.0%) | 0 (0.0%) |
| 35 to 64 Years | 9 (4.8%) | 0 (0.0%) |
| 65 to 74 Years | 0 (0.0%) | 0 (0.0%) |
| 75 Years and over | 0 (0.0%) | 0 (0.0%) |
Disability Class: Vision Difficulty
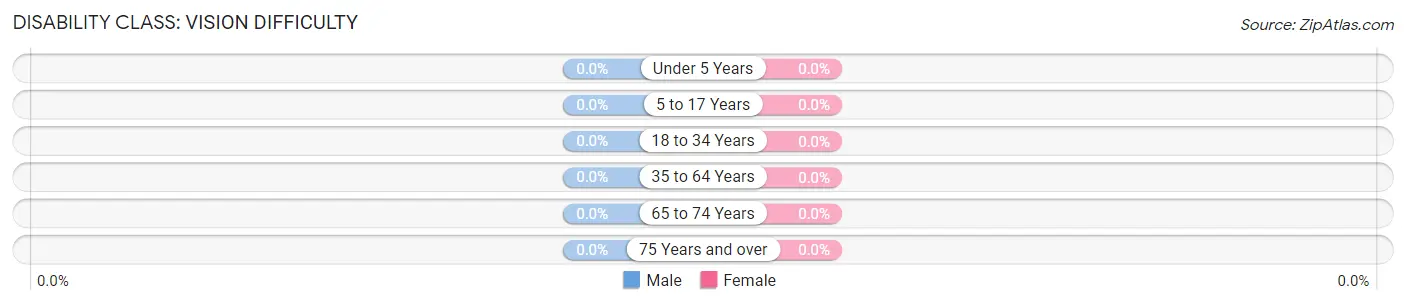
| Age Bracket | Male | Female |
| Under 5 Years | 0 (0.0%) | 0 (0.0%) |
| 5 to 17 Years | 0 (0.0%) | 0 (0.0%) |
| 18 to 34 Years | 0 (0.0%) | 0 (0.0%) |
| 35 to 64 Years | 0 (0.0%) | 0 (0.0%) |
| 65 to 74 Years | 0 (0.0%) | 0 (0.0%) |
| 75 Years and over | 0 (0.0%) | 0 (0.0%) |
Disability Class: Cognitive Difficulty
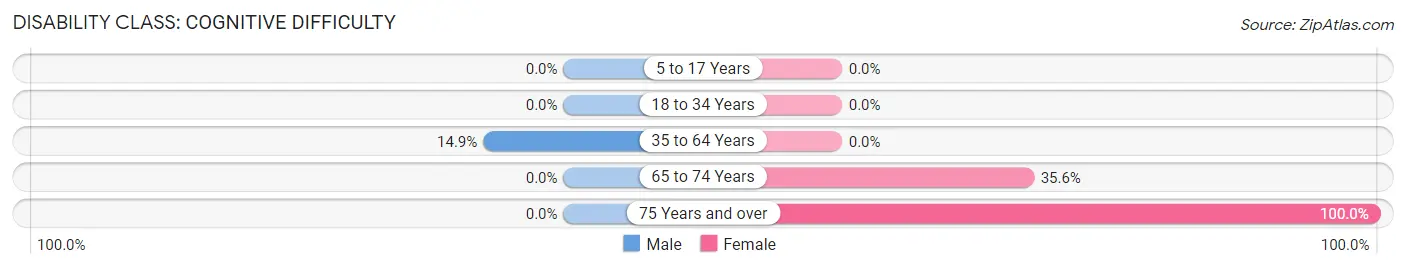
| Age Bracket | Male | Female |
| 5 to 17 Years | 0 (0.0%) | 0 (0.0%) |
| 18 to 34 Years | 0 (0.0%) | 0 (0.0%) |
| 35 to 64 Years | 28 (14.9%) | 0 (0.0%) |
| 65 to 74 Years | 0 (0.0%) | 26 (35.6%) |
| 75 Years and over | 0 (0.0%) | 24 (100.0%) |
Disability Class: Ambulatory Difficulty
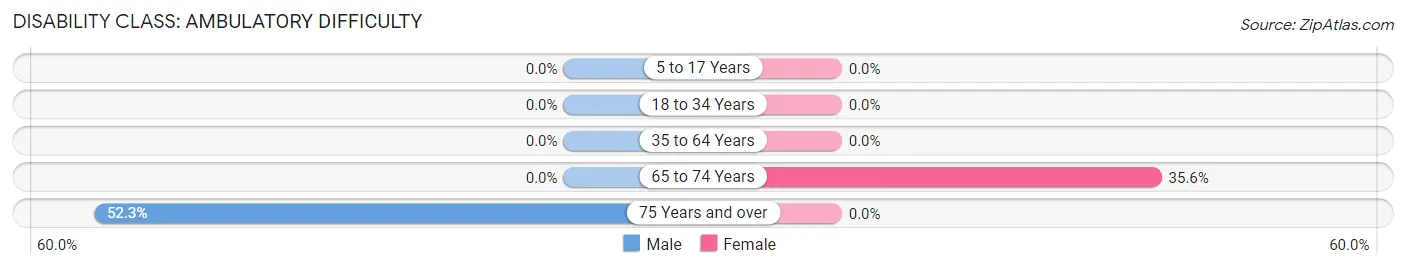
| Age Bracket | Male | Female |
| 5 to 17 Years | 0 (0.0%) | 0 (0.0%) |
| 18 to 34 Years | 0 (0.0%) | 0 (0.0%) |
| 35 to 64 Years | 0 (0.0%) | 0 (0.0%) |
| 65 to 74 Years | 0 (0.0%) | 26 (35.6%) |
| 75 Years and over | 23 (52.3%) | 0 (0.0%) |
Disability Class: Self-Care Difficulty
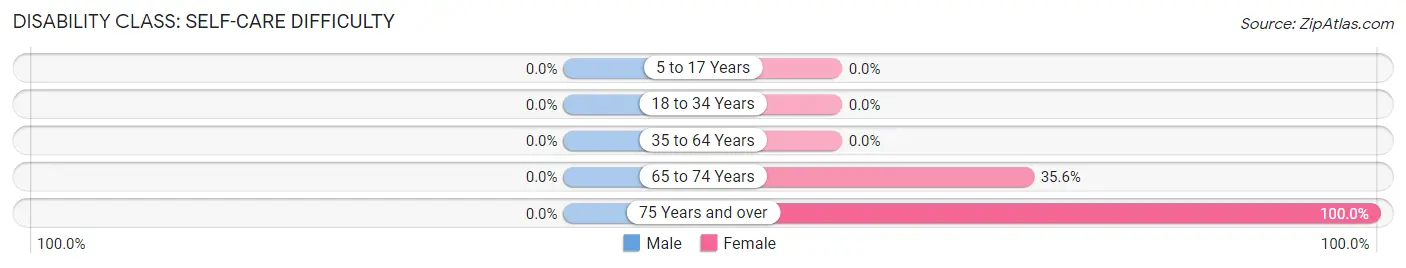
| Age Bracket | Male | Female |
| 5 to 17 Years | 0 (0.0%) | 0 (0.0%) |
| 18 to 34 Years | 0 (0.0%) | 0 (0.0%) |
| 35 to 64 Years | 0 (0.0%) | 0 (0.0%) |
| 65 to 74 Years | 0 (0.0%) | 26 (35.6%) |
| 75 Years and over | 0 (0.0%) | 24 (100.0%) |
Technology Access in Cold Springs CDP El Dorado County
Computing Device Access in Cold Springs CDP El Dorado County
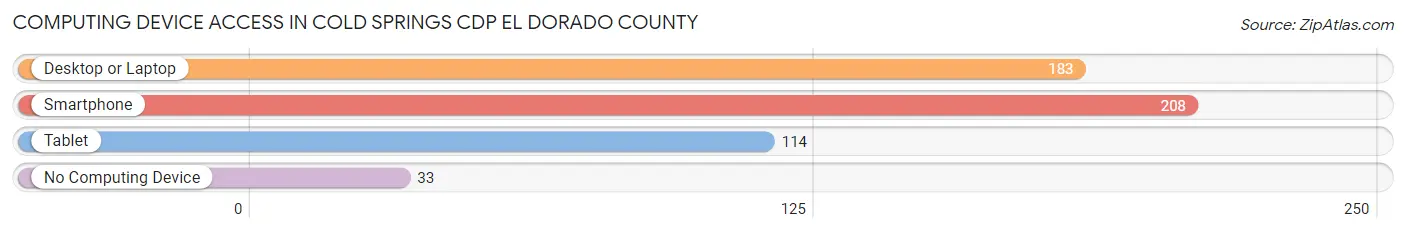
| Device Type | # Households | % Households |
| Desktop or Laptop | 183 | 72.9% |
| Smartphone | 208 | 82.9% |
| Tablet | 114 | 45.4% |
| No Computing Device | 33 | 13.2% |
| Total | 251 | 100.0% |
Internet Access in Cold Springs CDP El Dorado County
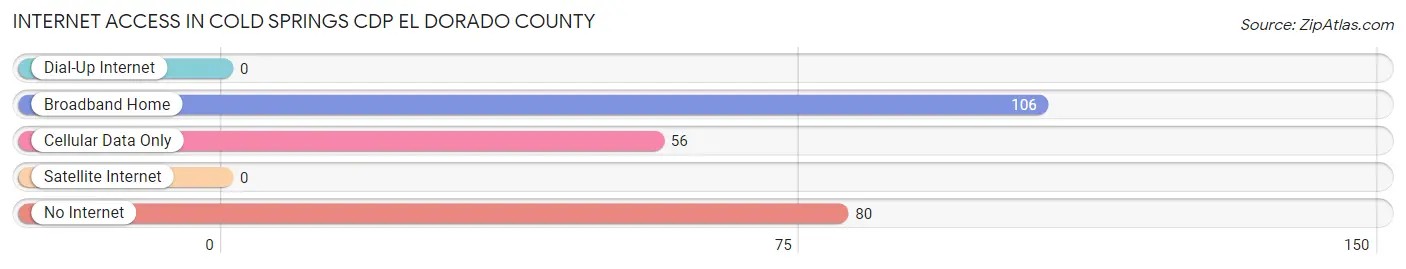
| Internet Type | # Households | % Households |
| Dial-Up Internet | 0 | 0.0% |
| Broadband Home | 106 | 42.2% |
| Cellular Data Only | 56 | 22.3% |
| Satellite Internet | 0 | 0.0% |
| No Internet | 80 | 31.9% |
| Total | 251 | 100.0% |
Cold Springs CDP El Dorado County Summary
Introduction
Cold Springs Cdp is a census-designated place (CDP) located in El Dorado County, California. It is situated in the foothills of the Sierra Nevada Mountains, approximately 25 miles east of Sacramento. The population of Cold Springs Cdp was 1,845 at the 2010 census. The CDP is located in the foothills of the Sierra Nevada Mountains, and is surrounded by the communities of Placerville, Camino, and Pollock Pines.
History
The area now known as Cold Springs Cdp was originally inhabited by the Miwok and Maidu Native American tribes. The first European settlers arrived in the area in the early 1850s, and the town of Cold Springs was established in 1854. The town was named after the cold springs that were located in the area.
The town of Cold Springs was a popular destination for miners during the California Gold Rush. The town was also home to a number of businesses, including a hotel, saloon, and general store.
In the late 19th century, the town of Cold Springs began to decline as the gold rush ended and the population moved away. The town was eventually abandoned in the early 20th century.
Geography
Cold Springs Cdp is located in El Dorado County, California. It is situated in the foothills of the Sierra Nevada Mountains, approximately 25 miles east of Sacramento. The CDP has a total area of 4.3 square miles, all of which is land.
The terrain of Cold Springs Cdp is mostly mountainous, with elevations ranging from 1,000 to 2,000 feet. The area is heavily forested, with oak, pine, and cedar trees.
Economy
The economy of Cold Springs Cdp is largely based on tourism and recreation. The area is home to a number of outdoor activities, including hiking, camping, fishing, and hunting. The area is also home to a number of wineries and vineyards.
Demographics
As of the 2010 census, the population of Cold Springs Cdp was 1,845. The racial makeup of the CDP was 91.2% White, 0.7% African American, 0.7% Native American, 0.7% Asian, 0.2% Pacific Islander, 4.2% from other races, and 2.1% from two or more races. Hispanic or Latino of any race were 8.2% of the population.
The median household income in Cold Springs Cdp was $50,938, and the median family income was $58,750. The per capita income for the CDP was $25,945.
Conclusion
Cold Springs Cdp is a census-designated place located in El Dorado County, California. It is situated in the foothills of the Sierra Nevada Mountains, approximately 25 miles east of Sacramento. The population of Cold Springs Cdp was 1,845 at the 2010 census. The economy of Cold Springs Cdp is largely based on tourism and recreation, and the area is home to a number of outdoor activities. The racial makeup of the CDP was 91.2% White, 0.7% African American, 0.7% Native American, 0.7% Asian, 0.2% Pacific Islander, 4.2% from other races, and 2.1% from two or more races. The median household income in Cold Springs Cdp was $50,938, and the median family income was $58,750.
Common Questions
What is Per Capita Income in Cold Springs CDP El Dorado County?
Per Capita income in Cold Springs CDP El Dorado County is $40,821.
What is the Median Family Income in Cold Springs CDP El Dorado County?
Median Family Income in Cold Springs CDP El Dorado County is $105,541.
What is the Median Household income in Cold Springs CDP El Dorado County?
Median Household Income in Cold Springs CDP El Dorado County is $69,531.
What is Inequality or Gini Index in Cold Springs CDP El Dorado County?
Inequality or Gini Index in Cold Springs CDP El Dorado County is 0.32.
What is the Total Population of Cold Springs CDP El Dorado County?
Total Population of Cold Springs CDP El Dorado County is 612.
What is the Total Male Population of Cold Springs CDP El Dorado County?
Total Male Population of Cold Springs CDP El Dorado County is 266.
What is the Total Female Population of Cold Springs CDP El Dorado County?
Total Female Population of Cold Springs CDP El Dorado County is 346.
What is the Ratio of Males per 100 Females in Cold Springs CDP El Dorado County?
There are 76.88 Males per 100 Females in Cold Springs CDP El Dorado County.
What is the Ratio of Females per 100 Males in Cold Springs CDP El Dorado County?
There are 130.08 Females per 100 Males in Cold Springs CDP El Dorado County.
What is the Median Population Age in Cold Springs CDP El Dorado County?
Median Population Age in Cold Springs CDP El Dorado County is 55.8 Years.
What is the Average Family Size in Cold Springs CDP El Dorado County
Average Family Size in Cold Springs CDP El Dorado County is 2.8 People.
What is the Average Household Size in Cold Springs CDP El Dorado County
Average Household Size in Cold Springs CDP El Dorado County is 2.4 People.
How Large is the Labor Force in Cold Springs CDP El Dorado County?
There are 359 People in the Labor Forcein in Cold Springs CDP El Dorado County.
What is the Percentage of People in the Labor Force in Cold Springs CDP El Dorado County?
62.5% of People are in the Labor Force in Cold Springs CDP El Dorado County.