Cities with the Most Immigrants from Indonesia in California
RELATED REPORTS & OPTIONS
Indonesia
California
Compare Cities
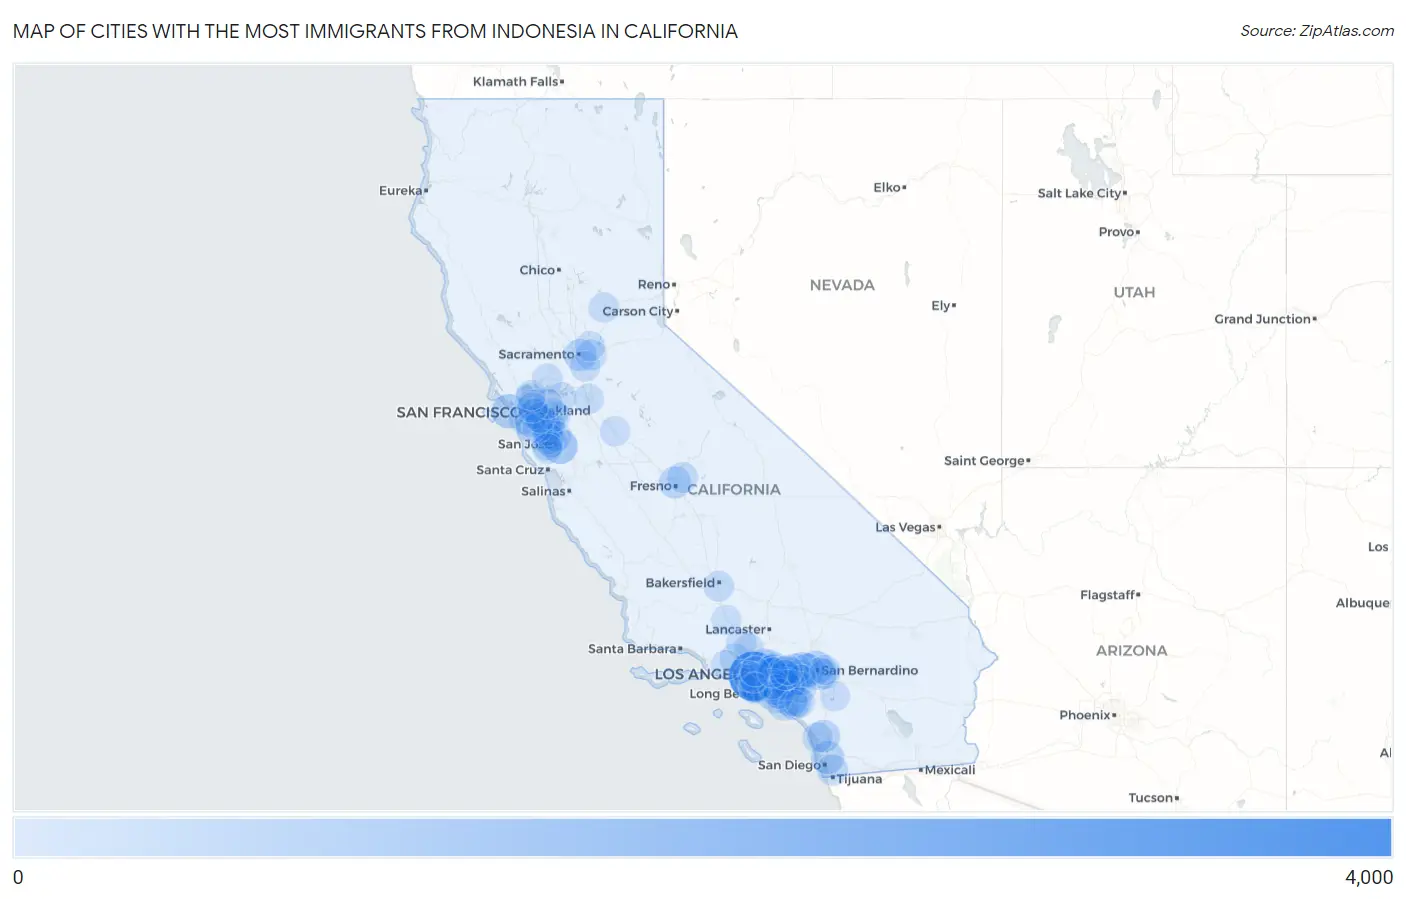
Map of Cities with the Most Immigrants from Indonesia in California
0
4,000
Cities with the Most Immigrants from Indonesia in California
| City | Indonesia | vs State | vs National | |
| 1. | Los Angeles | 3,995 | 39,097(10.22%)#1 | 99,615(4.01%)#2 |
| 2. | San Jose | 1,080 | 39,097(2.76%)#2 | 99,615(1.08%)#5 |
| 3. | Irvine | 976 | 39,097(2.50%)#3 | 99,615(0.98%)#6 |
| 4. | San Francisco | 934 | 39,097(2.39%)#4 | 99,615(0.94%)#7 |
| 5. | San Bernardino | 767 | 39,097(1.96%)#5 | 99,615(0.77%)#8 |
| 6. | Rancho Cucamonga | 738 | 39,097(1.89%)#6 | 99,615(0.74%)#9 |
| 7. | Fontana | 723 | 39,097(1.85%)#7 | 99,615(0.73%)#10 |
| 8. | San Diego | 696 | 39,097(1.78%)#8 | 99,615(0.70%)#11 |
| 9. | San Marcos | 551 | 39,097(1.41%)#9 | 99,615(0.55%)#13 |
| 10. | Loma Linda | 542 | 39,097(1.39%)#10 | 99,615(0.54%)#14 |
| 11. | Rowland Heights | 531 | 39,097(1.36%)#11 | 99,615(0.53%)#15 |
| 12. | Sacramento | 508 | 39,097(1.30%)#12 | 99,615(0.51%)#17 |
| 13. | Fremont | 499 | 39,097(1.28%)#13 | 99,615(0.50%)#19 |
| 14. | Alhambra | 496 | 39,097(1.27%)#14 | 99,615(0.50%)#20 |
| 15. | Chino | 491 | 39,097(1.26%)#15 | 99,615(0.49%)#21 |
| 16. | Fresno | 476 | 39,097(1.22%)#16 | 99,615(0.48%)#23 |
| 17. | Anaheim | 470 | 39,097(1.20%)#17 | 99,615(0.47%)#24 |
| 18. | Union City | 468 | 39,097(1.20%)#18 | 99,615(0.47%)#25 |
| 19. | Santa Clara | 458 | 39,097(1.17%)#19 | 99,615(0.46%)#26 |
| 20. | Hayward | 410 | 39,097(1.05%)#20 | 99,615(0.41%)#28 |
| 21. | Chino Hills | 406 | 39,097(1.04%)#21 | 99,615(0.41%)#29 |
| 22. | Long Beach | 354 | 39,097(0.91%)#22 | 99,615(0.36%)#31 |
| 23. | Monterey Park | 353 | 39,097(0.90%)#23 | 99,615(0.35%)#32 |
| 24. | Arcadia | 353 | 39,097(0.90%)#24 | 99,615(0.35%)#33 |
| 25. | Temple City | 337 | 39,097(0.86%)#25 | 99,615(0.34%)#35 |
| 26. | Chula Vista | 334 | 39,097(0.85%)#26 | 99,615(0.34%)#36 |
| 27. | Diamond Bar | 329 | 39,097(0.84%)#27 | 99,615(0.33%)#37 |
| 28. | San Ramon | 323 | 39,097(0.83%)#28 | 99,615(0.32%)#39 |
| 29. | Hacienda Heights | 314 | 39,097(0.80%)#29 | 99,615(0.32%)#40 |
| 30. | Newport Beach | 287 | 39,097(0.73%)#30 | 99,615(0.29%)#47 |
| 31. | East San Gabriel | 275 | 39,097(0.70%)#31 | 99,615(0.28%)#49 |
| 32. | Ontario | 273 | 39,097(0.70%)#32 | 99,615(0.27%)#50 |
| 33. | Daly City | 270 | 39,097(0.69%)#33 | 99,615(0.27%)#52 |
| 34. | San Gabriel | 262 | 39,097(0.67%)#34 | 99,615(0.26%)#55 |
| 35. | Oakland | 261 | 39,097(0.67%)#35 | 99,615(0.26%)#56 |
| 36. | Torrance | 260 | 39,097(0.67%)#36 | 99,615(0.26%)#58 |
| 37. | Milpitas | 260 | 39,097(0.67%)#37 | 99,615(0.26%)#59 |
| 38. | Clovis | 258 | 39,097(0.66%)#38 | 99,615(0.26%)#61 |
| 39. | Rancho Cordova | 255 | 39,097(0.65%)#39 | 99,615(0.26%)#62 |
| 40. | Fullerton | 249 | 39,097(0.64%)#40 | 99,615(0.25%)#63 |
| 41. | El Monte | 245 | 39,097(0.63%)#41 | 99,615(0.25%)#67 |
| 42. | Lake Forest | 245 | 39,097(0.63%)#42 | 99,615(0.25%)#68 |
| 43. | Sunnyvale | 239 | 39,097(0.61%)#43 | 99,615(0.24%)#71 |
| 44. | South San Francisco | 236 | 39,097(0.60%)#44 | 99,615(0.24%)#72 |
| 45. | West Covina | 232 | 39,097(0.59%)#45 | 99,615(0.23%)#73 |
| 46. | Cerritos | 225 | 39,097(0.58%)#46 | 99,615(0.23%)#76 |
| 47. | Pomona | 223 | 39,097(0.57%)#47 | 99,615(0.22%)#77 |
| 48. | Simi Valley | 223 | 39,097(0.57%)#48 | 99,615(0.22%)#78 |
| 49. | Corona | 219 | 39,097(0.56%)#49 | 99,615(0.22%)#80 |
| 50. | Upland | 202 | 39,097(0.52%)#50 | 99,615(0.20%)#84 |
| 51. | Berkeley | 200 | 39,097(0.51%)#51 | 99,615(0.20%)#85 |
| 52. | Pasadena | 196 | 39,097(0.50%)#52 | 99,615(0.20%)#87 |
| 53. | Bakersfield | 191 | 39,097(0.49%)#53 | 99,615(0.19%)#88 |
| 54. | Richmond | 178 | 39,097(0.46%)#54 | 99,615(0.18%)#93 |
| 55. | Glendale | 177 | 39,097(0.45%)#55 | 99,615(0.18%)#94 |
| 56. | Alameda | 177 | 39,097(0.45%)#56 | 99,615(0.18%)#95 |
| 57. | Redlands | 177 | 39,097(0.45%)#57 | 99,615(0.18%)#96 |
| 58. | Eastvale | 173 | 39,097(0.44%)#58 | 99,615(0.17%)#98 |
| 59. | Newark | 171 | 39,097(0.44%)#59 | 99,615(0.17%)#101 |
| 60. | Brea | 171 | 39,097(0.44%)#60 | 99,615(0.17%)#102 |
| 61. | Carlsbad | 168 | 39,097(0.43%)#61 | 99,615(0.17%)#106 |
| 62. | Cupertino | 167 | 39,097(0.43%)#62 | 99,615(0.17%)#107 |
| 63. | Covina | 164 | 39,097(0.42%)#63 | 99,615(0.16%)#110 |
| 64. | Dublin | 163 | 39,097(0.42%)#64 | 99,615(0.16%)#112 |
| 65. | San Mateo | 160 | 39,097(0.41%)#65 | 99,615(0.16%)#114 |
| 66. | Elk Grove | 153 | 39,097(0.39%)#66 | 99,615(0.15%)#117 |
| 67. | Fairfield | 152 | 39,097(0.39%)#67 | 99,615(0.15%)#119 |
| 68. | Antioch | 151 | 39,097(0.39%)#68 | 99,615(0.15%)#121 |
| 69. | Foster City | 150 | 39,097(0.38%)#69 | 99,615(0.15%)#122 |
| 70. | Yorba Linda | 149 | 39,097(0.38%)#70 | 99,615(0.15%)#123 |
| 71. | Castaic | 141 | 39,097(0.36%)#71 | 99,615(0.14%)#131 |
| 72. | Placentia | 134 | 39,097(0.34%)#72 | 99,615(0.13%)#134 |
| 73. | Cypress | 134 | 39,097(0.34%)#73 | 99,615(0.13%)#135 |
| 74. | San Leandro | 133 | 39,097(0.34%)#74 | 99,615(0.13%)#137 |
| 75. | Santa Clarita | 130 | 39,097(0.33%)#75 | 99,615(0.13%)#141 |
| 76. | Norwalk | 127 | 39,097(0.32%)#76 | 99,615(0.13%)#142 |
| 77. | Huntington Beach | 122 | 39,097(0.31%)#77 | 99,615(0.12%)#148 |
| 78. | Garden Grove | 122 | 39,097(0.31%)#78 | 99,615(0.12%)#149 |
| 79. | Redondo Beach | 122 | 39,097(0.31%)#79 | 99,615(0.12%)#152 |
| 80. | Grass Valley | 121 | 39,097(0.31%)#80 | 99,615(0.12%)#154 |
| 81. | Walnut Creek | 118 | 39,097(0.30%)#81 | 99,615(0.12%)#156 |
| 82. | Laguna Hills | 115 | 39,097(0.29%)#82 | 99,615(0.12%)#163 |
| 83. | Citrus Heights | 111 | 39,097(0.28%)#83 | 99,615(0.11%)#165 |
| 84. | Santa Monica | 109 | 39,097(0.28%)#84 | 99,615(0.11%)#167 |
| 85. | Walnut | 109 | 39,097(0.28%)#85 | 99,615(0.11%)#168 |
| 86. | Emeryville | 105 | 39,097(0.27%)#86 | 99,615(0.11%)#173 |
| 87. | Saratoga | 104 | 39,097(0.27%)#87 | 99,615(0.10%)#174 |
| 88. | Hermosa Beach | 104 | 39,097(0.27%)#88 | 99,615(0.10%)#175 |
| 89. | Stockton | 103 | 39,097(0.26%)#89 | 99,615(0.10%)#177 |
| 90. | Culver City | 98 | 39,097(0.25%)#90 | 99,615(0.10%)#182 |
| 91. | San Dimas | 97 | 39,097(0.25%)#91 | 99,615(0.10%)#183 |
| 92. | Hemet | 96 | 39,097(0.25%)#92 | 99,615(0.10%)#184 |
| 93. | Lebec | 96 | 39,097(0.25%)#93 | 99,615(0.10%)#185 |
| 94. | Turlock | 95 | 39,097(0.24%)#94 | 99,615(0.10%)#187 |
| 95. | Highland | 94 | 39,097(0.24%)#95 | 99,615(0.09%)#190 |
| 96. | Thousand Oaks | 93 | 39,097(0.24%)#96 | 99,615(0.09%)#193 |
| 97. | Rosemead | 93 | 39,097(0.24%)#97 | 99,615(0.09%)#194 |
| 98. | Beverly Hills | 93 | 39,097(0.24%)#98 | 99,615(0.09%)#195 |
| 99. | Pinole | 93 | 39,097(0.24%)#99 | 99,615(0.09%)#197 |
| 100. | Rancho Santa Margarita | 92 | 39,097(0.24%)#100 | 99,615(0.09%)#199 |
Common Questions
What are the Top 10 Cities with the Most Immigrants from Indonesia in California?
Top 10 Cities with the Most Immigrants from Indonesia in California are:
#1
3,995
#2
1,080
#3
976
#4
934
#5
767
#6
738
#7
723
#8
696
#9
551
#10
542
What city has the Most Immigrants from Indonesia in California?
Los Angeles has the Most Immigrants from Indonesia in California with 3,995.
What is the Total Immigrants from Indonesia in the State of California?
Total Immigrants from Indonesia in California is 39,097.
What is the Total Immigrants from Indonesia in the United States?
Total Immigrants from Indonesia in the United States is 99,615.