Cities with the Lowest Percentage of Renter-Occupied Units in California
RELATED REPORTS & OPTIONS
Lowest Renter-Occupied
California
Compare Cities
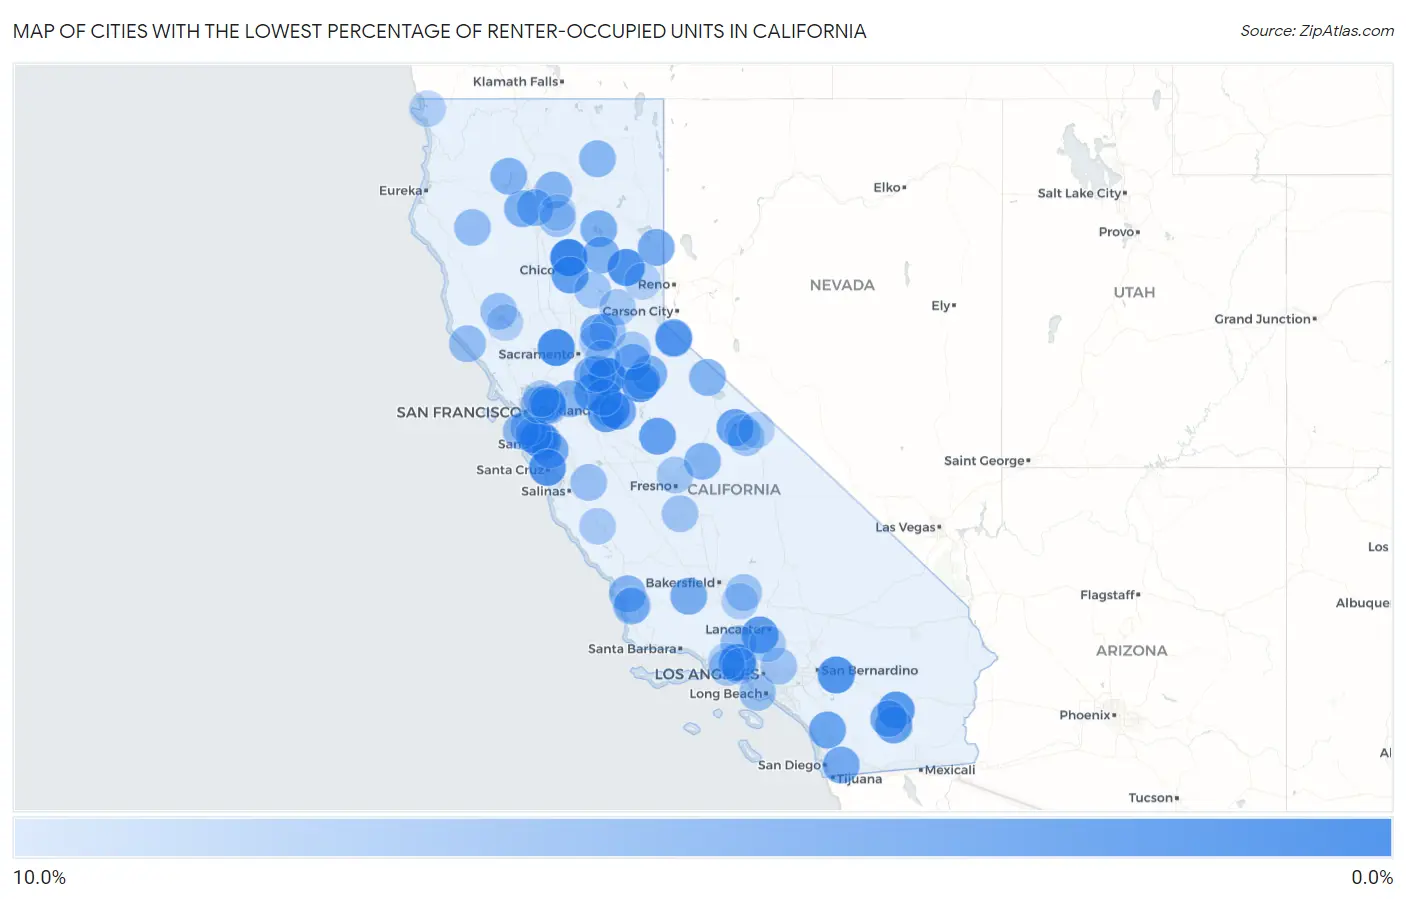
Map of Cities with the Lowest Percentage of Renter-Occupied Units in California
10.0%
0.0%
Cities with the Lowest Percentage of Renter-Occupied Units in California
| City | % Renter-Occupied | vs State | vs National | |
| 1. | Camanche Village | 1.00% | 44.4%(-43.4)#1 | 35.2%(-34.2)#59 |
| 2. | Forest Ranch | 1.1% | 44.4%(-43.3)#2 | 35.2%(-34.1)#73 |
| 3. | Bell Canyon | 2.1% | 44.4%(-42.3)#3 | 35.2%(-33.1)#236 |
| 4. | Monument Hills | 2.1% | 44.4%(-42.2)#4 | 35.2%(-33.0)#250 |
| 5. | Woody | 2.3% | 44.4%(-42.1)#5 | 35.2%(-32.9)#281 |
| 6. | Graeagle | 2.5% | 44.4%(-41.9)#6 | 35.2%(-32.7)#337 |
| 7. | Oak Glen | 2.8% | 44.4%(-41.6)#7 | 35.2%(-32.4)#443 |
| 8. | Forest Meadows | 2.9% | 44.4%(-41.5)#8 | 35.2%(-32.3)#472 |
| 9. | Valley Home | 3.0% | 44.4%(-41.4)#9 | 35.2%(-32.2)#496 |
| 10. | North Shore | 3.2% | 44.4%(-41.2)#10 | 35.2%(-32.0)#571 |
| 11. | Green Valley Cdp Solano County | 3.2% | 44.4%(-41.1)#11 | 35.2%(-31.9)#591 |
| 12. | Ladera | 3.2% | 44.4%(-41.1)#12 | 35.2%(-31.9)#597 |
| 13. | Leona Valley | 3.5% | 44.4%(-40.9)#13 | 35.2%(-31.7)#671 |
| 14. | Del Rio | 3.7% | 44.4%(-40.7)#14 | 35.2%(-31.5)#723 |
| 15. | Butte Valley | 3.8% | 44.4%(-40.6)#15 | 35.2%(-31.4)#767 |
| 16. | Catheys Valley | 3.8% | 44.4%(-40.5)#16 | 35.2%(-31.4)#792 |
| 17. | Los Altos Hills | 4.1% | 44.4%(-40.3)#17 | 35.2%(-31.1)#865 |
| 18. | Crowley Lake | 4.1% | 44.4%(-40.3)#18 | 35.2%(-31.1)#871 |
| 19. | Morada | 4.2% | 44.4%(-40.2)#19 | 35.2%(-31.0)#910 |
| 20. | Salton City | 4.3% | 44.4%(-40.1)#20 | 35.2%(-30.9)#928 |
| 21. | Hidden Meadows | 4.4% | 44.4%(-40.0)#21 | 35.2%(-30.8)#972 |
| 22. | Paradise Park | 4.5% | 44.4%(-39.9)#22 | 35.2%(-30.7)#990 |
| 23. | Castle Hill | 4.5% | 44.4%(-39.9)#23 | 35.2%(-30.7)#995 |
| 24. | Trabuco Canyon | 4.5% | 44.4%(-39.9)#24 | 35.2%(-30.7)#1,006 |
| 25. | Newcastle | 4.5% | 44.4%(-39.9)#25 | 35.2%(-30.7)#1,009 |
| 26. | Mesa Vista | 4.5% | 44.4%(-39.8)#26 | 35.2%(-30.6)#1,027 |
| 27. | East Oakdale | 4.6% | 44.4%(-39.8)#27 | 35.2%(-30.6)#1,059 |
| 28. | Monte Sereno | 4.9% | 44.4%(-39.5)#28 | 35.2%(-30.3)#1,178 |
| 29. | Jamul | 5.0% | 44.4%(-39.4)#29 | 35.2%(-30.2)#1,208 |
| 30. | Doyle | 5.0% | 44.4%(-39.3)#30 | 35.2%(-30.1)#1,245 |
| 31. | Desert Shores | 5.1% | 44.4%(-39.3)#31 | 35.2%(-30.1)#1,257 |
| 32. | Herald | 5.1% | 44.4%(-39.2)#32 | 35.2%(-30.0)#1,274 |
| 33. | Fellows | 5.3% | 44.4%(-39.1)#33 | 35.2%(-29.9)#1,336 |
| 34. | Lake Almanor Peninsula | 5.4% | 44.4%(-39.0)#34 | 35.2%(-29.8)#1,389 |
| 35. | El Macero | 5.4% | 44.4%(-39.0)#35 | 35.2%(-29.8)#1,395 |
| 36. | Centerville | 5.5% | 44.4%(-38.9)#36 | 35.2%(-29.7)#1,435 |
| 37. | Meadow Valley | 5.6% | 44.4%(-38.8)#37 | 35.2%(-29.6)#1,458 |
| 38. | Dorrington | 5.7% | 44.4%(-38.7)#38 | 35.2%(-29.5)#1,512 |
| 39. | Baywood Park | 5.7% | 44.4%(-38.6)#39 | 35.2%(-29.5)#1,534 |
| 40. | Buckhorn | 5.8% | 44.4%(-38.6)#40 | 35.2%(-29.4)#1,543 |
| 41. | Trinity Center | 5.9% | 44.4%(-38.4)#41 | 35.2%(-29.3)#1,618 |
| 42. | Bridgeport | 6.0% | 44.4%(-38.4)#42 | 35.2%(-29.2)#1,626 |
| 43. | Shaver Lake | 6.0% | 44.4%(-38.4)#43 | 35.2%(-29.2)#1,627 |
| 44. | Peters | 6.0% | 44.4%(-38.3)#44 | 35.2%(-29.1)#1,662 |
| 45. | Round Mountain | 6.1% | 44.4%(-38.3)#45 | 35.2%(-29.1)#1,671 |
| 46. | Knightsen | 6.1% | 44.4%(-38.3)#46 | 35.2%(-29.1)#1,687 |
| 47. | Palo Cedro | 6.1% | 44.4%(-38.3)#47 | 35.2%(-29.1)#1,690 |
| 48. | Los Ranchos | 6.2% | 44.4%(-38.2)#48 | 35.2%(-29.0)#1,710 |
| 49. | Hillsborough | 6.2% | 44.4%(-38.2)#49 | 35.2%(-29.0)#1,714 |
| 50. | Lookout | 6.2% | 44.4%(-38.1)#50 | 35.2%(-28.9)#1,751 |
| 51. | Avery | 6.4% | 44.4%(-38.0)#51 | 35.2%(-28.8)#1,791 |
| 52. | Moss Beach | 6.5% | 44.4%(-37.8)#52 | 35.2%(-28.7)#1,863 |
| 53. | Ruth | 6.9% | 44.4%(-37.4)#53 | 35.2%(-28.2)#2,031 |
| 54. | Hasley Canyon | 7.0% | 44.4%(-37.4)#54 | 35.2%(-28.2)#2,039 |
| 55. | Sea Ranch | 7.0% | 44.4%(-37.4)#55 | 35.2%(-28.2)#2,054 |
| 56. | Emerald Lake Hills | 7.0% | 44.4%(-37.3)#56 | 35.2%(-28.2)#2,067 |
| 57. | Orinda | 7.1% | 44.4%(-37.3)#57 | 35.2%(-28.1)#2,100 |
| 58. | Tres Pinos | 7.2% | 44.4%(-37.2)#58 | 35.2%(-28.0)#2,167 |
| 59. | Upper Lake | 7.3% | 44.4%(-37.1)#59 | 35.2%(-27.9)#2,198 |
| 60. | Auburn Lake Trails | 7.3% | 44.4%(-37.1)#60 | 35.2%(-27.9)#2,208 |
| 61. | Rolling Hills Estates | 7.3% | 44.4%(-37.0)#61 | 35.2%(-27.8)#2,225 |
| 62. | Bradbury | 7.6% | 44.4%(-36.8)#62 | 35.2%(-27.6)#2,339 |
| 63. | Mesa | 7.6% | 44.4%(-36.8)#63 | 35.2%(-27.6)#2,340 |
| 64. | Jones Valley | 7.6% | 44.4%(-36.8)#64 | 35.2%(-27.6)#2,343 |
| 65. | Keene | 7.6% | 44.4%(-36.8)#65 | 35.2%(-27.6)#2,347 |
| 66. | Alpine Village | 7.6% | 44.4%(-36.8)#66 | 35.2%(-27.6)#2,349 |
| 67. | Clay | 7.6% | 44.4%(-36.7)#67 | 35.2%(-27.6)#2,359 |
| 68. | Manton | 7.6% | 44.4%(-36.7)#68 | 35.2%(-27.5)#2,365 |
| 69. | Grangeville | 7.7% | 44.4%(-36.7)#69 | 35.2%(-27.5)#2,386 |
| 70. | Blacklake | 7.7% | 44.4%(-36.7)#70 | 35.2%(-27.5)#2,420 |
| 71. | Challenge Brownsville | 7.7% | 44.4%(-36.6)#71 | 35.2%(-27.4)#2,430 |
| 72. | Lake Sherwood | 7.8% | 44.4%(-36.6)#72 | 35.2%(-27.4)#2,453 |
| 73. | Rolling Hills | 7.9% | 44.4%(-36.5)#73 | 35.2%(-27.3)#2,498 |
| 74. | El Sobrante Cdp Riverside County | 8.0% | 44.4%(-36.4)#74 | 35.2%(-27.2)#2,520 |
| 75. | Las Flores Cdp Tehama County | 8.0% | 44.4%(-36.4)#75 | 35.2%(-27.2)#2,540 |
| 76. | Acton | 8.0% | 44.4%(-36.4)#76 | 35.2%(-27.2)#2,550 |
| 77. | Grizzly Flats | 8.1% | 44.4%(-36.3)#77 | 35.2%(-27.1)#2,565 |
| 78. | Shell Ridge | 8.1% | 44.4%(-36.3)#78 | 35.2%(-27.1)#2,601 |
| 79. | Alamo | 8.2% | 44.4%(-36.2)#79 | 35.2%(-27.0)#2,615 |
| 80. | Woodlands | 8.2% | 44.4%(-36.1)#80 | 35.2%(-27.0)#2,648 |
| 81. | San Miguel Cdp Contra Costa County | 8.2% | 44.4%(-36.1)#81 | 35.2%(-27.0)#2,652 |
| 82. | Alta | 8.2% | 44.4%(-36.1)#82 | 35.2%(-26.9)#2,655 |
| 83. | Pine Canyon | 8.3% | 44.4%(-36.1)#83 | 35.2%(-26.9)#2,665 |
| 84. | Granite Bay | 8.4% | 44.4%(-36.0)#84 | 35.2%(-26.8)#2,719 |
| 85. | Pasatiempo | 8.4% | 44.4%(-36.0)#85 | 35.2%(-26.8)#2,720 |
| 86. | Alhambra Valley | 8.4% | 44.4%(-35.9)#86 | 35.2%(-26.7)#2,751 |
| 87. | Paradise | 8.5% | 44.4%(-35.9)#87 | 35.2%(-26.7)#2,772 |
| 88. | Amador Pines | 8.5% | 44.4%(-35.8)#88 | 35.2%(-26.6)#2,786 |
| 89. | Stallion Springs | 8.6% | 44.4%(-35.8)#89 | 35.2%(-26.6)#2,796 |
| 90. | Bakersfield Country Club | 8.6% | 44.4%(-35.8)#90 | 35.2%(-26.6)#2,823 |
| 91. | Shingletown | 8.7% | 44.4%(-35.7)#91 | 35.2%(-26.5)#2,849 |
| 92. | Santa Rosa Valley | 8.7% | 44.4%(-35.7)#92 | 35.2%(-26.5)#2,851 |
| 93. | Rancho Murieta | 8.7% | 44.4%(-35.7)#93 | 35.2%(-26.5)#2,862 |
| 94. | Sierraville | 8.7% | 44.4%(-35.7)#94 | 35.2%(-26.5)#2,872 |
| 95. | Whitmore | 8.8% | 44.4%(-35.6)#95 | 35.2%(-26.4)#2,935 |
| 96. | Fort Dick | 8.9% | 44.4%(-35.5)#96 | 35.2%(-26.3)#2,963 |
| 97. | Soda Bay | 8.9% | 44.4%(-35.5)#97 | 35.2%(-26.3)#2,995 |
| 98. | Chalfant | 9.0% | 44.4%(-35.4)#98 | 35.2%(-26.2)#3,023 |
| 99. | Igo | 9.1% | 44.4%(-35.3)#99 | 35.2%(-26.1)#3,121 |
| 100. | Hidden Hills | 9.1% | 44.4%(-35.2)#100 | 35.2%(-26.1)#3,145 |
Common Questions
What are the Top 10 Cities with the Lowest Percentage of Renter-Occupied Units in California?
Top 10 Cities with the Lowest Percentage of Renter-Occupied Units in California are:
#1
1.00%
#2
1.1%
#3
2.1%
#4
2.1%
#5
2.5%
#6
2.8%
#7
2.9%
#8
3.0%
#9
3.2%
#10
3.2%
What city has the Lowest Percentage of Renter-Occupied Units in California?
Camanche Village has the Lowest Percentage of Renter-Occupied Units in California with 1.00%.
What is the Percentage of Renter-Occupied Units in the State of California?
Percentage of Renter-Occupied Units in California is 44.4%.
What is the Percentage of Renter-Occupied Units in the United States?
Percentage of Renter-Occupied Units in the United States is 35.2%.