Cities with the Highest Percentage of Population Employed in Farming, Fishing & Forestry in California
RELATED REPORTS & OPTIONS
Farming, Fishing & Forestry
California
Compare Cities
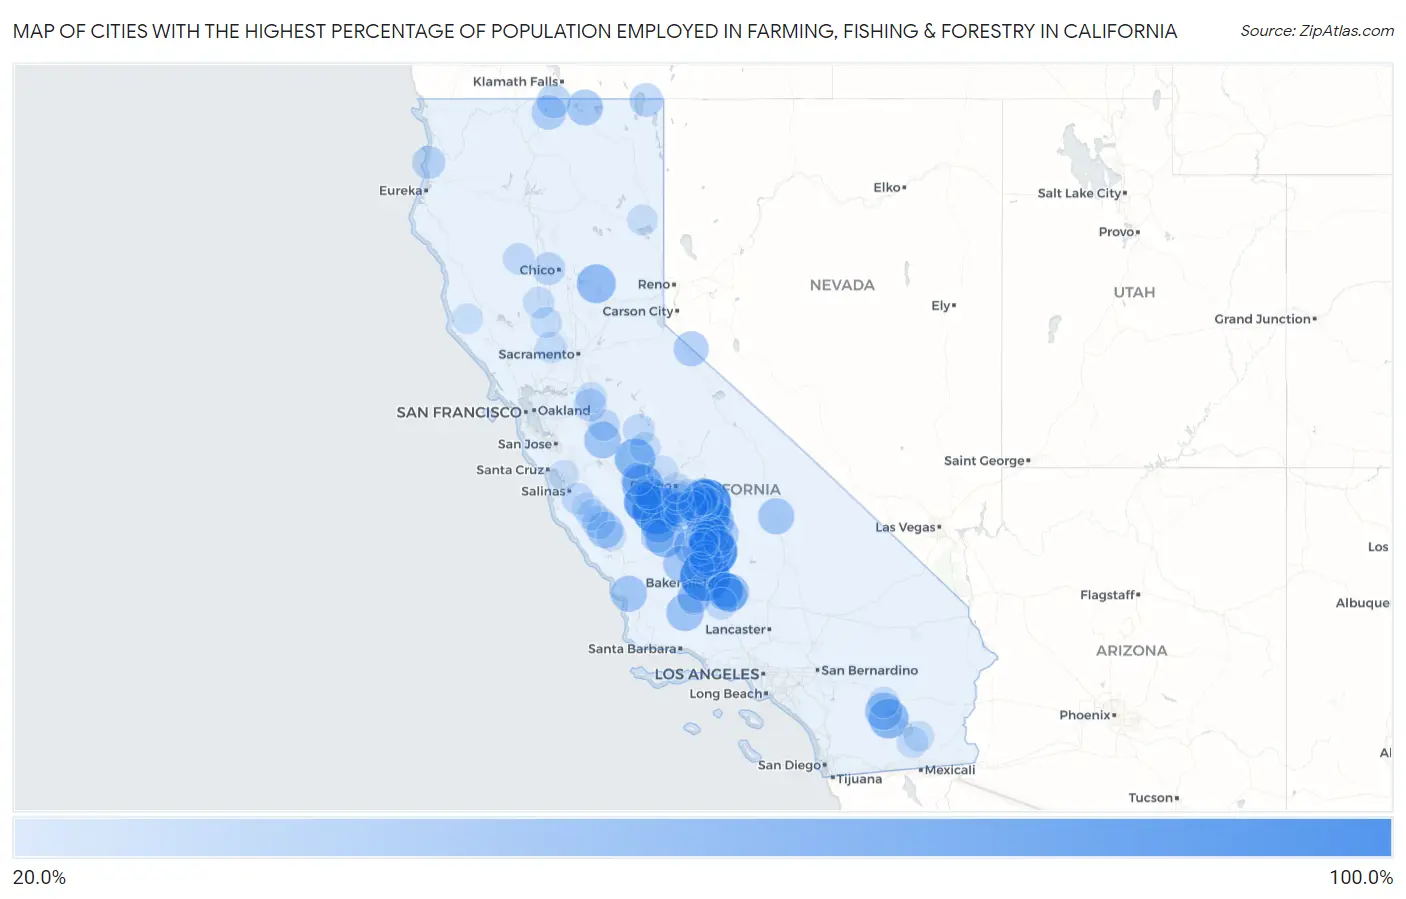
Map of Cities with the Highest Percentage of Population Employed in Farming, Fishing & Forestry in California
0.0%
100.0%
Cities with the Highest Percentage of Population Employed in Farming, Fishing & Forestry in California
| City | % Employed | vs State | vs National | |
| 1. | Cherokee Strip | 100.0% | 1.4%(+98.6)#1 | 0.61%(+99.4)#1 |
| 2. | Yettem | 100.0% | 1.4%(+98.6)#2 | 0.61%(+99.4)#3 |
| 3. | Rodriguez Camp | 100.0% | 1.4%(+98.6)#3 | 0.61%(+99.4)#9 |
| 4. | Westside | 93.6% | 1.4%(+92.2)#4 | 0.61%(+93.0)#19 |
| 5. | Linnell Camp | 79.4% | 1.4%(+78.0)#5 | 0.61%(+78.8)#25 |
| 6. | Woodville Farm Labor Camp | 78.3% | 1.4%(+76.9)#6 | 0.61%(+77.7)#28 |
| 7. | Cantua Creek | 64.9% | 1.4%(+63.5)#7 | 0.61%(+64.3)#39 |
| 8. | Mendota | 64.1% | 1.4%(+62.7)#8 | 0.61%(+63.5)#41 |
| 9. | El Nido | 62.7% | 1.4%(+61.3)#9 | 0.61%(+62.1)#42 |
| 10. | East Orosi | 61.5% | 1.4%(+60.1)#10 | 0.61%(+60.9)#44 |
| 11. | Desert Shores | 59.3% | 1.4%(+57.8)#11 | 0.61%(+58.7)#49 |
| 12. | Jovista | 58.3% | 1.4%(+56.9)#12 | 0.61%(+57.7)#52 |
| 13. | Kettleman City | 58.3% | 1.4%(+56.9)#13 | 0.61%(+57.7)#53 |
| 14. | Lanare | 56.4% | 1.4%(+55.0)#14 | 0.61%(+55.8)#58 |
| 15. | Clipper Mills | 56.4% | 1.4%(+55.0)#15 | 0.61%(+55.8)#59 |
| 16. | Pumpkin Center | 52.3% | 1.4%(+50.9)#16 | 0.61%(+51.7)#67 |
| 17. | Tonyville | 52.2% | 1.4%(+50.8)#17 | 0.61%(+51.6)#68 |
| 18. | Edmundson Acres | 51.7% | 1.4%(+50.3)#18 | 0.61%(+51.1)#70 |
| 19. | Huron | 51.4% | 1.4%(+50.0)#19 | 0.61%(+50.8)#71 |
| 20. | Weedpatch | 50.6% | 1.4%(+49.2)#20 | 0.61%(+50.0)#74 |
| 21. | Oasis | 50.0% | 1.4%(+48.6)#21 | 0.61%(+49.4)#76 |
| 22. | Cuyama | 50.0% | 1.4%(+48.6)#22 | 0.61%(+49.4)#82 |
| 23. | Alpaugh | 49.4% | 1.4%(+48.0)#23 | 0.61%(+48.8)#84 |
| 24. | Crows Landing | 47.5% | 1.4%(+46.1)#24 | 0.61%(+46.9)#88 |
| 25. | Edna | 46.1% | 1.4%(+44.7)#25 | 0.61%(+45.5)#91 |
| 26. | San Lucas | 46.0% | 1.4%(+44.6)#26 | 0.61%(+45.4)#92 |
| 27. | Cartago | 45.7% | 1.4%(+44.3)#27 | 0.61%(+45.1)#94 |
| 28. | Lost Hills | 45.7% | 1.4%(+44.3)#28 | 0.61%(+45.1)#95 |
| 29. | Newell | 44.6% | 1.4%(+43.1)#29 | 0.61%(+44.0)#99 |
| 30. | Richgrove | 43.0% | 1.4%(+41.6)#30 | 0.61%(+42.4)#108 |
| 31. | Lamont | 42.2% | 1.4%(+40.8)#31 | 0.61%(+41.6)#111 |
| 32. | Earlimart | 42.0% | 1.4%(+40.6)#32 | 0.61%(+41.4)#113 |
| 33. | Three Rocks | 41.4% | 1.4%(+40.0)#33 | 0.61%(+40.8)#118 |
| 34. | Topaz | 41.4% | 1.4%(+40.0)#34 | 0.61%(+40.8)#119 |
| 35. | East Porterville | 40.2% | 1.4%(+38.8)#35 | 0.61%(+39.6)#123 |
| 36. | Hardwick | 39.7% | 1.4%(+38.3)#36 | 0.61%(+39.1)#128 |
| 37. | Macdoel | 39.0% | 1.4%(+37.6)#37 | 0.61%(+38.4)#132 |
| 38. | San Joaquin | 38.9% | 1.4%(+37.5)#38 | 0.61%(+38.3)#133 |
| 39. | Arvin | 38.7% | 1.4%(+37.3)#39 | 0.61%(+38.1)#134 |
| 40. | Monson | 38.1% | 1.4%(+36.7)#40 | 0.61%(+37.5)#137 |
| 41. | Dorris | 37.4% | 1.4%(+36.0)#41 | 0.61%(+36.8)#144 |
| 42. | Woodville | 37.3% | 1.4%(+35.9)#42 | 0.61%(+36.7)#145 |
| 43. | Orange Cove | 37.0% | 1.4%(+35.6)#43 | 0.61%(+36.4)#146 |
| 44. | London | 36.9% | 1.4%(+35.5)#44 | 0.61%(+36.3)#148 |
| 45. | Tipton | 36.5% | 1.4%(+35.1)#45 | 0.61%(+35.9)#153 |
| 46. | Poplar Cotton Center | 36.2% | 1.4%(+34.8)#46 | 0.61%(+35.6)#155 |
| 47. | Tranquillity | 35.4% | 1.4%(+34.0)#47 | 0.61%(+34.8)#159 |
| 48. | New Pine Creek | 35.3% | 1.4%(+33.9)#48 | 0.61%(+34.7)#160 |
| 49. | Avenal | 35.1% | 1.4%(+33.7)#49 | 0.61%(+34.5)#163 |
| 50. | King City | 34.6% | 1.4%(+33.2)#50 | 0.61%(+34.0)#166 |
| 51. | Ducor | 34.5% | 1.4%(+33.1)#51 | 0.61%(+33.9)#167 |
| 52. | Mcfarland | 34.1% | 1.4%(+32.7)#52 | 0.61%(+33.5)#170 |
| 53. | Ford City | 33.8% | 1.4%(+32.4)#53 | 0.61%(+33.2)#171 |
| 54. | Allensworth | 33.6% | 1.4%(+32.1)#54 | 0.61%(+33.0)#173 |
| 55. | Big Lagoon | 33.3% | 1.4%(+31.9)#55 | 0.61%(+32.7)#176 |
| 56. | Hamilton City | 32.8% | 1.4%(+31.4)#56 | 0.61%(+32.2)#183 |
| 57. | Firebaugh | 32.6% | 1.4%(+31.2)#57 | 0.61%(+32.0)#186 |
| 58. | French Camp | 31.9% | 1.4%(+30.5)#58 | 0.61%(+31.3)#192 |
| 59. | South Taft | 31.8% | 1.4%(+30.4)#59 | 0.61%(+31.2)#194 |
| 60. | Seville | 31.5% | 1.4%(+30.0)#60 | 0.61%(+30.8)#198 |
| 61. | Di Giorgio | 31.2% | 1.4%(+29.8)#61 | 0.61%(+30.6)#200 |
| 62. | Delft Colony | 31.2% | 1.4%(+29.8)#62 | 0.61%(+30.6)#203 |
| 63. | Sultana | 30.5% | 1.4%(+29.1)#63 | 0.61%(+29.9)#217 |
| 64. | La Grange | 30.4% | 1.4%(+29.0)#64 | 0.61%(+29.8)#219 |
| 65. | Riverdale Park | 29.8% | 1.4%(+28.3)#65 | 0.61%(+29.2)#226 |
| 66. | Mettler | 28.9% | 1.4%(+27.5)#66 | 0.61%(+28.3)#240 |
| 67. | Snelling | 28.8% | 1.4%(+27.4)#67 | 0.61%(+28.2)#242 |
| 68. | Paskenta | 28.6% | 1.4%(+27.2)#68 | 0.61%(+28.0)#247 |
| 69. | Parlier | 28.5% | 1.4%(+27.1)#69 | 0.61%(+27.9)#250 |
| 70. | Chualar | 28.2% | 1.4%(+26.7)#70 | 0.61%(+27.5)#253 |
| 71. | Old River | 27.9% | 1.4%(+26.5)#71 | 0.61%(+27.3)#258 |
| 72. | Laton | 27.6% | 1.4%(+26.2)#72 | 0.61%(+27.0)#263 |
| 73. | Westmorland | 27.5% | 1.4%(+26.1)#73 | 0.61%(+26.9)#264 |
| 74. | Greenfield | 27.3% | 1.4%(+25.9)#74 | 0.61%(+26.7)#269 |
| 75. | Maxwell | 27.1% | 1.4%(+25.6)#75 | 0.61%(+26.4)#276 |
| 76. | East Bakersfield | 27.0% | 1.4%(+25.5)#76 | 0.61%(+26.3)#279 |
| 77. | Madison | 26.9% | 1.4%(+25.5)#77 | 0.61%(+26.3)#280 |
| 78. | Thermal | 26.9% | 1.4%(+25.5)#78 | 0.61%(+26.3)#282 |
| 79. | Planada | 26.7% | 1.4%(+25.3)#79 | 0.61%(+26.1)#284 |
| 80. | Parksdale | 26.6% | 1.4%(+25.2)#80 | 0.61%(+26.0)#291 |
| 81. | Delano | 26.0% | 1.4%(+24.6)#81 | 0.61%(+25.4)#302 |
| 82. | Arbuckle | 26.0% | 1.4%(+24.6)#82 | 0.61%(+25.4)#303 |
| 83. | Armona | 25.8% | 1.4%(+24.4)#83 | 0.61%(+25.2)#307 |
| 84. | August | 25.7% | 1.4%(+24.3)#84 | 0.61%(+25.1)#313 |
| 85. | Litchfield | 25.4% | 1.4%(+24.0)#85 | 0.61%(+24.8)#317 |
| 86. | Terra Bella | 25.0% | 1.4%(+23.6)#86 | 0.61%(+24.4)#321 |
| 87. | Calipatria | 24.7% | 1.4%(+23.3)#87 | 0.61%(+24.1)#328 |
| 88. | Pixley | 24.7% | 1.4%(+23.3)#88 | 0.61%(+24.1)#330 |
| 89. | Potomac Park | 24.5% | 1.4%(+23.1)#89 | 0.61%(+23.9)#332 |
| 90. | Monmouth | 24.2% | 1.4%(+22.8)#90 | 0.61%(+23.6)#335 |
| 91. | Philo | 24.1% | 1.4%(+22.7)#91 | 0.61%(+23.5)#337 |
| 92. | Wasco | 24.1% | 1.4%(+22.6)#92 | 0.61%(+23.5)#339 |
| 93. | Bowles | 23.7% | 1.4%(+22.3)#93 | 0.61%(+23.1)#344 |
| 94. | Orosi | 23.6% | 1.4%(+22.2)#94 | 0.61%(+23.0)#348 |
| 95. | Pajaro | 23.4% | 1.4%(+22.0)#95 | 0.61%(+22.8)#354 |
| 96. | Calwa | 23.0% | 1.4%(+21.6)#96 | 0.61%(+22.4)#363 |
| 97. | San Ardo | 23.0% | 1.4%(+21.6)#97 | 0.61%(+22.4)#364 |
| 98. | Soledad | 22.6% | 1.4%(+21.2)#98 | 0.61%(+22.0)#371 |
| 99. | Teviston | 22.4% | 1.4%(+21.0)#99 | 0.61%(+21.8)#374 |
| 100. | Traver | 22.2% | 1.4%(+20.7)#100 | 0.61%(+21.6)#382 |
Common Questions
What are the Top 10 Cities with the Highest Percentage of Population Employed in Farming, Fishing & Forestry in California?
Top 10 Cities with the Highest Percentage of Population Employed in Farming, Fishing & Forestry in California are:
#1
100.0%
#2
100.0%
#3
100.0%
#4
93.6%
#5
79.4%
#6
64.9%
#7
64.1%
#8
62.7%
#9
61.5%
#10
59.3%
What city has the Highest Percentage of Population Employed in Farming, Fishing & Forestry in California?
Cherokee Strip has the Highest Percentage of Population Employed in Farming, Fishing & Forestry in California with 100.0%.
What is the Percentage of Population Employed in Farming, Fishing & Forestry in the State of California?
Percentage of Population Employed in Farming, Fishing & Forestry in California is 1.4%.
What is the Percentage of Population Employed in Farming, Fishing & Forestry in the United States?
Percentage of Population Employed in Farming, Fishing & Forestry in the United States is 0.61%.