Cities with the Highest Percentage of Immigrants from Africa in California
RELATED REPORTS & OPTIONS
Africa
California
Compare Cities
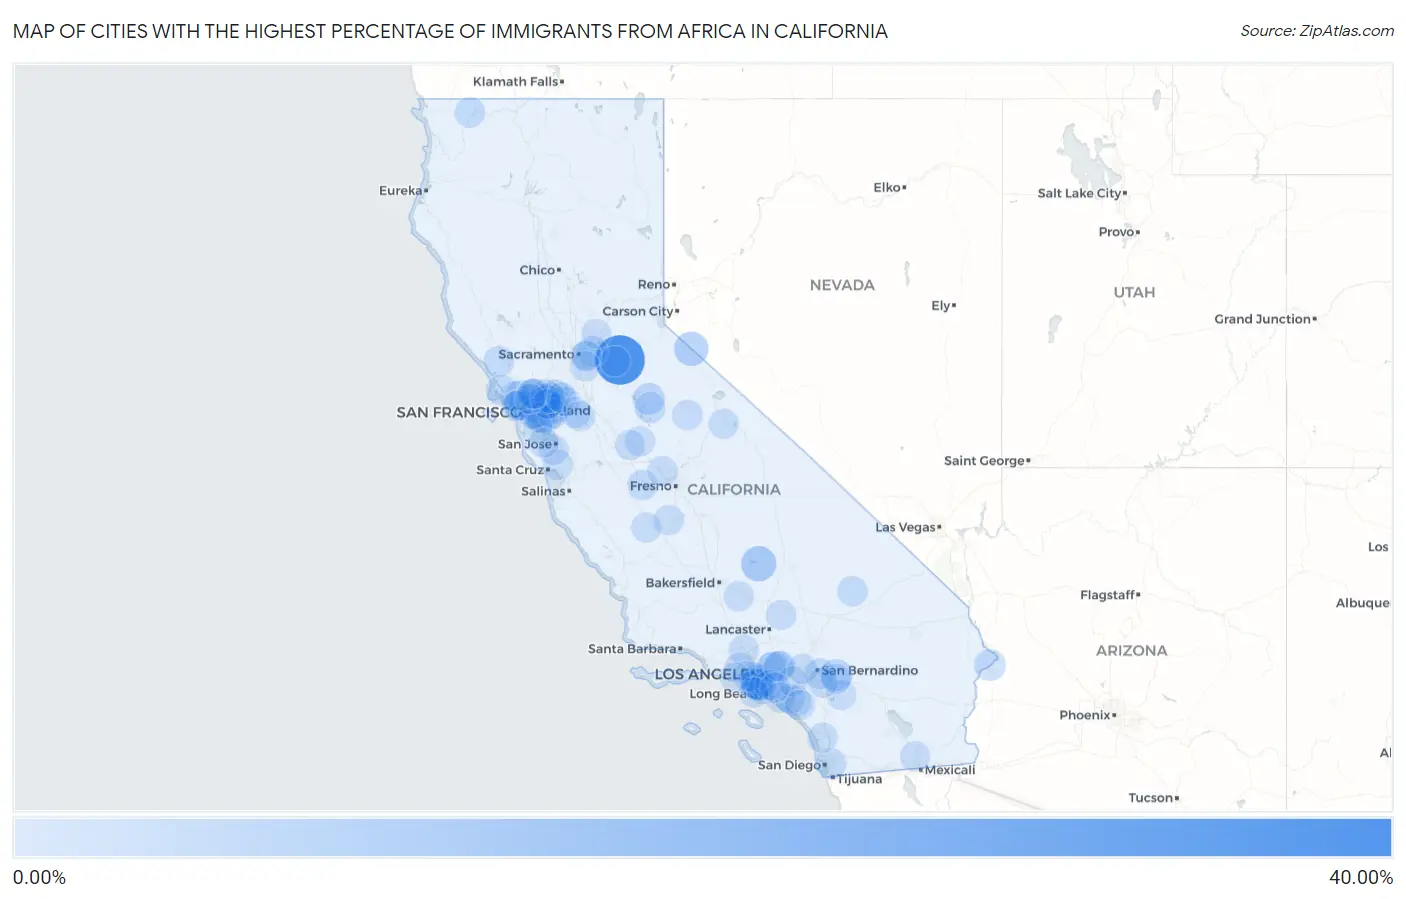
Map of Cities with the Highest Percentage of Immigrants from Africa in California
0.00%
40.00%
Cities with the Highest Percentage of Immigrants from Africa in California
| City | Africa | vs State | vs National | |
| 1. | Fiddletown | 39.29% | 0.54%(+38.7)#-1 | 0.78%(+38.5)#0 |
| 2. | Yermo | 19.16% | 0.54%(+18.6)#0 | 0.78%(+18.4)#1 |
| 3. | Williams Canyon | 16.67% | 0.54%(+16.1)#1 | 0.78%(+15.9)#2 |
| 4. | Weldon | 10.42% | 0.54%(+9.87)#2 | 0.78%(+9.64)#3 |
| 5. | Topaz | 8.64% | 0.54%(+8.10)#3 | 0.78%(+7.86)#4 |
| 6. | Bakersfield Country Club | 7.33% | 0.54%(+6.78)#4 | 0.78%(+6.55)#5 |
| 7. | Shell Ridge | 6.92% | 0.54%(+6.37)#5 | 0.78%(+6.14)#6 |
| 8. | Pacheco | 5.73% | 0.54%(+5.19)#6 | 0.78%(+4.95)#7 |
| 9. | Oak Glen | 4.34% | 0.54%(+3.79)#7 | 0.78%(+3.56)#8 |
| 10. | Hawthorne | 4.27% | 0.54%(+3.73)#63 | 0.78%(+3.49)#419 |
| 11. | Tuolumne City | 4.09% | 0.54%(+3.54)#64 | 0.78%(+3.31)#420 |
| 12. | El Sobrante Cdp Riverside County | 3.82% | 0.54%(+3.27)#65 | 0.78%(+3.04)#421 |
| 13. | Bluewater | 3.59% | 0.54%(+3.05)#66 | 0.78%(+2.81)#422 |
| 14. | Contra Costa Centre | 3.07% | 0.54%(+2.52)#67 | 0.78%(+2.29)#423 |
| 15. | Pittsburg | 2.71% | 0.54%(+2.17)#68 | 0.78%(+1.93)#424 |
| 16. | Groveland | 2.71% | 0.54%(+2.16)#69 | 0.78%(+1.93)#425 |
| 17. | Castro Valley | 2.58% | 0.54%(+2.04)#70 | 0.78%(+1.80)#426 |
| 18. | Marin City | 2.52% | 0.54%(+1.97)#71 | 0.78%(+1.74)#427 |
| 19. | Alondra Park | 2.45% | 0.54%(+1.91)#72 | 0.78%(+1.67)#428 |
| 20. | Lawndale | 2.39% | 0.54%(+1.84)#73 | 0.78%(+1.61)#429 |
| 21. | Inglewood | 2.29% | 0.54%(+1.74)#74 | 0.78%(+1.51)#430 |
| 22. | Del Aire | 2.22% | 0.54%(+1.68)#75 | 0.78%(+1.44)#431 |
| 23. | Mountain House | 2.20% | 0.54%(+1.65)#76 | 0.78%(+1.42)#432 |
| 24. | Duarte | 2.19% | 0.54%(+1.64)#77 | 0.78%(+1.41)#433 |
| 25. | Oakland | 2.10% | 0.54%(+1.56)#89 | 0.78%(+1.32)#518 |
| 26. | Forestville | 2.04% | 0.54%(+1.49)#90 | 0.78%(+1.26)#519 |
| 27. | Carson | 2.00% | 0.54%(+1.46)#91 | 0.78%(+1.22)#520 |
| 28. | Inverness | 1.97% | 0.54%(+1.43)#92 | 0.78%(+1.19)#521 |
| 29. | Emeryville | 1.91% | 0.54%(+1.37)#93 | 0.78%(+1.13)#522 |
| 30. | Loma Linda | 1.86% | 0.54%(+1.32)#94 | 0.78%(+1.08)#523 |
| 31. | Lemon Grove | 1.84% | 0.54%(+1.30)#95 | 0.78%(+1.06)#524 |
| 32. | Gardena | 1.84% | 0.54%(+1.29)#96 | 0.78%(+1.06)#525 |
| 33. | Gold River | 1.82% | 0.54%(+1.28)#97 | 0.78%(+1.04)#526 |
| 34. | Happy Camp | 1.77% | 0.54%(+1.22)#98 | 0.78%(+0.988)#527 |
| 35. | Fountain Valley | 1.75% | 0.54%(+1.20)#99 | 0.78%(+0.967)#528 |
| 36. | Yosemite Valley | 1.73% | 0.54%(+1.18)#100 | 0.78%(+0.948)#529 |
| 37. | Fort Irwin | 1.71% | 0.54%(+1.16)#101 | 0.78%(+0.927)#530 |
| 38. | Spring Valley Cdp San Diego County | 1.70% | 0.54%(+1.16)#102 | 0.78%(+0.926)#531 |
| 39. | Tiburon | 1.70% | 0.54%(+1.16)#103 | 0.78%(+0.921)#532 |
| 40. | Santa Venetia | 1.69% | 0.54%(+1.15)#104 | 0.78%(+0.912)#533 |
| 41. | Mendota | 1.69% | 0.54%(+1.15)#105 | 0.78%(+0.911)#534 |
| 42. | Castle Hill | 1.68% | 0.54%(+1.14)#106 | 0.78%(+0.904)#535 |
| 43. | Ashland | 1.63% | 0.54%(+1.08)#107 | 0.78%(+0.848)#536 |
| 44. | Stevenson Ranch | 1.62% | 0.54%(+1.08)#108 | 0.78%(+0.841)#537 |
| 45. | Santa Monica | 1.59% | 0.54%(+1.05)#109 | 0.78%(+0.813)#538 |
| 46. | La Riviera | 1.56% | 0.54%(+1.02)#110 | 0.78%(+0.783)#539 |
| 47. | Fairfax | 1.51% | 0.54%(+0.963)#111 | 0.78%(+0.727)#540 |
| 48. | Tamalpais Homestead Valley | 1.50% | 0.54%(+0.957)#112 | 0.78%(+0.721)#541 |
| 49. | Sierra Madre | 1.50% | 0.54%(+0.955)#113 | 0.78%(+0.718)#542 |
| 50. | Pinole | 1.48% | 0.54%(+0.940)#114 | 0.78%(+0.704)#543 |
| 51. | Calabasas | 1.48% | 0.54%(+0.933)#115 | 0.78%(+0.697)#544 |
| 52. | Muir Beach | 1.47% | 0.54%(+0.931)#116 | 0.78%(+0.695)#545 |
| 53. | Day Valley | 1.45% | 0.54%(+0.902)#117 | 0.78%(+0.666)#546 |
| 54. | Lemoore Station | 1.44% | 0.54%(+0.894)#118 | 0.78%(+0.658)#547 |
| 55. | Alameda | 1.41% | 0.54%(+0.871)#119 | 0.78%(+0.635)#548 |
| 56. | Rosemont | 1.41% | 0.54%(+0.870)#120 | 0.78%(+0.634)#549 |
| 57. | Plymouth | 1.39% | 0.54%(+0.845)#121 | 0.78%(+0.609)#550 |
| 58. | Elk Grove | 1.34% | 0.54%(+0.798)#122 | 0.78%(+0.562)#551 |
| 59. | Culver City | 1.30% | 0.54%(+0.753)#123 | 0.78%(+0.517)#552 |
| 60. | San Pasqual | 1.29% | 0.54%(+0.750)#124 | 0.78%(+0.513)#553 |
| 61. | Blackhawk | 1.29% | 0.54%(+0.747)#125 | 0.78%(+0.510)#554 |
| 62. | San Leandro | 1.29% | 0.54%(+0.746)#126 | 0.78%(+0.510)#555 |
| 63. | Parksdale | 1.28% | 0.54%(+0.737)#127 | 0.78%(+0.501)#556 |
| 64. | Bellflower | 1.24% | 0.54%(+0.699)#128 | 0.78%(+0.463)#557 |
| 65. | Valle Vista | 1.24% | 0.54%(+0.693)#129 | 0.78%(+0.457)#558 |
| 66. | Edwards Afb | 1.22% | 0.54%(+0.682)#130 | 0.78%(+0.446)#559 |
| 67. | San Ramon | 1.22% | 0.54%(+0.674)#131 | 0.78%(+0.438)#560 |
| 68. | University Of California Merced | 1.20% | 0.54%(+0.662)#132 | 0.78%(+0.426)#561 |
| 69. | Pleasant Hill | 1.20% | 0.54%(+0.654)#133 | 0.78%(+0.418)#562 |
| 70. | Lake Forest | 1.20% | 0.54%(+0.652)#134 | 0.78%(+0.416)#563 |
| 71. | Foster City | 1.17% | 0.54%(+0.631)#135 | 0.78%(+0.395)#564 |
| 72. | Cambrian Park | 1.15% | 0.54%(+0.612)#136 | 0.78%(+0.375)#565 |
| 73. | Moreno Valley | 1.14% | 0.54%(+0.593)#137 | 0.78%(+0.357)#566 |
| 74. | Brentwood | 1.11% | 0.54%(+0.570)#138 | 0.78%(+0.333)#567 |
| 75. | Malibu | 1.11% | 0.54%(+0.569)#139 | 0.78%(+0.333)#568 |
| 76. | Coalinga | 1.11% | 0.54%(+0.566)#140 | 0.78%(+0.330)#569 |
| 77. | Imperial | 1.11% | 0.54%(+0.563)#141 | 0.78%(+0.327)#570 |
| 78. | Irvine | 1.11% | 0.54%(+0.563)#142 | 0.78%(+0.326)#571 |
| 79. | Mcswain | 1.07% | 0.54%(+0.528)#143 | 0.78%(+0.292)#572 |
| 80. | Lake San Marcos | 1.05% | 0.54%(+0.511)#144 | 0.78%(+0.275)#573 |
| 81. | Walnut Creek | 1.05% | 0.54%(+0.507)#145 | 0.78%(+0.271)#574 |
| 82. | Loyola | 1.05% | 0.54%(+0.505)#146 | 0.78%(+0.268)#575 |
| 83. | Bradbury | 1.04% | 0.54%(+0.500)#147 | 0.78%(+0.264)#576 |
| 84. | La Canada Flintridge | 1.04% | 0.54%(+0.497)#148 | 0.78%(+0.261)#577 |
| 85. | Palos Verdes Estates | 1.04% | 0.54%(+0.493)#149 | 0.78%(+0.257)#578 |
| 86. | Chino Hills | 1.04% | 0.54%(+0.492)#150 | 0.78%(+0.256)#579 |
| 87. | La Palma | 1.03% | 0.54%(+0.488)#151 | 0.78%(+0.252)#580 |
| 88. | Concord | 1.03% | 0.54%(+0.486)#152 | 0.78%(+0.249)#581 |
| 89. | Meyers | 1.03% | 0.54%(+0.485)#153 | 0.78%(+0.249)#582 |
| 90. | Cherry Valley | 1.02% | 0.54%(+0.476)#154 | 0.78%(+0.240)#583 |
| 91. | Bear Valley Springs | 1.02% | 0.54%(+0.475)#155 | 0.78%(+0.239)#584 |
| 92. | Rancho Cucamonga | 1.01% | 0.54%(+0.471)#156 | 0.78%(+0.235)#585 |
| 93. | Tracy | 1.01% | 0.54%(+0.469)#157 | 0.78%(+0.233)#586 |
| 94. | Rodeo | 1.01% | 0.54%(+0.464)#158 | 0.78%(+0.228)#587 |
| 95. | Richmond | 0.99% | 0.54%(+0.452)#159 | 0.78%(+0.215)#588 |
| 96. | Mammoth Lakes | 0.99% | 0.54%(+0.450)#160 | 0.78%(+0.213)#589 |
| 97. | Coto De Caza | 0.99% | 0.54%(+0.448)#161 | 0.78%(+0.212)#590 |
| 98. | Antioch | 0.99% | 0.54%(+0.448)#162 | 0.78%(+0.212)#591 |
| 99. | Hercules | 0.99% | 0.54%(+0.448)#163 | 0.78%(+0.211)#592 |
| 100. | Penryn | 0.99% | 0.54%(+0.446)#164 | 0.78%(+0.210)#593 |
Common Questions
What are the Top 10 Cities with the Highest Percentage of Immigrants from Africa in California?
Top 10 Cities with the Highest Percentage of Immigrants from Africa in California are:
#1
39.29%
#2
10.42%
#3
8.64%
#4
6.92%
#5
5.73%
#6
4.34%
#7
4.27%
#8
4.09%
#9
3.59%
#10
3.07%
What city has the Highest Percentage of Immigrants from Africa in California?
Fiddletown has the Highest Percentage of Immigrants from Africa in California with 39.29%.
What is the Percentage of Immigrants from Africa in the State of California?
Percentage of Immigrants from Africa in California is 0.54%.
What is the Percentage of Immigrants from Africa in the United States?
Percentage of Immigrants from Africa in the United States is 0.78%.