Cities with the Highest Percentage of South African Population in California
RELATED REPORTS & OPTIONS
South African
California
Compare Cities
Map of Cities with the Highest Percentage of South African Population in California
0.00%
8.00%
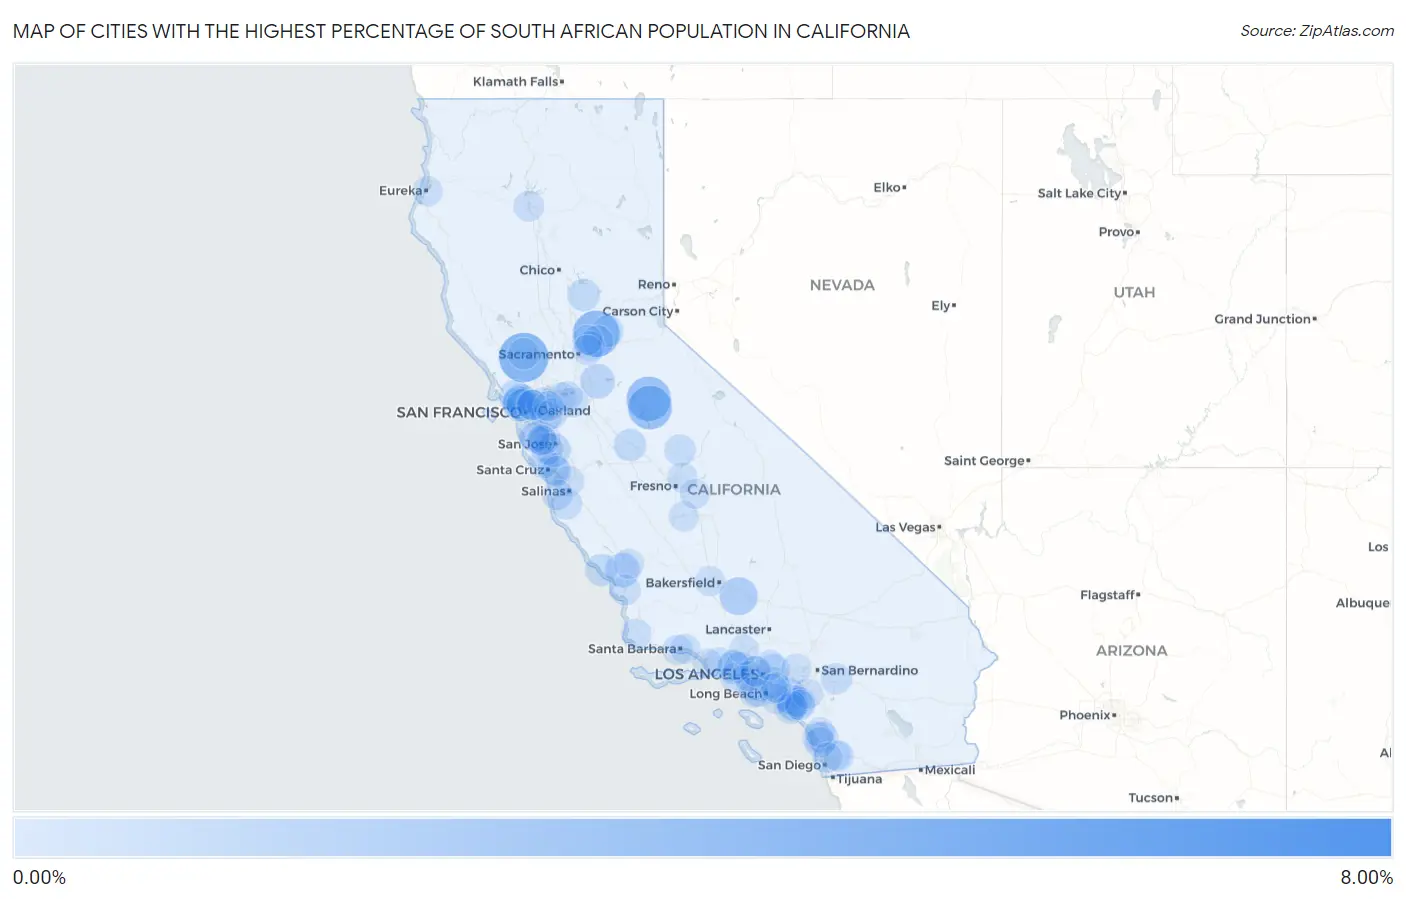
Cities with the Highest Percentage of South African Population in California
| City | South African | vs State | vs National | |
| 1. | Bakersfield Country Club | 7.33% | 0.032%(+7.29)#1 | 0.024%(+7.30)#4 |
| 2. | St Helena | 3.80% | 0.032%(+3.76)#2 | 0.024%(+3.77)#11 |
| 3. | Penryn | 3.24% | 0.032%(+3.21)#3 | 0.024%(+3.21)#19 |
| 4. | Tuolumne City | 2.78% | 0.032%(+2.74)#4 | 0.024%(+2.75)#26 |
| 5. | Groveland | 2.71% | 0.032%(+2.68)#5 | 0.024%(+2.68)#28 |
| 6. | Bear Valley Springs | 1.54% | 0.032%(+1.50)#6 | 0.024%(+1.51)#68 |
| 7. | Meyers | 1.03% | 0.032%(+0.996)#7 | 0.024%(+1.00)#101 |
| 8. | Tiburon | 0.94% | 0.032%(+0.911)#8 | 0.024%(+0.920)#114 |
| 9. | Dogtown | 0.93% | 0.032%(+0.895)#9 | 0.024%(+0.903)#118 |
| 10. | Templeton | 0.89% | 0.032%(+0.862)#10 | 0.024%(+0.870)#119 |
| 11. | Cambrian Park | 0.73% | 0.032%(+0.700)#11 | 0.024%(+0.708)#150 |
| 12. | Agoura Hills | 0.70% | 0.032%(+0.670)#12 | 0.024%(+0.678)#160 |
| 13. | Tamalpais Homestead Valley | 0.52% | 0.032%(+0.493)#13 | 0.024%(+0.501)#205 |
| 14. | Fairfax | 0.50% | 0.032%(+0.470)#14 | 0.024%(+0.478)#211 |
| 15. | Bangor | 0.50% | 0.032%(+0.469)#15 | 0.024%(+0.477)#212 |
| 16. | Mcswain | 0.50% | 0.032%(+0.464)#16 | 0.024%(+0.472)#213 |
| 17. | Mill Valley | 0.49% | 0.032%(+0.461)#17 | 0.024%(+0.469)#217 |
| 18. | Lafayette | 0.49% | 0.032%(+0.454)#18 | 0.024%(+0.462)#221 |
| 19. | Cambria | 0.48% | 0.032%(+0.449)#19 | 0.024%(+0.457)#224 |
| 20. | Larkspur | 0.48% | 0.032%(+0.446)#20 | 0.024%(+0.454)#227 |
| 21. | Temple City | 0.43% | 0.032%(+0.399)#21 | 0.024%(+0.407)#246 |
| 22. | Belvedere | 0.43% | 0.032%(+0.398)#22 | 0.024%(+0.406)#247 |
| 23. | Auburn Lake Trails | 0.42% | 0.032%(+0.384)#23 | 0.024%(+0.392)#258 |
| 24. | North Tustin | 0.37% | 0.032%(+0.338)#24 | 0.024%(+0.346)#277 |
| 25. | Seacliff | 0.37% | 0.032%(+0.334)#25 | 0.024%(+0.342)#284 |
| 26. | Lomita | 0.36% | 0.032%(+0.326)#26 | 0.024%(+0.334)#291 |
| 27. | Granite Bay | 0.35% | 0.032%(+0.315)#27 | 0.024%(+0.323)#294 |
| 28. | Carmel Valley Village | 0.34% | 0.032%(+0.313)#28 | 0.024%(+0.321)#297 |
| 29. | Coarsegold | 0.31% | 0.032%(+0.274)#29 | 0.024%(+0.282)#328 |
| 30. | Saratoga | 0.31% | 0.032%(+0.273)#30 | 0.024%(+0.281)#329 |
| 31. | Manhattan Beach | 0.30% | 0.032%(+0.272)#31 | 0.024%(+0.281)#333 |
| 32. | Emerald Lake Hills | 0.29% | 0.032%(+0.262)#32 | 0.024%(+0.270)#344 |
| 33. | Angwin | 0.29% | 0.032%(+0.261)#33 | 0.024%(+0.269)#345 |
| 34. | Ben Lomond | 0.29% | 0.032%(+0.258)#34 | 0.024%(+0.266)#349 |
| 35. | Cherry Valley | 0.29% | 0.032%(+0.255)#35 | 0.024%(+0.264)#352 |
| 36. | Moraga | 0.27% | 0.032%(+0.241)#36 | 0.024%(+0.249)#360 |
| 37. | Mountain View | 0.27% | 0.032%(+0.239)#37 | 0.024%(+0.248)#364 |
| 38. | Lake San Marcos | 0.27% | 0.032%(+0.237)#38 | 0.024%(+0.246)#368 |
| 39. | Castro Valley | 0.26% | 0.032%(+0.228)#39 | 0.024%(+0.236)#373 |
| 40. | Laguna Woods | 0.26% | 0.032%(+0.226)#40 | 0.024%(+0.234)#375 |
| 41. | Pepperdine University | 0.26% | 0.032%(+0.223)#41 | 0.024%(+0.231)#377 |
| 42. | Calabasas | 0.25% | 0.032%(+0.219)#42 | 0.024%(+0.227)#381 |
| 43. | Irvine | 0.20% | 0.032%(+0.169)#43 | 0.024%(+0.177)#452 |
| 44. | Rancho Santa Margarita | 0.20% | 0.032%(+0.167)#44 | 0.024%(+0.175)#454 |
| 45. | Rancho Mission Viejo | 0.20% | 0.032%(+0.164)#45 | 0.024%(+0.172)#459 |
| 46. | Carlsbad | 0.20% | 0.032%(+0.164)#46 | 0.024%(+0.172)#461 |
| 47. | San Luis Obispo | 0.18% | 0.032%(+0.151)#47 | 0.024%(+0.159)#483 |
| 48. | Redding | 0.18% | 0.032%(+0.146)#48 | 0.024%(+0.154)#495 |
| 49. | Laguna Beach | 0.17% | 0.032%(+0.138)#49 | 0.024%(+0.146)#505 |
| 50. | Santa Fe Springs | 0.17% | 0.032%(+0.138)#50 | 0.024%(+0.146)#506 |
| 51. | Albany | 0.17% | 0.032%(+0.138)#51 | 0.024%(+0.146)#507 |
| 52. | Lake Forest | 0.16% | 0.032%(+0.133)#52 | 0.024%(+0.141)#514 |
| 53. | Santee | 0.16% | 0.032%(+0.129)#53 | 0.024%(+0.137)#519 |
| 54. | Encinitas | 0.16% | 0.032%(+0.124)#54 | 0.024%(+0.133)#531 |
| 55. | West Hollywood | 0.15% | 0.032%(+0.118)#55 | 0.024%(+0.126)#546 |
| 56. | Prunedale | 0.14% | 0.032%(+0.112)#56 | 0.024%(+0.121)#555 |
| 57. | Monterey | 0.14% | 0.032%(+0.111)#57 | 0.024%(+0.119)#561 |
| 58. | Woodside | 0.13% | 0.032%(+0.101)#58 | 0.024%(+0.109)#585 |
| 59. | Lakeside | 0.12% | 0.032%(+0.092)#59 | 0.024%(+0.100)#608 |
| 60. | Temescal Valley | 0.12% | 0.032%(+0.092)#60 | 0.024%(+0.100)#609 |
| 61. | Berkeley | 0.11% | 0.032%(+0.081)#61 | 0.024%(+0.089)#632 |
| 62. | San Ramon | 0.11% | 0.032%(+0.079)#62 | 0.024%(+0.087)#635 |
| 63. | Huntington Beach | 0.10% | 0.032%(+0.073)#63 | 0.024%(+0.081)#653 |
| 64. | Malibu | 0.10% | 0.032%(+0.071)#64 | 0.024%(+0.079)#658 |
| 65. | El Paso De Robles Paso Robles | 0.10% | 0.032%(+0.069)#65 | 0.024%(+0.077)#661 |
| 66. | Rio Del Mar | 0.100% | 0.032%(+0.068)#66 | 0.024%(+0.076)#665 |
| 67. | Vista | 0.100% | 0.032%(+0.067)#67 | 0.024%(+0.076)#666 |
| 68. | Beverly Hills | 0.099% | 0.032%(+0.067)#68 | 0.024%(+0.075)#668 |
| 69. | Los Altos Hills | 0.095% | 0.032%(+0.063)#69 | 0.024%(+0.071)#678 |
| 70. | Lompoc | 0.093% | 0.032%(+0.061)#70 | 0.024%(+0.069)#689 |
| 71. | Citrus Heights | 0.093% | 0.032%(+0.061)#71 | 0.024%(+0.069)#690 |
| 72. | Hawaiian Gardens | 0.093% | 0.032%(+0.061)#72 | 0.024%(+0.069)#692 |
| 73. | Spring Valley Cdp San Diego County | 0.092% | 0.032%(+0.060)#73 | 0.024%(+0.068)#697 |
| 74. | Santa Monica | 0.092% | 0.032%(+0.060)#74 | 0.024%(+0.068)#698 |
| 75. | Eastern Goleta Valley | 0.091% | 0.032%(+0.059)#75 | 0.024%(+0.067)#702 |
| 76. | Oak Park | 0.088% | 0.032%(+0.056)#76 | 0.024%(+0.064)#712 |
| 77. | Palos Verdes Estates | 0.083% | 0.032%(+0.051)#77 | 0.024%(+0.059)#732 |
| 78. | Hanford | 0.083% | 0.032%(+0.051)#78 | 0.024%(+0.059)#734 |
| 79. | San Diego | 0.082% | 0.032%(+0.050)#79 | 0.024%(+0.058)#738 |
| 80. | Santa Barbara | 0.081% | 0.032%(+0.049)#80 | 0.024%(+0.057)#745 |
| 81. | Roseville | 0.081% | 0.032%(+0.048)#81 | 0.024%(+0.057)#750 |
| 82. | Camarillo | 0.079% | 0.032%(+0.047)#82 | 0.024%(+0.055)#755 |
| 83. | Rosedale | 0.078% | 0.032%(+0.046)#83 | 0.024%(+0.054)#760 |
| 84. | Stevenson Ranch | 0.078% | 0.032%(+0.046)#84 | 0.024%(+0.054)#762 |
| 85. | Palo Alto | 0.078% | 0.032%(+0.046)#85 | 0.024%(+0.054)#763 |
| 86. | Pasadena | 0.076% | 0.032%(+0.043)#86 | 0.024%(+0.052)#771 |
| 87. | Upland | 0.075% | 0.032%(+0.043)#87 | 0.024%(+0.051)#773 |
| 88. | Oxnard | 0.072% | 0.032%(+0.040)#88 | 0.024%(+0.048)#784 |
| 89. | Montecito | 0.070% | 0.032%(+0.038)#89 | 0.024%(+0.046)#792 |
| 90. | Oakley | 0.069% | 0.032%(+0.037)#90 | 0.024%(+0.045)#801 |
| 91. | Aliso Viejo | 0.067% | 0.032%(+0.035)#91 | 0.024%(+0.043)#808 |
| 92. | Antioch | 0.067% | 0.032%(+0.035)#92 | 0.024%(+0.043)#810 |
| 93. | Buena Park | 0.066% | 0.032%(+0.034)#93 | 0.024%(+0.042)#812 |
| 94. | Discovery Bay | 0.065% | 0.032%(+0.033)#94 | 0.024%(+0.041)#816 |
| 95. | Eureka | 0.064% | 0.032%(+0.032)#95 | 0.024%(+0.040)#823 |
| 96. | Coto De Caza | 0.064% | 0.032%(+0.032)#96 | 0.024%(+0.040)#826 |
| 97. | Clovis | 0.064% | 0.032%(+0.032)#97 | 0.024%(+0.040)#827 |
| 98. | Reedley | 0.063% | 0.032%(+0.031)#98 | 0.024%(+0.039)#829 |
| 99. | Alamo | 0.063% | 0.032%(+0.031)#99 | 0.024%(+0.039)#832 |
| 100. | Carmichael | 0.060% | 0.032%(+0.028)#100 | 0.024%(+0.036)#847 |
Common Questions
What are the Top 10 Cities with the Highest Percentage of South African Population in California?
Top 10 Cities with the Highest Percentage of South African Population in California are:
#1
3.80%
#2
3.24%
#3
2.78%
#4
2.71%
#5
1.54%
#6
0.94%
#7
0.93%
#8
0.89%
#9
0.73%
#10
0.70%
What city has the Highest Percentage of South African Population in California?
St Helena has the Highest Percentage of South African Population in California with 3.80%.
What is the Percentage of South African Population in the State of California?
Percentage of South African Population in California is 0.032%.
What is the Percentage of South African Population in the United States?
Percentage of South African Population in the United States is 0.024%.