Cities with the Most Immigrants from Eastern Europe in California
RELATED REPORTS & OPTIONS
Eastern Europe
California
Compare Cities
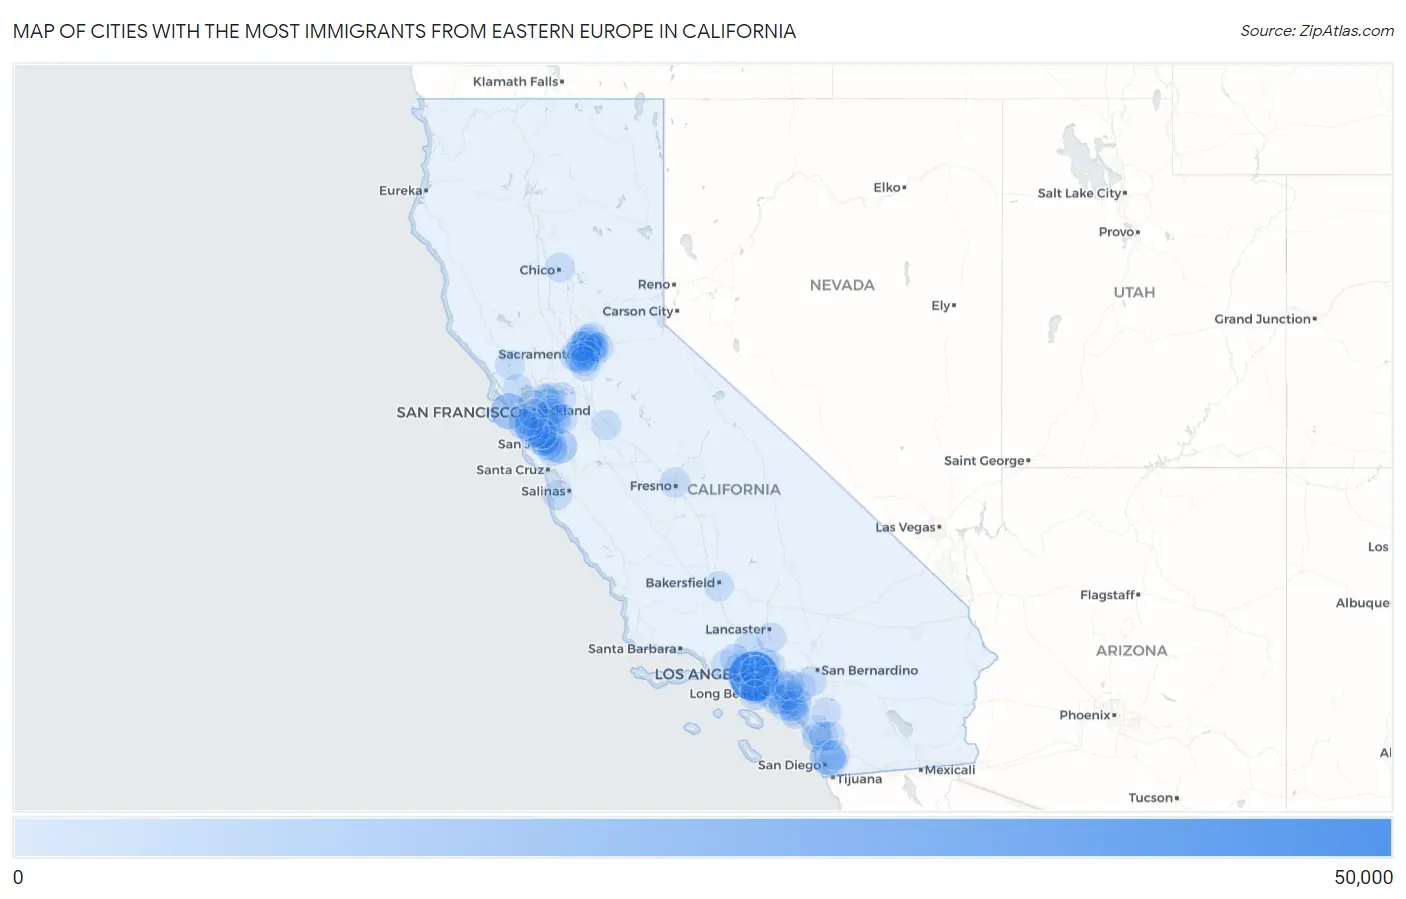
Map of Cities with the Most Immigrants from Eastern Europe in California
0
50,000
Cities with the Most Immigrants from Eastern Europe in California
| City | Eastern Europe | vs State | vs National | |
| 1. | Los Angeles | 45,575 | 268,790(16.96%)#1 | 2,208,794(2.06%)#3 |
| 2. | San Francisco | 13,995 | 268,790(5.21%)#2 | 2,208,794(0.63%)#5 |
| 3. | San Diego | 12,340 | 268,790(4.59%)#3 | 2,208,794(0.56%)#7 |
| 4. | San Jose | 9,827 | 268,790(3.66%)#4 | 2,208,794(0.44%)#9 |
| 5. | Antelope | 5,153 | 268,790(1.92%)#5 | 2,208,794(0.23%)#25 |
| 6. | Sacramento | 5,137 | 268,790(1.91%)#6 | 2,208,794(0.23%)#26 |
| 7. | North Highlands | 4,816 | 268,790(1.79%)#7 | 2,208,794(0.22%)#29 |
| 8. | Citrus Heights | 4,296 | 268,790(1.60%)#8 | 2,208,794(0.19%)#35 |
| 9. | Irvine | 4,157 | 268,790(1.55%)#9 | 2,208,794(0.19%)#38 |
| 10. | Rancho Cordova | 3,568 | 268,790(1.33%)#10 | 2,208,794(0.16%)#53 |
| 11. | Carmichael | 3,368 | 268,790(1.25%)#11 | 2,208,794(0.15%)#57 |
| 12. | Glendale | 3,214 | 268,790(1.20%)#12 | 2,208,794(0.15%)#58 |
| 13. | Foothill Farms | 3,084 | 268,790(1.15%)#13 | 2,208,794(0.14%)#63 |
| 14. | Mountain View | 2,697 | 268,790(1.00%)#14 | 2,208,794(0.12%)#72 |
| 15. | Arden Arcade | 2,405 | 268,790(0.89%)#15 | 2,208,794(0.11%)#90 |
| 16. | Santa Monica | 2,388 | 268,790(0.89%)#16 | 2,208,794(0.11%)#92 |
| 17. | Sunnyvale | 2,302 | 268,790(0.86%)#17 | 2,208,794(0.10%)#98 |
| 18. | West Hollywood | 2,298 | 268,790(0.85%)#18 | 2,208,794(0.10%)#99 |
| 19. | Huntington Beach | 2,193 | 268,790(0.82%)#19 | 2,208,794(0.10%)#105 |
| 20. | West Sacramento | 2,173 | 268,790(0.81%)#20 | 2,208,794(0.10%)#108 |
| 21. | Santa Clara | 2,024 | 268,790(0.75%)#21 | 2,208,794(0.09%)#121 |
| 22. | Roseville | 2,022 | 268,790(0.75%)#22 | 2,208,794(0.09%)#122 |
| 23. | Long Beach | 1,945 | 268,790(0.72%)#23 | 2,208,794(0.09%)#132 |
| 24. | San Mateo | 1,865 | 268,790(0.69%)#24 | 2,208,794(0.08%)#138 |
| 25. | Walnut Creek | 1,857 | 268,790(0.69%)#25 | 2,208,794(0.08%)#139 |
| 26. | Palo Alto | 1,776 | 268,790(0.66%)#26 | 2,208,794(0.08%)#149 |
| 27. | Oakland | 1,670 | 268,790(0.62%)#27 | 2,208,794(0.08%)#158 |
| 28. | Carlsbad | 1,566 | 268,790(0.58%)#28 | 2,208,794(0.07%)#175 |
| 29. | Redwood City | 1,556 | 268,790(0.58%)#29 | 2,208,794(0.07%)#176 |
| 30. | Fremont | 1,494 | 268,790(0.56%)#30 | 2,208,794(0.07%)#186 |
| 31. | Anaheim | 1,381 | 268,790(0.51%)#31 | 2,208,794(0.06%)#207 |
| 32. | Concord | 1,379 | 268,790(0.51%)#32 | 2,208,794(0.06%)#208 |
| 33. | Santa Clarita | 1,354 | 268,790(0.50%)#33 | 2,208,794(0.06%)#212 |
| 34. | Redondo Beach | 1,281 | 268,790(0.48%)#34 | 2,208,794(0.06%)#220 |
| 35. | Torrance | 1,251 | 268,790(0.47%)#35 | 2,208,794(0.06%)#226 |
| 36. | Mission Viejo | 1,222 | 268,790(0.45%)#36 | 2,208,794(0.06%)#231 |
| 37. | Newport Beach | 1,219 | 268,790(0.45%)#37 | 2,208,794(0.06%)#233 |
| 38. | Berkeley | 1,202 | 268,790(0.45%)#38 | 2,208,794(0.05%)#239 |
| 39. | Rocklin | 1,186 | 268,790(0.44%)#39 | 2,208,794(0.05%)#244 |
| 40. | Los Gatos | 1,115 | 268,790(0.41%)#40 | 2,208,794(0.05%)#261 |
| 41. | Castro Valley | 1,068 | 268,790(0.40%)#41 | 2,208,794(0.05%)#274 |
| 42. | Cupertino | 1,068 | 268,790(0.40%)#42 | 2,208,794(0.05%)#275 |
| 43. | Fullerton | 1,052 | 268,790(0.39%)#43 | 2,208,794(0.05%)#278 |
| 44. | Laguna Niguel | 1,049 | 268,790(0.39%)#44 | 2,208,794(0.05%)#281 |
| 45. | Oceanside | 1,018 | 268,790(0.38%)#45 | 2,208,794(0.05%)#299 |
| 46. | Pasadena | 1,018 | 268,790(0.38%)#46 | 2,208,794(0.05%)#300 |
| 47. | Fair Oaks | 1,008 | 268,790(0.38%)#47 | 2,208,794(0.05%)#303 |
| 48. | Orangevale | 971 | 268,790(0.36%)#48 | 2,208,794(0.04%)#315 |
| 49. | San Ramon | 963 | 268,790(0.36%)#49 | 2,208,794(0.04%)#317 |
| 50. | Calabasas | 962 | 268,790(0.36%)#50 | 2,208,794(0.04%)#319 |
| 51. | Daly City | 951 | 268,790(0.35%)#51 | 2,208,794(0.04%)#325 |
| 52. | Fresno | 923 | 268,790(0.34%)#52 | 2,208,794(0.04%)#333 |
| 53. | Lake Forest | 889 | 268,790(0.33%)#53 | 2,208,794(0.04%)#348 |
| 54. | Dublin | 888 | 268,790(0.33%)#54 | 2,208,794(0.04%)#350 |
| 55. | Costa Mesa | 878 | 268,790(0.33%)#55 | 2,208,794(0.04%)#356 |
| 56. | Los Altos | 878 | 268,790(0.33%)#56 | 2,208,794(0.04%)#357 |
| 57. | Campbell | 859 | 268,790(0.32%)#57 | 2,208,794(0.04%)#366 |
| 58. | Foster City | 843 | 268,790(0.31%)#58 | 2,208,794(0.04%)#376 |
| 59. | Pleasanton | 841 | 268,790(0.31%)#59 | 2,208,794(0.04%)#378 |
| 60. | Riverside | 833 | 268,790(0.31%)#60 | 2,208,794(0.04%)#379 |
| 61. | Thousand Oaks | 828 | 268,790(0.31%)#61 | 2,208,794(0.04%)#380 |
| 62. | Hayward | 814 | 268,790(0.30%)#62 | 2,208,794(0.04%)#387 |
| 63. | Menlo Park | 810 | 268,790(0.30%)#63 | 2,208,794(0.04%)#391 |
| 64. | Elk Grove | 799 | 268,790(0.30%)#64 | 2,208,794(0.04%)#397 |
| 65. | La Mesa | 799 | 268,790(0.30%)#65 | 2,208,794(0.04%)#398 |
| 66. | Temecula | 796 | 268,790(0.30%)#66 | 2,208,794(0.04%)#399 |
| 67. | Beverly Hills | 787 | 268,790(0.29%)#67 | 2,208,794(0.04%)#404 |
| 68. | Escondido | 744 | 268,790(0.28%)#68 | 2,208,794(0.03%)#422 |
| 69. | Modesto | 739 | 268,790(0.27%)#69 | 2,208,794(0.03%)#428 |
| 70. | Rio Linda | 729 | 268,790(0.27%)#70 | 2,208,794(0.03%)#433 |
| 71. | San Marcos | 713 | 268,790(0.27%)#71 | 2,208,794(0.03%)#440 |
| 72. | Simi Valley | 710 | 268,790(0.26%)#72 | 2,208,794(0.03%)#442 |
| 73. | Downey | 693 | 268,790(0.26%)#73 | 2,208,794(0.03%)#454 |
| 74. | East Palo Alto | 690 | 268,790(0.26%)#74 | 2,208,794(0.03%)#456 |
| 75. | Burlingame | 676 | 268,790(0.25%)#75 | 2,208,794(0.03%)#460 |
| 76. | Folsom | 667 | 268,790(0.25%)#76 | 2,208,794(0.03%)#465 |
| 77. | Aliso Viejo | 664 | 268,790(0.25%)#77 | 2,208,794(0.03%)#470 |
| 78. | Rancho Palos Verdes | 661 | 268,790(0.25%)#78 | 2,208,794(0.03%)#472 |
| 79. | Pleasant Hill | 659 | 268,790(0.25%)#79 | 2,208,794(0.03%)#476 |
| 80. | Rosemont | 646 | 268,790(0.24%)#80 | 2,208,794(0.03%)#484 |
| 81. | San Carlos | 635 | 268,790(0.24%)#81 | 2,208,794(0.03%)#491 |
| 82. | South San Francisco | 625 | 268,790(0.23%)#82 | 2,208,794(0.03%)#502 |
| 83. | Santa Rosa | 607 | 268,790(0.23%)#83 | 2,208,794(0.03%)#512 |
| 84. | Tustin | 604 | 268,790(0.22%)#84 | 2,208,794(0.03%)#515 |
| 85. | Danville | 572 | 268,790(0.21%)#85 | 2,208,794(0.03%)#544 |
| 86. | Novato | 571 | 268,790(0.21%)#86 | 2,208,794(0.03%)#549 |
| 87. | Florin | 548 | 268,790(0.20%)#87 | 2,208,794(0.02%)#565 |
| 88. | Palmdale | 545 | 268,790(0.20%)#88 | 2,208,794(0.02%)#568 |
| 89. | Lemon Hill | 541 | 268,790(0.20%)#89 | 2,208,794(0.02%)#572 |
| 90. | Monterey | 531 | 268,790(0.20%)#90 | 2,208,794(0.02%)#585 |
| 91. | Antioch | 528 | 268,790(0.20%)#91 | 2,208,794(0.02%)#587 |
| 92. | Bakersfield | 519 | 268,790(0.19%)#92 | 2,208,794(0.02%)#596 |
| 93. | Livermore | 519 | 268,790(0.19%)#93 | 2,208,794(0.02%)#597 |
| 94. | Santee | 519 | 268,790(0.19%)#94 | 2,208,794(0.02%)#599 |
| 95. | Corona | 515 | 268,790(0.19%)#95 | 2,208,794(0.02%)#602 |
| 96. | Chico | 504 | 268,790(0.19%)#96 | 2,208,794(0.02%)#618 |
| 97. | Dana Point | 499 | 268,790(0.19%)#97 | 2,208,794(0.02%)#626 |
| 98. | Alameda | 495 | 268,790(0.18%)#98 | 2,208,794(0.02%)#627 |
| 99. | Pacifica | 490 | 268,790(0.18%)#99 | 2,208,794(0.02%)#634 |
| 100. | Yorba Linda | 488 | 268,790(0.18%)#100 | 2,208,794(0.02%)#637 |
Common Questions
What are the Top 10 Cities with the Most Immigrants from Eastern Europe in California?
Top 10 Cities with the Most Immigrants from Eastern Europe in California are:
#1
45,575
#2
13,995
#3
12,340
#4
9,827
#5
5,153
#6
5,137
#7
4,816
#8
4,296
#9
4,157
#10
3,568
What city has the Most Immigrants from Eastern Europe in California?
Los Angeles has the Most Immigrants from Eastern Europe in California with 45,575.
What is the Total Immigrants from Eastern Europe in the State of California?
Total Immigrants from Eastern Europe in California is 268,790.
What is the Total Immigrants from Eastern Europe in the United States?
Total Immigrants from Eastern Europe in the United States is 2,208,794.