Cities with the Largest Cherokee Community in California
RELATED REPORTS & OPTIONS
Cherokee
California
Compare Cities
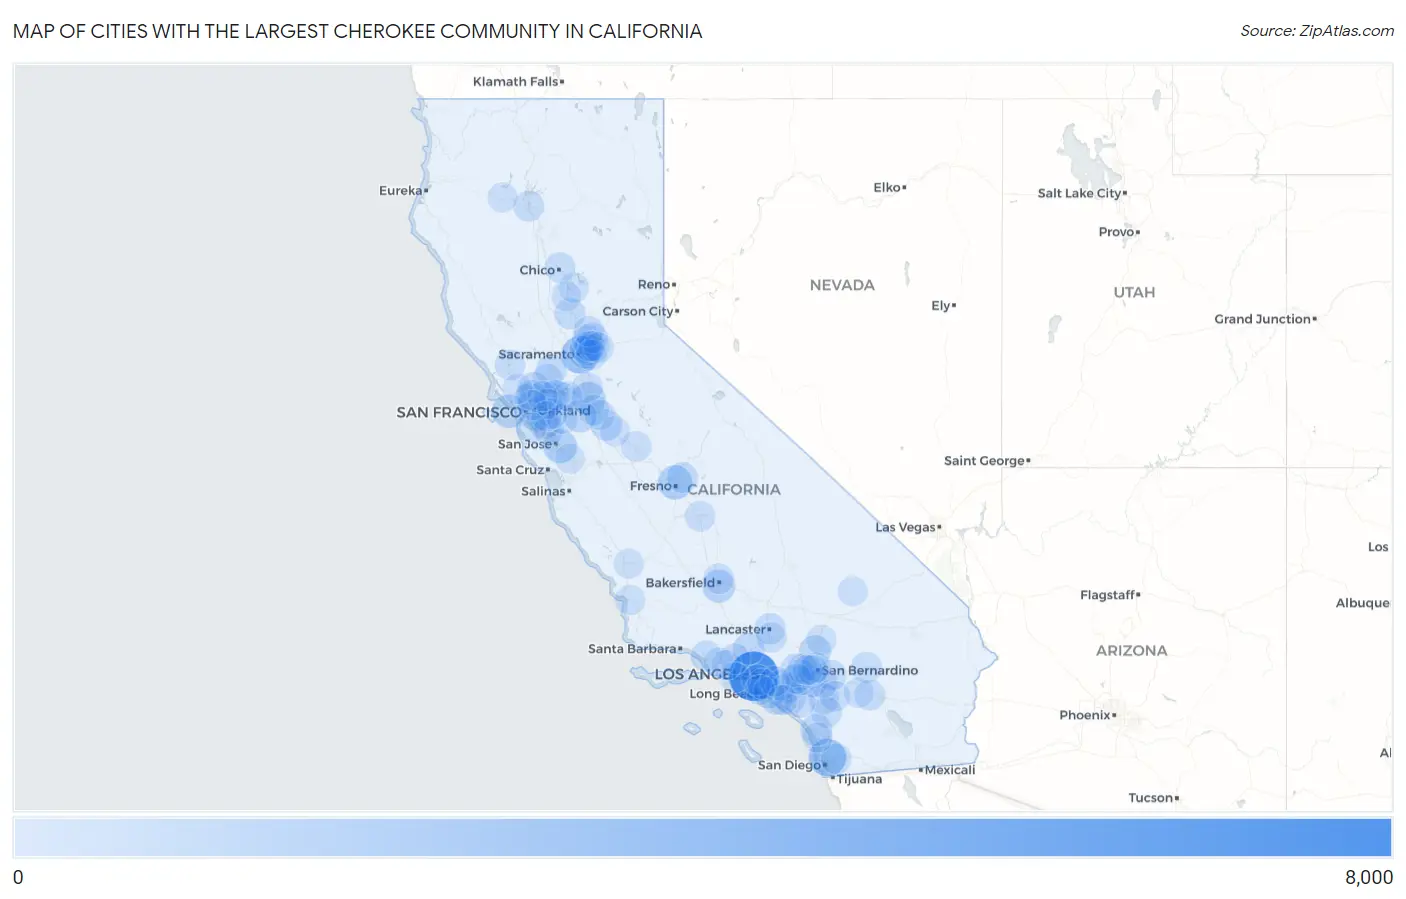
Map of Cities with the Largest Cherokee Community in California
0
8,000
Cities with the Largest Cherokee Community in California
| City | Cherokee | vs State | vs National | |
| 1. | Los Angeles | 7,188 | 111,347(6.46%)#1 | 1,150,610(0.62%)#4 |
| 2. | Sacramento | 2,792 | 111,347(2.51%)#2 | 1,150,610(0.24%)#23 |
| 3. | San Diego | 2,791 | 111,347(2.51%)#3 | 1,150,610(0.24%)#24 |
| 4. | Fresno | 1,657 | 111,347(1.49%)#4 | 1,150,610(0.14%)#47 |
| 5. | San Jose | 1,486 | 111,347(1.33%)#5 | 1,150,610(0.13%)#54 |
| 6. | Oakland | 1,463 | 111,347(1.31%)#6 | 1,150,610(0.13%)#56 |
| 7. | Stockton | 1,443 | 111,347(1.30%)#7 | 1,150,610(0.13%)#58 |
| 8. | San Francisco | 1,394 | 111,347(1.25%)#8 | 1,150,610(0.12%)#64 |
| 9. | Bakersfield | 1,212 | 111,347(1.09%)#9 | 1,150,610(0.11%)#78 |
| 10. | Tracy | 1,066 | 111,347(0.96%)#10 | 1,150,610(0.09%)#91 |
| 11. | Arden Arcade | 925 | 111,347(0.83%)#11 | 1,150,610(0.08%)#111 |
| 12. | Hesperia | 917 | 111,347(0.82%)#12 | 1,150,610(0.08%)#114 |
| 13. | Riverside | 909 | 111,347(0.82%)#13 | 1,150,610(0.08%)#116 |
| 14. | Huntington Beach | 829 | 111,347(0.74%)#14 | 1,150,610(0.07%)#128 |
| 15. | Oceanside | 814 | 111,347(0.73%)#15 | 1,150,610(0.07%)#132 |
| 16. | Santa Clarita | 800 | 111,347(0.72%)#16 | 1,150,610(0.07%)#138 |
| 17. | Long Beach | 790 | 111,347(0.71%)#17 | 1,150,610(0.07%)#141 |
| 18. | Modesto | 705 | 111,347(0.63%)#18 | 1,150,610(0.06%)#158 |
| 19. | Lancaster | 641 | 111,347(0.58%)#19 | 1,150,610(0.06%)#171 |
| 20. | Richmond | 630 | 111,347(0.57%)#20 | 1,150,610(0.05%)#175 |
| 21. | Irvine | 619 | 111,347(0.56%)#21 | 1,150,610(0.05%)#179 |
| 22. | Vacaville | 610 | 111,347(0.55%)#22 | 1,150,610(0.05%)#181 |
| 23. | San Buenaventura Ventura | 603 | 111,347(0.54%)#23 | 1,150,610(0.05%)#182 |
| 24. | Concord | 591 | 111,347(0.53%)#24 | 1,150,610(0.05%)#185 |
| 25. | Yuba City | 583 | 111,347(0.52%)#25 | 1,150,610(0.05%)#192 |
| 26. | Clovis | 580 | 111,347(0.52%)#26 | 1,150,610(0.05%)#194 |
| 27. | Upland | 543 | 111,347(0.49%)#27 | 1,150,610(0.05%)#204 |
| 28. | Vallejo | 530 | 111,347(0.48%)#28 | 1,150,610(0.05%)#214 |
| 29. | Redding | 524 | 111,347(0.47%)#29 | 1,150,610(0.05%)#218 |
| 30. | North Highlands | 519 | 111,347(0.47%)#30 | 1,150,610(0.05%)#223 |
| 31. | Carmichael | 516 | 111,347(0.46%)#31 | 1,150,610(0.04%)#227 |
| 32. | Roseville | 502 | 111,347(0.45%)#32 | 1,150,610(0.04%)#236 |
| 33. | Ontario | 500 | 111,347(0.45%)#33 | 1,150,610(0.04%)#237 |
| 34. | Hayward | 484 | 111,347(0.43%)#34 | 1,150,610(0.04%)#241 |
| 35. | Simi Valley | 472 | 111,347(0.42%)#35 | 1,150,610(0.04%)#245 |
| 36. | Inglewood | 470 | 111,347(0.42%)#36 | 1,150,610(0.04%)#247 |
| 37. | Yucca Valley | 467 | 111,347(0.42%)#37 | 1,150,610(0.04%)#251 |
| 38. | Antioch | 455 | 111,347(0.41%)#38 | 1,150,610(0.04%)#260 |
| 39. | Manteca | 455 | 111,347(0.41%)#39 | 1,150,610(0.04%)#261 |
| 40. | Menifee | 454 | 111,347(0.41%)#40 | 1,150,610(0.04%)#263 |
| 41. | Palm Desert | 450 | 111,347(0.40%)#41 | 1,150,610(0.04%)#267 |
| 42. | Temecula | 435 | 111,347(0.39%)#42 | 1,150,610(0.04%)#283 |
| 43. | Chico | 429 | 111,347(0.39%)#43 | 1,150,610(0.04%)#288 |
| 44. | Santa Rosa | 428 | 111,347(0.38%)#44 | 1,150,610(0.04%)#290 |
| 45. | Fullerton | 427 | 111,347(0.38%)#45 | 1,150,610(0.04%)#292 |
| 46. | Yucaipa | 426 | 111,347(0.38%)#46 | 1,150,610(0.04%)#294 |
| 47. | El Cajon | 424 | 111,347(0.38%)#47 | 1,150,610(0.04%)#297 |
| 48. | Moreno Valley | 415 | 111,347(0.37%)#48 | 1,150,610(0.04%)#303 |
| 49. | Rocklin | 412 | 111,347(0.37%)#49 | 1,150,610(0.04%)#305 |
| 50. | Orangevale | 404 | 111,347(0.36%)#50 | 1,150,610(0.04%)#319 |
| 51. | Fremont | 392 | 111,347(0.35%)#51 | 1,150,610(0.03%)#334 |
| 52. | Lodi | 392 | 111,347(0.35%)#52 | 1,150,610(0.03%)#335 |
| 53. | Oildale | 386 | 111,347(0.35%)#53 | 1,150,610(0.03%)#345 |
| 54. | Visalia | 383 | 111,347(0.34%)#54 | 1,150,610(0.03%)#352 |
| 55. | Merced | 377 | 111,347(0.34%)#55 | 1,150,610(0.03%)#360 |
| 56. | Anaheim | 375 | 111,347(0.34%)#56 | 1,150,610(0.03%)#363 |
| 57. | Lincoln | 375 | 111,347(0.34%)#57 | 1,150,610(0.03%)#364 |
| 58. | Hemet | 372 | 111,347(0.33%)#58 | 1,150,610(0.03%)#368 |
| 59. | Rancho Santa Margarita | 365 | 111,347(0.33%)#59 | 1,150,610(0.03%)#375 |
| 60. | Fairfield | 364 | 111,347(0.33%)#60 | 1,150,610(0.03%)#376 |
| 61. | West Rancho Dominguez | 363 | 111,347(0.33%)#61 | 1,150,610(0.03%)#378 |
| 62. | Rancho Cordova | 356 | 111,347(0.32%)#62 | 1,150,610(0.03%)#386 |
| 63. | Eastvale | 356 | 111,347(0.32%)#63 | 1,150,610(0.03%)#387 |
| 64. | Pinole | 349 | 111,347(0.31%)#64 | 1,150,610(0.03%)#400 |
| 65. | Folsom | 341 | 111,347(0.31%)#65 | 1,150,610(0.03%)#408 |
| 66. | Livermore | 340 | 111,347(0.31%)#66 | 1,150,610(0.03%)#411 |
| 67. | Citrus Heights | 325 | 111,347(0.29%)#67 | 1,150,610(0.03%)#436 |
| 68. | Pittsburg | 314 | 111,347(0.28%)#68 | 1,150,610(0.03%)#448 |
| 69. | Malibu | 308 | 111,347(0.28%)#69 | 1,150,610(0.03%)#458 |
| 70. | Palmdale | 306 | 111,347(0.27%)#70 | 1,150,610(0.03%)#460 |
| 71. | South Whittier | 305 | 111,347(0.27%)#71 | 1,150,610(0.03%)#462 |
| 72. | San Ramon | 300 | 111,347(0.27%)#72 | 1,150,610(0.03%)#474 |
| 73. | Carlsbad | 299 | 111,347(0.27%)#73 | 1,150,610(0.03%)#475 |
| 74. | El Paso De Robles Paso Robles | 298 | 111,347(0.27%)#74 | 1,150,610(0.03%)#478 |
| 75. | Palm Springs | 297 | 111,347(0.27%)#75 | 1,150,610(0.03%)#480 |
| 76. | Oroville | 294 | 111,347(0.26%)#76 | 1,150,610(0.03%)#488 |
| 77. | Arroyo Grande | 290 | 111,347(0.26%)#77 | 1,150,610(0.03%)#494 |
| 78. | Walnut Creek | 283 | 111,347(0.25%)#78 | 1,150,610(0.02%)#508 |
| 79. | Rancho Cucamonga | 282 | 111,347(0.25%)#79 | 1,150,610(0.02%)#511 |
| 80. | Castro Valley | 281 | 111,347(0.25%)#80 | 1,150,610(0.02%)#516 |
| 81. | Berkeley | 273 | 111,347(0.25%)#81 | 1,150,610(0.02%)#534 |
| 82. | Apple Valley | 270 | 111,347(0.24%)#82 | 1,150,610(0.02%)#538 |
| 83. | Gridley | 268 | 111,347(0.24%)#83 | 1,150,610(0.02%)#542 |
| 84. | Morgan Hill | 267 | 111,347(0.24%)#84 | 1,150,610(0.02%)#543 |
| 85. | San Mateo | 262 | 111,347(0.24%)#85 | 1,150,610(0.02%)#550 |
| 86. | Oakley | 261 | 111,347(0.23%)#86 | 1,150,610(0.02%)#556 |
| 87. | Ripon | 260 | 111,347(0.23%)#87 | 1,150,610(0.02%)#558 |
| 88. | Chino | 257 | 111,347(0.23%)#88 | 1,150,610(0.02%)#566 |
| 89. | Turlock | 256 | 111,347(0.23%)#89 | 1,150,610(0.02%)#570 |
| 90. | Camarillo | 251 | 111,347(0.23%)#90 | 1,150,610(0.02%)#583 |
| 91. | Fort Irwin | 251 | 111,347(0.23%)#91 | 1,150,610(0.02%)#586 |
| 92. | Martinez | 249 | 111,347(0.22%)#92 | 1,150,610(0.02%)#590 |
| 93. | San Bernardino | 248 | 111,347(0.22%)#93 | 1,150,610(0.02%)#593 |
| 94. | Novato | 247 | 111,347(0.22%)#94 | 1,150,610(0.02%)#599 |
| 95. | Thousand Oaks | 244 | 111,347(0.22%)#95 | 1,150,610(0.02%)#606 |
| 96. | Costa Mesa | 244 | 111,347(0.22%)#96 | 1,150,610(0.02%)#607 |
| 97. | West Carson | 244 | 111,347(0.22%)#97 | 1,150,610(0.02%)#611 |
| 98. | Rialto | 243 | 111,347(0.22%)#98 | 1,150,610(0.02%)#615 |
| 99. | Fontana | 242 | 111,347(0.22%)#99 | 1,150,610(0.02%)#617 |
| 100. | Lewiston | 241 | 111,347(0.22%)#100 | 1,150,610(0.02%)#625 |
Common Questions
What are the Top 10 Cities with the Largest Cherokee Community in California?
Top 10 Cities with the Largest Cherokee Community in California are:
#1
7,188
#2
2,792
#3
2,791
#4
1,657
#5
1,486
#6
1,463
#7
1,443
#8
1,394
#9
1,212
#10
1,066
What city has the Largest Cherokee Community in California?
Los Angeles has the Largest Cherokee Community in California with 7,188.
What is the Total Cherokee Population in the State of California?
Total Cherokee Population in California is 111,347.
What is the Total Cherokee Population in the United States?
Total Cherokee Population in the United States is 1,150,610.