Desert Edge, CA Map & Demographics
Desert Edge Map
Desert Edge Overview
$26,430
PER CAPITA INCOME
$51,318
AVG FAMILY INCOME
$38,668
AVG HOUSEHOLD INCOME
45.1%
WAGE / INCOME GAP [ % ]
54.9¢/ $1
WAGE / INCOME GAP [ $ ]
0.41
INEQUALITY / GINI INDEX
3,715
TOTAL POPULATION
1,969
MALE POPULATION
1,746
FEMALE POPULATION
112.77
MALES / 100 FEMALES
88.67
FEMALES / 100 MALES
64.2
MEDIAN AGE
2.5
AVG FAMILY SIZE
1.9
AVG HOUSEHOLD SIZE
1,068
LABOR FORCE [ PEOPLE ]
31.1%
PERCENT IN LABOR FORCE
9.5%
UNEMPLOYMENT RATE
Income in Desert Edge
Income Overview in Desert Edge
Per Capita Income in Desert Edge is $26,430, while median incomes of families and households are $51,318 and $38,668 respectively.
| Characteristic | Number | Measure |
| Per Capita Income | 3,715 | $26,430 |
| Median Family Income | 912 | $51,318 |
| Mean Family Income | 912 | $59,617 |
| Median Household Income | 1,935 | $38,668 |
| Mean Household Income | 1,935 | $49,545 |
| Income Deficit | 912 | $0 |
| Wage / Income Gap (%) | 3,715 | 45.07% |
| Wage / Income Gap ($) | 3,715 | 54.93¢ per $1 |
| Gini / Inequality Index | 3,715 | 0.41 |
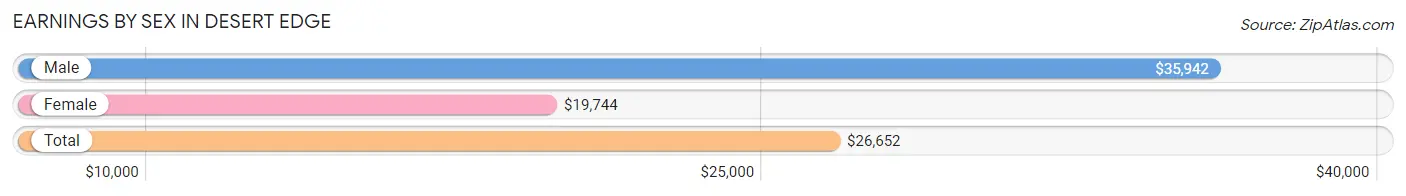
Earnings by Sex in Desert Edge
Average Earnings in Desert Edge are $26,652, $35,942 for men and $19,744 for women, a difference of 45.1%.
| Sex | Number | Average Earnings |
| Male | 674 (53.7%) | $35,942 |
| Female | 582 (46.3%) | $19,744 |
| Total | 1,256 (100.0%) | $26,652 |
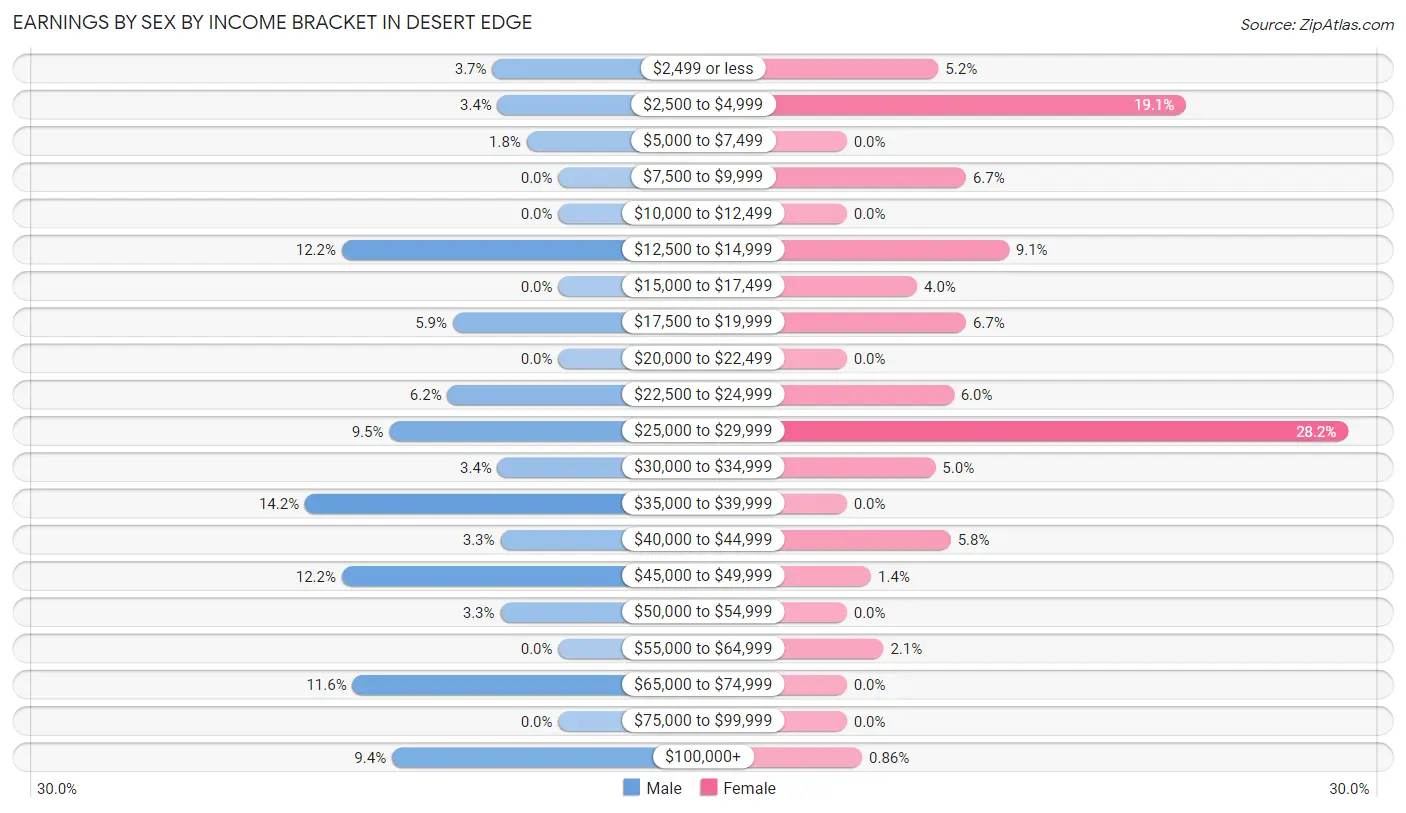
Earnings by Sex by Income Bracket in Desert Edge
The most common earnings brackets in Desert Edge are $35,000 to $39,999 for men (96 | 14.2%) and $25,000 to $29,999 for women (164 | 28.2%).
| Income | Male | Female |
| $2,499 or less | 25 (3.7%) | 30 (5.1%) |
| $2,500 to $4,999 | 23 (3.4%) | 111 (19.1%) |
| $5,000 to $7,499 | 12 (1.8%) | 0 (0.0%) |
| $7,500 to $9,999 | 0 (0.0%) | 39 (6.7%) |
| $10,000 to $12,499 | 0 (0.0%) | 0 (0.0%) |
| $12,500 to $14,999 | 82 (12.2%) | 53 (9.1%) |
| $15,000 to $17,499 | 0 (0.0%) | 23 (4.0%) |
| $17,500 to $19,999 | 40 (5.9%) | 39 (6.7%) |
| $20,000 to $22,499 | 0 (0.0%) | 0 (0.0%) |
| $22,500 to $24,999 | 42 (6.2%) | 35 (6.0%) |
| $25,000 to $29,999 | 64 (9.5%) | 164 (28.2%) |
| $30,000 to $34,999 | 23 (3.4%) | 29 (5.0%) |
| $35,000 to $39,999 | 96 (14.2%) | 0 (0.0%) |
| $40,000 to $44,999 | 22 (3.3%) | 34 (5.8%) |
| $45,000 to $49,999 | 82 (12.2%) | 8 (1.4%) |
| $50,000 to $54,999 | 22 (3.3%) | 0 (0.0%) |
| $55,000 to $64,999 | 0 (0.0%) | 12 (2.1%) |
| $65,000 to $74,999 | 78 (11.6%) | 0 (0.0%) |
| $75,000 to $99,999 | 0 (0.0%) | 0 (0.0%) |
| $100,000+ | 63 (9.3%) | 5 (0.9%) |
| Total | 674 (100.0%) | 582 (100.0%) |
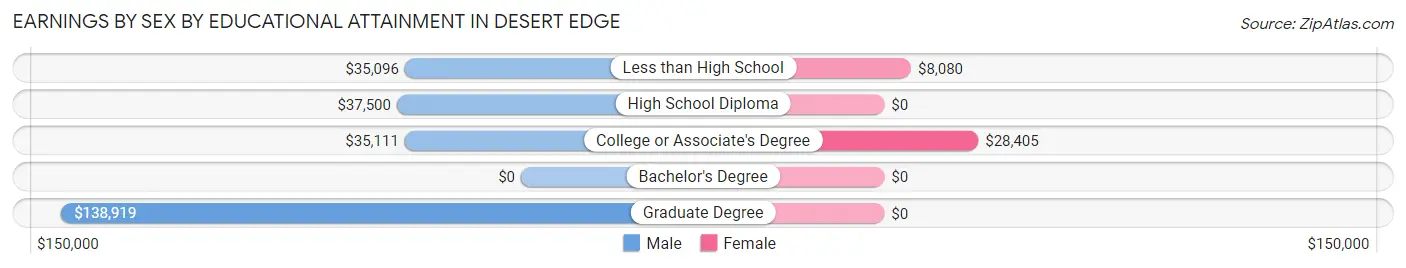
Earnings by Sex by Educational Attainment in Desert Edge
Average earnings in Desert Edge are $36,250 for men and $18,301 for women, a difference of 49.5%. Men with an educational attainment of graduate degree enjoy the highest average annual earnings of $138,919, while those with less than high school education earn the least with $35,096. Women with an educational attainment of college or associate's degree earn the most with the average annual earnings of $28,405, while those with less than high school education have the smallest earnings of $8,080.
| Educational Attainment | Male Income | Female Income |
| Less than High School | $35,096 | $8,080 |
| High School Diploma | $37,500 | $0 |
| College or Associate's Degree | $35,111 | $28,405 |
| Bachelor's Degree | - | - |
| Graduate Degree | $138,919 | $0 |
| Total | $36,250 | $18,301 |
Family Income in Desert Edge
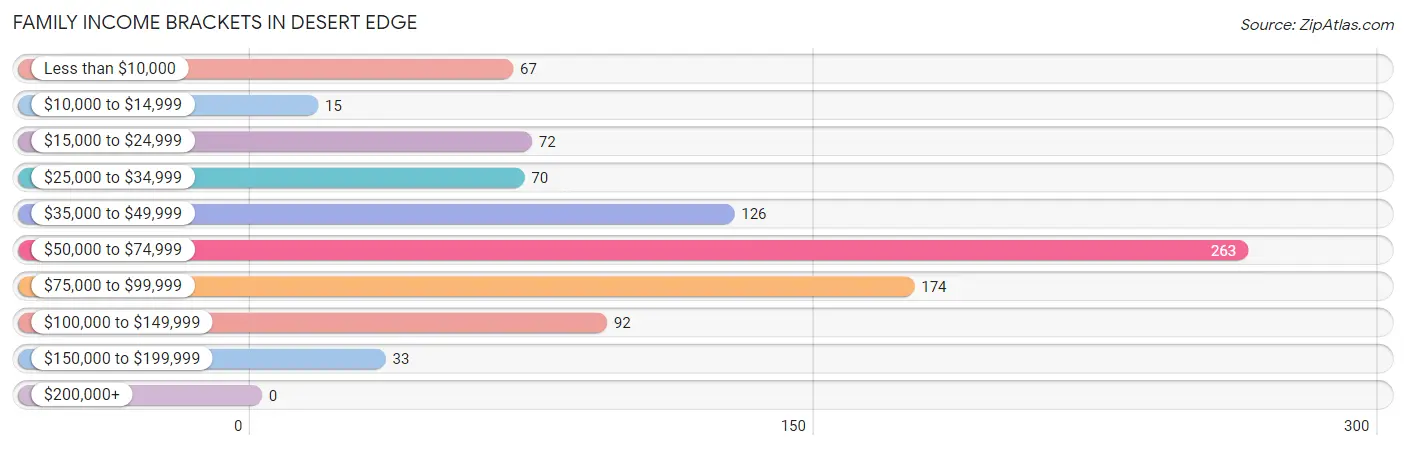
Family Income Brackets in Desert Edge
According to the Desert Edge family income data, there are 263 families falling into the $50,000 to $74,999 income range, which is the most common income bracket and makes up 28.8% of all families.
| Income Bracket | # Families | % Families |
| Less than $10,000 | 67 | 7.3% |
| $10,000 to $14,999 | 15 | 1.6% |
| $15,000 to $24,999 | 72 | 7.9% |
| $25,000 to $34,999 | 70 | 7.7% |
| $35,000 to $49,999 | 126 | 13.8% |
| $50,000 to $74,999 | 263 | 28.8% |
| $75,000 to $99,999 | 174 | 19.1% |
| $100,000 to $149,999 | 92 | 10.1% |
| $150,000 to $199,999 | 33 | 3.6% |
| $200,000+ | 0 | 0.0% |
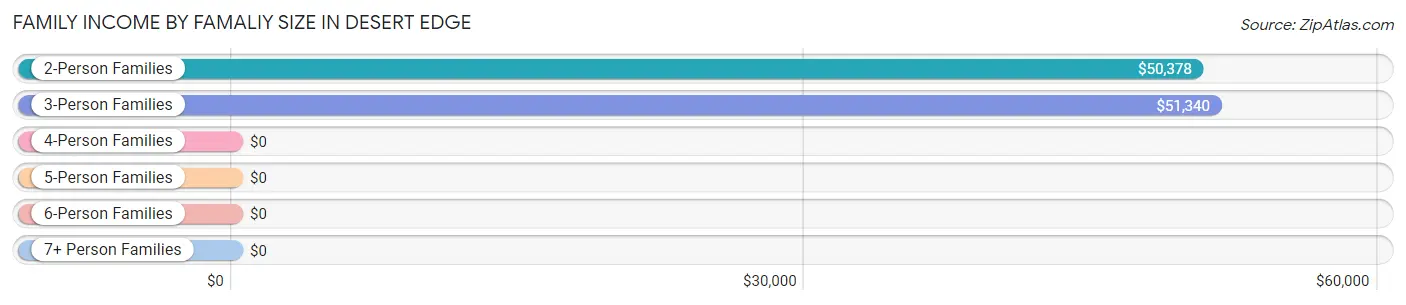
Family Income by Famaliy Size in Desert Edge
3-person families (116 | 12.7%) account for the highest median family income in Desert Edge with $51,340 per family, while 2-person families (667 | 73.1%) have the highest median income of $25,189 per family member.
| Income Bracket | # Families | Median Income |
| 2-Person Families | 667 (73.1%) | $50,378 |
| 3-Person Families | 116 (12.7%) | $51,340 |
| 4-Person Families | 76 (8.3%) | $0 |
| 5-Person Families | 39 (4.3%) | $0 |
| 6-Person Families | 14 (1.5%) | $0 |
| 7+ Person Families | 0 (0.0%) | $0 |
| Total | 912 (100.0%) | $51,318 |
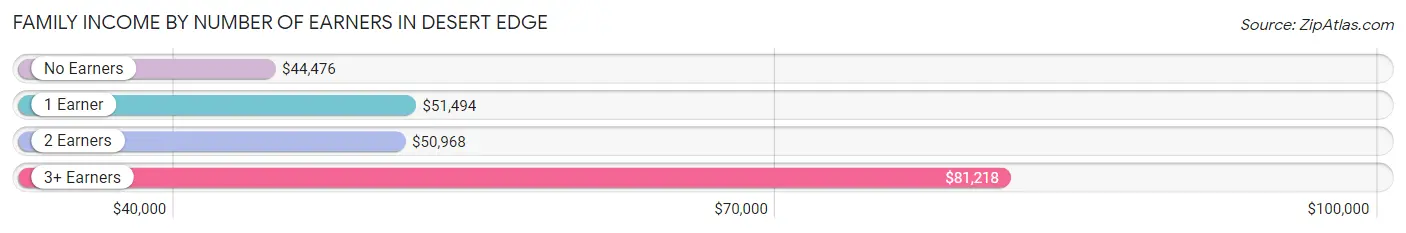
Family Income by Number of Earners in Desert Edge
The median family income in Desert Edge is $51,318, with families comprising 3+ earners (120) having the highest median family income of $81,218, while families with no earners (459) have the lowest median family income of $44,476, accounting for 13.2% and 50.3% of families, respectively.
| Number of Earners | # Families | Median Income |
| No Earners | 459 (50.3%) | $44,476 |
| 1 Earner | 212 (23.3%) | $51,494 |
| 2 Earners | 121 (13.3%) | $50,968 |
| 3+ Earners | 120 (13.2%) | $81,218 |
| Total | 912 (100.0%) | $51,318 |
Household Income in Desert Edge
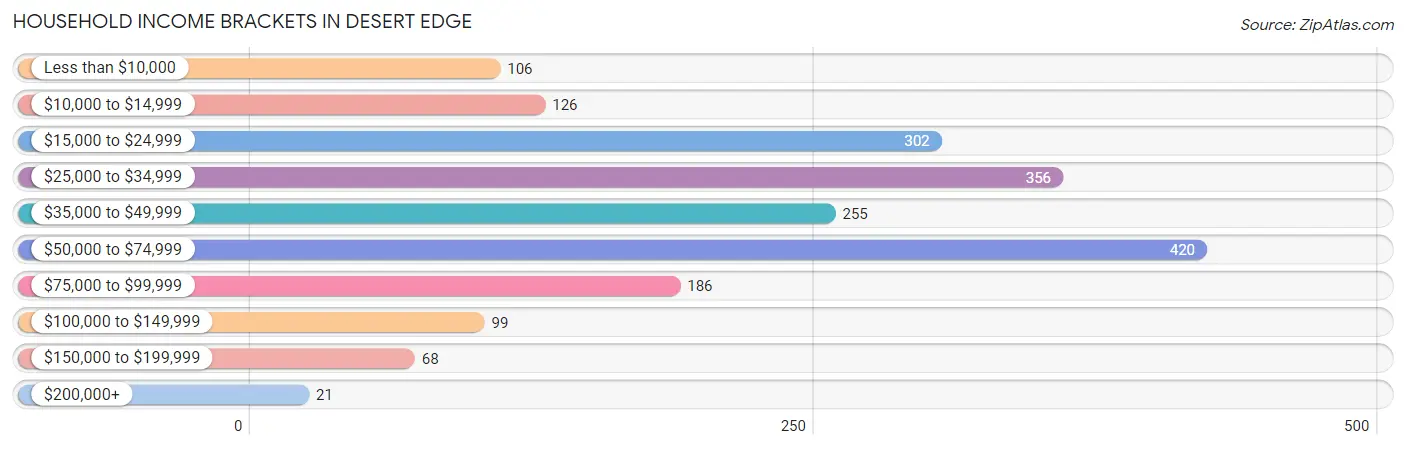
Household Income Brackets in Desert Edge
With 420 households falling in the category, the $50,000 to $74,999 income range is the most frequent in Desert Edge, accounting for 21.7% of all households. In contrast, only 21 households (1.1%) fall into the $200,000+ income bracket, making it the least populous group.
| Income Bracket | # Households | % Households |
| Less than $10,000 | 106 | 5.5% |
| $10,000 to $14,999 | 126 | 6.5% |
| $15,000 to $24,999 | 302 | 15.6% |
| $25,000 to $34,999 | 356 | 18.4% |
| $35,000 to $49,999 | 255 | 13.2% |
| $50,000 to $74,999 | 420 | 21.7% |
| $75,000 to $99,999 | 186 | 9.6% |
| $100,000 to $149,999 | 99 | 5.1% |
| $150,000 to $199,999 | 68 | 3.5% |
| $200,000+ | 21 | 1.1% |
Household Income by Householder Age in Desert Edge
The median household income in Desert Edge is $38,668, with the highest median household income of $52,148 found in the 25 to 44 years age bracket for the primary householder. A total of 208 households (10.7%) fall into this category.
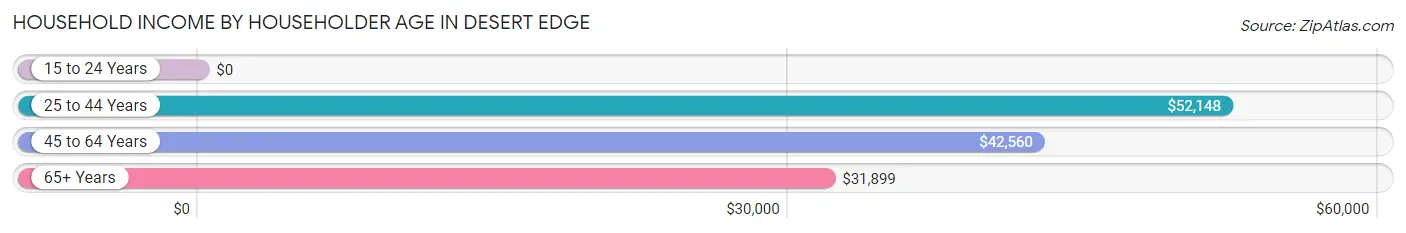
| Income Bracket | # Households | Median Income |
| 15 to 24 Years | 0 (0.0%) | $0 |
| 25 to 44 Years | 208 (10.7%) | $52,148 |
| 45 to 64 Years | 565 (29.2%) | $42,560 |
| 65+ Years | 1,162 (60.1%) | $31,899 |
| Total | 1,935 (100.0%) | $38,668 |
Poverty in Desert Edge
Income Below Poverty by Sex and Age in Desert Edge
With 25.1% poverty level for males and 13.1% for females among the residents of Desert Edge, 65 to 74 year old males and 55 to 64 year old females are the most vulnerable to poverty, with 212 males (55.2%) and 68 females (31.3%) in their respective age groups living below the poverty level.
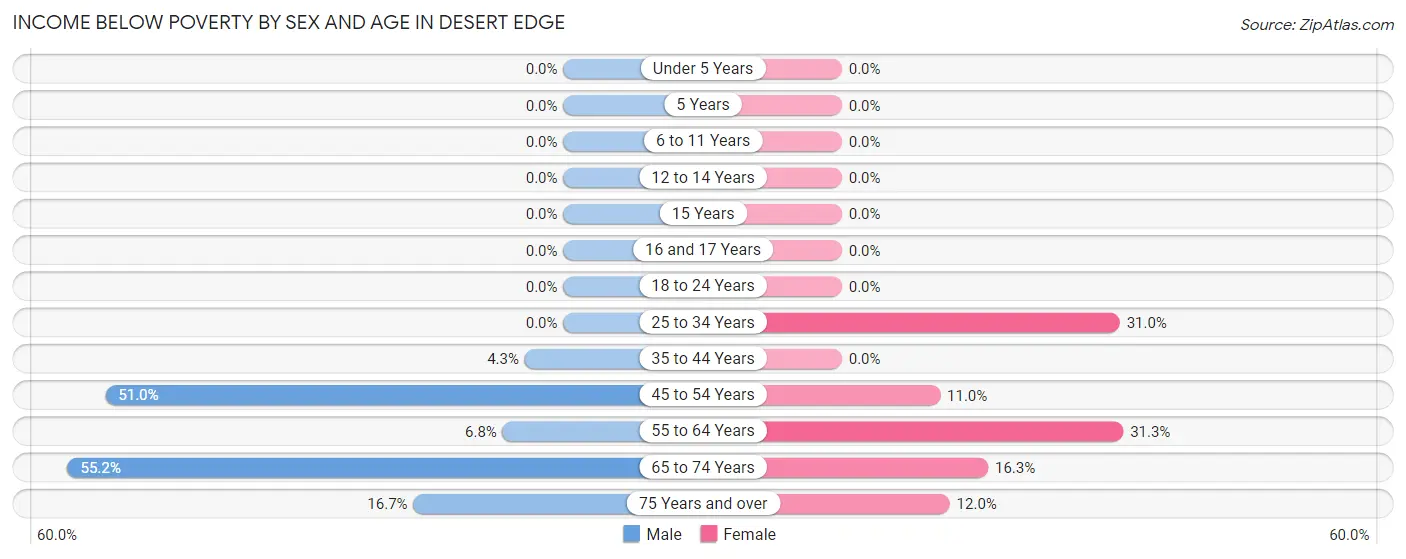
| Age Bracket | Male | Female |
| Under 5 Years | 0 (0.0%) | 0 (0.0%) |
| 5 Years | 0 (0.0%) | 0 (0.0%) |
| 6 to 11 Years | 0 (0.0%) | 0 (0.0%) |
| 12 to 14 Years | 0 (0.0%) | 0 (0.0%) |
| 15 Years | 0 (0.0%) | 0 (0.0%) |
| 16 and 17 Years | 0 (0.0%) | 0 (0.0%) |
| 18 to 24 Years | 0 (0.0%) | 0 (0.0%) |
| 25 to 34 Years | 0 (0.0%) | 13 (30.9%) |
| 35 to 44 Years | 9 (4.3%) | 0 (0.0%) |
| 45 to 54 Years | 179 (51.0%) | 15 (11.0%) |
| 55 to 64 Years | 20 (6.8%) | 68 (31.3%) |
| 65 to 74 Years | 212 (55.2%) | 65 (16.3%) |
| 75 Years and over | 74 (16.7%) | 68 (12.0%) |
| Total | 494 (25.1%) | 229 (13.1%) |
Income Above Poverty by Sex and Age in Desert Edge
According to the poverty statistics in Desert Edge, males aged under 5 years and females aged under 5 years are the age groups that are most secure financially, with 100.0% of males and 100.0% of females in these age groups living above the poverty line.
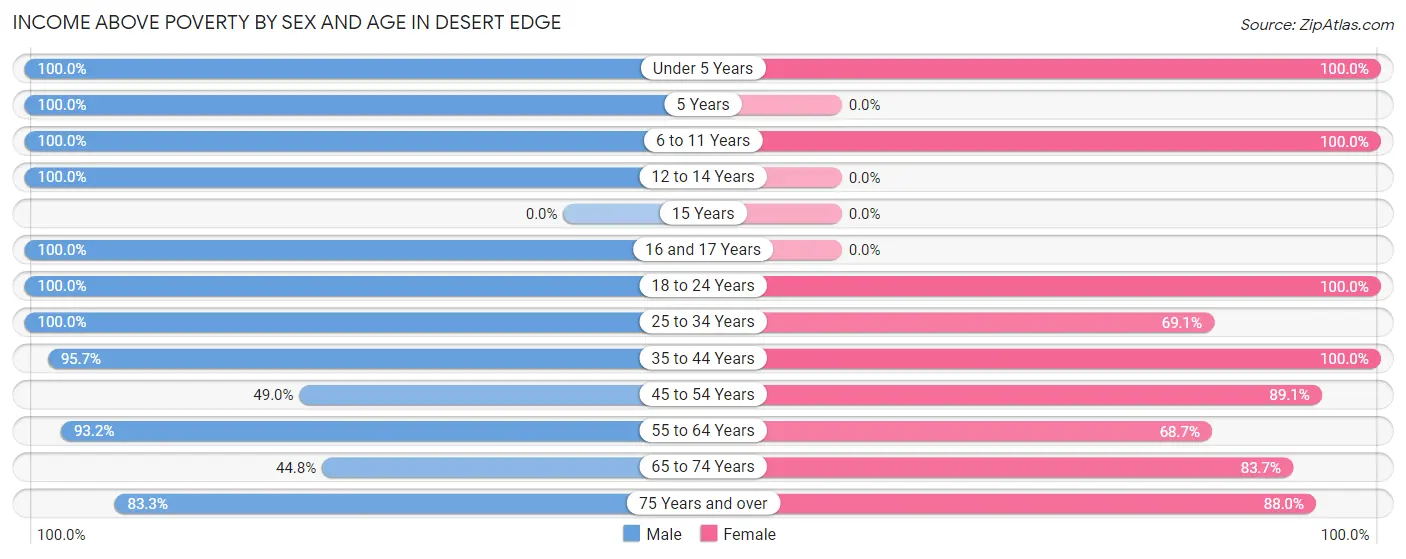
| Age Bracket | Male | Female |
| Under 5 Years | 9 (100.0%) | 13 (100.0%) |
| 5 Years | 41 (100.0%) | 0 (0.0%) |
| 6 to 11 Years | 64 (100.0%) | 67 (100.0%) |
| 12 to 14 Years | 87 (100.0%) | 0 (0.0%) |
| 15 Years | 0 (0.0%) | 0 (0.0%) |
| 16 and 17 Years | 10 (100.0%) | 0 (0.0%) |
| 18 to 24 Years | 29 (100.0%) | 143 (100.0%) |
| 25 to 34 Years | 45 (100.0%) | 29 (69.1%) |
| 35 to 44 Years | 201 (95.7%) | 162 (100.0%) |
| 45 to 54 Years | 172 (49.0%) | 122 (89.0%) |
| 55 to 64 Years | 276 (93.2%) | 149 (68.7%) |
| 65 to 74 Years | 172 (44.8%) | 334 (83.7%) |
| 75 Years and over | 369 (83.3%) | 498 (88.0%) |
| Total | 1,475 (74.9%) | 1,517 (86.9%) |
Income Below Poverty Among Married-Couple Families in Desert Edge
The poverty statistics for married-couple families in Desert Edge show that 11.6% or 92 of the total 794 families live below the poverty line. Families with no children have the highest poverty rate of 14.8%, comprising of 92 families. On the other hand, families with 1 or 2 children have the lowest poverty rate of 0.0%, which includes 0 families.
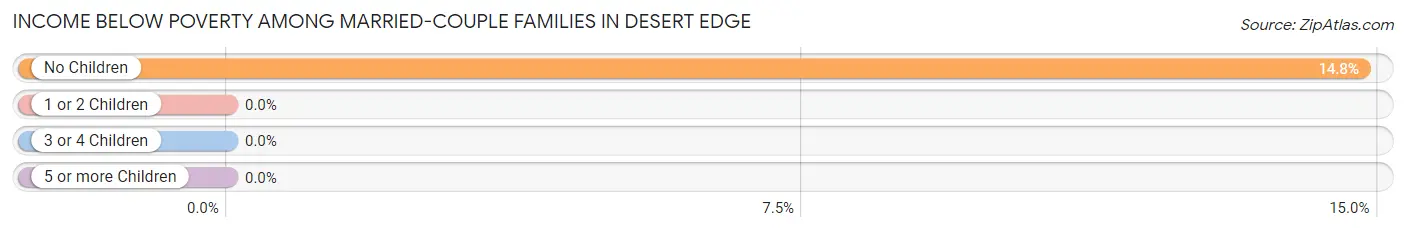
| Children | Above Poverty | Below Poverty |
| No Children | 530 (85.2%) | 92 (14.8%) |
| 1 or 2 Children | 158 (100.0%) | 0 (0.0%) |
| 3 or 4 Children | 14 (100.0%) | 0 (0.0%) |
| 5 or more Children | 0 (0.0%) | 0 (0.0%) |
| Total | 702 (88.4%) | 92 (11.6%) |
Income Below Poverty Among Single-Parent Households in Desert Edge
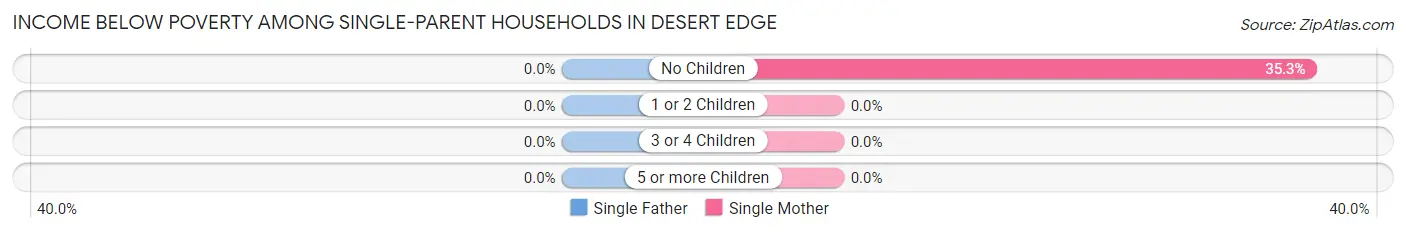
| Children | Single Father | Single Mother |
| No Children | 0 (0.0%) | 12 (35.3%) |
| 1 or 2 Children | 0 (0.0%) | 0 (0.0%) |
| 3 or 4 Children | 0 (0.0%) | 0 (0.0%) |
| 5 or more Children | 0 (0.0%) | 0 (0.0%) |
| Total | 0 (0.0%) | 12 (19.4%) |
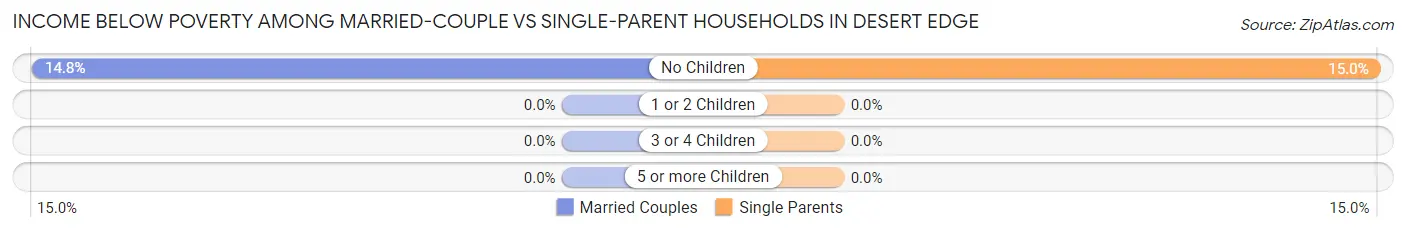
Income Below Poverty Among Married-Couple vs Single-Parent Households in Desert Edge
The poverty data for Desert Edge shows that 92 of the married-couple family households (11.6%) and 12 of the single-parent households (10.2%) are living below the poverty level. Within the married-couple family households, those with no children have the highest poverty rate, with 92 households (14.8%) falling below the poverty line. Among the single-parent households, those with no children have the highest poverty rate, with 12 household (15.0%) living below poverty.
| Children | Married-Couple Families | Single-Parent Households |
| No Children | 92 (14.8%) | 12 (15.0%) |
| 1 or 2 Children | 0 (0.0%) | 0 (0.0%) |
| 3 or 4 Children | 0 (0.0%) | 0 (0.0%) |
| 5 or more Children | 0 (0.0%) | 0 (0.0%) |
| Total | 92 (11.6%) | 12 (10.2%) |
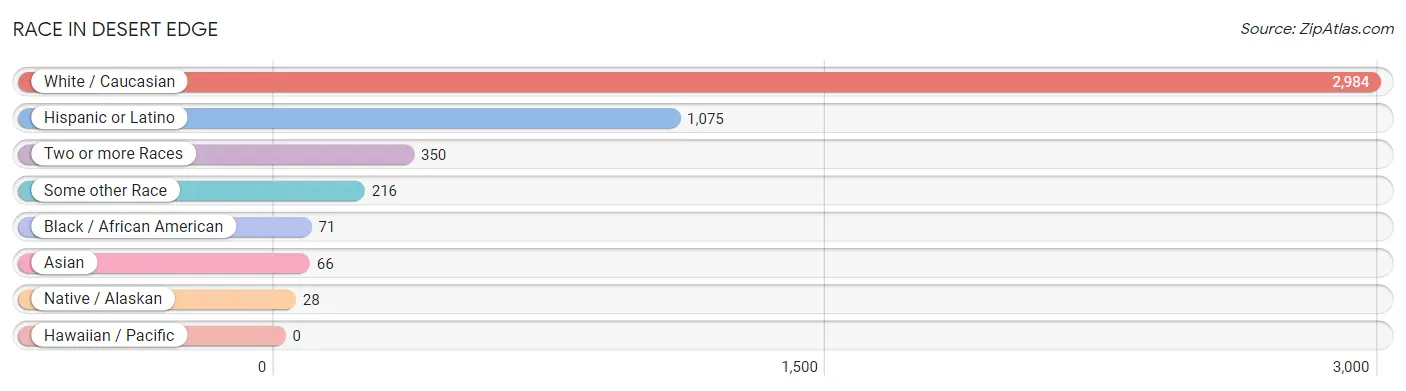
Race in Desert Edge
The most populous races in Desert Edge are White / Caucasian (2,984 | 80.3%), Hispanic or Latino (1,075 | 28.9%), and Two or more Races (350 | 9.4%).
| Race | # Population | % Population |
| Asian | 66 | 1.8% |
| Black / African American | 71 | 1.9% |
| Hawaiian / Pacific | 0 | 0.0% |
| Hispanic or Latino | 1,075 | 28.9% |
| Native / Alaskan | 28 | 0.7% |
| White / Caucasian | 2,984 | 80.3% |
| Two or more Races | 350 | 9.4% |
| Some other Race | 216 | 5.8% |
| Total | 3,715 | 100.0% |
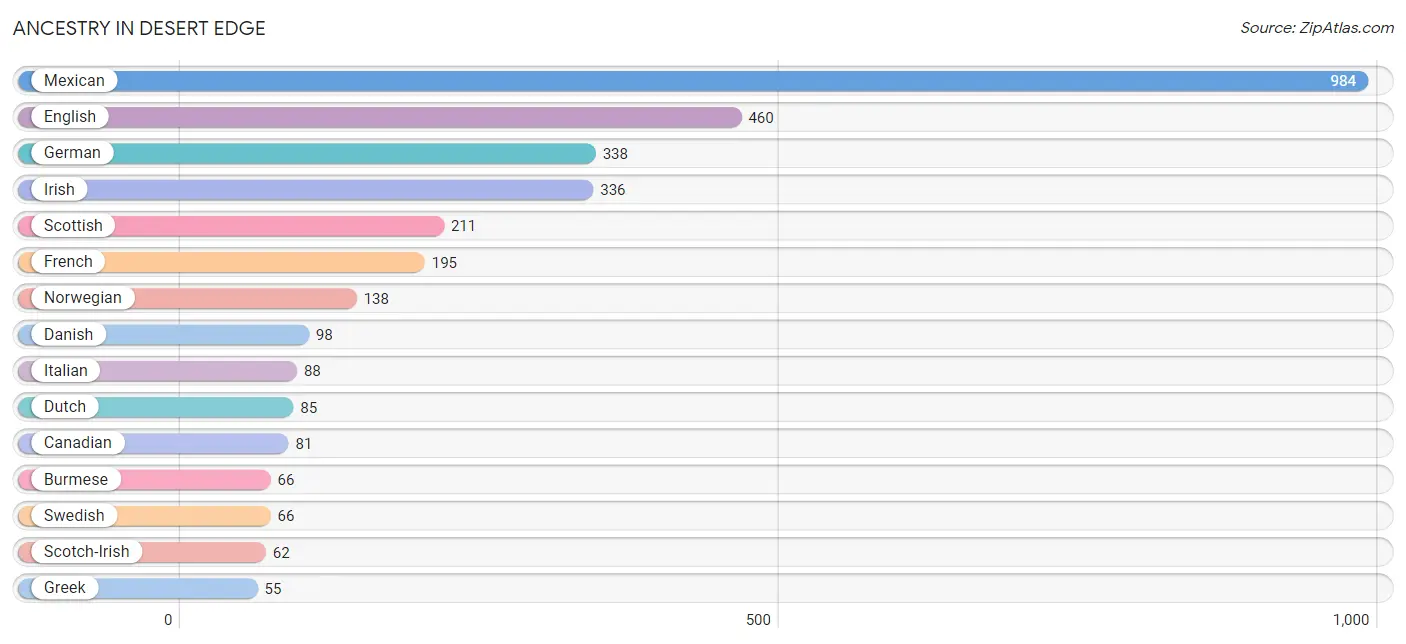
Ancestry in Desert Edge
The most populous ancestries reported in Desert Edge are Mexican (984 | 26.5%), English (460 | 12.4%), German (338 | 9.1%), Irish (336 | 9.0%), and Scottish (211 | 5.7%), together accounting for 62.7% of all Desert Edge residents.
| Ancestry | # Population | % Population |
| American | 47 | 1.3% |
| Arab | 5 | 0.1% |
| Australian | 9 | 0.2% |
| Austrian | 8 | 0.2% |
| Belgian | 20 | 0.5% |
| Blackfeet | 5 | 0.1% |
| British | 32 | 0.9% |
| Burmese | 66 | 1.8% |
| Canadian | 81 | 2.2% |
| Central American | 49 | 1.3% |
| Croatian | 16 | 0.4% |
| Cuban | 12 | 0.3% |
| Danish | 98 | 2.6% |
| Dutch | 85 | 2.3% |
| Eastern European | 28 | 0.7% |
| English | 460 | 12.4% |
| European | 17 | 0.5% |
| Finnish | 11 | 0.3% |
| French | 195 | 5.2% |
| French Canadian | 14 | 0.4% |
| German | 338 | 9.1% |
| Greek | 55 | 1.5% |
| Guatemalan | 8 | 0.2% |
| Hungarian | 46 | 1.2% |
| Irish | 336 | 9.0% |
| Italian | 88 | 2.4% |
| Lebanese | 5 | 0.1% |
| Mexican | 984 | 26.5% |
| Mexican American Indian | 28 | 0.7% |
| Northern European | 12 | 0.3% |
| Norwegian | 138 | 3.7% |
| Polish | 16 | 0.4% |
| Portuguese | 22 | 0.6% |
| Russian | 22 | 0.6% |
| Salvadoran | 41 | 1.1% |
| Scandinavian | 46 | 1.2% |
| Scotch-Irish | 62 | 1.7% |
| Scottish | 211 | 5.7% |
| Spanish | 9 | 0.2% |
| Spanish American | 21 | 0.6% |
| Swedish | 66 | 1.8% |
| Swiss | 20 | 0.5% |
| Ukrainian | 12 | 0.3% |
| Welsh | 33 | 0.9% | View All 44 Rows |
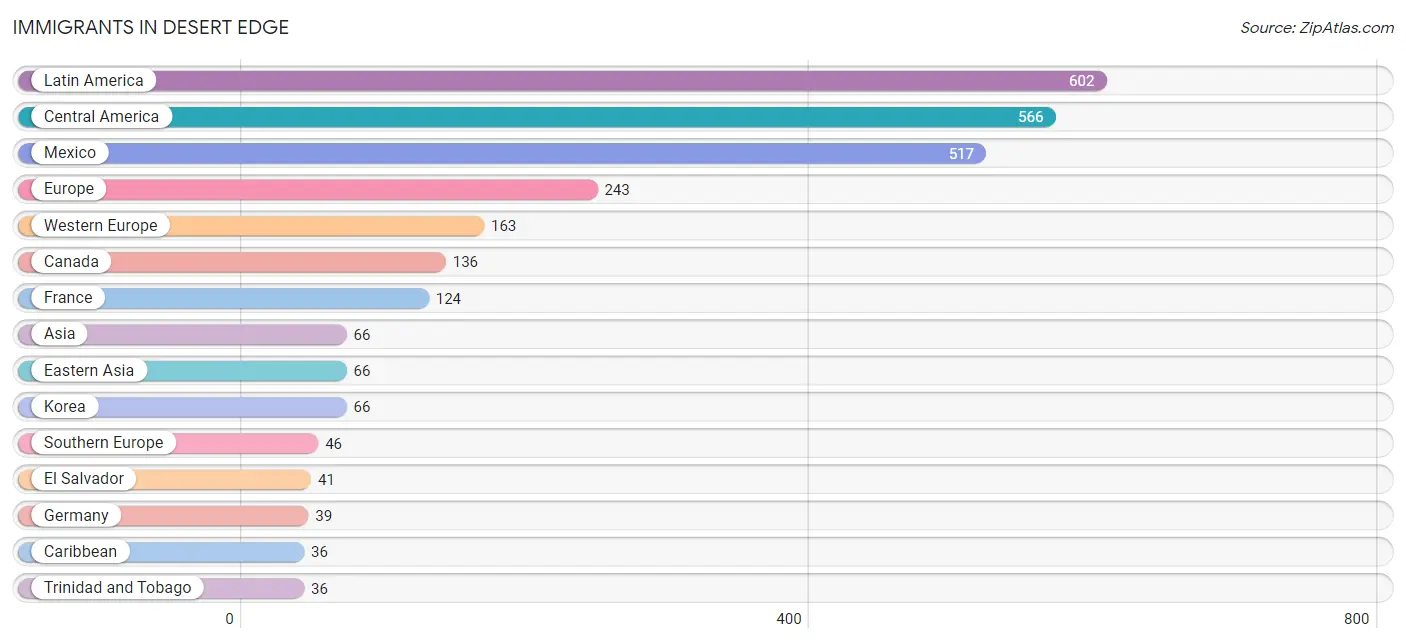
Immigrants in Desert Edge
The most numerous immigrant groups reported in Desert Edge came from Latin America (602 | 16.2%), Central America (566 | 15.2%), Mexico (517 | 13.9%), Europe (243 | 6.5%), and Western Europe (163 | 4.4%), together accounting for 56.3% of all Desert Edge residents.
| Immigration Origin | # Population | % Population |
| Africa | 12 | 0.3% |
| Asia | 66 | 1.8% |
| Australia | 21 | 0.6% |
| Canada | 136 | 3.7% |
| Caribbean | 36 | 1.0% |
| Central America | 566 | 15.2% |
| Denmark | 11 | 0.3% |
| Eastern Asia | 66 | 1.8% |
| Eastern Europe | 11 | 0.3% |
| Egypt | 12 | 0.3% |
| El Salvador | 41 | 1.1% |
| Europe | 243 | 6.5% |
| France | 124 | 3.3% |
| Germany | 39 | 1.1% |
| Greece | 14 | 0.4% |
| Guatemala | 8 | 0.2% |
| Italy | 32 | 0.9% |
| Korea | 66 | 1.8% |
| Latin America | 602 | 16.2% |
| Mexico | 517 | 13.9% |
| Northern Africa | 12 | 0.3% |
| Northern Europe | 23 | 0.6% |
| Oceania | 21 | 0.6% |
| Romania | 11 | 0.3% |
| Southern Europe | 46 | 1.2% |
| Trinidad and Tobago | 36 | 1.0% |
| Western Europe | 163 | 4.4% | View All 27 Rows |
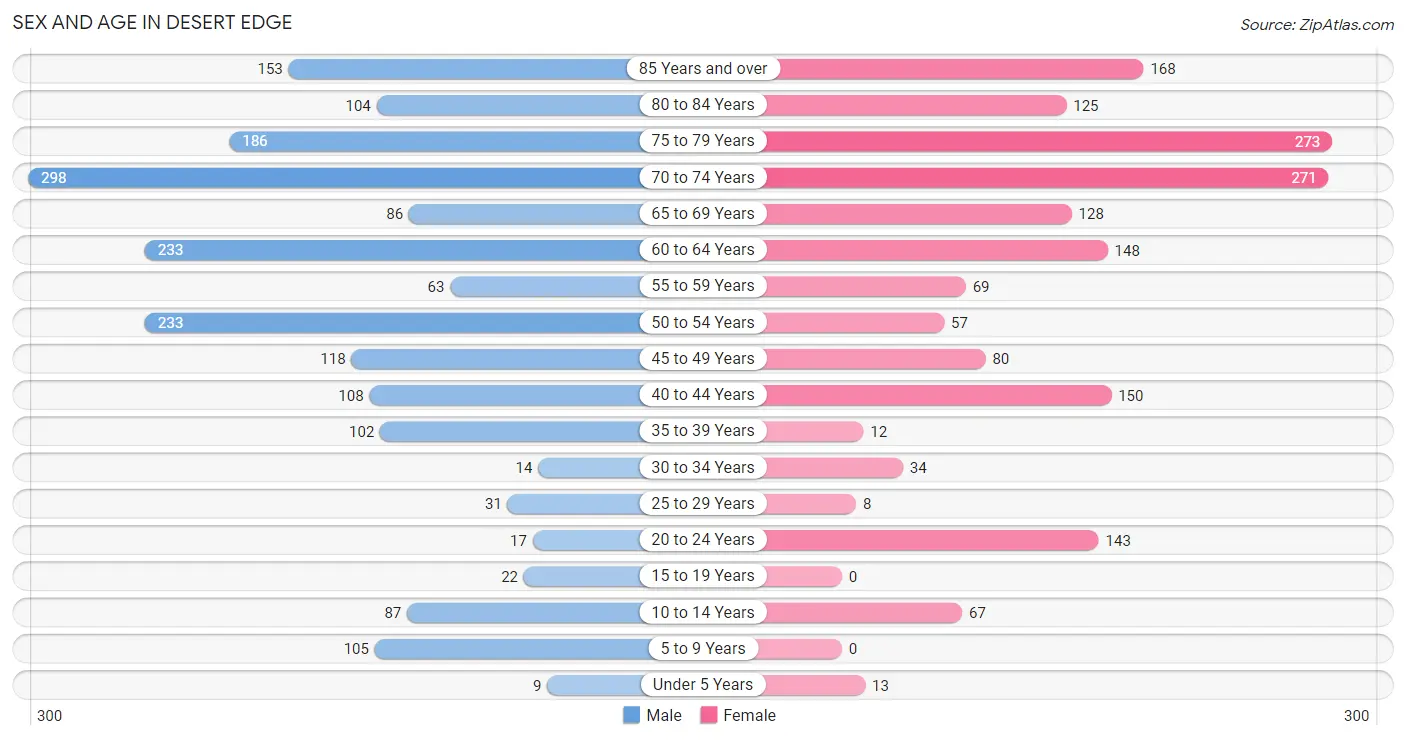
Sex and Age in Desert Edge
Sex and Age in Desert Edge
The most populous age groups in Desert Edge are 70 to 74 Years (298 | 15.1%) for men and 75 to 79 Years (273 | 15.6%) for women.
| Age Bracket | Male | Female |
| Under 5 Years | 9 (0.5%) | 13 (0.7%) |
| 5 to 9 Years | 105 (5.3%) | 0 (0.0%) |
| 10 to 14 Years | 87 (4.4%) | 67 (3.8%) |
| 15 to 19 Years | 22 (1.1%) | 0 (0.0%) |
| 20 to 24 Years | 17 (0.9%) | 143 (8.2%) |
| 25 to 29 Years | 31 (1.6%) | 8 (0.5%) |
| 30 to 34 Years | 14 (0.7%) | 34 (1.9%) |
| 35 to 39 Years | 102 (5.2%) | 12 (0.7%) |
| 40 to 44 Years | 108 (5.5%) | 150 (8.6%) |
| 45 to 49 Years | 118 (6.0%) | 80 (4.6%) |
| 50 to 54 Years | 233 (11.8%) | 57 (3.3%) |
| 55 to 59 Years | 63 (3.2%) | 69 (4.0%) |
| 60 to 64 Years | 233 (11.8%) | 148 (8.5%) |
| 65 to 69 Years | 86 (4.4%) | 128 (7.3%) |
| 70 to 74 Years | 298 (15.1%) | 271 (15.5%) |
| 75 to 79 Years | 186 (9.5%) | 273 (15.6%) |
| 80 to 84 Years | 104 (5.3%) | 125 (7.2%) |
| 85 Years and over | 153 (7.8%) | 168 (9.6%) |
| Total | 1,969 (100.0%) | 1,746 (100.0%) |
Families and Households in Desert Edge
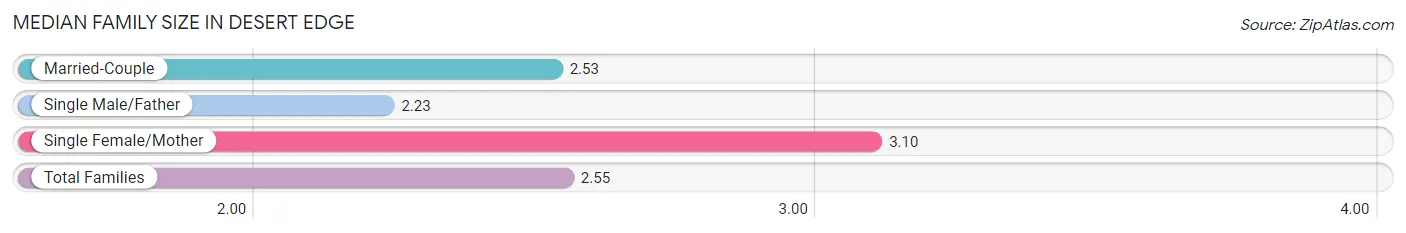
Median Family Size in Desert Edge
The median family size in Desert Edge is 2.55 persons per family, with single female/mother families (62 | 6.8%) accounting for the largest median family size of 3.1 persons per family. On the other hand, single male/father families (56 | 6.1%) represent the smallest median family size with 2.23 persons per family.
| Family Type | # Families | Family Size |
| Married-Couple | 794 (87.1%) | 2.53 |
| Single Male/Father | 56 (6.1%) | 2.23 |
| Single Female/Mother | 62 (6.8%) | 3.10 |
| Total Families | 912 (100.0%) | 2.55 |
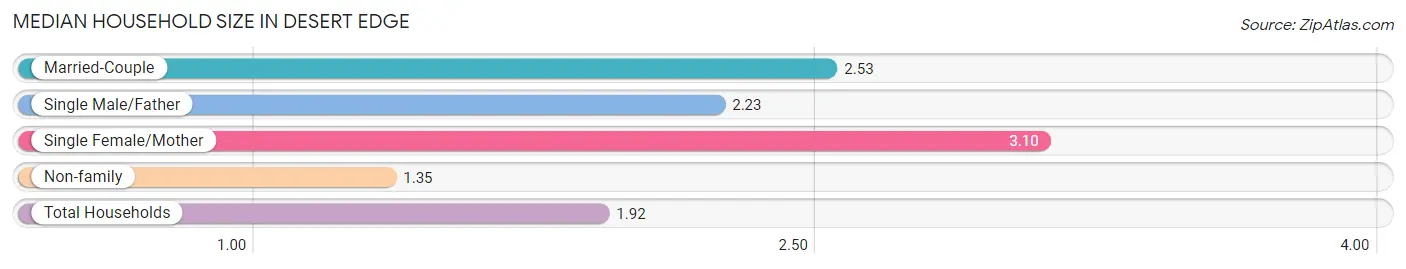
Median Household Size in Desert Edge
The median household size in Desert Edge is 1.92 persons per household, with single female/mother households (62 | 3.2%) accounting for the largest median household size of 3.1 persons per household. non-family households (1,023 | 52.9%) represent the smallest median household size with 1.35 persons per household.
| Household Type | # Households | Household Size |
| Married-Couple | 794 (41.0%) | 2.53 |
| Single Male/Father | 56 (2.9%) | 2.23 |
| Single Female/Mother | 62 (3.2%) | 3.10 |
| Non-family | 1,023 (52.9%) | 1.35 |
| Total Households | 1,935 (100.0%) | 1.92 |
Household Size by Marriage Status in Desert Edge
Out of a total of 1,935 households in Desert Edge, 912 (47.1%) are family households, while 1,023 (52.9%) are nonfamily households. The most numerous type of family households are 2-person households, comprising 662, and the most common type of nonfamily households are 1-person households, comprising 804.
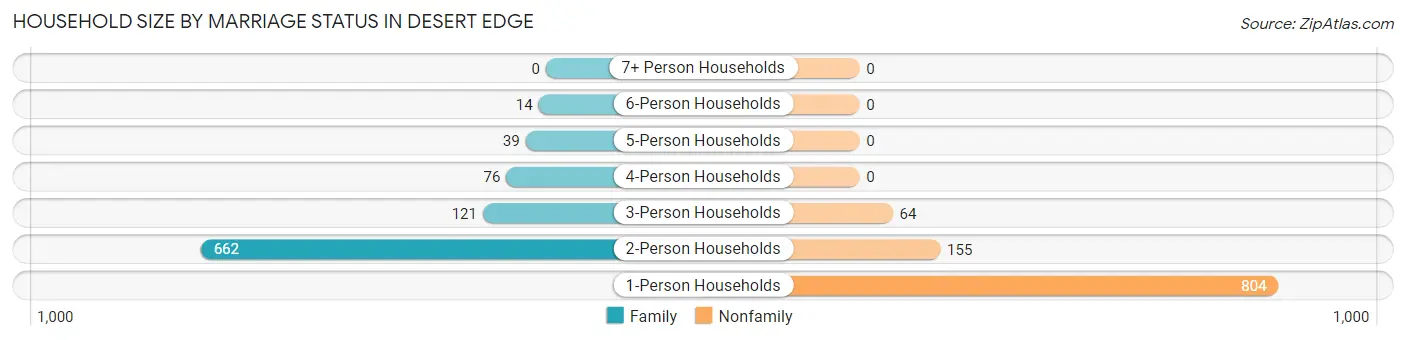
| Household Size | Family Households | Nonfamily Households |
| 1-Person Households | - | 804 (41.5%) |
| 2-Person Households | 662 (34.2%) | 155 (8.0%) |
| 3-Person Households | 121 (6.2%) | 64 (3.3%) |
| 4-Person Households | 76 (3.9%) | 0 (0.0%) |
| 5-Person Households | 39 (2.0%) | 0 (0.0%) |
| 6-Person Households | 14 (0.7%) | 0 (0.0%) |
| 7+ Person Households | 0 (0.0%) | 0 (0.0%) |
| Total | 912 (47.1%) | 1,023 (52.9%) |
Female Fertility in Desert Edge
Fertility by Age in Desert Edge
Average fertility rate in Desert Edge is 17.0 births per 1,000 women. Women in the age bracket of 20 to 34 years have the highest fertility rate with 43.0 births per 1,000 women. Women in the age bracket of 20 to 34 years acount for 100.0% of all women with births.
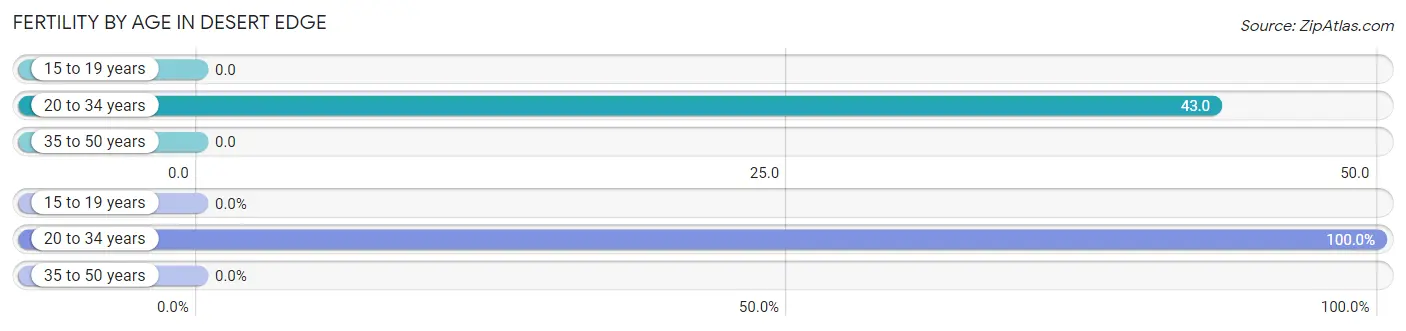
| Age Bracket | Women with Births | Births / 1,000 Women |
| 15 to 19 years | 0 (0.0%) | 0.0 |
| 20 to 34 years | 8 (100.0%) | 43.0 |
| 35 to 50 years | 0 (0.0%) | 0.0 |
| Total | 8 (100.0%) | 17.0 |
Fertility by Age by Marriage Status in Desert Edge
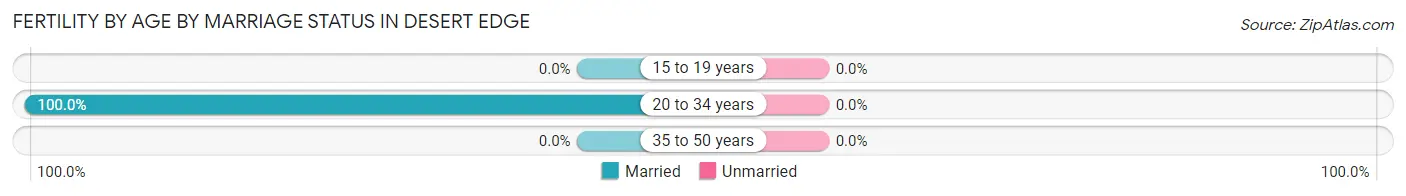
| Age Bracket | Married | Unmarried |
| 15 to 19 years | 0 (0.0%) | 0 (0.0%) |
| 20 to 34 years | 8 (100.0%) | 0 (0.0%) |
| 35 to 50 years | 0 (0.0%) | 0 (0.0%) |
| Total | 8 (100.0%) | 0 (0.0%) |
Fertility by Education in Desert Edge
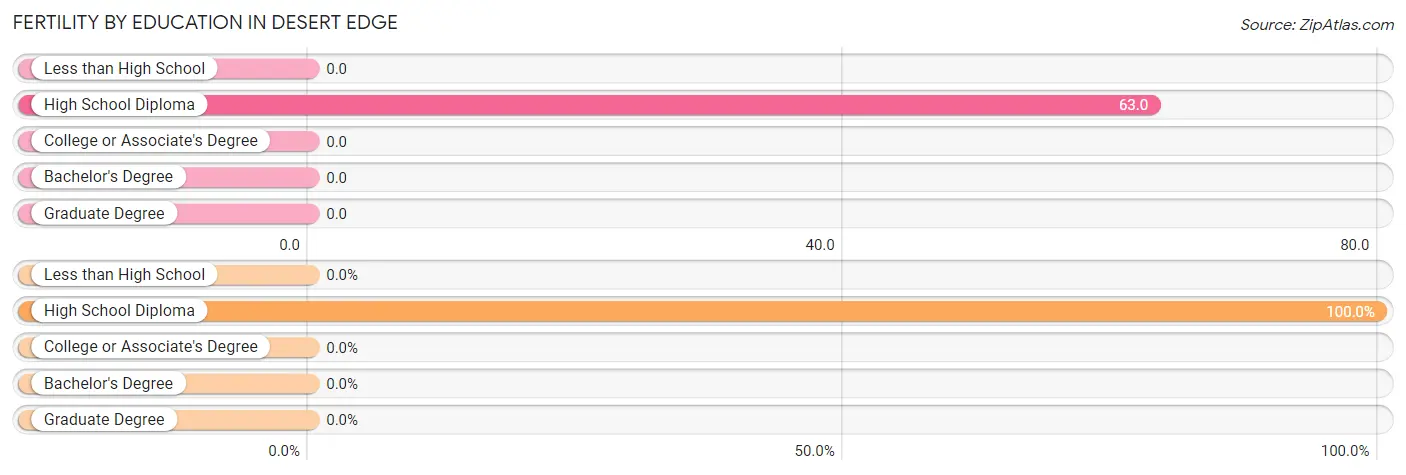
| Educational Attainment | Women with Births | Births / 1,000 Women |
| Less than High School | 0 (0.0%) | 0.0 |
| High School Diploma | 8 (100.0%) | 63.0 |
| College or Associate's Degree | 0 (0.0%) | 0.0 |
| Bachelor's Degree | 0 (0.0%) | 0.0 |
| Graduate Degree | 0 (0.0%) | 0.0 |
| Total | 8 (100.0%) | 17.0 |
Fertility by Education by Marriage Status in Desert Edge
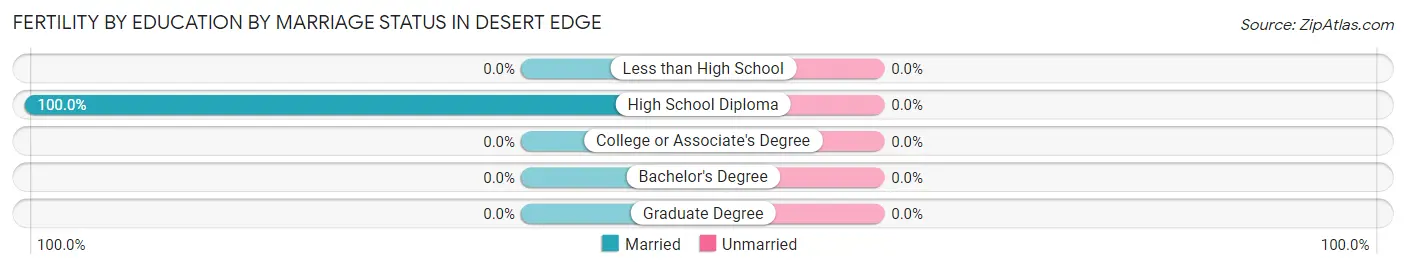
| Educational Attainment | Married | Unmarried |
| Less than High School | 0 (0.0%) | 0 (0.0%) |
| High School Diploma | 8 (100.0%) | 0 (0.0%) |
| College or Associate's Degree | 0 (0.0%) | 0 (0.0%) |
| Bachelor's Degree | 0 (0.0%) | 0 (0.0%) |
| Graduate Degree | 0 (0.0%) | 0 (0.0%) |
| Total | 8 (100.0%) | 0 (0.0%) |
Employment Characteristics in Desert Edge
Employment by Class of Employer in Desert Edge
Among the 949 employed individuals in Desert Edge, private company employees (584 | 61.5%), self-employed (not incorporated) (184 | 19.4%), and local government employees (120 | 12.6%) make up the most common classes of employment.
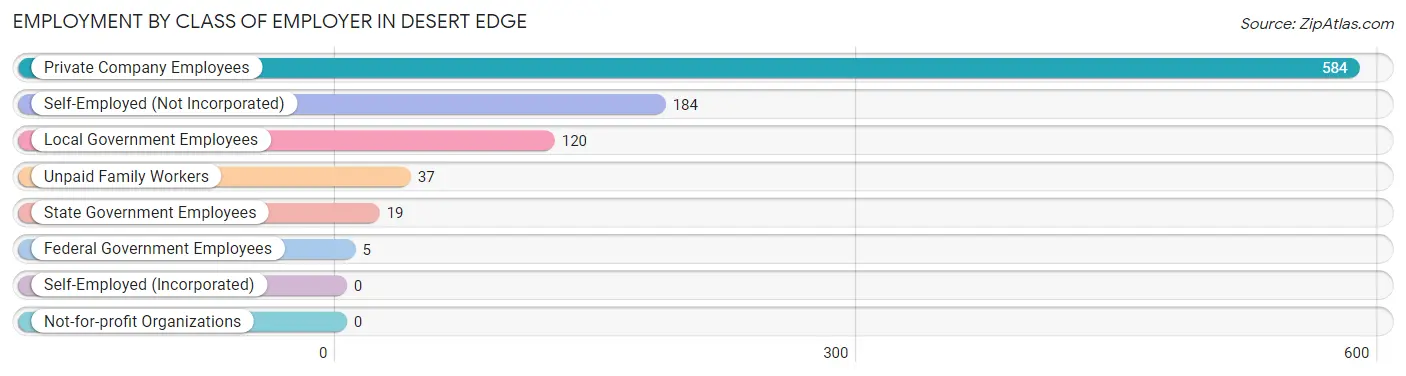
| Employer Class | # Employees | % Employees |
| Private Company Employees | 584 | 61.5% |
| Self-Employed (Incorporated) | 0 | 0.0% |
| Self-Employed (Not Incorporated) | 184 | 19.4% |
| Not-for-profit Organizations | 0 | 0.0% |
| Local Government Employees | 120 | 12.6% |
| State Government Employees | 19 | 2.0% |
| Federal Government Employees | 5 | 0.5% |
| Unpaid Family Workers | 37 | 3.9% |
| Total | 949 | 100.0% |
Employment Status by Age in Desert Edge
According to the labor force statistics for Desert Edge, out of the total population over 16 years of age (3,434), 31.1% or 1,068 individuals are in the labor force, with 9.5% or 101 of them unemployed. The age group with the highest labor force participation rate is 20 to 24 years, with 100.0% or 160 individuals in the labor force. Within the labor force, the 45 to 54 years age range has the highest percentage of unemployed individuals, with 27.5% or 73 of them being unemployed.
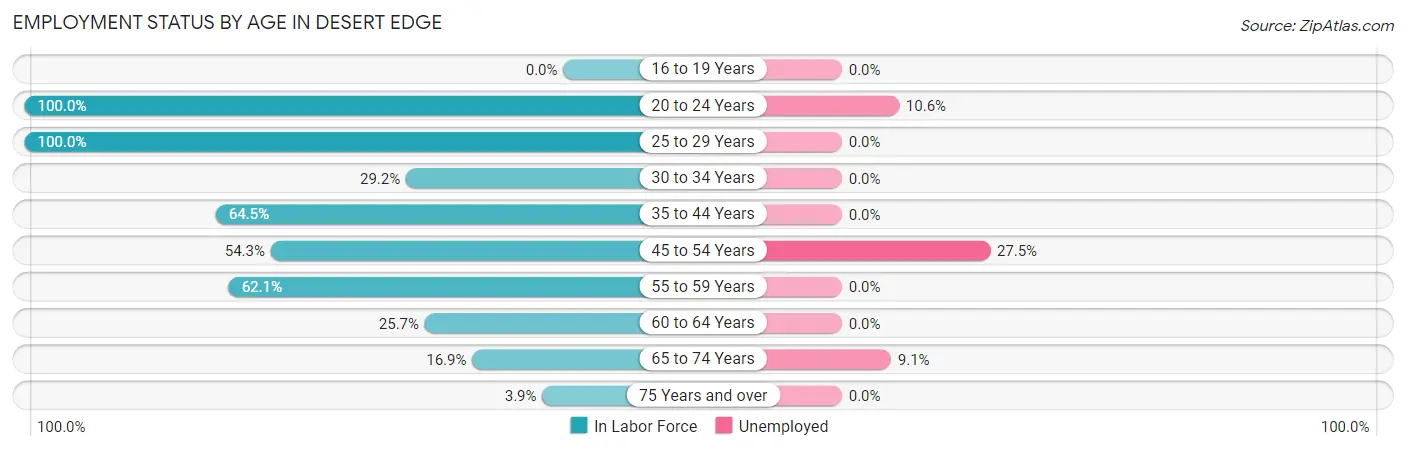
| Age Bracket | In Labor Force | Unemployed |
| 16 to 19 Years | 0 (0.0%) | 0 (0.0%) |
| 20 to 24 Years | 160 (100.0%) | 17 (10.6%) |
| 25 to 29 Years | 39 (100.0%) | 0 (0.0%) |
| 30 to 34 Years | 14 (29.2%) | 0 (0.0%) |
| 35 to 44 Years | 240 (64.5%) | 0 (0.0%) |
| 45 to 54 Years | 265 (54.3%) | 73 (27.5%) |
| 55 to 59 Years | 82 (62.1%) | 0 (0.0%) |
| 60 to 64 Years | 98 (25.7%) | 0 (0.0%) |
| 65 to 74 Years | 132 (16.9%) | 12 (9.1%) |
| 75 Years and over | 39 (3.9%) | 0 (0.0%) |
| Total | 1,068 (31.1%) | 101 (9.5%) |
Employment Status by Educational Attainment in Desert Edge
According to labor force statistics for Desert Edge, 50.5% of individuals (737) out of the total population between 25 and 64 years of age (1,460) are in the labor force, with 9.9% or 73 of them being unemployed. The group with the highest labor force participation rate are those with the educational attainment of college / associate degree, with 63.9% or 356 individuals in the labor force. Within the labor force, individuals with high school diploma education have the highest percentage of unemployment, with 38.0% or 73 of them being unemployed.
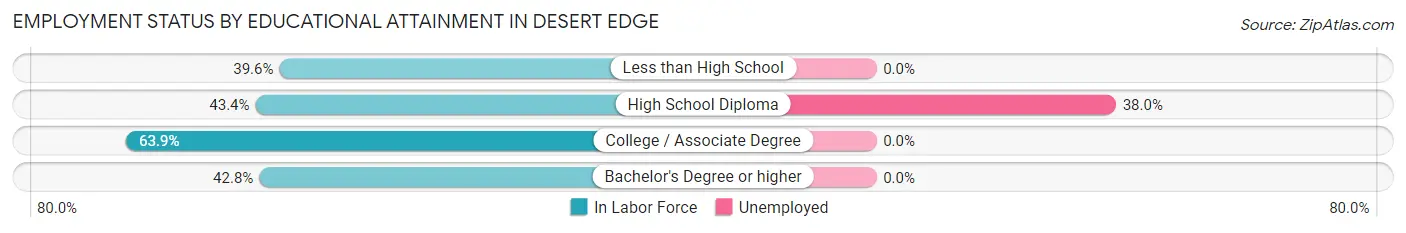
| Educational Attainment | In Labor Force | Unemployed |
| Less than High School | 89 (39.6%) | 0 (0.0%) |
| High School Diploma | 192 (43.4%) | 168 (38.0%) |
| College / Associate Degree | 356 (63.9%) | 0 (0.0%) |
| Bachelor's Degree or higher | 101 (42.8%) | 0 (0.0%) |
| Total | 737 (50.5%) | 145 (9.9%) |
Employment Occupations by Sex in Desert Edge
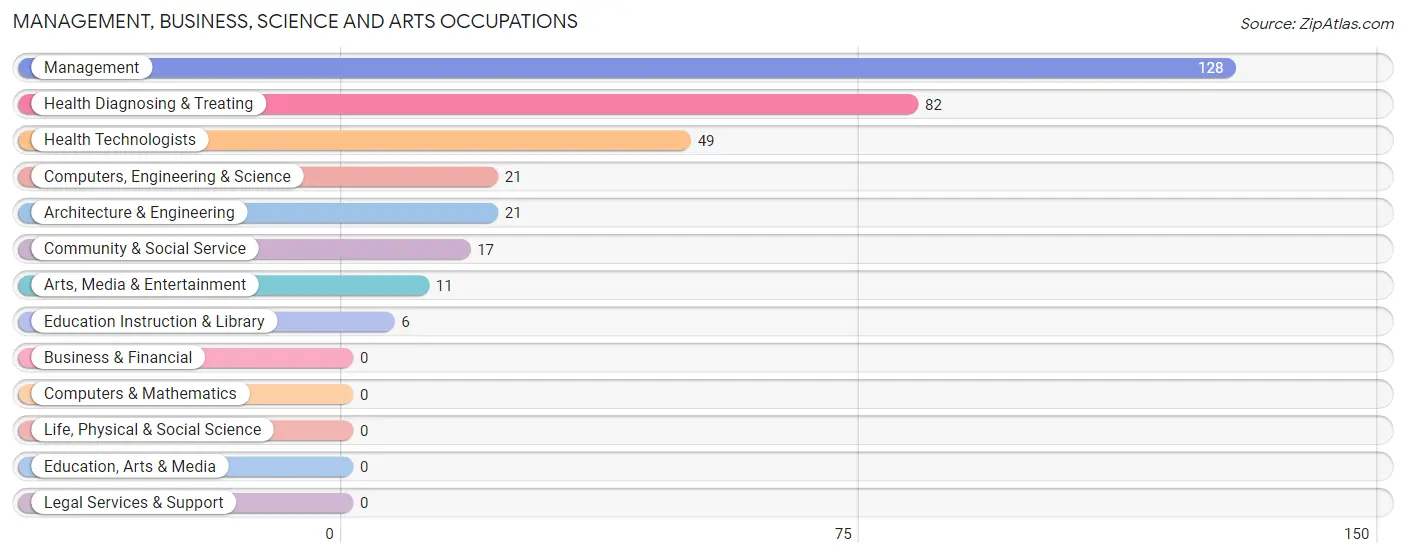
Management, Business, Science and Arts Occupations
The most common Management, Business, Science and Arts occupations in Desert Edge are Management (128 | 13.2%), Health Diagnosing & Treating (82 | 8.5%), Health Technologists (49 | 5.1%), Computers, Engineering & Science (21 | 2.2%), and Architecture & Engineering (21 | 2.2%).
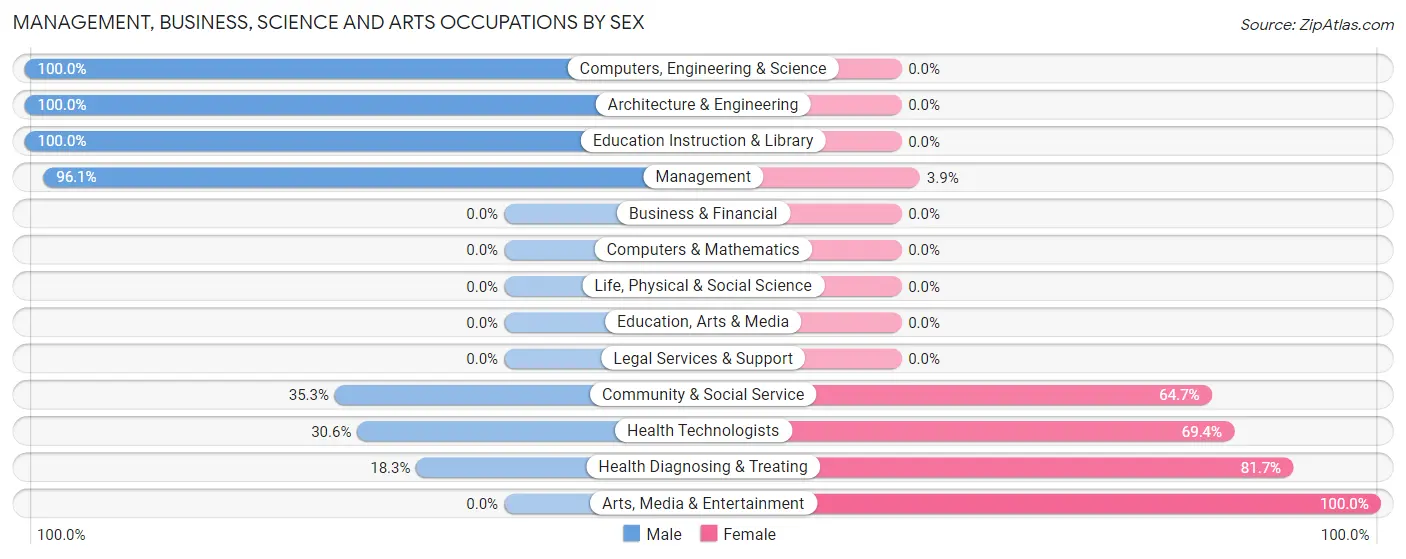
Management, Business, Science and Arts Occupations by Sex
Within the Management, Business, Science and Arts occupations in Desert Edge, the most male-oriented occupations are Computers, Engineering & Science (100.0%), Architecture & Engineering (100.0%), and Education Instruction & Library (100.0%), while the most female-oriented occupations are Arts, Media & Entertainment (100.0%), Health Diagnosing & Treating (81.7%), and Health Technologists (69.4%).
| Occupation | Male | Female |
| Management | 123 (96.1%) | 5 (3.9%) |
| Business & Financial | 0 (0.0%) | 0 (0.0%) |
| Computers, Engineering & Science | 21 (100.0%) | 0 (0.0%) |
| Computers & Mathematics | 0 (0.0%) | 0 (0.0%) |
| Architecture & Engineering | 21 (100.0%) | 0 (0.0%) |
| Life, Physical & Social Science | 0 (0.0%) | 0 (0.0%) |
| Community & Social Service | 6 (35.3%) | 11 (64.7%) |
| Education, Arts & Media | 0 (0.0%) | 0 (0.0%) |
| Legal Services & Support | 0 (0.0%) | 0 (0.0%) |
| Education Instruction & Library | 6 (100.0%) | 0 (0.0%) |
| Arts, Media & Entertainment | 0 (0.0%) | 11 (100.0%) |
| Health Diagnosing & Treating | 15 (18.3%) | 67 (81.7%) |
| Health Technologists | 15 (30.6%) | 34 (69.4%) |
| Total (Category) | 165 (66.5%) | 83 (33.5%) |
| Total (Overall) | 584 (60.4%) | 383 (39.6%) |
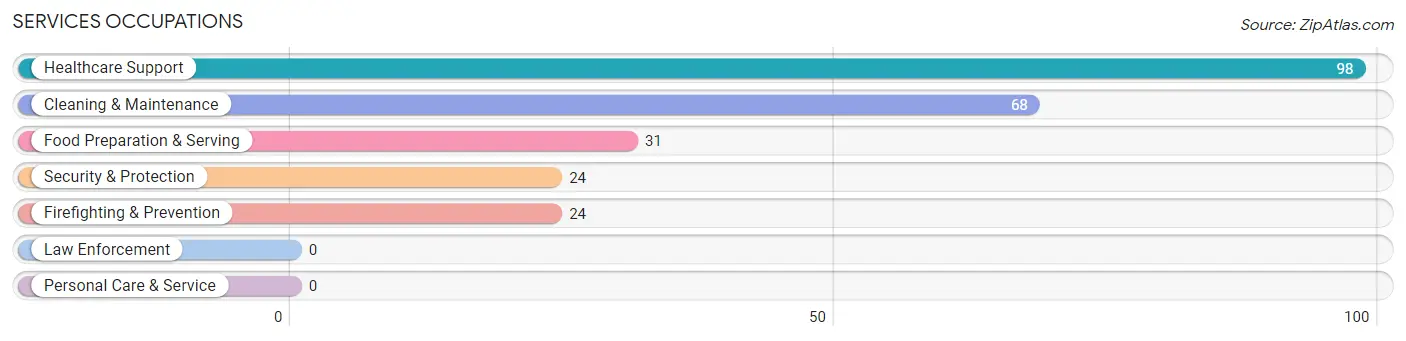
Services Occupations
The most common Services occupations in Desert Edge are Healthcare Support (98 | 10.1%), Cleaning & Maintenance (68 | 7.0%), Food Preparation & Serving (31 | 3.2%), Security & Protection (24 | 2.5%), and Firefighting & Prevention (24 | 2.5%).
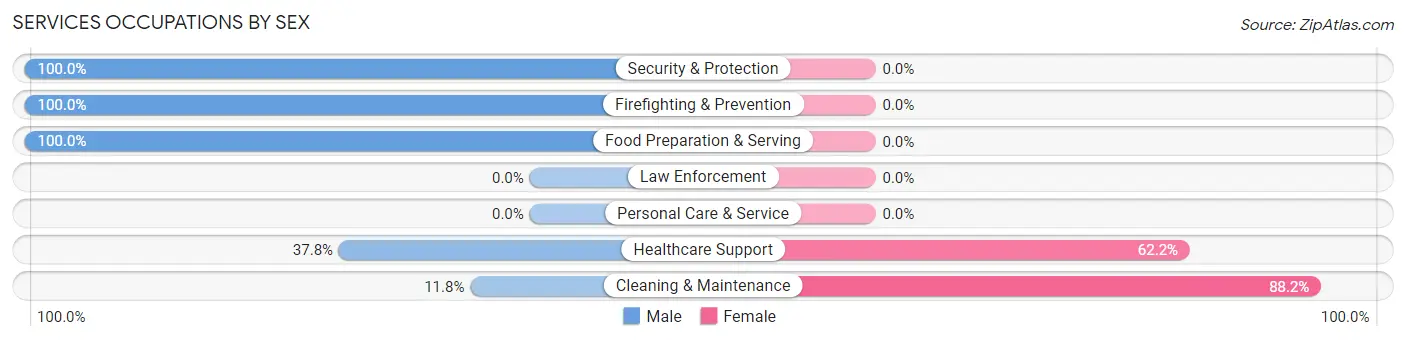
Services Occupations by Sex
Within the Services occupations in Desert Edge, the most male-oriented occupations are Security & Protection (100.0%), Firefighting & Prevention (100.0%), and Food Preparation & Serving (100.0%), while the most female-oriented occupations are Cleaning & Maintenance (88.2%), and Healthcare Support (62.2%).
| Occupation | Male | Female |
| Healthcare Support | 37 (37.8%) | 61 (62.2%) |
| Security & Protection | 24 (100.0%) | 0 (0.0%) |
| Firefighting & Prevention | 24 (100.0%) | 0 (0.0%) |
| Law Enforcement | 0 (0.0%) | 0 (0.0%) |
| Food Preparation & Serving | 31 (100.0%) | 0 (0.0%) |
| Cleaning & Maintenance | 8 (11.8%) | 60 (88.2%) |
| Personal Care & Service | 0 (0.0%) | 0 (0.0%) |
| Total (Category) | 100 (45.3%) | 121 (54.7%) |
| Total (Overall) | 584 (60.4%) | 383 (39.6%) |
Sales and Office Occupations
The most common Sales and Office occupations in Desert Edge are Office & Administration (168 | 17.4%), and Sales & Related (32 | 3.3%).
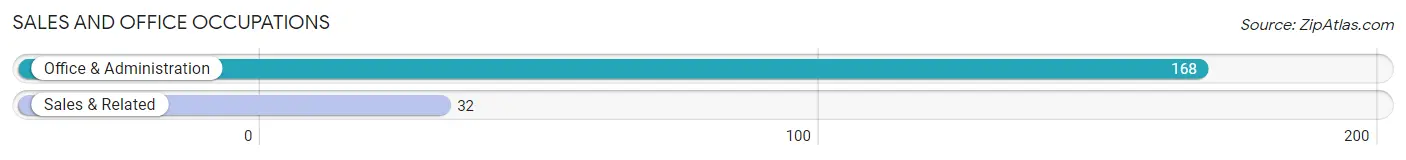
Sales and Office Occupations by Sex
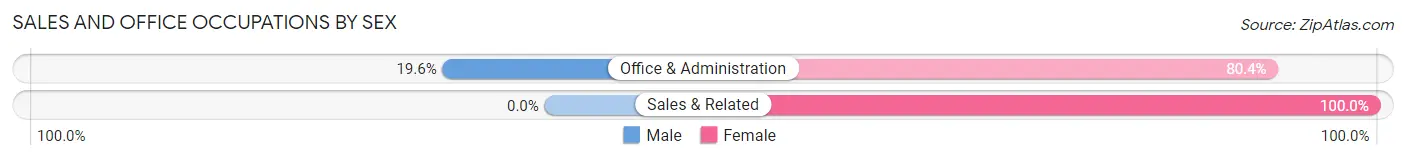
| Occupation | Male | Female |
| Sales & Related | 0 (0.0%) | 32 (100.0%) |
| Office & Administration | 33 (19.6%) | 135 (80.4%) |
| Total (Category) | 33 (16.5%) | 167 (83.5%) |
| Total (Overall) | 584 (60.4%) | 383 (39.6%) |
Natural Resources, Construction and Maintenance Occupations
The most common Natural Resources, Construction and Maintenance occupations in Desert Edge are Construction & Extraction (152 | 15.7%), Installation, Maintenance & Repair (82 | 8.5%), and Farming, Fishing & Forestry (25 | 2.6%).
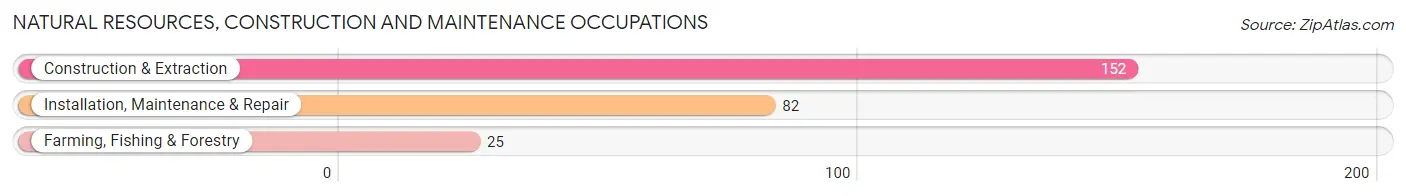
Natural Resources, Construction and Maintenance Occupations by Sex
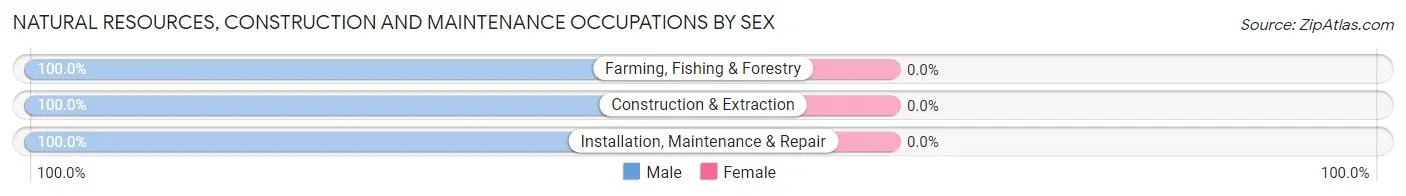
| Occupation | Male | Female |
| Farming, Fishing & Forestry | 25 (100.0%) | 0 (0.0%) |
| Construction & Extraction | 152 (100.0%) | 0 (0.0%) |
| Installation, Maintenance & Repair | 82 (100.0%) | 0 (0.0%) |
| Total (Category) | 259 (100.0%) | 0 (0.0%) |
| Total (Overall) | 584 (60.4%) | 383 (39.6%) |
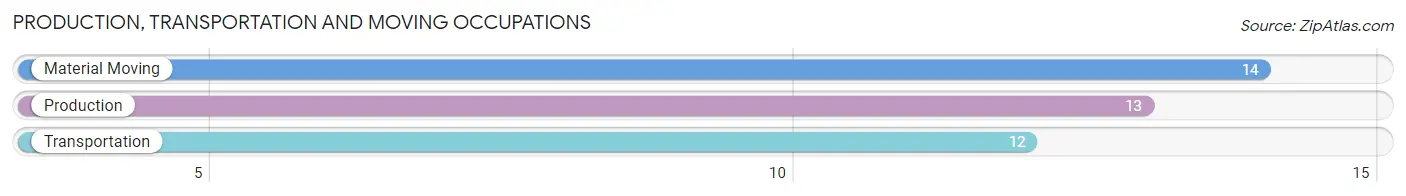
Production, Transportation and Moving Occupations
The most common Production, Transportation and Moving occupations in Desert Edge are Material Moving (14 | 1.5%), Production (13 | 1.3%), and Transportation (12 | 1.2%).
Production, Transportation and Moving Occupations by Sex
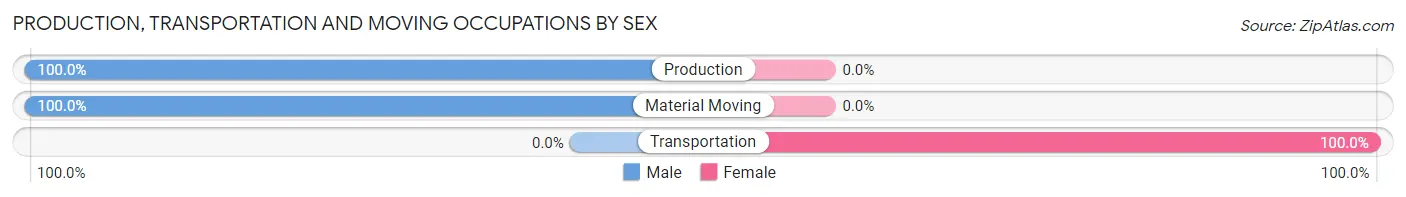
| Occupation | Male | Female |
| Production | 13 (100.0%) | 0 (0.0%) |
| Transportation | 0 (0.0%) | 12 (100.0%) |
| Material Moving | 14 (100.0%) | 0 (0.0%) |
| Total (Category) | 27 (69.2%) | 12 (30.8%) |
| Total (Overall) | 584 (60.4%) | 383 (39.6%) |
Employment Industries by Sex in Desert Edge
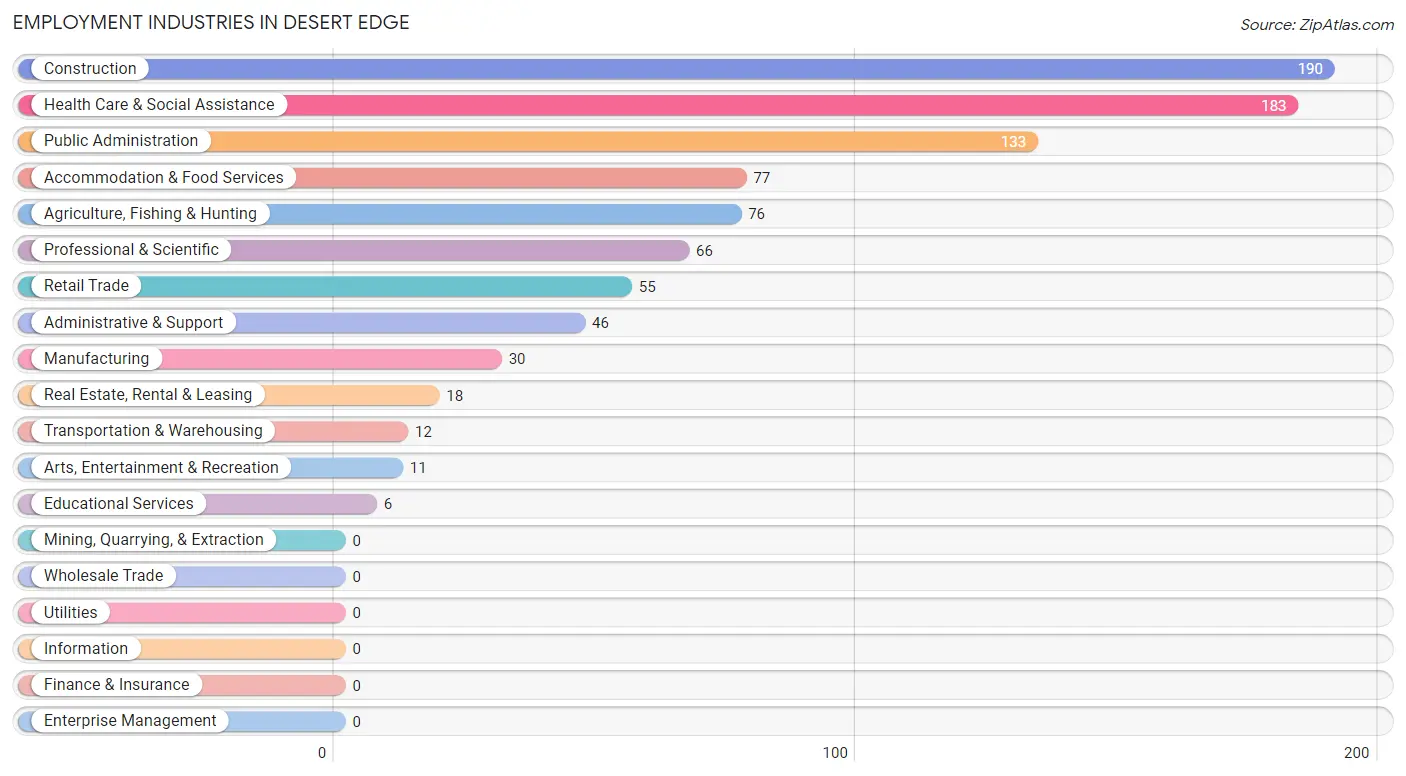
Employment Industries in Desert Edge
The major employment industries in Desert Edge include Construction (190 | 19.7%), Health Care & Social Assistance (183 | 18.9%), Public Administration (133 | 13.8%), Accommodation & Food Services (77 | 8.0%), and Agriculture, Fishing & Hunting (76 | 7.9%).
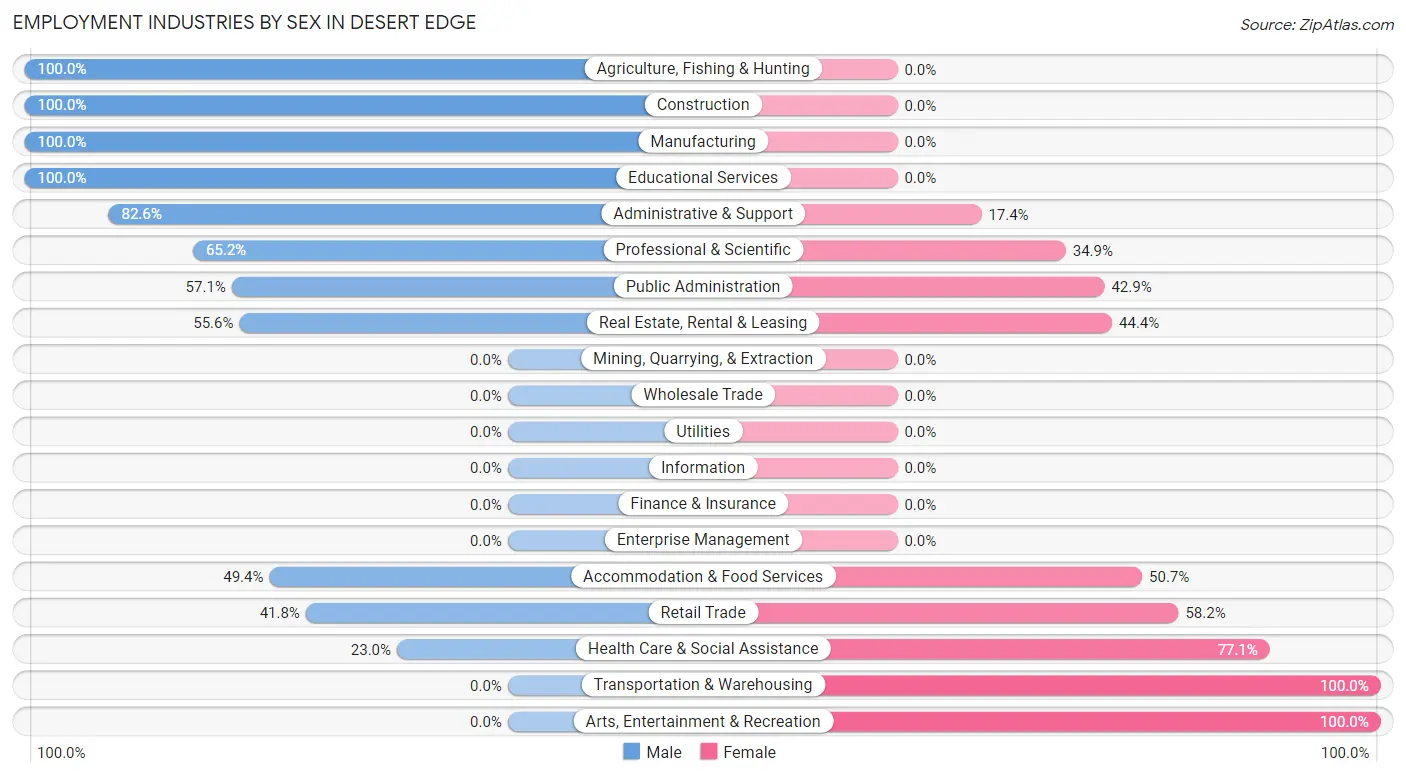
Employment Industries by Sex in Desert Edge
The Desert Edge industries that see more men than women are Agriculture, Fishing & Hunting (100.0%), Construction (100.0%), and Manufacturing (100.0%), whereas the industries that tend to have a higher number of women are Transportation & Warehousing (100.0%), Arts, Entertainment & Recreation (100.0%), and Health Care & Social Assistance (77.0%).
| Industry | Male | Female |
| Agriculture, Fishing & Hunting | 76 (100.0%) | 0 (0.0%) |
| Mining, Quarrying, & Extraction | 0 (0.0%) | 0 (0.0%) |
| Construction | 190 (100.0%) | 0 (0.0%) |
| Manufacturing | 30 (100.0%) | 0 (0.0%) |
| Wholesale Trade | 0 (0.0%) | 0 (0.0%) |
| Retail Trade | 23 (41.8%) | 32 (58.2%) |
| Transportation & Warehousing | 0 (0.0%) | 12 (100.0%) |
| Utilities | 0 (0.0%) | 0 (0.0%) |
| Information | 0 (0.0%) | 0 (0.0%) |
| Finance & Insurance | 0 (0.0%) | 0 (0.0%) |
| Real Estate, Rental & Leasing | 10 (55.6%) | 8 (44.4%) |
| Professional & Scientific | 43 (65.1%) | 23 (34.8%) |
| Enterprise Management | 0 (0.0%) | 0 (0.0%) |
| Administrative & Support | 38 (82.6%) | 8 (17.4%) |
| Educational Services | 6 (100.0%) | 0 (0.0%) |
| Health Care & Social Assistance | 42 (23.0%) | 141 (77.0%) |
| Arts, Entertainment & Recreation | 0 (0.0%) | 11 (100.0%) |
| Accommodation & Food Services | 38 (49.3%) | 39 (50.6%) |
| Public Administration | 76 (57.1%) | 57 (42.9%) |
| Total | 584 (60.4%) | 383 (39.6%) |
Education in Desert Edge
School Enrollment in Desert Edge
The most common levels of schooling among the 464 students in Desert Edge are college / undergraduate (171 | 36.8%), middle school (154 | 33.2%), and elementary school (64 | 13.8%).
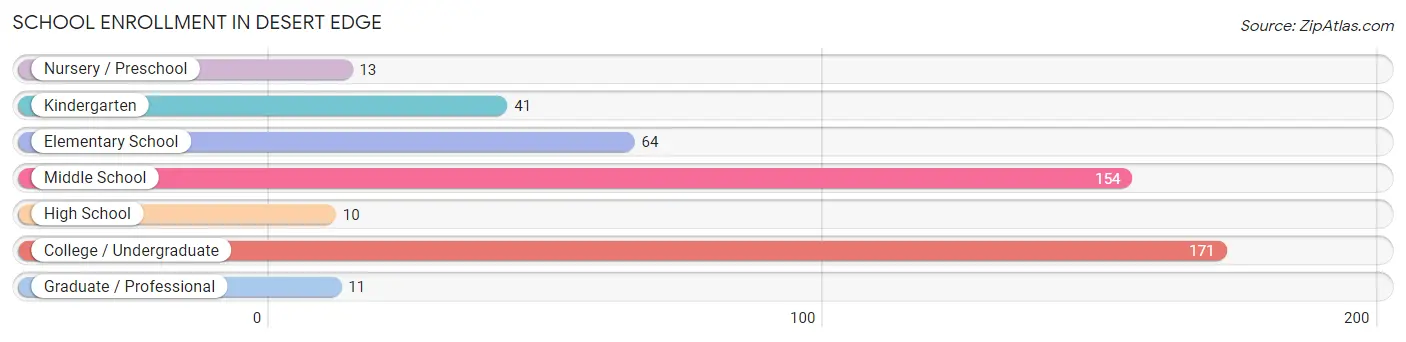
| School Level | # Students | % Students |
| Nursery / Preschool | 13 | 2.8% |
| Kindergarten | 41 | 8.8% |
| Elementary School | 64 | 13.8% |
| Middle School | 154 | 33.2% |
| High School | 10 | 2.2% |
| College / Undergraduate | 171 | 36.8% |
| Graduate / Professional | 11 | 2.4% |
| Total | 464 | 100.0% |
School Enrollment by Age by Funding Source in Desert Edge
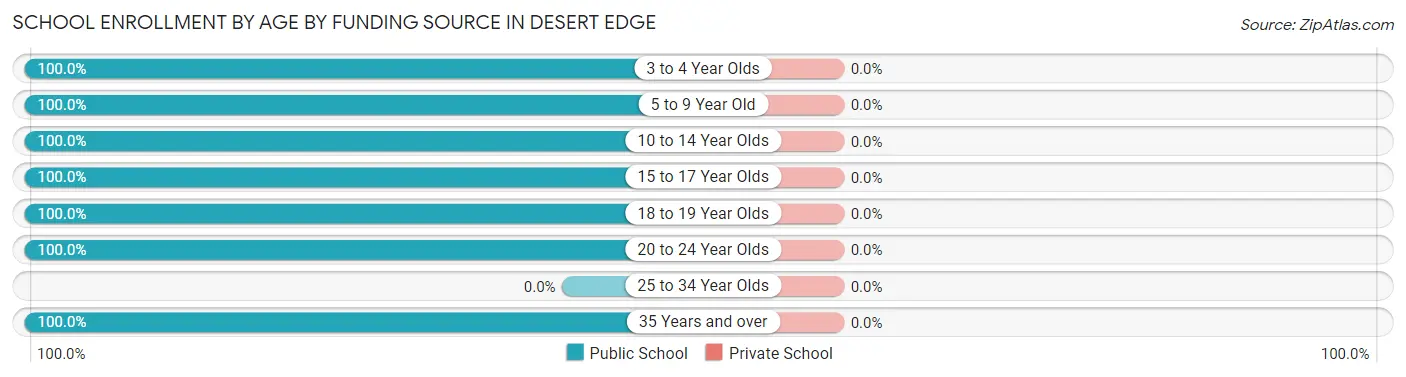
| Age Bracket | Public School | Private School |
| 3 to 4 Year Olds | 13 (100.0%) | 0 (0.0%) |
| 5 to 9 Year Old | 105 (100.0%) | 0 (0.0%) |
| 10 to 14 Year Olds | 154 (100.0%) | 0 (0.0%) |
| 15 to 17 Year Olds | 10 (100.0%) | 0 (0.0%) |
| 18 to 19 Year Olds | 12 (100.0%) | 0 (0.0%) |
| 20 to 24 Year Olds | 63 (100.0%) | 0 (0.0%) |
| 25 to 34 Year Olds | 0 (0.0%) | 0 (0.0%) |
| 35 Years and over | 107 (100.0%) | 0 (0.0%) |
| Total | 464 (100.0%) | 0 (0.0%) |
Educational Attainment by Field of Study in Desert Edge
Business (132 | 22.3%), psychology (108 | 18.3%), education (69 | 11.7%), liberal arts & history (59 | 10.0%), and engineering (43 | 7.3%) are the most common fields of study among 591 individuals in Desert Edge who have obtained a bachelor's degree or higher.
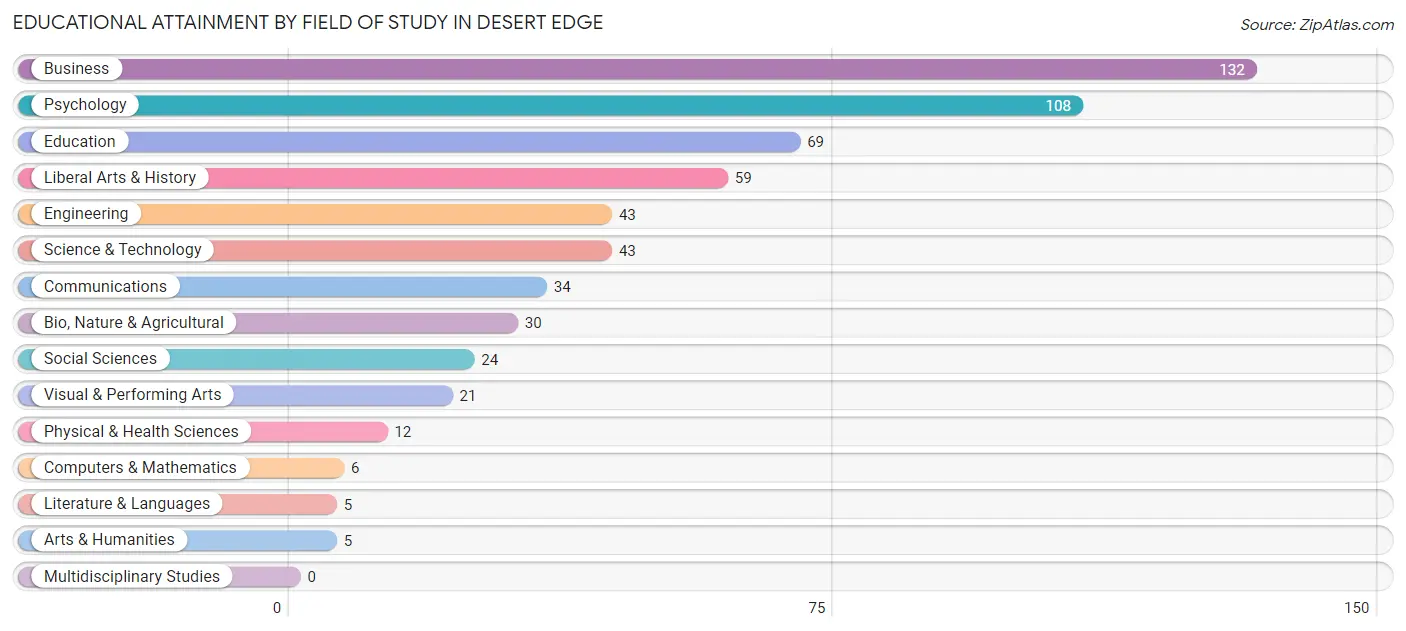
| Field of Study | # Graduates | % Graduates |
| Computers & Mathematics | 6 | 1.0% |
| Bio, Nature & Agricultural | 30 | 5.1% |
| Physical & Health Sciences | 12 | 2.0% |
| Psychology | 108 | 18.3% |
| Social Sciences | 24 | 4.1% |
| Engineering | 43 | 7.3% |
| Multidisciplinary Studies | 0 | 0.0% |
| Science & Technology | 43 | 7.3% |
| Business | 132 | 22.3% |
| Education | 69 | 11.7% |
| Literature & Languages | 5 | 0.9% |
| Liberal Arts & History | 59 | 10.0% |
| Visual & Performing Arts | 21 | 3.5% |
| Communications | 34 | 5.8% |
| Arts & Humanities | 5 | 0.9% |
| Total | 591 | 100.0% |
Transportation & Commute in Desert Edge
Vehicle Availability by Sex in Desert Edge
The most prevalent vehicle ownership categories in Desert Edge are males with 3 vehicles (254, accounting for 44.9%) and females with 3 vehicles (177, making up 66.3%).
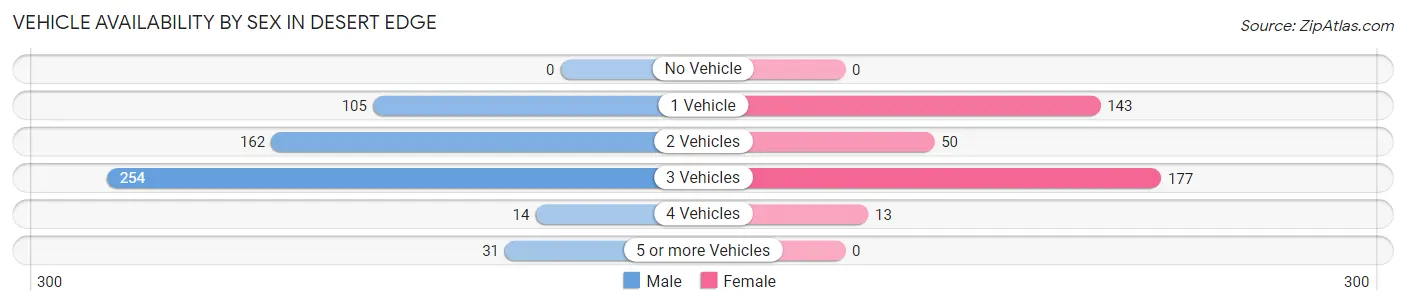
| Vehicles Available | Male | Female |
| No Vehicle | 0 (0.0%) | 0 (0.0%) |
| 1 Vehicle | 105 (18.5%) | 143 (37.3%) |
| 2 Vehicles | 162 (28.6%) | 50 (13.1%) |
| 3 Vehicles | 254 (44.9%) | 177 (46.2%) |
| 4 Vehicles | 14 (2.5%) | 13 (3.4%) |
| 5 or more Vehicles | 31 (5.5%) | 0 (0.0%) |
| Total | 566 (100.0%) | 383 (100.0%) |
Commute Time in Desert Edge
The most frequently occuring commute durations in Desert Edge are 20 to 24 minutes (300 commuters, 35.4%), 15 to 19 minutes (108 commuters, 12.7%), and 25 to 29 minutes (96 commuters, 11.3%).
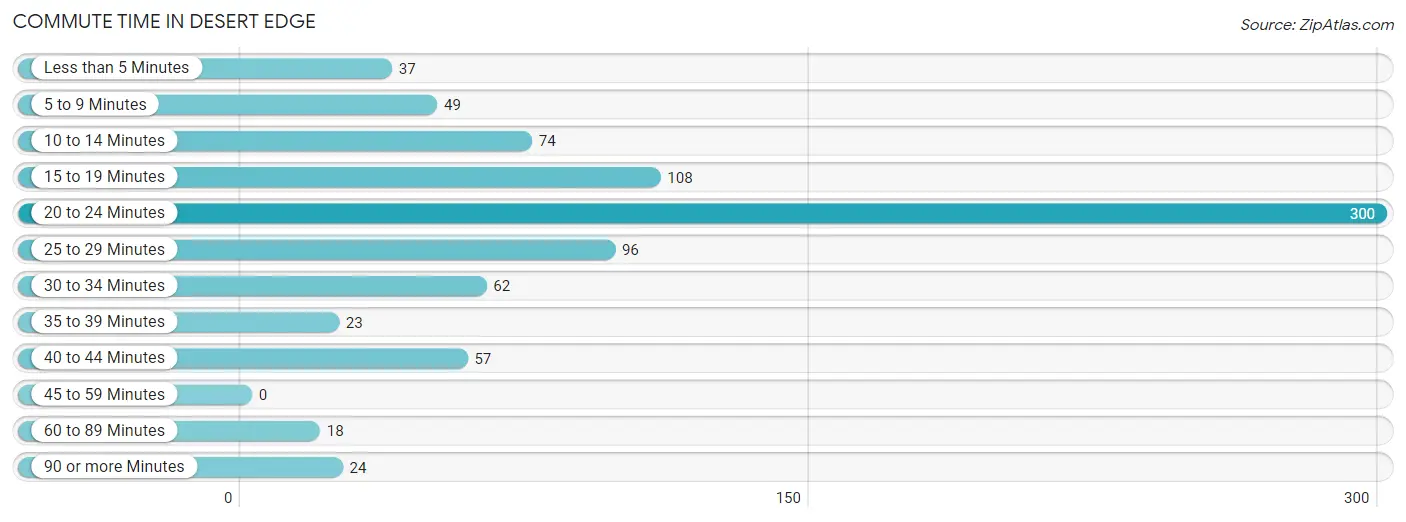
| Commute Time | # Commuters | % Commuters |
| Less than 5 Minutes | 37 | 4.4% |
| 5 to 9 Minutes | 49 | 5.8% |
| 10 to 14 Minutes | 74 | 8.7% |
| 15 to 19 Minutes | 108 | 12.7% |
| 20 to 24 Minutes | 300 | 35.4% |
| 25 to 29 Minutes | 96 | 11.3% |
| 30 to 34 Minutes | 62 | 7.3% |
| 35 to 39 Minutes | 23 | 2.7% |
| 40 to 44 Minutes | 57 | 6.7% |
| 45 to 59 Minutes | 0 | 0.0% |
| 60 to 89 Minutes | 18 | 2.1% |
| 90 or more Minutes | 24 | 2.8% |
Commute Time by Sex in Desert Edge
The most common commute times in Desert Edge are 20 to 24 minutes (157 commuters, 31.8%) for males and 20 to 24 minutes (143 commuters, 40.4%) for females.
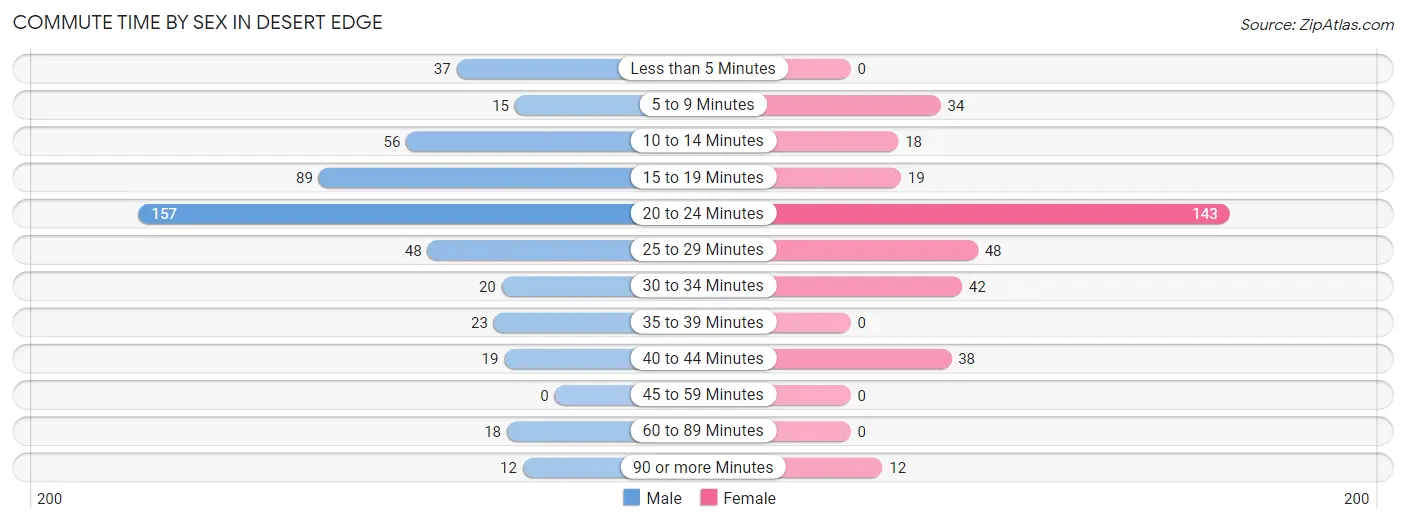
| Commute Time | Male | Female |
| Less than 5 Minutes | 37 (7.5%) | 0 (0.0%) |
| 5 to 9 Minutes | 15 (3.0%) | 34 (9.6%) |
| 10 to 14 Minutes | 56 (11.3%) | 18 (5.1%) |
| 15 to 19 Minutes | 89 (18.0%) | 19 (5.4%) |
| 20 to 24 Minutes | 157 (31.8%) | 143 (40.4%) |
| 25 to 29 Minutes | 48 (9.7%) | 48 (13.6%) |
| 30 to 34 Minutes | 20 (4.1%) | 42 (11.9%) |
| 35 to 39 Minutes | 23 (4.7%) | 0 (0.0%) |
| 40 to 44 Minutes | 19 (3.8%) | 38 (10.7%) |
| 45 to 59 Minutes | 0 (0.0%) | 0 (0.0%) |
| 60 to 89 Minutes | 18 (3.6%) | 0 (0.0%) |
| 90 or more Minutes | 12 (2.4%) | 12 (3.4%) |
Time of Departure to Work by Sex in Desert Edge
The most frequent times of departure to work in Desert Edge are 7:30 AM to 7:59 AM (102, 20.6%) for males and 7:30 AM to 7:59 AM (88, 24.9%) for females.
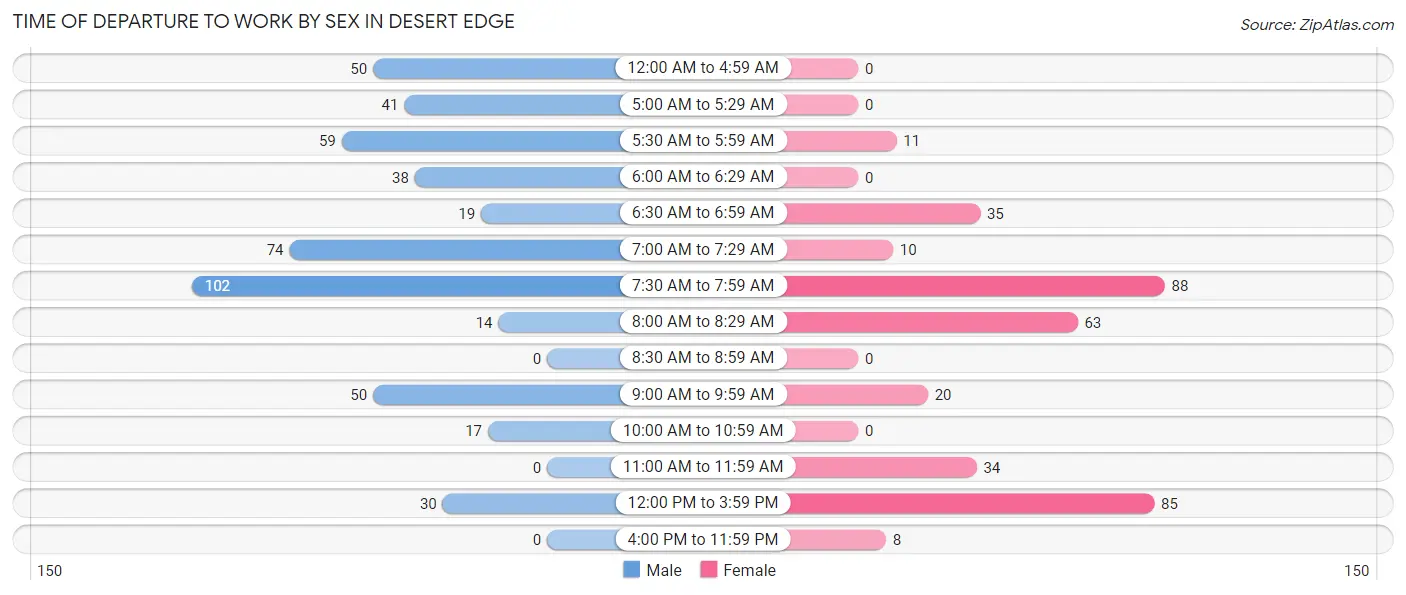
| Time of Departure | Male | Female |
| 12:00 AM to 4:59 AM | 50 (10.1%) | 0 (0.0%) |
| 5:00 AM to 5:29 AM | 41 (8.3%) | 0 (0.0%) |
| 5:30 AM to 5:59 AM | 59 (11.9%) | 11 (3.1%) |
| 6:00 AM to 6:29 AM | 38 (7.7%) | 0 (0.0%) |
| 6:30 AM to 6:59 AM | 19 (3.8%) | 35 (9.9%) |
| 7:00 AM to 7:29 AM | 74 (15.0%) | 10 (2.8%) |
| 7:30 AM to 7:59 AM | 102 (20.6%) | 88 (24.9%) |
| 8:00 AM to 8:29 AM | 14 (2.8%) | 63 (17.8%) |
| 8:30 AM to 8:59 AM | 0 (0.0%) | 0 (0.0%) |
| 9:00 AM to 9:59 AM | 50 (10.1%) | 20 (5.7%) |
| 10:00 AM to 10:59 AM | 17 (3.4%) | 0 (0.0%) |
| 11:00 AM to 11:59 AM | 0 (0.0%) | 34 (9.6%) |
| 12:00 PM to 3:59 PM | 30 (6.1%) | 85 (24.0%) |
| 4:00 PM to 11:59 PM | 0 (0.0%) | 8 (2.3%) |
| Total | 494 (100.0%) | 354 (100.0%) |
Housing Occupancy in Desert Edge
Occupancy by Ownership in Desert Edge
Of the total 1,935 dwellings in Desert Edge, owner-occupied units account for 1,692 (87.4%), while renter-occupied units make up 243 (12.6%).
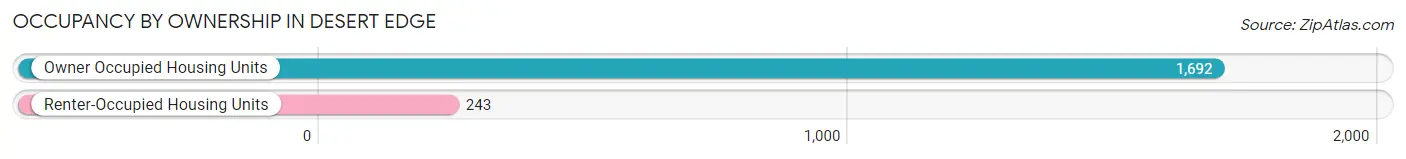
| Occupancy | # Housing Units | % Housing Units |
| Owner Occupied Housing Units | 1,692 | 87.4% |
| Renter-Occupied Housing Units | 243 | 12.6% |
| Total Occupied Housing Units | 1,935 | 100.0% |
Occupancy by Household Size in Desert Edge
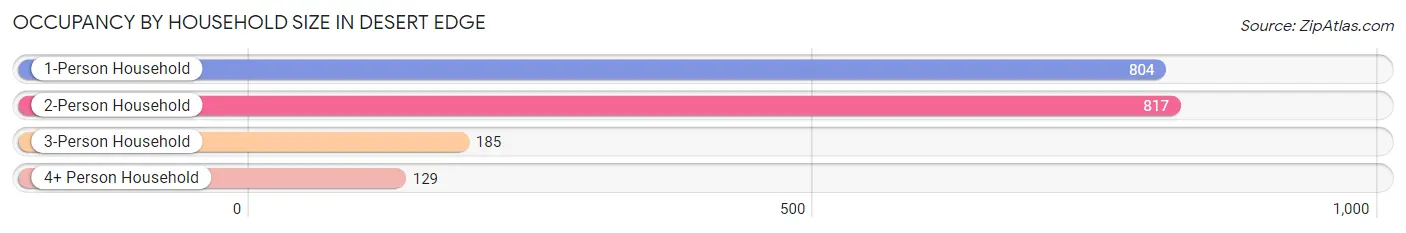
| Household Size | # Housing Units | % Housing Units |
| 1-Person Household | 804 | 41.5% |
| 2-Person Household | 817 | 42.2% |
| 3-Person Household | 185 | 9.6% |
| 4+ Person Household | 129 | 6.7% |
| Total Housing Units | 1,935 | 100.0% |
Occupancy by Ownership by Household Size in Desert Edge
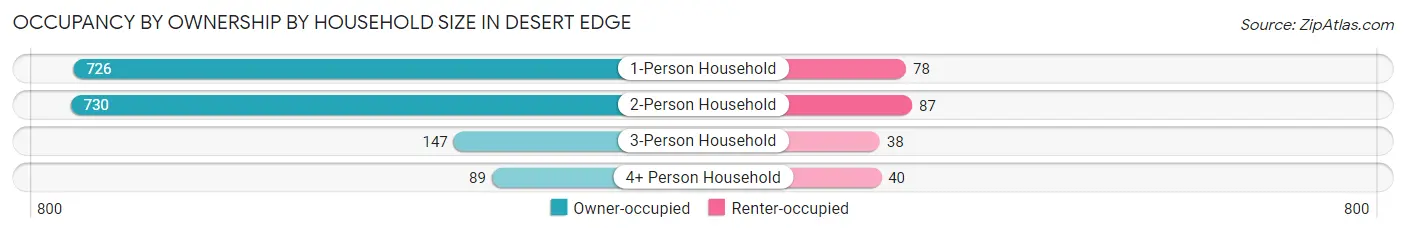
| Household Size | Owner-occupied | Renter-occupied |
| 1-Person Household | 726 (90.3%) | 78 (9.7%) |
| 2-Person Household | 730 (89.3%) | 87 (10.6%) |
| 3-Person Household | 147 (79.5%) | 38 (20.5%) |
| 4+ Person Household | 89 (69.0%) | 40 (31.0%) |
| Total Housing Units | 1,692 (87.4%) | 243 (12.6%) |
Occupancy by Educational Attainment in Desert Edge
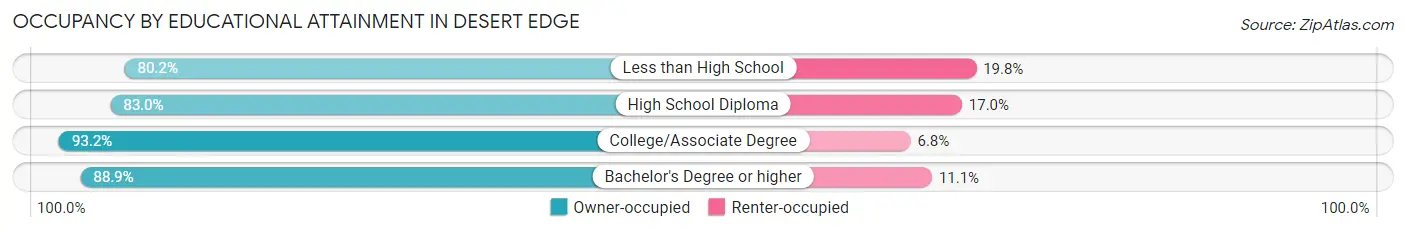
| Household Size | Owner-occupied | Renter-occupied |
| Less than High School | 190 (80.2%) | 47 (19.8%) |
| High School Diploma | 508 (83.0%) | 104 (17.0%) |
| College/Associate Degree | 616 (93.2%) | 45 (6.8%) |
| Bachelor's Degree or higher | 378 (88.9%) | 47 (11.1%) |
Occupancy by Age of Householder in Desert Edge
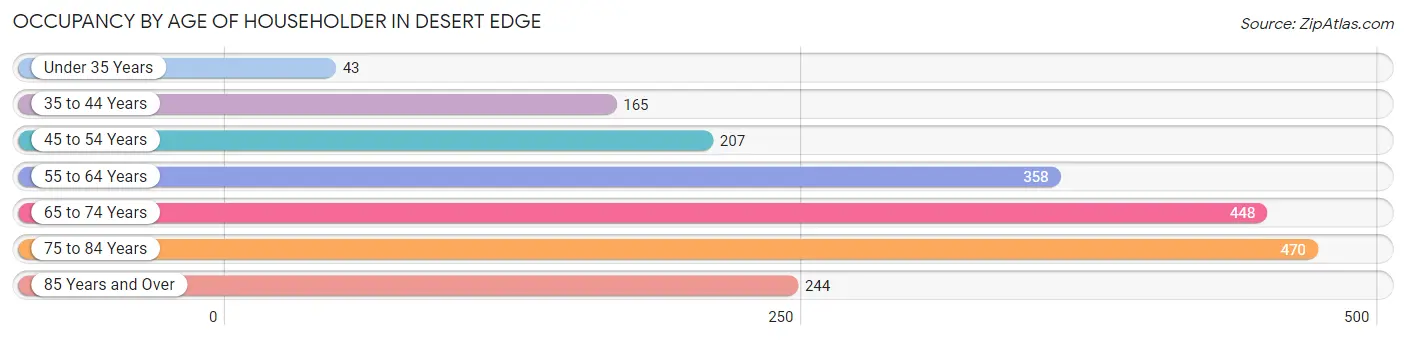
| Age Bracket | # Households | % Households |
| Under 35 Years | 43 | 2.2% |
| 35 to 44 Years | 165 | 8.5% |
| 45 to 54 Years | 207 | 10.7% |
| 55 to 64 Years | 358 | 18.5% |
| 65 to 74 Years | 448 | 23.2% |
| 75 to 84 Years | 470 | 24.3% |
| 85 Years and Over | 244 | 12.6% |
| Total | 1,935 | 100.0% |
Housing Finances in Desert Edge
Median Income by Occupancy in Desert Edge
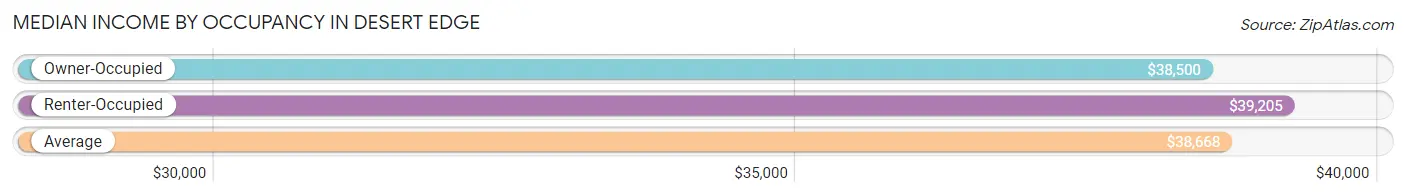
| Occupancy Type | # Households | Median Income |
| Owner-Occupied | 1,692 (87.4%) | $38,500 |
| Renter-Occupied | 243 (12.6%) | $39,205 |
| Average | 1,935 (100.0%) | $38,668 |
Occupancy by Householder Income Bracket in Desert Edge
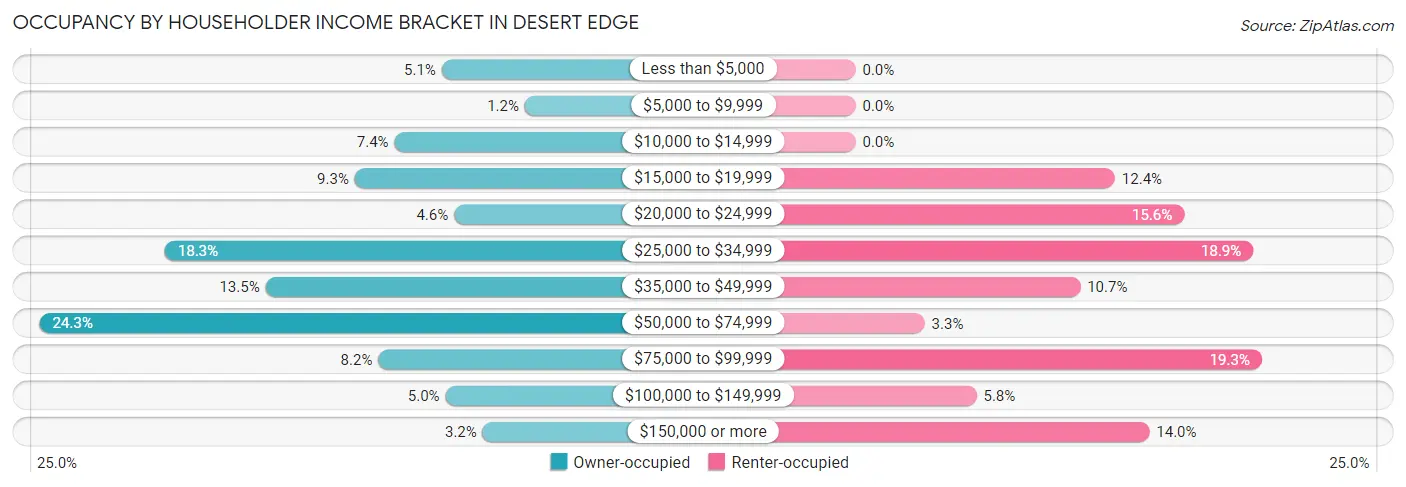
| Income Bracket | Owner-occupied | Renter-occupied |
| Less than $5,000 | 87 (5.1%) | 0 (0.0%) |
| $5,000 to $9,999 | 20 (1.2%) | 0 (0.0%) |
| $10,000 to $14,999 | 125 (7.4%) | 0 (0.0%) |
| $15,000 to $19,999 | 157 (9.3%) | 30 (12.3%) |
| $20,000 to $24,999 | 77 (4.5%) | 38 (15.6%) |
| $25,000 to $34,999 | 310 (18.3%) | 46 (18.9%) |
| $35,000 to $49,999 | 229 (13.5%) | 26 (10.7%) |
| $50,000 to $74,999 | 411 (24.3%) | 8 (3.3%) |
| $75,000 to $99,999 | 138 (8.2%) | 47 (19.3%) |
| $100,000 to $149,999 | 84 (5.0%) | 14 (5.8%) |
| $150,000 or more | 54 (3.2%) | 34 (14.0%) |
| Total | 1,692 (100.0%) | 243 (100.0%) |
Monthly Housing Cost Tiers in Desert Edge
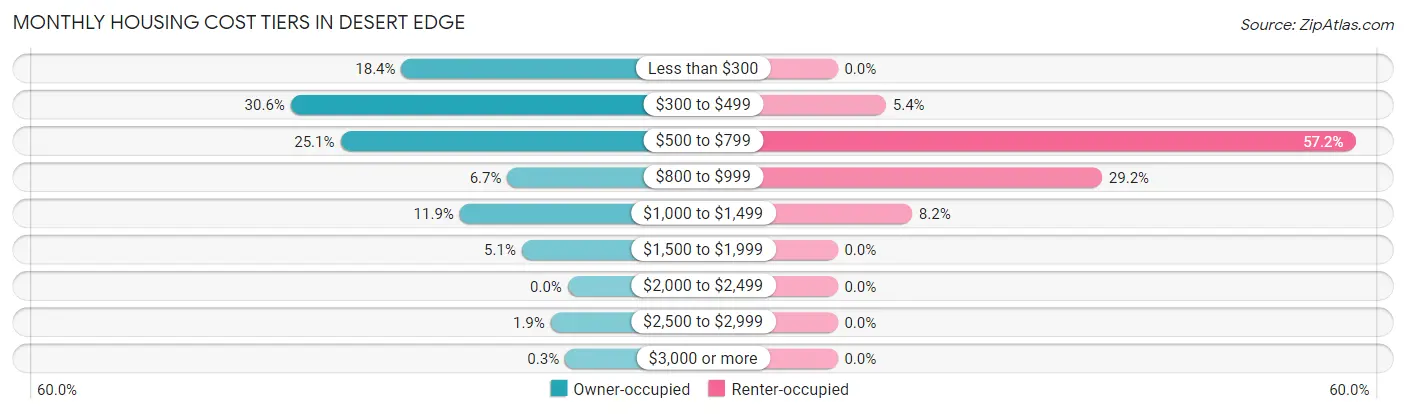
| Monthly Cost | Owner-occupied | Renter-occupied |
| Less than $300 | 311 (18.4%) | 0 (0.0%) |
| $300 to $499 | 518 (30.6%) | 13 (5.3%) |
| $500 to $799 | 425 (25.1%) | 139 (57.2%) |
| $800 to $999 | 113 (6.7%) | 71 (29.2%) |
| $1,000 to $1,499 | 202 (11.9%) | 20 (8.2%) |
| $1,500 to $1,999 | 86 (5.1%) | 0 (0.0%) |
| $2,000 to $2,499 | 0 (0.0%) | 0 (0.0%) |
| $2,500 to $2,999 | 32 (1.9%) | 0 (0.0%) |
| $3,000 or more | 5 (0.3%) | 0 (0.0%) |
| Total | 1,692 (100.0%) | 243 (100.0%) |
Physical Housing Characteristics in Desert Edge
Housing Structures in Desert Edge
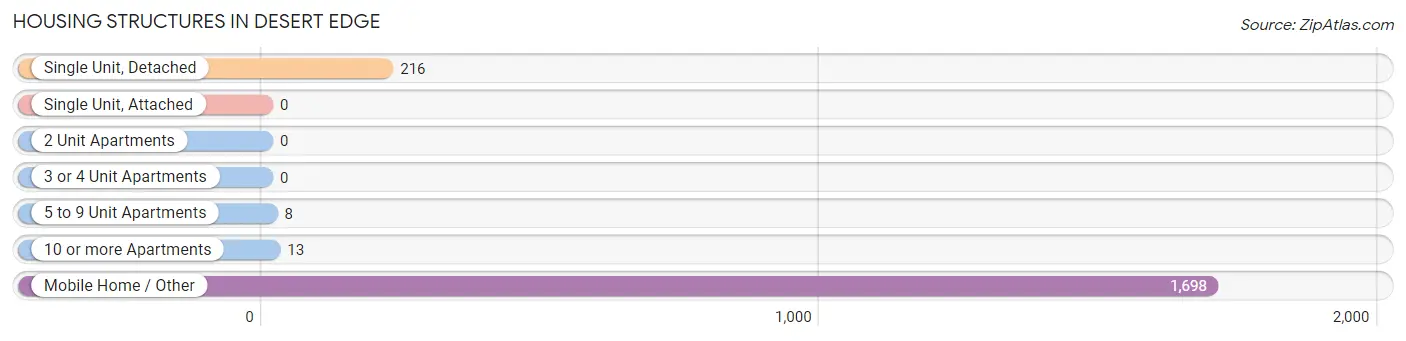
| Structure Type | # Housing Units | % Housing Units |
| Single Unit, Detached | 216 | 11.2% |
| Single Unit, Attached | 0 | 0.0% |
| 2 Unit Apartments | 0 | 0.0% |
| 3 or 4 Unit Apartments | 0 | 0.0% |
| 5 to 9 Unit Apartments | 8 | 0.4% |
| 10 or more Apartments | 13 | 0.7% |
| Mobile Home / Other | 1,698 | 87.7% |
| Total | 1,935 | 100.0% |
Housing Structures by Occupancy in Desert Edge
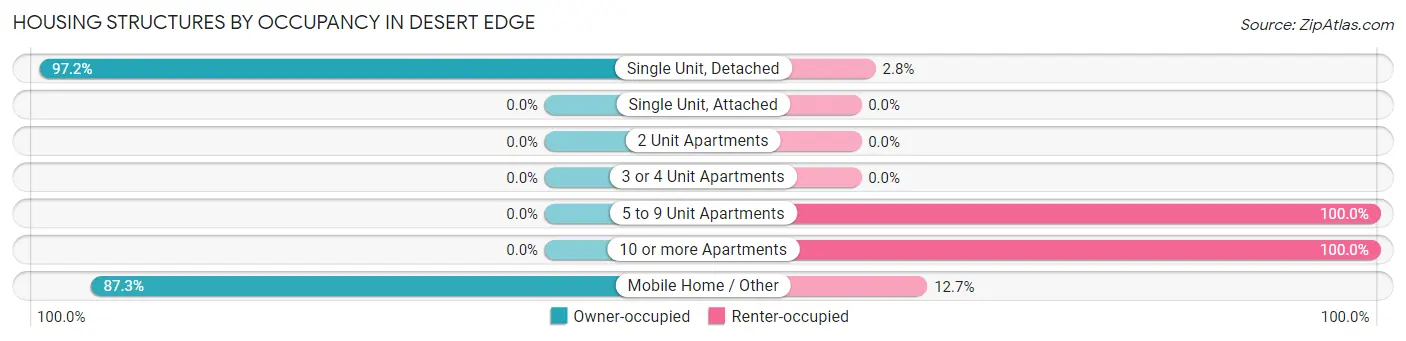
| Structure Type | Owner-occupied | Renter-occupied |
| Single Unit, Detached | 210 (97.2%) | 6 (2.8%) |
| Single Unit, Attached | 0 (0.0%) | 0 (0.0%) |
| 2 Unit Apartments | 0 (0.0%) | 0 (0.0%) |
| 3 or 4 Unit Apartments | 0 (0.0%) | 0 (0.0%) |
| 5 to 9 Unit Apartments | 0 (0.0%) | 8 (100.0%) |
| 10 or more Apartments | 0 (0.0%) | 13 (100.0%) |
| Mobile Home / Other | 1,482 (87.3%) | 216 (12.7%) |
| Total | 1,692 (87.4%) | 243 (12.6%) |
Housing Structures by Number of Rooms in Desert Edge
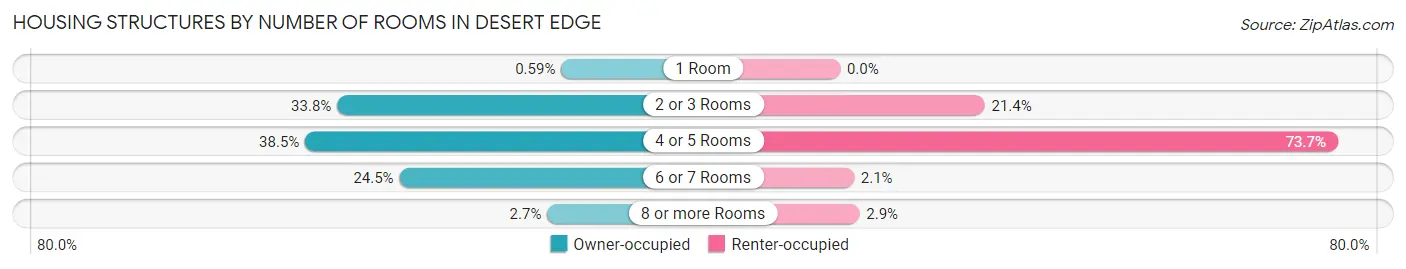
| Number of Rooms | Owner-occupied | Renter-occupied |
| 1 Room | 10 (0.6%) | 0 (0.0%) |
| 2 or 3 Rooms | 571 (33.8%) | 52 (21.4%) |
| 4 or 5 Rooms | 651 (38.5%) | 179 (73.7%) |
| 6 or 7 Rooms | 415 (24.5%) | 5 (2.1%) |
| 8 or more Rooms | 45 (2.7%) | 7 (2.9%) |
| Total | 1,692 (100.0%) | 243 (100.0%) |
Housing Structure by Heating Type in Desert Edge
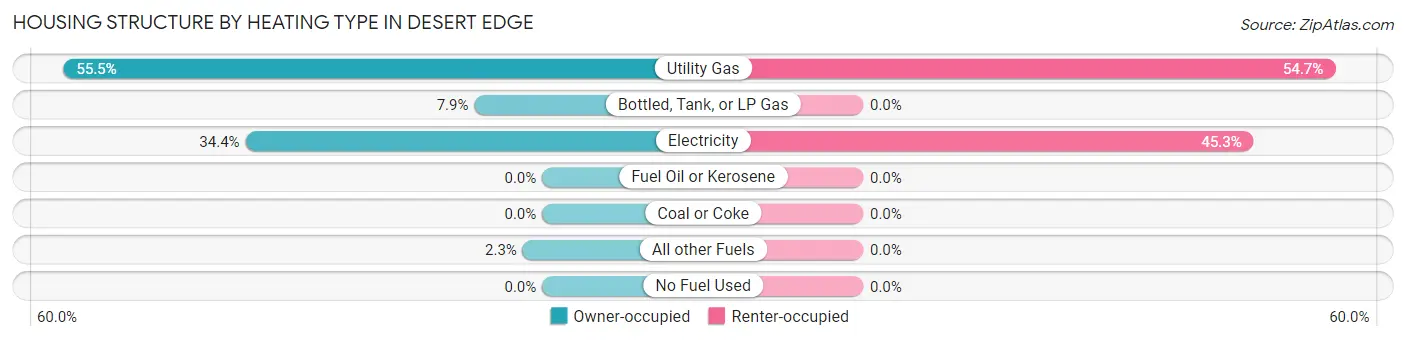
| Heating Type | Owner-occupied | Renter-occupied |
| Utility Gas | 939 (55.5%) | 133 (54.7%) |
| Bottled, Tank, or LP Gas | 133 (7.9%) | 0 (0.0%) |
| Electricity | 582 (34.4%) | 110 (45.3%) |
| Fuel Oil or Kerosene | 0 (0.0%) | 0 (0.0%) |
| Coal or Coke | 0 (0.0%) | 0 (0.0%) |
| All other Fuels | 38 (2.2%) | 0 (0.0%) |
| No Fuel Used | 0 (0.0%) | 0 (0.0%) |
| Total | 1,692 (100.0%) | 243 (100.0%) |
Household Vehicle Usage in Desert Edge
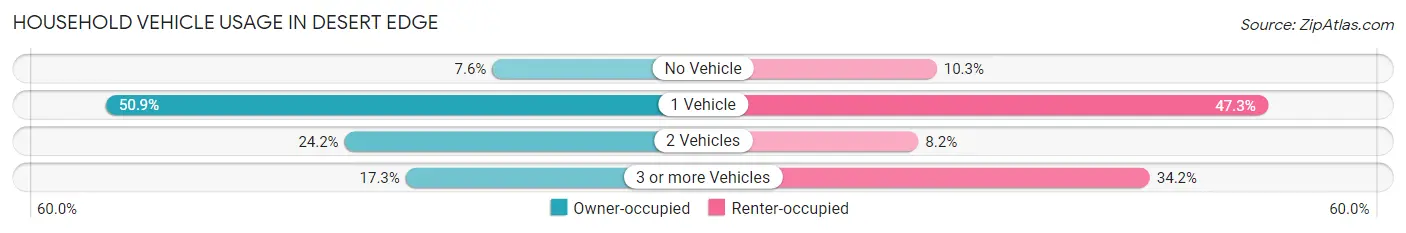
| Vehicles per Household | Owner-occupied | Renter-occupied |
| No Vehicle | 129 (7.6%) | 25 (10.3%) |
| 1 Vehicle | 861 (50.9%) | 115 (47.3%) |
| 2 Vehicles | 409 (24.2%) | 20 (8.2%) |
| 3 or more Vehicles | 293 (17.3%) | 83 (34.2%) |
| Total | 1,692 (100.0%) | 243 (100.0%) |
Real Estate & Mortgages in Desert Edge
Real Estate and Mortgage Overview in Desert Edge
| Characteristic | Without Mortgage | With Mortgage |
| Housing Units | 1,531 | 161 |
| Median Property Value | $50,900 | $269,900 |
| Median Household Income | $37,433 | $15 |
| Monthly Housing Costs | $447 | $5 |
| Real Estate Taxes | $426 | $12 |
Property Value by Mortgage Status in Desert Edge
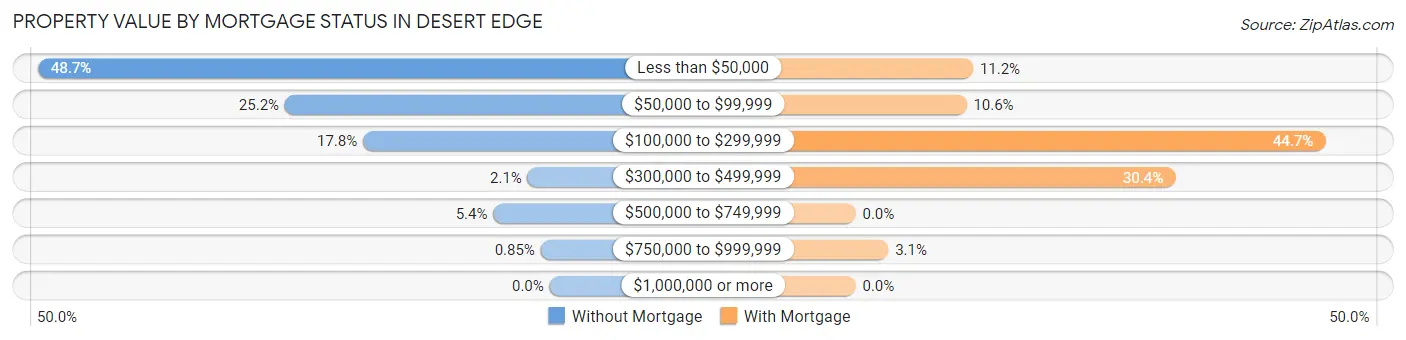
| Property Value | Without Mortgage | With Mortgage |
| Less than $50,000 | 746 (48.7%) | 18 (11.2%) |
| $50,000 to $99,999 | 386 (25.2%) | 17 (10.6%) |
| $100,000 to $299,999 | 272 (17.8%) | 72 (44.7%) |
| $300,000 to $499,999 | 32 (2.1%) | 49 (30.4%) |
| $500,000 to $749,999 | 82 (5.4%) | 0 (0.0%) |
| $750,000 to $999,999 | 13 (0.9%) | 5 (3.1%) |
| $1,000,000 or more | 0 (0.0%) | 0 (0.0%) |
| Total | 1,531 (100.0%) | 161 (100.0%) |
Household Income by Mortgage Status in Desert Edge
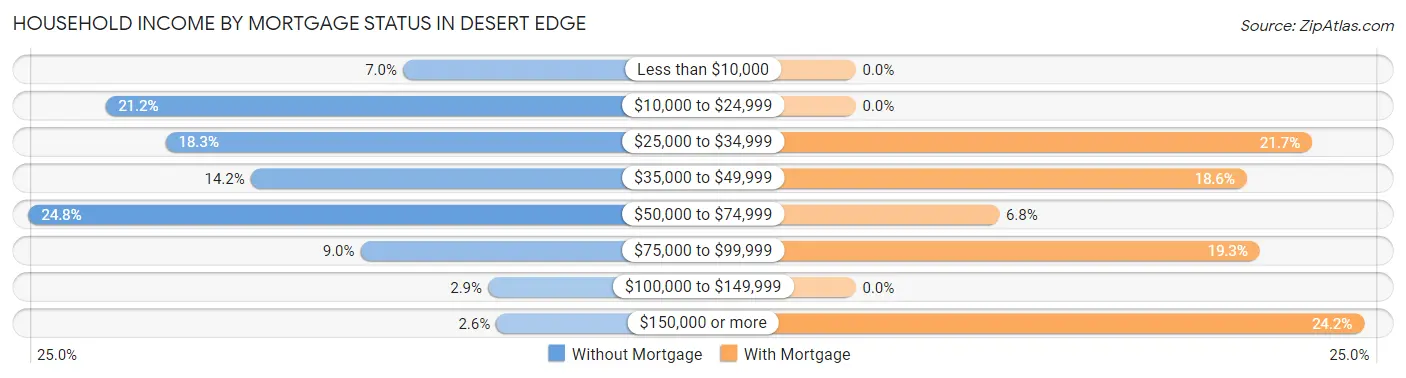
| Household Income | Without Mortgage | With Mortgage |
| Less than $10,000 | 107 (7.0%) | 0 (0.0%) |
| $10,000 to $24,999 | 324 (21.2%) | 0 (0.0%) |
| $25,000 to $34,999 | 280 (18.3%) | 35 (21.7%) |
| $35,000 to $49,999 | 218 (14.2%) | 30 (18.6%) |
| $50,000 to $74,999 | 380 (24.8%) | 11 (6.8%) |
| $75,000 to $99,999 | 138 (9.0%) | 31 (19.3%) |
| $100,000 to $149,999 | 45 (2.9%) | 0 (0.0%) |
| $150,000 or more | 39 (2.5%) | 39 (24.2%) |
| Total | 1,531 (100.0%) | 161 (100.0%) |
Property Value to Household Income Ratio in Desert Edge
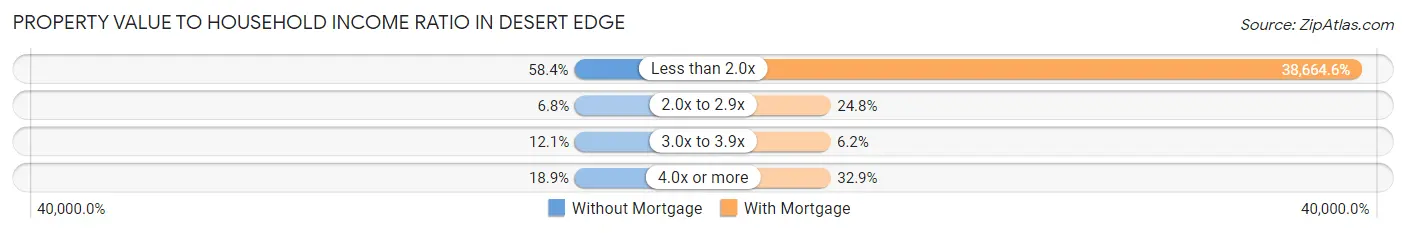
| Value-to-Income Ratio | Without Mortgage | With Mortgage |
| Less than 2.0x | 894 (58.4%) | 62,250 (38,664.6%) |
| 2.0x to 2.9x | 104 (6.8%) | 40 (24.8%) |
| 3.0x to 3.9x | 185 (12.1%) | 10 (6.2%) |
| 4.0x or more | 290 (18.9%) | 53 (32.9%) |
| Total | 1,531 (100.0%) | 161 (100.0%) |
Real Estate Taxes by Mortgage Status in Desert Edge
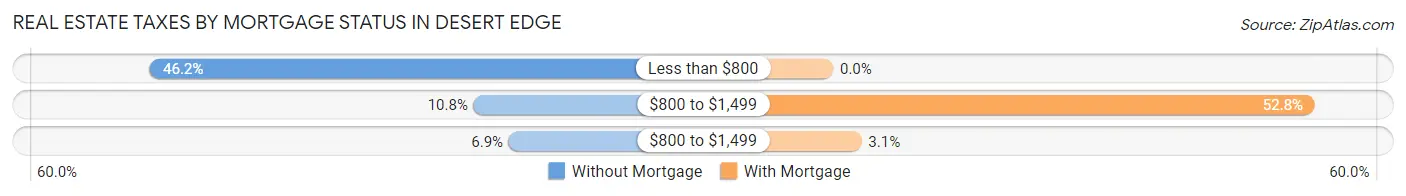
| Property Taxes | Without Mortgage | With Mortgage |
| Less than $800 | 708 (46.2%) | 0 (0.0%) |
| $800 to $1,499 | 165 (10.8%) | 85 (52.8%) |
| $800 to $1,499 | 106 (6.9%) | 5 (3.1%) |
| Total | 1,531 (100.0%) | 161 (100.0%) |
Health & Disability in Desert Edge
Health Insurance Coverage by Age in Desert Edge
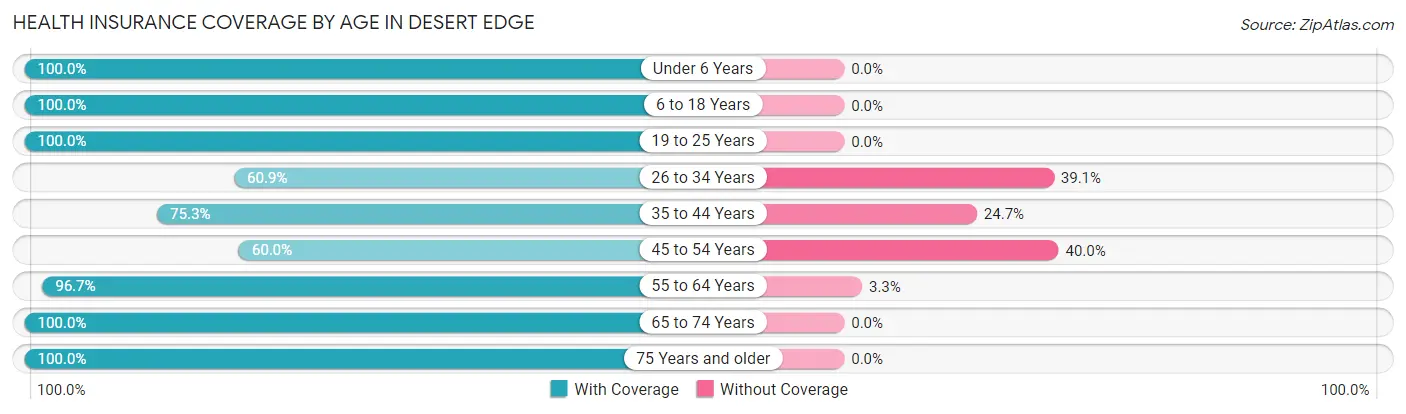
| Age Bracket | With Coverage | Without Coverage |
| Under 6 Years | 63 (100.0%) | 0 (0.0%) |
| 6 to 18 Years | 228 (100.0%) | 0 (0.0%) |
| 19 to 25 Years | 172 (100.0%) | 0 (0.0%) |
| 26 to 34 Years | 53 (60.9%) | 34 (39.1%) |
| 35 to 44 Years | 280 (75.3%) | 92 (24.7%) |
| 45 to 54 Years | 293 (60.0%) | 195 (40.0%) |
| 55 to 64 Years | 496 (96.7%) | 17 (3.3%) |
| 65 to 74 Years | 783 (100.0%) | 0 (0.0%) |
| 75 Years and older | 1,009 (100.0%) | 0 (0.0%) |
| Total | 3,377 (90.9%) | 338 (9.1%) |
Health Insurance Coverage by Citizenship Status in Desert Edge

| Citizenship Status | With Coverage | Without Coverage |
| Native Born | 63 (100.0%) | 0 (0.0%) |
| Foreign Born, Citizen | 228 (100.0%) | 0 (0.0%) |
| Foreign Born, not a Citizen | 172 (100.0%) | 0 (0.0%) |
Health Insurance Coverage by Household Income in Desert Edge
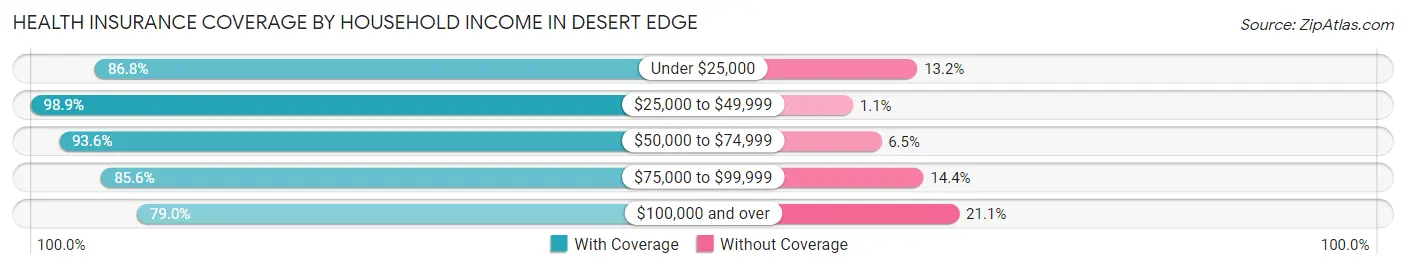
| Household Income | With Coverage | Without Coverage |
| Under $25,000 | 704 (86.8%) | 107 (13.2%) |
| $25,000 to $49,999 | 1,040 (98.9%) | 12 (1.1%) |
| $50,000 to $74,999 | 841 (93.5%) | 58 (6.5%) |
| $75,000 to $99,999 | 507 (85.6%) | 85 (14.4%) |
| $100,000 and over | 285 (78.9%) | 76 (21.0%) |
Public vs Private Health Insurance Coverage by Age in Desert Edge
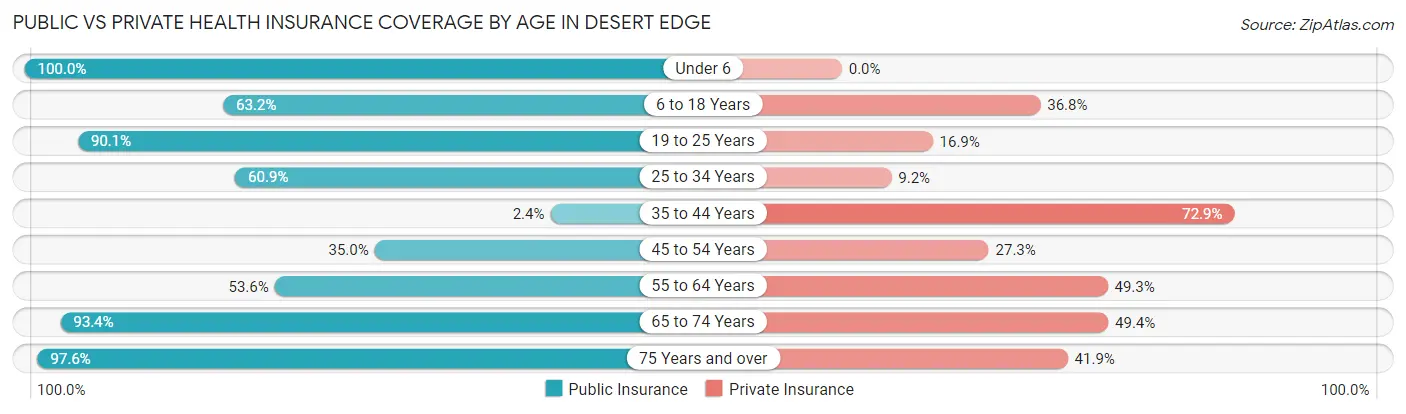
| Age Bracket | Public Insurance | Private Insurance |
| Under 6 | 63 (100.0%) | 0 (0.0%) |
| 6 to 18 Years | 144 (63.2%) | 84 (36.8%) |
| 19 to 25 Years | 155 (90.1%) | 29 (16.9%) |
| 25 to 34 Years | 53 (60.9%) | 8 (9.2%) |
| 35 to 44 Years | 9 (2.4%) | 271 (72.9%) |
| 45 to 54 Years | 171 (35.0%) | 133 (27.3%) |
| 55 to 64 Years | 275 (53.6%) | 253 (49.3%) |
| 65 to 74 Years | 731 (93.4%) | 387 (49.4%) |
| 75 Years and over | 985 (97.6%) | 423 (41.9%) |
| Total | 2,586 (69.6%) | 1,588 (42.7%) |
Disability Status by Sex by Age in Desert Edge
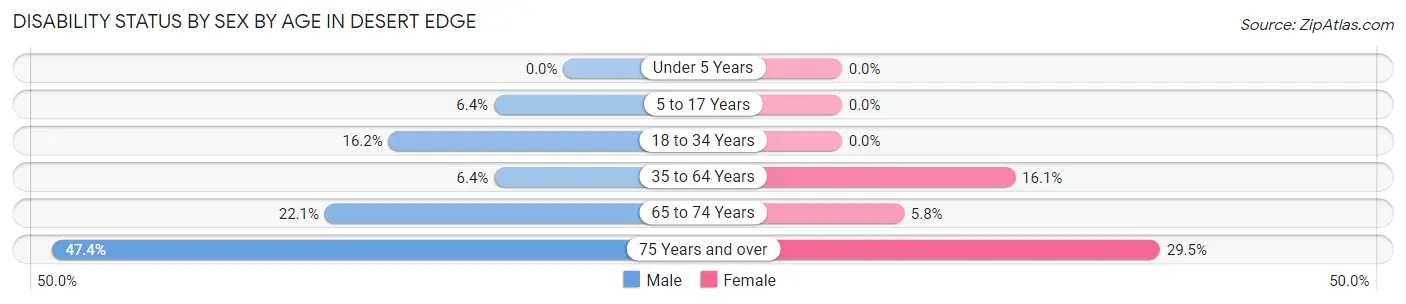
| Age Bracket | Male | Female |
| Under 5 Years | 0 (0.0%) | 0 (0.0%) |
| 5 to 17 Years | 13 (6.4%) | 0 (0.0%) |
| 18 to 34 Years | 12 (16.2%) | 0 (0.0%) |
| 35 to 64 Years | 55 (6.4%) | 83 (16.1%) |
| 65 to 74 Years | 85 (22.1%) | 23 (5.8%) |
| 75 Years and over | 210 (47.4%) | 167 (29.5%) |
Disability Class by Sex by Age in Desert Edge
Disability Class: Hearing Difficulty
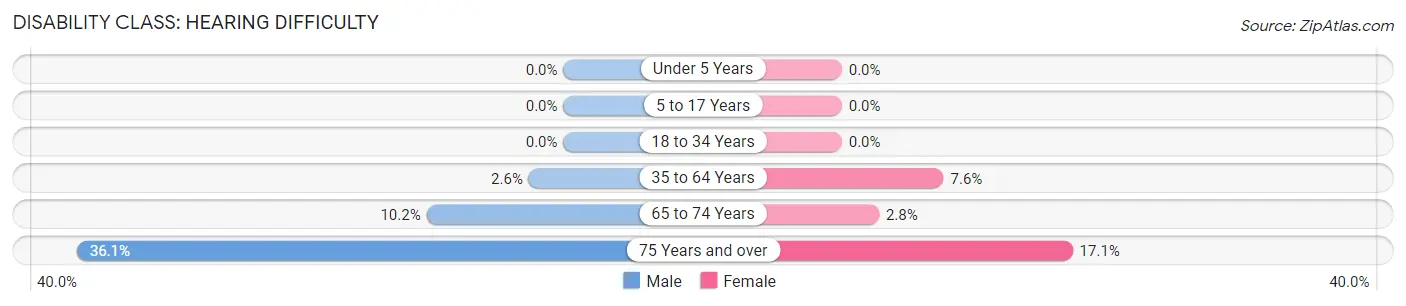
| Age Bracket | Male | Female |
| Under 5 Years | 0 (0.0%) | 0 (0.0%) |
| 5 to 17 Years | 0 (0.0%) | 0 (0.0%) |
| 18 to 34 Years | 0 (0.0%) | 0 (0.0%) |
| 35 to 64 Years | 22 (2.6%) | 39 (7.6%) |
| 65 to 74 Years | 39 (10.2%) | 11 (2.8%) |
| 75 Years and over | 160 (36.1%) | 97 (17.1%) |
Disability Class: Vision Difficulty
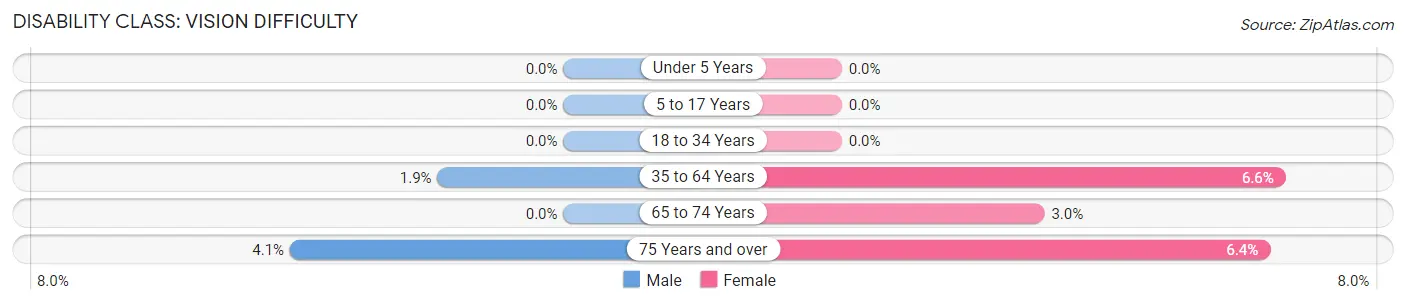
| Age Bracket | Male | Female |
| Under 5 Years | 0 (0.0%) | 0 (0.0%) |
| 5 to 17 Years | 0 (0.0%) | 0 (0.0%) |
| 18 to 34 Years | 0 (0.0%) | 0 (0.0%) |
| 35 to 64 Years | 16 (1.9%) | 34 (6.6%) |
| 65 to 74 Years | 0 (0.0%) | 12 (3.0%) |
| 75 Years and over | 18 (4.1%) | 36 (6.4%) |
Disability Class: Cognitive Difficulty
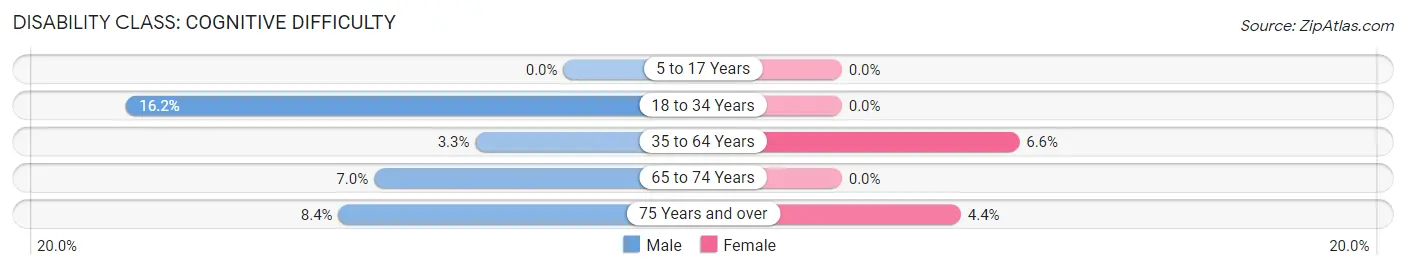
| Age Bracket | Male | Female |
| 5 to 17 Years | 0 (0.0%) | 0 (0.0%) |
| 18 to 34 Years | 12 (16.2%) | 0 (0.0%) |
| 35 to 64 Years | 28 (3.3%) | 34 (6.6%) |
| 65 to 74 Years | 27 (7.0%) | 0 (0.0%) |
| 75 Years and over | 37 (8.4%) | 25 (4.4%) |
Disability Class: Ambulatory Difficulty
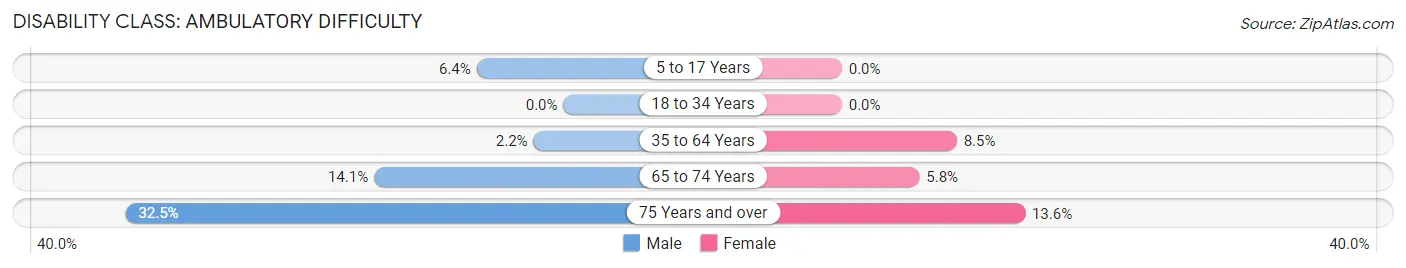
| Age Bracket | Male | Female |
| 5 to 17 Years | 13 (6.4%) | 0 (0.0%) |
| 18 to 34 Years | 0 (0.0%) | 0 (0.0%) |
| 35 to 64 Years | 19 (2.2%) | 44 (8.5%) |
| 65 to 74 Years | 54 (14.1%) | 23 (5.8%) |
| 75 Years and over | 144 (32.5%) | 77 (13.6%) |
Disability Class: Self-Care Difficulty
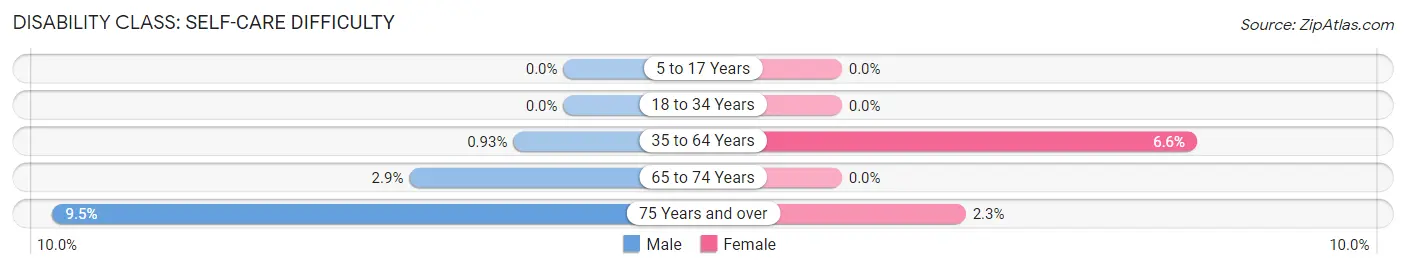
| Age Bracket | Male | Female |
| 5 to 17 Years | 0 (0.0%) | 0 (0.0%) |
| 18 to 34 Years | 0 (0.0%) | 0 (0.0%) |
| 35 to 64 Years | 8 (0.9%) | 34 (6.6%) |
| 65 to 74 Years | 11 (2.9%) | 0 (0.0%) |
| 75 Years and over | 42 (9.5%) | 13 (2.3%) |
Technology Access in Desert Edge
Computing Device Access in Desert Edge
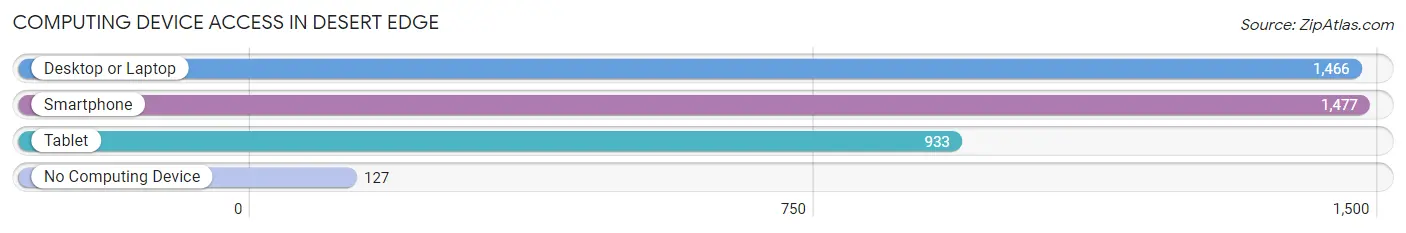
| Device Type | # Households | % Households |
| Desktop or Laptop | 1,466 | 75.8% |
| Smartphone | 1,477 | 76.3% |
| Tablet | 933 | 48.2% |
| No Computing Device | 127 | 6.6% |
| Total | 1,935 | 100.0% |
Internet Access in Desert Edge
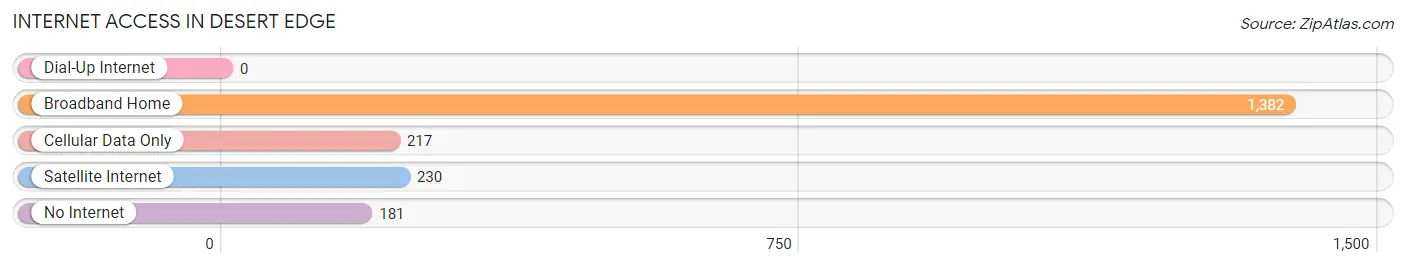
| Internet Type | # Households | % Households |
| Dial-Up Internet | 0 | 0.0% |
| Broadband Home | 1,382 | 71.4% |
| Cellular Data Only | 217 | 11.2% |
| Satellite Internet | 230 | 11.9% |
| No Internet | 181 | 9.3% |
| Total | 1,935 | 100.0% |
Desert Edge Summary
Desert Edge is a small unincorporated community located in the Mojave Desert in San Bernardino County, California. It is situated on the eastern edge of the Mojave Desert, approximately 25 miles east of Barstow and 40 miles north of Needles. The community is located along the historic Route 66, and is home to a population of approximately 1,000 people.
History
The area that is now Desert Edge was first inhabited by the Chemehuevi Native American tribe. The tribe lived in the area for centuries, relying on the resources of the desert for sustenance. In the late 19th century, the area was settled by homesteaders, who established small farms and ranches. The area was known as "Desert Edge" by the early 1900s, and the community was officially established in the 1920s.
In the 1930s, the community was connected to the rest of the country by the historic Route 66. The highway brought an influx of travelers and businesses to the area, and the community began to grow. In the 1950s, the community was home to a number of small businesses, including a gas station, a general store, and a post office.
Geography
Desert Edge is located in the Mojave Desert, in San Bernardino County, California. It is situated on the eastern edge of the desert, approximately 25 miles east of Barstow and 40 miles north of Needles. The community is located along the historic Route 66, and is home to a population of approximately 1,000 people.
The area is characterized by its arid climate, with hot summers and mild winters. The average annual temperature is around 70°F, and the average annual precipitation is around 4 inches. The area is home to a variety of desert plants and animals, including cacti, lizards, and coyotes.
Economy
The economy of Desert Edge is largely based on tourism. The community is located along the historic Route 66, and is a popular destination for travelers and tourists. The area is also home to a number of small businesses, including gas stations, restaurants, and convenience stores.
The area is also home to a number of mining operations, including gold, silver, and copper mines. The mining industry provides employment for many of the residents of Desert Edge.
Demographics
As of the 2010 census, the population of Desert Edge was 1,000. The racial makeup of the community was 94.2% White, 0.7% African American, 0.7% Native American, 0.7% Asian, 0.7% Pacific Islander, and 2.7% from other races. The median household income was $35,000, and the median age was 40.
Conclusion
Desert Edge is a small unincorporated community located in the Mojave Desert in San Bernardino County, California. It is situated on the eastern edge of the desert, approximately 25 miles east of Barstow and 40 miles north of Needles. The community is located along the historic Route 66, and is home to a population of approximately 1,000 people. The economy of Desert Edge is largely based on tourism, and the area is also home to a number of mining operations. The racial makeup of the community is 94.2% White, 0.7% African American, 0.7% Native American, 0.7% Asian, 0.7% Pacific Islander, and 2.7% from other races. The median household income was $35,000, and the median age was 40.
Common Questions
What is Per Capita Income in Desert Edge?
Per Capita income in Desert Edge is $26,430.
What is the Median Family Income in Desert Edge?
Median Family Income in Desert Edge is $51,318.
What is the Median Household income in Desert Edge?
Median Household Income in Desert Edge is $38,668.
What is Income or Wage Gap in Desert Edge?
Income or Wage Gap in Desert Edge is 45.1%.
Women in Desert Edge earn 54.9 cents for every dollar earned by a man.
What is Inequality or Gini Index in Desert Edge?
Inequality or Gini Index in Desert Edge is 0.41.
What is the Total Population of Desert Edge?
Total Population of Desert Edge is 3,715.
What is the Total Male Population of Desert Edge?
Total Male Population of Desert Edge is 1,969.
What is the Total Female Population of Desert Edge?
Total Female Population of Desert Edge is 1,746.
What is the Ratio of Males per 100 Females in Desert Edge?
There are 112.77 Males per 100 Females in Desert Edge.
What is the Ratio of Females per 100 Males in Desert Edge?
There are 88.67 Females per 100 Males in Desert Edge.
What is the Median Population Age in Desert Edge?
Median Population Age in Desert Edge is 64.2 Years.
What is the Average Family Size in Desert Edge
Average Family Size in Desert Edge is 2.5 People.
What is the Average Household Size in Desert Edge
Average Household Size in Desert Edge is 1.9 People.
How Large is the Labor Force in Desert Edge?
There are 1,068 People in the Labor Forcein in Desert Edge.
What is the Percentage of People in the Labor Force in Desert Edge?
31.1% of People are in the Labor Force in Desert Edge.
What is the Unemployment Rate in Desert Edge?
Unemployment Rate in Desert Edge is 9.5%.