Cities with the Largest Asian Community in California
RELATED REPORTS & OPTIONS
Asian
California
Compare Cities
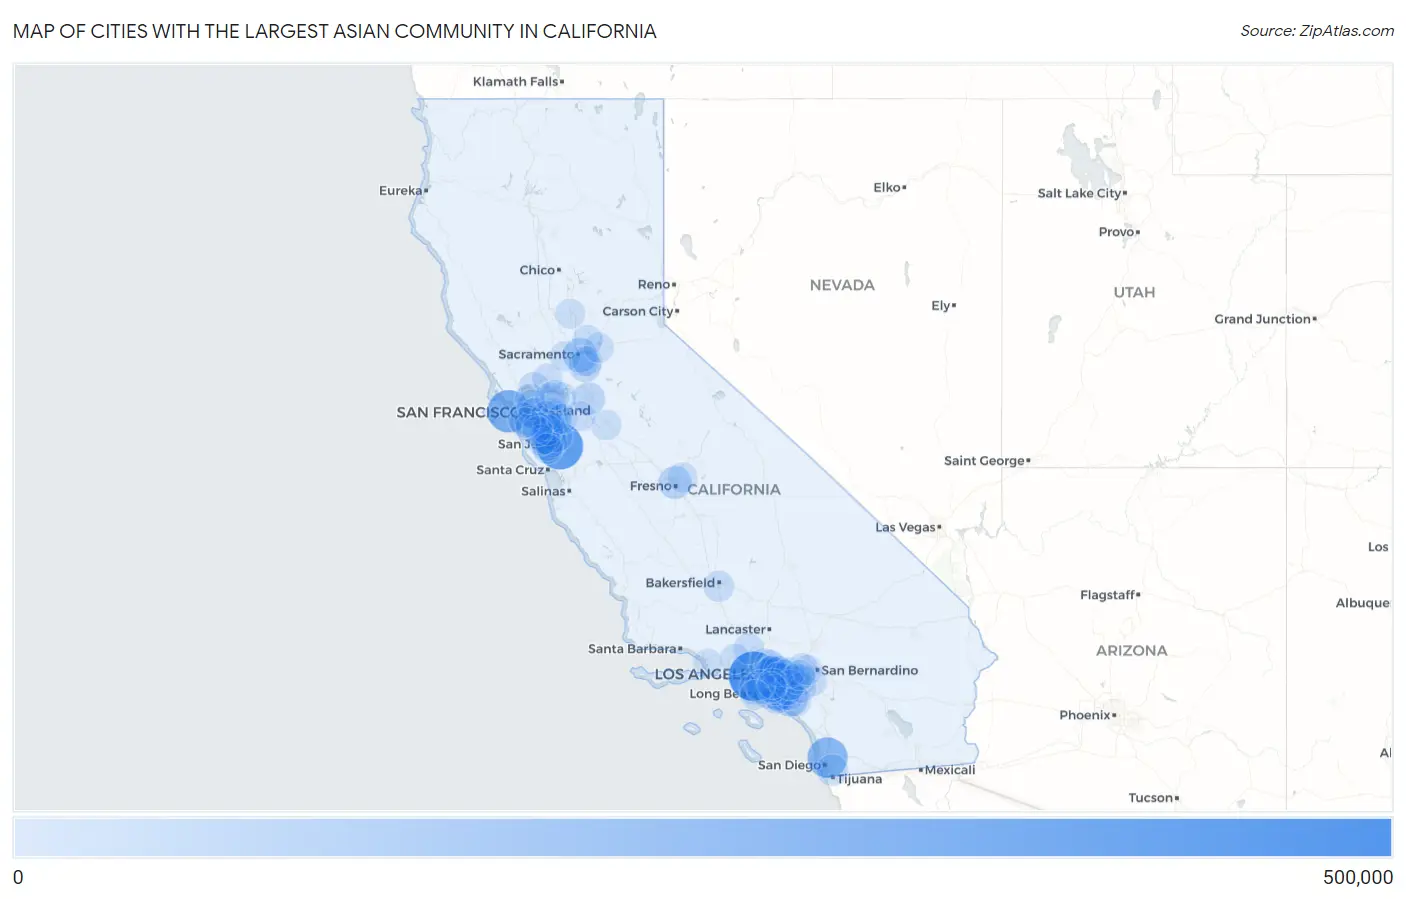
Map of Cities with the Largest Asian Community in California
0
500,000
Cities with the Largest Asian Community in California
| City | Asian | vs State | vs National | |
| 1. | Los Angeles | 458,721 | 5,949,136(7.71%)#1 | 19,112,979(2.40%)#2 |
| 2. | San Jose | 381,796 | 5,949,136(6.42%)#2 | 19,112,979(2.00%)#3 |
| 3. | San Francisco | 296,122 | 5,949,136(4.98%)#3 | 19,112,979(1.55%)#4 |
| 4. | San Diego | 240,252 | 5,949,136(4.04%)#4 | 19,112,979(1.26%)#5 |
| 5. | Fremont | 141,372 | 5,949,136(2.38%)#5 | 19,112,979(0.74%)#9 |
| 6. | Irvine | 134,995 | 5,949,136(2.27%)#6 | 19,112,979(0.71%)#10 |
| 7. | Sacramento | 102,179 | 5,949,136(1.72%)#7 | 19,112,979(0.53%)#13 |
| 8. | Sunnyvale | 76,656 | 5,949,136(1.29%)#8 | 19,112,979(0.40%)#15 |
| 9. | Fresno | 76,413 | 5,949,136(1.28%)#9 | 19,112,979(0.40%)#16 |
| 10. | Garden Grove | 71,510 | 5,949,136(1.20%)#10 | 19,112,979(0.37%)#18 |
| 11. | Oakland | 69,491 | 5,949,136(1.17%)#11 | 19,112,979(0.36%)#19 |
| 12. | Stockton | 66,792 | 5,949,136(1.12%)#12 | 19,112,979(0.35%)#20 |
| 13. | Anaheim | 61,068 | 5,949,136(1.03%)#13 | 19,112,979(0.32%)#23 |
| 14. | Daly City | 61,020 | 5,949,136(1.03%)#14 | 19,112,979(0.32%)#24 |
| 15. | Santa Clara | 60,451 | 5,949,136(1.02%)#15 | 19,112,979(0.32%)#25 |
| 16. | Long Beach | 58,592 | 5,949,136(0.98%)#16 | 19,112,979(0.31%)#28 |
| 17. | Milpitas | 55,266 | 5,949,136(0.93%)#17 | 19,112,979(0.29%)#32 |
| 18. | Torrance | 55,048 | 5,949,136(0.93%)#18 | 19,112,979(0.29%)#33 |
| 19. | Elk Grove | 53,693 | 5,949,136(0.90%)#19 | 19,112,979(0.28%)#35 |
| 20. | Hayward | 47,563 | 5,949,136(0.80%)#20 | 19,112,979(0.25%)#39 |
| 21. | Westminster | 45,990 | 5,949,136(0.77%)#21 | 19,112,979(0.24%)#42 |
| 22. | Chula Vista | 42,844 | 5,949,136(0.72%)#22 | 19,112,979(0.22%)#46 |
| 23. | Alhambra | 42,204 | 5,949,136(0.71%)#23 | 19,112,979(0.22%)#49 |
| 24. | Cupertino | 41,933 | 5,949,136(0.70%)#24 | 19,112,979(0.22%)#50 |
| 25. | San Ramon | 41,421 | 5,949,136(0.70%)#25 | 19,112,979(0.22%)#51 |
| 26. | Monterey Park | 39,140 | 5,949,136(0.66%)#26 | 19,112,979(0.20%)#52 |
| 27. | Union City | 38,809 | 5,949,136(0.65%)#27 | 19,112,979(0.20%)#53 |
| 28. | Dublin | 37,998 | 5,949,136(0.64%)#28 | 19,112,979(0.20%)#54 |
| 29. | Santa Ana | 36,820 | 5,949,136(0.62%)#29 | 19,112,979(0.19%)#55 |
| 30. | Fullerton | 35,623 | 5,949,136(0.60%)#30 | 19,112,979(0.19%)#58 |
| 31. | Diamond Bar | 32,390 | 5,949,136(0.54%)#31 | 19,112,979(0.17%)#61 |
| 32. | Pleasanton | 32,368 | 5,949,136(0.54%)#32 | 19,112,979(0.17%)#62 |
| 33. | Rosemead | 32,339 | 5,949,136(0.54%)#33 | 19,112,979(0.17%)#63 |
| 34. | Arcadia | 32,107 | 5,949,136(0.54%)#34 | 19,112,979(0.17%)#64 |
| 35. | West Covina | 32,007 | 5,949,136(0.54%)#35 | 19,112,979(0.17%)#65 |
| 36. | El Monte | 31,920 | 5,949,136(0.54%)#36 | 19,112,979(0.17%)#66 |
| 37. | San Leandro | 31,285 | 5,949,136(0.53%)#37 | 19,112,979(0.16%)#68 |
| 38. | Chino Hills | 31,279 | 5,949,136(0.53%)#38 | 19,112,979(0.16%)#69 |
| 39. | Bakersfield | 30,504 | 5,949,136(0.51%)#39 | 19,112,979(0.16%)#71 |
| 40. | Cerritos | 29,733 | 5,949,136(0.50%)#40 | 19,112,979(0.16%)#73 |
| 41. | Vallejo | 28,828 | 5,949,136(0.48%)#41 | 19,112,979(0.15%)#76 |
| 42. | Rowland Heights | 28,541 | 5,949,136(0.48%)#42 | 19,112,979(0.15%)#77 |
| 43. | South San Francisco | 28,501 | 5,949,136(0.48%)#43 | 19,112,979(0.15%)#79 |
| 44. | San Mateo | 28,109 | 5,949,136(0.47%)#44 | 19,112,979(0.15%)#82 |
| 45. | Buena Park | 27,342 | 5,949,136(0.46%)#45 | 19,112,979(0.14%)#84 |
| 46. | Mountain View | 27,290 | 5,949,136(0.46%)#46 | 19,112,979(0.14%)#85 |
| 47. | Riverside | 26,772 | 5,949,136(0.45%)#47 | 19,112,979(0.14%)#89 |
| 48. | Glendale | 26,730 | 5,949,136(0.45%)#48 | 19,112,979(0.14%)#90 |
| 49. | Berkeley | 25,255 | 5,949,136(0.42%)#49 | 19,112,979(0.13%)#95 |
| 50. | Rancho Cucamonga | 25,195 | 5,949,136(0.42%)#50 | 19,112,979(0.13%)#96 |
| 51. | Santa Clarita | 24,879 | 5,949,136(0.42%)#51 | 19,112,979(0.13%)#97 |
| 52. | Huntington Beach | 24,683 | 5,949,136(0.41%)#52 | 19,112,979(0.13%)#99 |
| 53. | Pasadena | 24,492 | 5,949,136(0.41%)#53 | 19,112,979(0.13%)#100 |
| 54. | Alameda | 24,319 | 5,949,136(0.41%)#54 | 19,112,979(0.13%)#102 |
| 55. | Carson | 24,137 | 5,949,136(0.41%)#55 | 19,112,979(0.13%)#104 |
| 56. | Temple City | 23,689 | 5,949,136(0.40%)#56 | 19,112,979(0.12%)#106 |
| 57. | Palo Alto | 23,647 | 5,949,136(0.40%)#57 | 19,112,979(0.12%)#108 |
| 58. | San Gabriel | 23,301 | 5,949,136(0.39%)#58 | 19,112,979(0.12%)#110 |
| 59. | Hacienda Heights | 23,101 | 5,949,136(0.39%)#59 | 19,112,979(0.12%)#112 |
| 60. | Fairfield | 21,675 | 5,949,136(0.36%)#60 | 19,112,979(0.11%)#120 |
| 61. | Fountain Valley | 21,248 | 5,949,136(0.36%)#61 | 19,112,979(0.11%)#122 |
| 62. | Castro Valley | 20,731 | 5,949,136(0.35%)#62 | 19,112,979(0.11%)#125 |
| 63. | Tustin | 20,187 | 5,949,136(0.34%)#63 | 19,112,979(0.11%)#127 |
| 64. | Newark | 19,832 | 5,949,136(0.33%)#64 | 19,112,979(0.10%)#130 |
| 65. | Eastvale | 19,315 | 5,949,136(0.32%)#65 | 19,112,979(0.10%)#134 |
| 66. | Tracy | 18,924 | 5,949,136(0.32%)#66 | 19,112,979(0.10%)#138 |
| 67. | Roseville | 18,919 | 5,949,136(0.32%)#67 | 19,112,979(0.10%)#139 |
| 68. | Walnut | 18,586 | 5,949,136(0.31%)#68 | 19,112,979(0.10%)#140 |
| 69. | Cypress | 18,546 | 5,949,136(0.31%)#69 | 19,112,979(0.10%)#141 |
| 70. | Orange | 18,393 | 5,949,136(0.31%)#70 | 19,112,979(0.10%)#142 |
| 71. | Foster City | 17,636 | 5,949,136(0.30%)#71 | 19,112,979(0.09%)#149 |
| 72. | Florin | 17,549 | 5,949,136(0.29%)#72 | 19,112,979(0.09%)#152 |
| 73. | Corona | 17,215 | 5,949,136(0.29%)#73 | 19,112,979(0.09%)#157 |
| 74. | Saratoga | 17,077 | 5,949,136(0.29%)#74 | 19,112,979(0.09%)#158 |
| 75. | Concord | 17,075 | 5,949,136(0.29%)#75 | 19,112,979(0.09%)#159 |
| 76. | Davis | 16,944 | 5,949,136(0.28%)#76 | 19,112,979(0.09%)#161 |
| 77. | Modesto | 16,829 | 5,949,136(0.28%)#77 | 19,112,979(0.09%)#163 |
| 78. | Chino | 16,828 | 5,949,136(0.28%)#78 | 19,112,979(0.09%)#164 |
| 79. | Lake Forest | 16,691 | 5,949,136(0.28%)#79 | 19,112,979(0.09%)#166 |
| 80. | Richmond | 16,453 | 5,949,136(0.28%)#80 | 19,112,979(0.09%)#168 |
| 81. | Yorba Linda | 16,265 | 5,949,136(0.27%)#81 | 19,112,979(0.09%)#170 |
| 82. | Vineyard | 16,150 | 5,949,136(0.27%)#82 | 19,112,979(0.08%)#173 |
| 83. | Baldwin Park | 15,926 | 5,949,136(0.27%)#83 | 19,112,979(0.08%)#174 |
| 84. | Antioch | 15,781 | 5,949,136(0.27%)#84 | 19,112,979(0.08%)#177 |
| 85. | Pomona | 15,775 | 5,949,136(0.27%)#85 | 19,112,979(0.08%)#178 |
| 86. | Lakewood | 15,282 | 5,949,136(0.26%)#86 | 19,112,979(0.08%)#179 |
| 87. | Fontana | 14,993 | 5,949,136(0.25%)#87 | 19,112,979(0.08%)#183 |
| 88. | Folsom | 14,986 | 5,949,136(0.25%)#88 | 19,112,979(0.08%)#184 |
| 89. | Gardena | 14,829 | 5,949,136(0.25%)#89 | 19,112,979(0.08%)#187 |
| 90. | Simi Valley | 14,496 | 5,949,136(0.24%)#90 | 19,112,979(0.08%)#194 |
| 91. | Livermore | 14,070 | 5,949,136(0.24%)#91 | 19,112,979(0.07%)#196 |
| 92. | Redwood City | 14,004 | 5,949,136(0.24%)#92 | 19,112,979(0.07%)#199 |
| 93. | San Bruno | 14,002 | 5,949,136(0.24%)#93 | 19,112,979(0.07%)#200 |
| 94. | Clovis | 13,999 | 5,949,136(0.24%)#94 | 19,112,979(0.07%)#201 |
| 95. | Yuba City | 13,728 | 5,949,136(0.23%)#95 | 19,112,979(0.07%)#205 |
| 96. | Norwalk | 13,691 | 5,949,136(0.23%)#96 | 19,112,979(0.07%)#206 |
| 97. | Pittsburg | 13,628 | 5,949,136(0.23%)#97 | 19,112,979(0.07%)#207 |
| 98. | Rancho Palos Verdes | 13,547 | 5,949,136(0.23%)#98 | 19,112,979(0.07%)#208 |
| 99. | Oxnard | 13,524 | 5,949,136(0.23%)#99 | 19,112,979(0.07%)#210 |
| 100. | Ontario | 13,276 | 5,949,136(0.22%)#100 | 19,112,979(0.07%)#212 |
Common Questions
What are the Top 10 Cities with the Largest Asian Community in California?
Top 10 Cities with the Largest Asian Community in California are:
#1
458,721
#2
381,796
#3
296,122
#4
240,252
#5
141,372
#6
134,995
#7
102,179
#8
76,656
#9
76,413
#10
71,510
What city has the Largest Asian Community in California?
Los Angeles has the Largest Asian Community in California with 458,721.
What is the Total Asian Population in the State of California?
Total Asian Population in California is 5,949,136.
What is the Total Asian Population in the United States?
Total Asian Population in the United States is 19,112,979.