Cities with the Highest Percentage of Population with a Degree in Science and Engineering in California
RELATED REPORTS & OPTIONS
Science and Engineering
California
Compare Cities
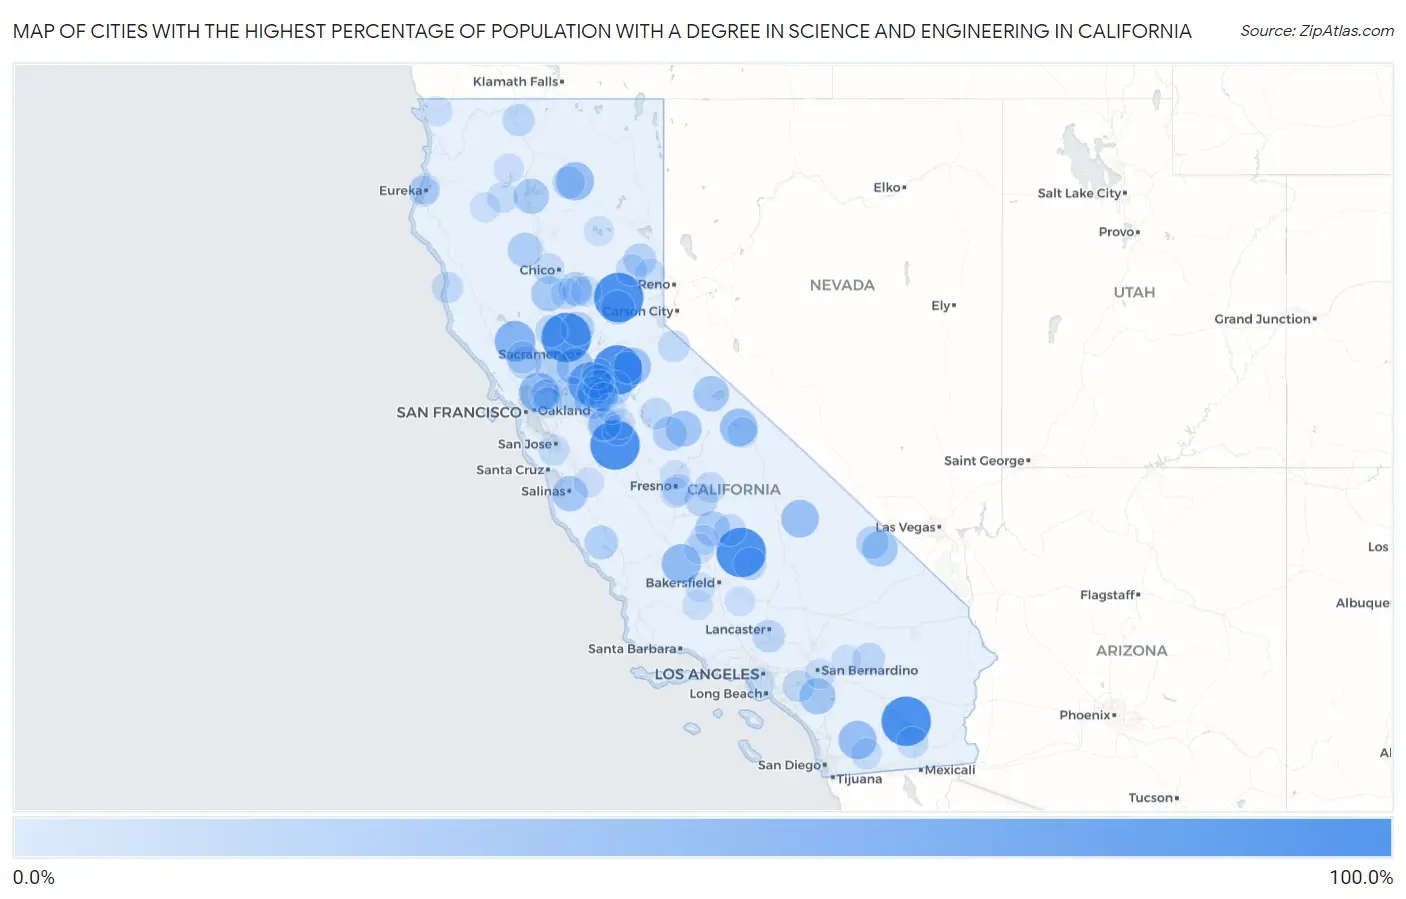
Map of Cities with the Highest Percentage of Population with a Degree in Science and Engineering in California
0.0%
100.0%
Cities with the Highest Percentage of Population with a Degree in Science and Engineering in California
| City | % Graduates | vs State | vs National | |
| 1. | Knights Landing | 100.0% | 8.3%(+91.7)#1 | 9.8%(+90.2)#7 |
| 2. | Bombay Beach | 100.0% | 8.3%(+91.7)#2 | 9.8%(+90.2)#73 |
| 3. | Martell | 100.0% | 8.3%(+91.7)#3 | 9.8%(+90.2)#78 |
| 4. | Stevinson | 100.0% | 8.3%(+91.7)#4 | 9.8%(+90.2)#113 |
| 5. | Washington | 100.0% | 8.3%(+91.7)#5 | 9.8%(+90.2)#123 |
| 6. | Panorama Heights | 100.0% | 8.3%(+91.7)#6 | 9.8%(+90.2)#178 |
| 7. | Strawberry Cdp Tuolumne County | 75.4% | 8.3%(+67.1)#7 | 9.8%(+65.6)#264 |
| 8. | Acampo | 72.4% | 8.3%(+64.2)#8 | 9.8%(+62.6)#289 |
| 9. | Middletown | 62.6% | 8.3%(+54.3)#9 | 9.8%(+52.8)#369 |
| 10. | Port Costa | 57.4% | 8.3%(+49.2)#10 | 9.8%(+47.7)#441 |
| 11. | Lost Hills | 56.2% | 8.3%(+48.0)#11 | 9.8%(+46.5)#453 |
| 12. | Julian | 52.5% | 8.3%(+44.3)#12 | 9.8%(+42.8)#512 |
| 13. | Cassel | 52.3% | 8.3%(+44.0)#13 | 9.8%(+42.5)#516 |
| 14. | Darwin | 50.0% | 8.3%(+41.7)#14 | 9.8%(+40.2)#605 |
| 15. | Sunny Slopes | 50.0% | 8.3%(+41.7)#15 | 9.8%(+40.2)#615 |
| 16. | West Point | 48.0% | 8.3%(+39.7)#16 | 9.8%(+38.2)#672 |
| 17. | Waterloo | 47.3% | 8.3%(+39.1)#17 | 9.8%(+37.6)#695 |
| 18. | Clarksburg | 45.3% | 8.3%(+37.0)#18 | 9.8%(+35.5)#738 |
| 19. | Meadowbrook | 44.1% | 8.3%(+35.8)#19 | 9.8%(+34.3)#781 |
| 20. | Wawona | 43.3% | 8.3%(+35.1)#20 | 9.8%(+33.6)#815 |
| 21. | Mono City | 42.2% | 8.3%(+33.9)#21 | 9.8%(+32.4)#863 |
| 22. | Tecopa | 42.1% | 8.3%(+33.8)#22 | 9.8%(+32.3)#866 |
| 23. | Spreckels | 40.8% | 8.3%(+32.6)#23 | 9.8%(+31.0)#915 |
| 24. | Kennedy | 40.5% | 8.3%(+32.3)#24 | 9.8%(+30.8)#927 |
| 25. | Mountain Gate | 40.4% | 8.3%(+32.1)#25 | 9.8%(+30.6)#934 |
| 26. | Princeton | 40.0% | 8.3%(+31.7)#26 | 9.8%(+30.2)#951 |
| 27. | Bethel Island | 38.8% | 8.3%(+30.5)#27 | 9.8%(+29.0)#1,029 |
| 28. | Plainview | 38.7% | 8.3%(+30.4)#28 | 9.8%(+28.9)#1,031 |
| 29. | Rancho Tehama Reserve | 37.9% | 8.3%(+29.7)#29 | 9.8%(+28.1)#1,071 |
| 30. | Bootjack | 36.0% | 8.3%(+27.7)#30 | 9.8%(+26.2)#1,169 |
| 31. | Alta | 35.8% | 8.3%(+27.6)#31 | 9.8%(+26.0)#1,182 |
| 32. | Trowbridge | 35.7% | 8.3%(+27.5)#32 | 9.8%(+25.9)#1,193 |
| 33. | Dogtown | 34.8% | 8.3%(+26.5)#33 | 9.8%(+25.0)#1,249 |
| 34. | Hartley | 34.0% | 8.3%(+25.8)#34 | 9.8%(+24.3)#1,293 |
| 35. | Lockwood | 34.0% | 8.3%(+25.7)#35 | 9.8%(+24.2)#1,295 |
| 36. | Rancho Calaveras | 33.3% | 8.3%(+25.1)#36 | 9.8%(+23.6)#1,309 |
| 37. | South Oroville | 33.3% | 8.3%(+25.1)#37 | 9.8%(+23.6)#1,312 |
| 38. | Beckwourth | 32.5% | 8.3%(+24.2)#38 | 9.8%(+22.7)#1,448 |
| 39. | Rutherford | 31.6% | 8.3%(+23.3)#39 | 9.8%(+21.8)#1,517 |
| 40. | Sultana | 31.0% | 8.3%(+22.8)#40 | 9.8%(+21.3)#1,567 |
| 41. | Lake Isabella | 30.6% | 8.3%(+22.4)#41 | 9.8%(+20.9)#1,614 |
| 42. | Jones Valley | 30.5% | 8.3%(+22.2)#42 | 9.8%(+20.7)#1,621 |
| 43. | Shoshone | 30.4% | 8.3%(+22.2)#43 | 9.8%(+20.7)#1,632 |
| 44. | Riverdale Park | 30.2% | 8.3%(+21.9)#44 | 9.8%(+20.4)#1,651 |
| 45. | West Modesto | 30.0% | 8.3%(+21.7)#45 | 9.8%(+20.2)#1,693 |
| 46. | Desert View Highlands | 29.8% | 8.3%(+21.6)#46 | 9.8%(+20.0)#1,700 |
| 47. | Linden | 29.5% | 8.3%(+21.2)#47 | 9.8%(+19.7)#1,744 |
| 48. | Burney | 29.4% | 8.3%(+21.1)#48 | 9.8%(+19.6)#1,758 |
| 49. | Homestead Valley | 28.5% | 8.3%(+20.2)#49 | 9.8%(+18.7)#1,903 |
| 50. | Montague | 27.9% | 8.3%(+19.6)#50 | 9.8%(+18.1)#1,964 |
| 51. | Deer Park | 27.9% | 8.3%(+19.6)#51 | 9.8%(+18.1)#1,970 |
| 52. | Dunnigan | 27.5% | 8.3%(+19.2)#52 | 9.8%(+17.7)#2,020 |
| 53. | Greeley Hill | 27.3% | 8.3%(+19.0)#53 | 9.8%(+17.5)#2,040 |
| 54. | Springville | 26.3% | 8.3%(+18.1)#54 | 9.8%(+16.5)#2,182 |
| 55. | Pine Grove | 26.3% | 8.3%(+18.0)#55 | 9.8%(+16.5)#2,199 |
| 56. | Coronita | 26.1% | 8.3%(+17.8)#56 | 9.8%(+16.3)#2,226 |
| 57. | Westmorland | 25.9% | 8.3%(+17.6)#57 | 9.8%(+16.1)#2,258 |
| 58. | Markleeville | 25.9% | 8.3%(+17.6)#58 | 9.8%(+16.1)#2,263 |
| 59. | Cleone | 25.2% | 8.3%(+17.0)#59 | 9.8%(+15.5)#2,358 |
| 60. | Malaga | 25.0% | 8.3%(+16.7)#60 | 9.8%(+15.2)#2,388 |
| 61. | Whitehawk | 25.0% | 8.3%(+16.7)#61 | 9.8%(+15.2)#2,490 |
| 62. | Biggs | 24.8% | 8.3%(+16.5)#62 | 9.8%(+15.0)#2,513 |
| 63. | Squaw Valley | 24.7% | 8.3%(+16.4)#63 | 9.8%(+14.9)#2,528 |
| 64. | Lewiston | 24.2% | 8.3%(+16.0)#64 | 9.8%(+14.5)#2,596 |
| 65. | Hamilton City | 23.8% | 8.3%(+15.5)#65 | 9.8%(+14.0)#2,682 |
| 66. | Somis | 23.7% | 8.3%(+15.4)#66 | 9.8%(+13.9)#2,715 |
| 67. | Cambrian Park | 23.6% | 8.3%(+15.3)#67 | 9.8%(+13.8)#2,735 |
| 68. | Morada | 23.5% | 8.3%(+15.3)#68 | 9.8%(+13.8)#2,742 |
| 69. | Mount Laguna | 23.3% | 8.3%(+15.1)#69 | 9.8%(+13.6)#2,812 |
| 70. | Paradise | 23.2% | 8.3%(+14.9)#70 | 9.8%(+13.4)#2,851 |
| 71. | Clay | 22.6% | 8.3%(+14.3)#71 | 9.8%(+12.8)#3,020 |
| 72. | Trabuco Canyon | 22.6% | 8.3%(+14.3)#72 | 9.8%(+12.8)#3,021 |
| 73. | Easton | 22.3% | 8.3%(+14.0)#73 | 9.8%(+12.5)#3,074 |
| 74. | Samoa | 22.2% | 8.3%(+14.0)#74 | 9.8%(+12.4)#3,115 |
| 75. | Loyalton | 22.1% | 8.3%(+13.8)#75 | 9.8%(+12.3)#3,156 |
| 76. | Lockeford | 22.1% | 8.3%(+13.8)#76 | 9.8%(+12.3)#3,160 |
| 77. | Fairhaven | 22.0% | 8.3%(+13.7)#77 | 9.8%(+12.2)#3,187 |
| 78. | Palermo | 21.9% | 8.3%(+13.7)#78 | 9.8%(+12.2)#3,190 |
| 79. | Rackerby | 21.9% | 8.3%(+13.6)#79 | 9.8%(+12.1)#3,212 |
| 80. | Pixley | 21.6% | 8.3%(+13.3)#80 | 9.8%(+11.8)#3,309 |
| 81. | Maricopa | 21.5% | 8.3%(+13.3)#81 | 9.8%(+11.7)#3,320 |
| 82. | Clyde | 21.4% | 8.3%(+13.2)#82 | 9.8%(+11.6)#3,341 |
| 83. | Allensworth | 21.4% | 8.3%(+13.2)#83 | 9.8%(+11.6)#3,347 |
| 84. | Loma Linda | 21.3% | 8.3%(+13.1)#84 | 9.8%(+11.5)#3,395 |
| 85. | Vine Hill | 21.1% | 8.3%(+12.9)#85 | 9.8%(+11.3)#3,453 |
| 86. | Coffee Creek | 21.0% | 8.3%(+12.7)#86 | 9.8%(+11.2)#3,493 |
| 87. | Hickman | 20.8% | 8.3%(+12.6)#87 | 9.8%(+11.1)#3,525 |
| 88. | Denair | 20.8% | 8.3%(+12.5)#88 | 9.8%(+11.0)#3,550 |
| 89. | Valley Home | 20.7% | 8.3%(+12.4)#89 | 9.8%(+10.9)#3,584 |
| 90. | Tres Pinos | 20.7% | 8.3%(+12.4)#90 | 9.8%(+10.9)#3,593 |
| 91. | Stallion Springs | 20.6% | 8.3%(+12.3)#91 | 9.8%(+10.8)#3,632 |
| 92. | Lake Almanor Country Club | 20.4% | 8.3%(+12.2)#92 | 9.8%(+10.6)#3,677 |
| 93. | Rolling Hills | 20.3% | 8.3%(+12.1)#93 | 9.8%(+10.5)#3,702 |
| 94. | Shell Ridge | 20.3% | 8.3%(+12.0)#94 | 9.8%(+10.5)#3,710 |
| 95. | West Athens | 20.2% | 8.3%(+11.9)#95 | 9.8%(+10.4)#3,732 |
| 96. | Hayfork | 20.2% | 8.3%(+11.9)#96 | 9.8%(+10.4)#3,739 |
| 97. | Gasquet | 20.2% | 8.3%(+11.9)#97 | 9.8%(+10.4)#3,742 |
| 98. | Peters | 20.0% | 8.3%(+11.7)#98 | 9.8%(+10.2)#3,835 |
| 99. | Tupman | 20.0% | 8.3%(+11.7)#99 | 9.8%(+10.2)#3,869 |
| 100. | Big Bear City | 20.0% | 8.3%(+11.7)#100 | 9.8%(+10.2)#3,906 |
Common Questions
What are the Top 10 Cities with the Highest Percentage of Population with a Degree in Science and Engineering in California?
Top 10 Cities with the Highest Percentage of Population with a Degree in Science and Engineering in California are:
#1
100.0%
#2
100.0%
#3
100.0%
#4
100.0%
#5
100.0%
#6
100.0%
#7
72.4%
#8
62.6%
#9
57.4%
#10
56.2%
What city has the Highest Percentage of Population with a Degree in Science and Engineering in California?
Knights Landing has the Highest Percentage of Population with a Degree in Science and Engineering in California with 100.0%.
What is the Percentage of Population with a Degree in Science and Engineering in the State of California?
Percentage of Population with a Degree in Science and Engineering in California is 8.3%.
What is the Percentage of Population with a Degree in Science and Engineering in the United States?
Percentage of Population with a Degree in Science and Engineering in the United States is 9.8%.