Cities with the Highest Unemployment Rate Amomg Youth Under the Age of 25 in California
RELATED REPORTS & OPTIONS
Highest Unemployment | Youth < 25
California
Compare Cities
Map of Cities with the Highest Unemployment Rate Amomg Youth Under the Age of 25 in California
0.0%
100.0%
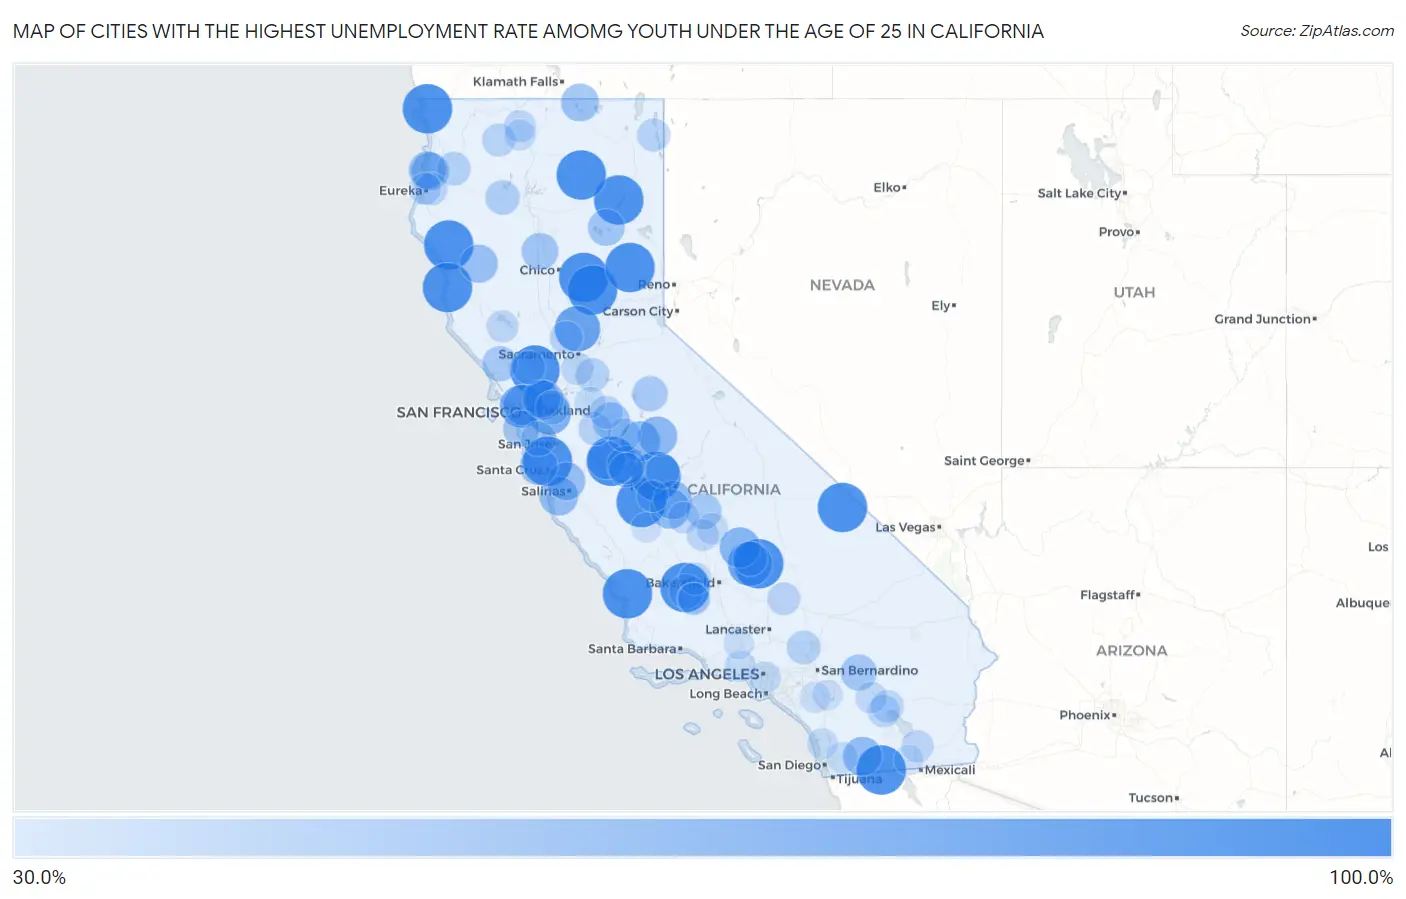
Cities with the Highest Unemployment Rate Amomg Youth Under the Age of 25 in California
| City | Youth Unemployment | vs State | vs National | |
| 1. | Weldon | 100.0% | 12.5%(+87.5)#1 | 10.9%(+89.1)#35 |
| 2. | Fort Dick | 100.0% | 12.5%(+87.5)#2 | 10.9%(+89.1)#52 |
| 3. | Amador Pines | 100.0% | 12.5%(+87.5)#3 | 10.9%(+89.1)#58 |
| 4. | Silverado Resort | 100.0% | 12.5%(+87.5)#4 | 10.9%(+89.1)#61 |
| 5. | Berry Creek | 100.0% | 12.5%(+87.5)#5 | 10.9%(+89.1)#63 |
| 6. | Challenge Brownsville | 100.0% | 12.5%(+87.5)#6 | 10.9%(+89.1)#72 |
| 7. | Jacumba | 100.0% | 12.5%(+87.5)#7 | 10.9%(+89.1)#73 |
| 8. | Zayante | 100.0% | 12.5%(+87.5)#8 | 10.9%(+89.1)#115 |
| 9. | Volta | 100.0% | 12.5%(+87.5)#9 | 10.9%(+89.1)#152 |
| 10. | Spaulding | 100.0% | 12.5%(+87.5)#10 | 10.9%(+89.1)#174 |
| 11. | Three Rocks | 100.0% | 12.5%(+87.5)#11 | 10.9%(+89.1)#197 |
| 12. | Benbow | 100.0% | 12.5%(+87.5)#12 | 10.9%(+89.1)#222 |
| 13. | Clio | 100.0% | 12.5%(+87.5)#13 | 10.9%(+89.1)#228 |
| 14. | Furnace Creek | 100.0% | 12.5%(+87.5)#14 | 10.9%(+89.1)#237 |
| 15. | Mckittrick | 100.0% | 12.5%(+87.5)#15 | 10.9%(+89.1)#274 |
| 16. | Weitchpec | 100.0% | 12.5%(+87.5)#16 | 10.9%(+89.1)#286 |
| 17. | Cleone | 99.9% | 12.5%(+87.4)#17 | 10.9%(+89.0)#338 |
| 18. | Fall River Mills | 99.9% | 12.5%(+87.4)#18 | 10.9%(+89.0)#342 |
| 19. | Los Ranchos | 99.8% | 12.5%(+87.3)#19 | 10.9%(+88.9)#368 |
| 20. | La Vina | 98.6% | 12.5%(+86.1)#20 | 10.9%(+87.7)#378 |
| 21. | Trowbridge | 86.6% | 12.5%(+74.1)#21 | 10.9%(+75.7)#416 |
| 22. | Lake Isabella | 82.5% | 12.5%(+70.0)#22 | 10.9%(+71.6)#442 |
| 23. | Sausalito | 77.4% | 12.5%(+64.9)#23 | 10.9%(+66.5)#484 |
| 24. | Norris Canyon | 73.8% | 12.5%(+61.3)#24 | 10.9%(+62.9)#532 |
| 25. | Tiburon | 70.2% | 12.5%(+57.7)#25 | 10.9%(+59.3)#581 |
| 26. | Pine Flat | 69.6% | 12.5%(+57.1)#26 | 10.9%(+58.7)#591 |
| 27. | University Of California Merced | 68.1% | 12.5%(+55.6)#27 | 10.9%(+57.2)#614 |
| 28. | Happy Valley | 67.1% | 12.5%(+54.6)#28 | 10.9%(+56.2)#624 |
| 29. | Riverdale | 66.7% | 12.5%(+54.2)#29 | 10.9%(+55.8)#630 |
| 30. | Catheys Valley | 66.6% | 12.5%(+54.1)#30 | 10.9%(+55.7)#636 |
| 31. | Reliez Valley | 65.8% | 12.5%(+53.3)#31 | 10.9%(+54.9)#663 |
| 32. | Pine Valley | 64.9% | 12.5%(+52.4)#32 | 10.9%(+54.0)#671 |
| 33. | Caruthers | 63.8% | 12.5%(+51.3)#33 | 10.9%(+52.9)#691 |
| 34. | Del Rey Oaks | 63.3% | 12.5%(+50.8)#34 | 10.9%(+52.4)#705 |
| 35. | Santa Nella | 63.1% | 12.5%(+50.6)#35 | 10.9%(+52.2)#711 |
| 36. | Dos Palos Y | 62.5% | 12.5%(+50.0)#36 | 10.9%(+51.6)#721 |
| 37. | Covelo | 61.7% | 12.5%(+49.2)#37 | 10.9%(+50.8)#733 |
| 38. | Elkhorn | 61.3% | 12.5%(+48.8)#38 | 10.9%(+50.4)#739 |
| 39. | Davenport | 61.2% | 12.5%(+48.7)#39 | 10.9%(+50.3)#740 |
| 40. | Old Stine | 60.9% | 12.5%(+48.4)#40 | 10.9%(+50.0)#748 |
| 41. | Alhambra Valley | 60.8% | 12.5%(+48.3)#41 | 10.9%(+49.9)#751 |
| 42. | Tulelake | 60.8% | 12.5%(+48.3)#42 | 10.9%(+49.9)#752 |
| 43. | Westhaven Moonstone | 60.1% | 12.5%(+47.6)#43 | 10.9%(+49.2)#765 |
| 44. | Empire | 59.6% | 12.5%(+47.1)#44 | 10.9%(+48.7)#789 |
| 45. | Trinidad | 59.2% | 12.5%(+46.7)#45 | 10.9%(+48.3)#798 |
| 46. | Westwood | 57.5% | 12.5%(+45.0)#46 | 10.9%(+46.6)#839 |
| 47. | Richfield | 57.1% | 12.5%(+44.6)#47 | 10.9%(+46.2)#863 |
| 48. | Montara | 55.8% | 12.5%(+43.3)#48 | 10.9%(+44.9)#888 |
| 49. | Morongo Valley | 55.0% | 12.5%(+42.5)#49 | 10.9%(+44.1)#925 |
| 50. | Patterson Tract | 53.8% | 12.5%(+41.3)#50 | 10.9%(+42.9)#958 |
| 51. | Twain Harte | 53.1% | 12.5%(+40.6)#51 | 10.9%(+42.2)#989 |
| 52. | Graton | 53.0% | 12.5%(+40.5)#52 | 10.9%(+42.1)#991 |
| 53. | Ladera | 51.5% | 12.5%(+39.0)#53 | 10.9%(+40.6)#1,043 |
| 54. | Derby Acres | 50.0% | 12.5%(+37.5)#54 | 10.9%(+39.1)#1,099 |
| 55. | Wofford Heights | 49.9% | 12.5%(+37.4)#55 | 10.9%(+39.0)#1,159 |
| 56. | Lewiston | 49.9% | 12.5%(+37.4)#56 | 10.9%(+39.0)#1,160 |
| 57. | South Dos Palos | 49.7% | 12.5%(+37.2)#57 | 10.9%(+38.8)#1,188 |
| 58. | Diablo | 48.8% | 12.5%(+36.3)#58 | 10.9%(+37.9)#1,214 |
| 59. | Parksdale | 48.1% | 12.5%(+35.6)#59 | 10.9%(+37.2)#1,237 |
| 60. | Phelan | 47.9% | 12.5%(+35.4)#60 | 10.9%(+37.0)#1,242 |
| 61. | Hoopa | 47.9% | 12.5%(+35.4)#61 | 10.9%(+37.0)#1,243 |
| 62. | Herald | 47.0% | 12.5%(+34.5)#62 | 10.9%(+36.1)#1,266 |
| 63. | Ballico | 46.6% | 12.5%(+34.1)#63 | 10.9%(+35.7)#1,280 |
| 64. | Yountville | 46.1% | 12.5%(+33.6)#64 | 10.9%(+35.2)#1,300 |
| 65. | Cedarville | 45.9% | 12.5%(+33.4)#65 | 10.9%(+35.0)#1,322 |
| 66. | Westley | 45.9% | 12.5%(+33.4)#66 | 10.9%(+35.0)#1,323 |
| 67. | Escalon | 45.5% | 12.5%(+33.0)#67 | 10.9%(+34.6)#1,334 |
| 68. | Etna | 45.4% | 12.5%(+32.9)#68 | 10.9%(+34.5)#1,340 |
| 69. | Knights Landing | 44.8% | 12.5%(+32.3)#69 | 10.9%(+33.9)#1,375 |
| 70. | California City | 44.4% | 12.5%(+31.9)#70 | 10.9%(+33.5)#1,386 |
| 71. | South Taft | 44.4% | 12.5%(+31.9)#71 | 10.9%(+33.5)#1,387 |
| 72. | Indianola | 44.4% | 12.5%(+31.9)#72 | 10.9%(+33.5)#1,394 |
| 73. | Hood | 43.6% | 12.5%(+31.1)#73 | 10.9%(+32.7)#1,446 |
| 74. | Mecca | 43.5% | 12.5%(+31.0)#74 | 10.9%(+32.6)#1,448 |
| 75. | Buttonwillow | 43.4% | 12.5%(+30.9)#75 | 10.9%(+32.5)#1,460 |
| 76. | Oasis | 43.2% | 12.5%(+30.7)#76 | 10.9%(+32.3)#1,477 |
| 77. | Brawley | 42.9% | 12.5%(+30.4)#77 | 10.9%(+32.0)#1,491 |
| 78. | Dixon Lane Meadow Creek | 42.8% | 12.5%(+30.3)#78 | 10.9%(+31.9)#1,493 |
| 79. | Grenada | 42.8% | 12.5%(+30.3)#79 | 10.9%(+31.9)#1,521 |
| 80. | Samoa | 42.1% | 12.5%(+29.6)#80 | 10.9%(+31.2)#1,558 |
| 81. | Tipton | 42.0% | 12.5%(+29.5)#81 | 10.9%(+31.1)#1,561 |
| 82. | Kelseyville | 41.8% | 12.5%(+29.3)#82 | 10.9%(+30.9)#1,574 |
| 83. | Vernon | 41.6% | 12.5%(+29.1)#83 | 10.9%(+30.7)#1,596 |
| 84. | Home Garden | 41.1% | 12.5%(+28.6)#84 | 10.9%(+30.2)#1,630 |
| 85. | Plainview | 41.1% | 12.5%(+28.6)#85 | 10.9%(+30.2)#1,637 |
| 86. | Indian Wells | 40.9% | 12.5%(+28.4)#86 | 10.9%(+30.0)#1,647 |
| 87. | Taft Heights | 40.6% | 12.5%(+28.1)#87 | 10.9%(+29.7)#1,662 |
| 88. | San Joaquin | 40.5% | 12.5%(+28.0)#88 | 10.9%(+29.6)#1,666 |
| 89. | Gazelle | 40.0% | 12.5%(+27.5)#89 | 10.9%(+29.1)#1,710 |
| 90. | Taft Mosswood | 39.9% | 12.5%(+27.4)#90 | 10.9%(+29.0)#1,723 |
| 91. | Hidden Hills | 39.7% | 12.5%(+27.2)#91 | 10.9%(+28.8)#1,740 |
| 92. | Harbison Canyon | 39.4% | 12.5%(+26.9)#92 | 10.9%(+28.5)#1,753 |
| 93. | Rancho Santa Fe | 39.0% | 12.5%(+26.5)#93 | 10.9%(+28.1)#1,778 |
| 94. | Warm Springs | 37.9% | 12.5%(+25.4)#94 | 10.9%(+27.0)#1,857 |
| 95. | Green Valley Cdp Los Angeles County | 37.9% | 12.5%(+25.4)#95 | 10.9%(+27.0)#1,860 |
| 96. | Homeland | 37.3% | 12.5%(+24.8)#96 | 10.9%(+26.4)#1,914 |
| 97. | San Miguel Cdp Contra Costa County | 37.3% | 12.5%(+24.8)#97 | 10.9%(+26.4)#1,915 |
| 98. | Hasley Canyon | 37.3% | 12.5%(+24.8)#98 | 10.9%(+26.4)#1,919 |
| 99. | Coalinga | 36.1% | 12.5%(+23.6)#99 | 10.9%(+25.2)#2,002 |
| 100. | Seeley | 35.8% | 12.5%(+23.3)#100 | 10.9%(+24.9)#2,030 |
Common Questions
What are the Top 10 Cities with the Highest Unemployment Rate Amomg Youth Under the Age of 25 in California?
Top 10 Cities with the Highest Unemployment Rate Amomg Youth Under the Age of 25 in California are:
#1
100.0%
#2
100.0%
#3
100.0%
#4
100.0%
#5
100.0%
#6
100.0%
#7
100.0%
#8
100.0%
#9
100.0%
#10
100.0%
What city has the Highest Unemployment Rate Amomg Youth Under the Age of 25 in California?
Weldon has the Highest Unemployment Rate Amomg Youth Under the Age of 25 in California with 100.0%.
What is the Unemployment Rate Amomg Youth Under the Age of 25 in the State of California?
Unemployment Rate Amomg Youth Under the Age of 25 in California is 12.5%.
What is the Unemployment Rate Amomg Youth Under the Age of 25 in the United States?
Unemployment Rate Amomg Youth Under the Age of 25 in the United States is 10.9%.