Cities with the Highest Percentage of Population Employed in Transportation in California
RELATED REPORTS & OPTIONS
Transportation
California
Compare Cities
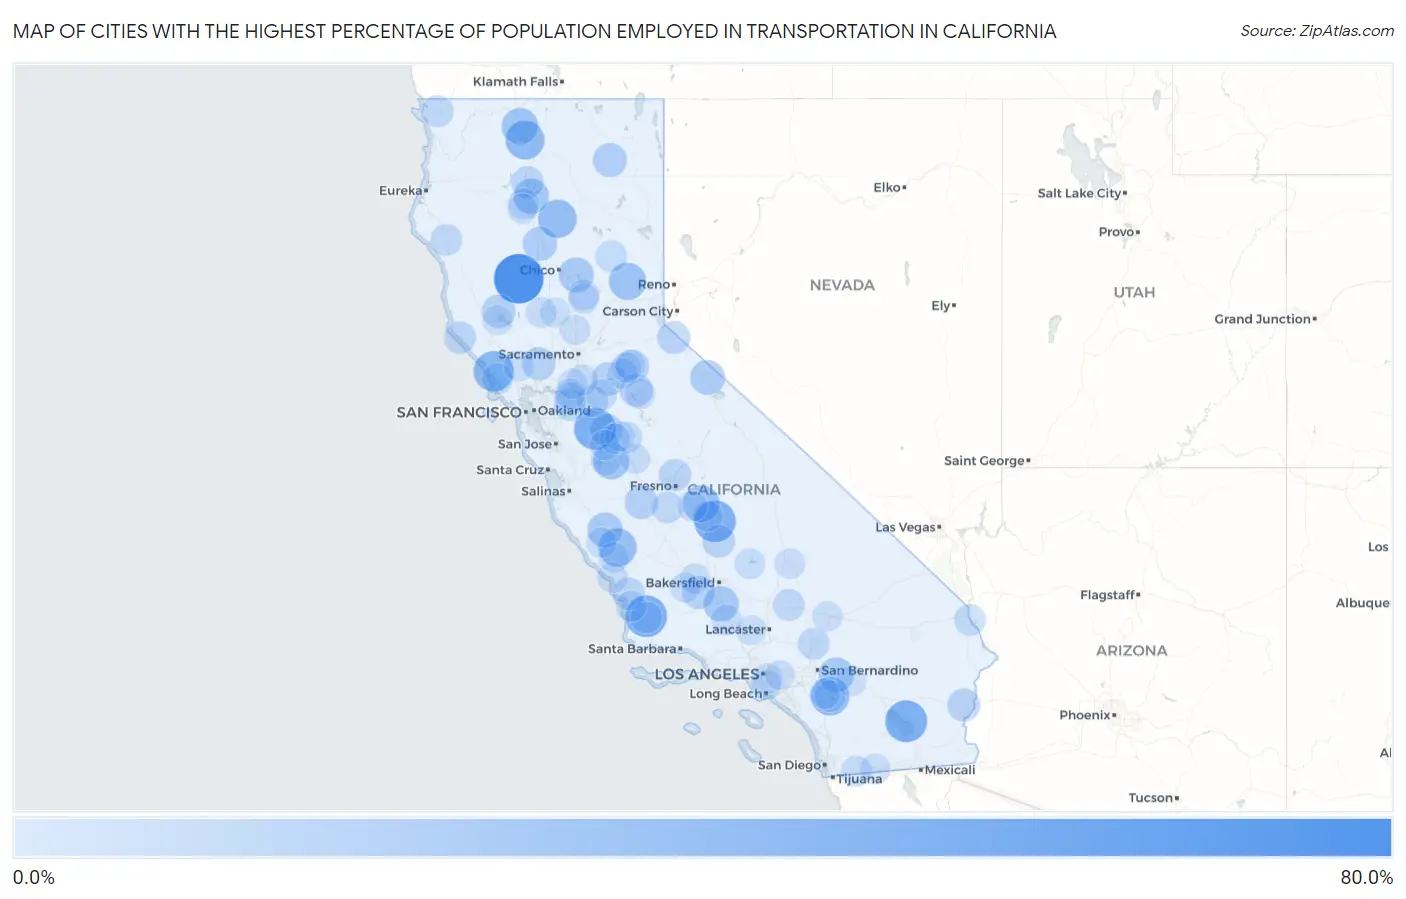
Map of Cities with the Highest Percentage of Population Employed in Transportation in California
0.0%
80.0%
Cities with the Highest Percentage of Population Employed in Transportation in California
| City | % Employed | vs State | vs National | |
| 1. | Elk Creek | 75.0% | 3.5%(+71.5)#1 | 3.8%(+71.2)#35 |
| 2. | Bombay Beach | 48.3% | 3.5%(+44.8)#2 | 3.8%(+44.5)#112 |
| 3. | Westley | 48.1% | 3.5%(+44.6)#3 | 3.8%(+44.3)#115 |
| 4. | Garey | 47.8% | 3.5%(+44.3)#4 | 3.8%(+44.0)#119 |
| 5. | Tonyville | 47.8% | 3.5%(+44.2)#5 | 3.8%(+43.9)#120 |
| 6. | Bear Valley Cdp Mariposa County | 44.3% | 3.5%(+40.7)#6 | 3.8%(+40.4)#144 |
| 7. | Bodega | 42.9% | 3.5%(+39.4)#7 | 3.8%(+39.1)#147 |
| 8. | Edgewood | 38.9% | 3.5%(+35.3)#8 | 3.8%(+35.1)#183 |
| 9. | Green Acres | 37.0% | 3.5%(+33.5)#9 | 3.8%(+33.2)#205 |
| 10. | Manton | 36.4% | 3.5%(+32.8)#10 | 3.8%(+32.5)#214 |
| 11. | Bradley | 35.7% | 3.5%(+32.2)#11 | 3.8%(+31.9)#229 |
| 12. | Weitchpec | 33.3% | 3.5%(+29.8)#12 | 3.8%(+29.5)#275 |
| 13. | Sierra City | 32.6% | 3.5%(+29.1)#13 | 3.8%(+28.8)#294 |
| 14. | Monson | 31.7% | 3.5%(+28.2)#14 | 3.8%(+27.9)#309 |
| 15. | Grenada | 30.4% | 3.5%(+26.9)#15 | 3.8%(+26.6)#326 |
| 16. | Volta | 29.7% | 3.5%(+26.2)#16 | 3.8%(+25.9)#344 |
| 17. | Mettler | 26.7% | 3.5%(+23.1)#17 | 3.8%(+22.8)#428 |
| 18. | Mountain Gate | 26.4% | 3.5%(+22.9)#18 | 3.8%(+22.6)#438 |
| 19. | Oak Glen | 25.5% | 3.5%(+21.9)#19 | 3.8%(+21.6)#474 |
| 20. | Cherokee | 25.4% | 3.5%(+21.9)#20 | 3.8%(+21.6)#476 |
| 21. | San Lucas | 25.4% | 3.5%(+21.8)#21 | 3.8%(+21.6)#478 |
| 22. | Ono | 25.0% | 3.5%(+21.5)#22 | 3.8%(+21.2)#496 |
| 23. | Bridgeport | 24.3% | 3.5%(+20.8)#23 | 3.8%(+20.5)#512 |
| 24. | Edison | 24.0% | 3.5%(+20.4)#24 | 3.8%(+20.1)#529 |
| 25. | Proberta | 22.8% | 3.5%(+19.2)#25 | 3.8%(+19.0)#600 |
| 26. | Adin | 22.0% | 3.5%(+18.5)#26 | 3.8%(+18.2)#647 |
| 27. | Camanche North Shore | 20.6% | 3.5%(+17.1)#27 | 3.8%(+16.8)#746 |
| 28. | Upper Lake | 20.5% | 3.5%(+16.9)#28 | 3.8%(+16.7)#754 |
| 29. | Three Rocks | 20.0% | 3.5%(+16.5)#29 | 3.8%(+16.2)#790 |
| 30. | Moskowite Corner | 19.5% | 3.5%(+15.9)#30 | 3.8%(+15.7)#843 |
| 31. | Monterey Park Tract | 19.0% | 3.5%(+15.5)#31 | 3.8%(+15.2)#873 |
| 32. | West Point | 18.9% | 3.5%(+15.4)#32 | 3.8%(+15.1)#884 |
| 33. | Dustin Acres | 18.8% | 3.5%(+15.3)#33 | 3.8%(+15.0)#893 |
| 34. | Vallecito | 18.8% | 3.5%(+15.2)#34 | 3.8%(+14.9)#898 |
| 35. | Mesa Verde | 18.7% | 3.5%(+15.2)#35 | 3.8%(+14.9)#906 |
| 36. | Mesa Vista | 18.5% | 3.5%(+15.0)#36 | 3.8%(+14.7)#926 |
| 37. | Terra Bella | 17.9% | 3.5%(+14.4)#37 | 3.8%(+14.1)#1,016 |
| 38. | Yermo | 17.9% | 3.5%(+14.3)#38 | 3.8%(+14.0)#1,017 |
| 39. | Lakehead | 17.0% | 3.5%(+13.4)#39 | 3.8%(+13.2)#1,124 |
| 40. | Edna | 16.9% | 3.5%(+13.3)#40 | 3.8%(+13.0)#1,136 |
| 41. | Anchor Bay | 15.8% | 3.5%(+12.3)#41 | 3.8%(+12.0)#1,285 |
| 42. | El Centro Naval Air Facility | 15.8% | 3.5%(+12.2)#42 | 3.8%(+12.0)#1,288 |
| 43. | Rolling Hills | 15.6% | 3.5%(+12.1)#43 | 3.8%(+11.8)#1,311 |
| 44. | North Edwards | 15.2% | 3.5%(+11.6)#44 | 3.8%(+11.4)#1,390 |
| 45. | Gasquet | 15.1% | 3.5%(+11.6)#45 | 3.8%(+11.3)#1,405 |
| 46. | Byron | 15.0% | 3.5%(+11.4)#46 | 3.8%(+11.2)#1,437 |
| 47. | Mountain View Acres | 14.9% | 3.5%(+11.3)#47 | 3.8%(+11.0)#1,460 |
| 48. | Knightsen | 14.8% | 3.5%(+11.2)#48 | 3.8%(+11.0)#1,483 |
| 49. | Sisquoc | 14.5% | 3.5%(+11.0)#49 | 3.8%(+10.7)#1,531 |
| 50. | Redway | 14.5% | 3.5%(+11.0)#50 | 3.8%(+10.7)#1,534 |
| 51. | Lanare | 14.4% | 3.5%(+10.9)#51 | 3.8%(+10.6)#1,554 |
| 52. | Needles | 14.4% | 3.5%(+10.8)#52 | 3.8%(+10.6)#1,555 |
| 53. | East Quincy | 14.0% | 3.5%(+10.5)#53 | 3.8%(+10.2)#1,632 |
| 54. | Cressey | 13.7% | 3.5%(+10.2)#54 | 3.8%(+9.89)#1,703 |
| 55. | Kennedy | 13.3% | 3.5%(+9.74)#55 | 3.8%(+9.47)#1,816 |
| 56. | Winchester | 13.3% | 3.5%(+9.70)#56 | 3.8%(+9.43)#1,829 |
| 57. | Tomales | 13.1% | 3.5%(+9.55)#57 | 3.8%(+9.28)#1,868 |
| 58. | Keswick | 12.5% | 3.5%(+8.95)#58 | 3.8%(+8.68)#2,045 |
| 59. | Linden | 12.3% | 3.5%(+8.74)#59 | 3.8%(+8.47)#2,125 |
| 60. | Potrero | 11.9% | 3.5%(+8.36)#60 | 3.8%(+8.09)#2,264 |
| 61. | Santa Nella | 11.8% | 3.5%(+8.30)#61 | 3.8%(+8.03)#2,289 |
| 62. | Woodlands | 11.8% | 3.5%(+8.25)#62 | 3.8%(+7.98)#2,312 |
| 63. | Thornton | 11.7% | 3.5%(+8.13)#63 | 3.8%(+7.86)#2,355 |
| 64. | Bangor | 11.6% | 3.5%(+8.03)#64 | 3.8%(+7.76)#2,393 |
| 65. | Franklin Cdp Merced County | 11.5% | 3.5%(+7.94)#65 | 3.8%(+7.67)#2,431 |
| 66. | Williams | 11.3% | 3.5%(+7.78)#66 | 3.8%(+7.51)#2,501 |
| 67. | Lebec | 11.0% | 3.5%(+7.47)#67 | 3.8%(+7.20)#2,634 |
| 68. | Lake Isabella | 10.9% | 3.5%(+7.34)#68 | 3.8%(+7.07)#2,688 |
| 69. | Cayucos | 10.9% | 3.5%(+7.33)#69 | 3.8%(+7.06)#2,691 |
| 70. | Loma Rica | 10.8% | 3.5%(+7.26)#70 | 3.8%(+6.99)#2,722 |
| 71. | Linnell Camp | 10.7% | 3.5%(+7.11)#71 | 3.8%(+6.84)#2,770 |
| 72. | China Lake Acres | 10.6% | 3.5%(+7.10)#72 | 3.8%(+6.83)#2,778 |
| 73. | Romoland | 10.6% | 3.5%(+7.05)#73 | 3.8%(+6.78)#2,805 |
| 74. | Lake Nacimiento | 10.6% | 3.5%(+7.03)#74 | 3.8%(+6.76)#2,812 |
| 75. | Isleton | 10.6% | 3.5%(+7.03)#75 | 3.8%(+6.76)#2,816 |
| 76. | East Nicolaus | 10.4% | 3.5%(+6.90)#76 | 3.8%(+6.63)#2,872 |
| 77. | Lockwood | 10.4% | 3.5%(+6.84)#77 | 3.8%(+6.57)#2,902 |
| 78. | Columbia | 10.4% | 3.5%(+6.82)#78 | 3.8%(+6.55)#2,921 |
| 79. | Bethel Island | 10.3% | 3.5%(+6.80)#79 | 3.8%(+6.53)#2,931 |
| 80. | Buttonwillow | 10.3% | 3.5%(+6.71)#80 | 3.8%(+6.44)#2,979 |
| 81. | Kenwood | 10.2% | 3.5%(+6.70)#81 | 3.8%(+6.43)#2,994 |
| 82. | Lenwood | 10.2% | 3.5%(+6.66)#82 | 3.8%(+6.39)#3,008 |
| 83. | Mckittrick | 10.0% | 3.5%(+6.45)#83 | 3.8%(+6.18)#3,128 |
| 84. | Centerville | 9.9% | 3.5%(+6.38)#84 | 3.8%(+6.11)#3,171 |
| 85. | Mokelumne Hill | 9.9% | 3.5%(+6.34)#85 | 3.8%(+6.07)#3,200 |
| 86. | El Nido | 9.9% | 3.5%(+6.31)#86 | 3.8%(+6.04)#3,213 |
| 87. | Boulevard | 9.9% | 3.5%(+6.31)#87 | 3.8%(+6.04)#3,214 |
| 88. | East Rancho Dominguez | 9.8% | 3.5%(+6.24)#88 | 3.8%(+5.97)#3,247 |
| 89. | Pioneer | 9.8% | 3.5%(+6.24)#89 | 3.8%(+5.97)#3,251 |
| 90. | Hilmar Irwin | 9.8% | 3.5%(+6.21)#90 | 3.8%(+5.94)#3,263 |
| 91. | Traver | 9.6% | 3.5%(+6.03)#91 | 3.8%(+5.76)#3,395 |
| 92. | Lake Hughes | 9.6% | 3.5%(+6.03)#92 | 3.8%(+5.76)#3,400 |
| 93. | Bell | 9.5% | 3.5%(+6.00)#93 | 3.8%(+5.73)#3,420 |
| 94. | Lakeport | 9.5% | 3.5%(+5.97)#94 | 3.8%(+5.70)#3,445 |
| 95. | Delhi | 9.5% | 3.5%(+5.96)#95 | 3.8%(+5.69)#3,448 |
| 96. | Newman | 9.5% | 3.5%(+5.95)#96 | 3.8%(+5.68)#3,456 |
| 97. | Whitewater | 9.5% | 3.5%(+5.93)#97 | 3.8%(+5.66)#3,464 |
| 98. | Industry | 9.4% | 3.5%(+5.86)#98 | 3.8%(+5.59)#3,502 |
| 99. | Pine Grove | 9.4% | 3.5%(+5.81)#99 | 3.8%(+5.54)#3,539 |
| 100. | Meridian | 9.2% | 3.5%(+5.68)#100 | 3.8%(+5.41)#3,628 |
Common Questions
What are the Top 10 Cities with the Highest Percentage of Population Employed in Transportation in California?
Top 10 Cities with the Highest Percentage of Population Employed in Transportation in California are:
#1
75.0%
#2
48.3%
#3
48.1%
#4
47.8%
#5
47.8%
#6
42.9%
#7
38.9%
#8
37.0%
#9
36.4%
#10
35.7%
What city has the Highest Percentage of Population Employed in Transportation in California?
Elk Creek has the Highest Percentage of Population Employed in Transportation in California with 75.0%.
What is the Percentage of Population Employed in Transportation in the State of California?
Percentage of Population Employed in Transportation in California is 3.5%.
What is the Percentage of Population Employed in Transportation in the United States?
Percentage of Population Employed in Transportation in the United States is 3.8%.