Montana Map & Demographics
Montana Map
Montana Overview
Nov 8, 1889
INCORPORATED
147,039
TOTAL AREA [ SQ MI ]
145,541
LAND AREA [ SQ MI ]
1,498
WATER AREA [ SQ MI ]
3,400
ELEVATION AVG [ FT ]
12,799
ELEVATION HIGH [ FT ]
1,800
ELEVATION LOW [ FT ]
7.5
POP DENSITY [ PPL / SQ MI ]
$37,837
PER CAPITA INCOME
$84,027
AVG FAMILY INCOME
$66,341
AVG HOUSEHOLD INCOME
29.0%
WAGE / INCOME GAP [ % ]
71.0¢/ $1
WAGE / INCOME GAP [ $ ]
$10,359
FAMILY INCOME DEFICIT
0.46
INEQUALITY / GINI INDEX
59901
LARGEST ZIP CODE
Billings
LARGEST CITY
Yellowstone County
LARGEST COUNTY
1,091,840
TOTAL POPULATION
553,716
MALE POPULATION
538,124
FEMALE POPULATION
102.90
MALES / 100 FEMALES
97.18
FEMALES / 100 MALES
40.1
MEDIAN AGE
3.0
AVG FAMILY SIZE
2.4
AVG HOUSEHOLD SIZE
559,192
LABOR FORCE [ PEOPLE ]
63.0%
PERCENT IN LABOR FORCE
3.9%
UNEMPLOYMENT RATE
Montana Area Codes
Income in Montana
Income Overview in Montana
Per Capita Income in Montana is $37,837, while median incomes of families and households are $84,027 and $66,341 respectively.
| Characteristic | Number | Measure |
| Per Capita Income | 1,091,840 | $37,837 |
| Median Family Income | 270,427 | $84,027 |
| Mean Family Income | 270,427 | $109,442 |
| Median Household Income | 443,917 | $66,341 |
| Mean Household Income | 443,917 | $90,142 |
| Income Deficit | 270,427 | $10,359 |
| Wage / Income Gap (%) | 1,091,840 | 29.05% |
| Wage / Income Gap ($) | 1,091,840 | 70.95¢ per $1 |
| Gini / Inequality Index | 1,091,840 | 0.46 |
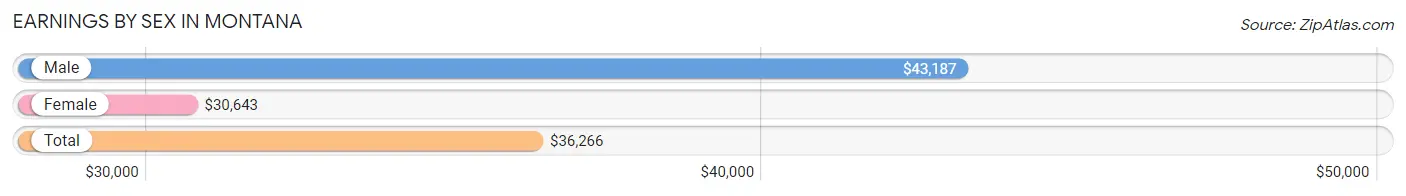
Earnings by Sex in Montana
Average Earnings in Montana are $36,266, $43,187 for men and $30,643 for women, a difference of 29.0%.
| Sex | Number | Average Earnings |
| Male | 321,513 (53.4%) | $43,187 |
| Female | 279,994 (46.6%) | $30,643 |
| Total | 601,507 (100.0%) | $36,266 |
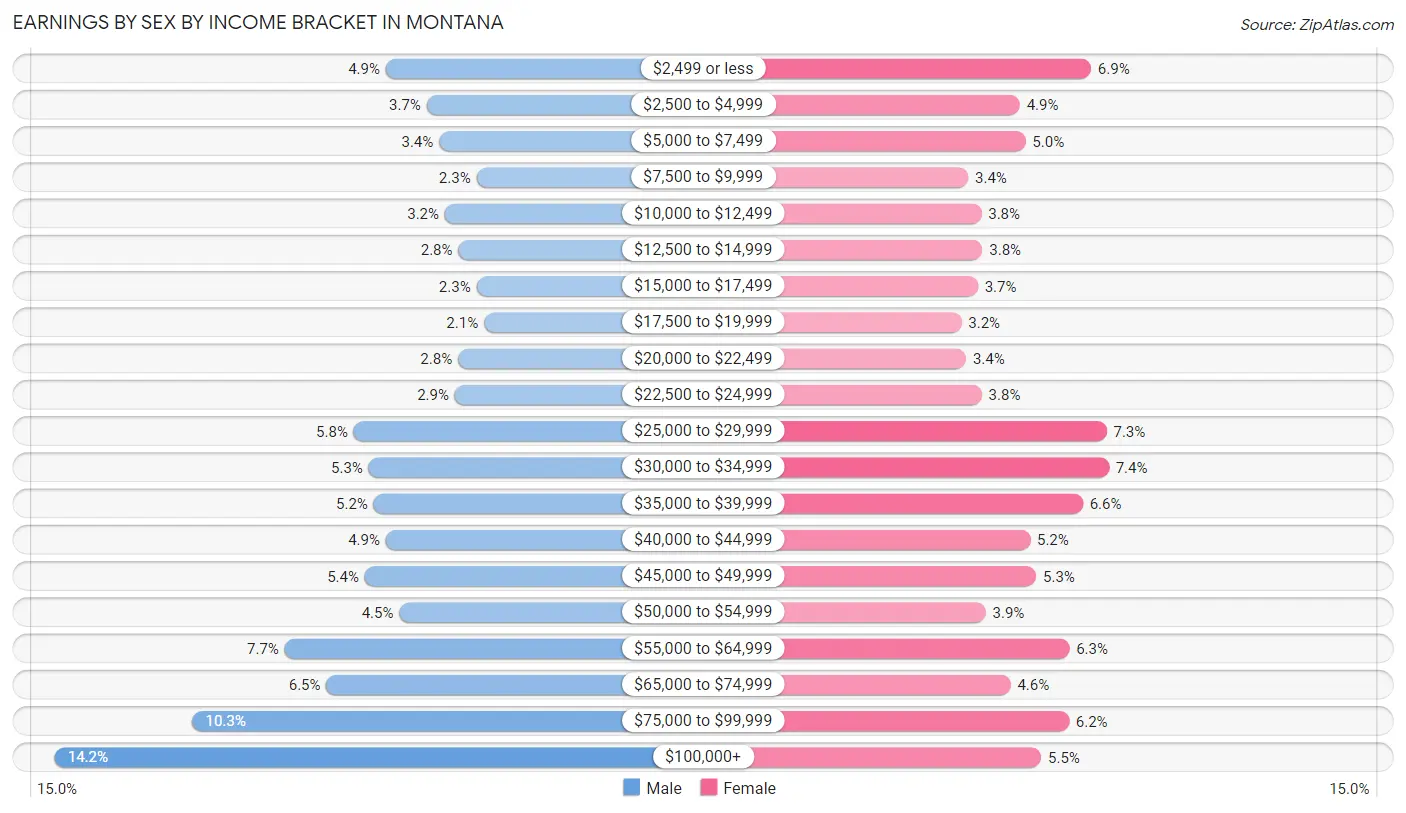
Earnings by Sex by Income Bracket in Montana
The most common earnings brackets in Montana are $100,000+ for men (45,487 | 14.1%) and $30,000 to $34,999 for women (20,621 | 7.4%).
| Income | Male | Female |
| $2,499 or less | 15,608 (4.9%) | 19,220 (6.9%) |
| $2,500 to $4,999 | 11,900 (3.7%) | 13,607 (4.9%) |
| $5,000 to $7,499 | 10,772 (3.4%) | 14,068 (5.0%) |
| $7,500 to $9,999 | 7,385 (2.3%) | 9,552 (3.4%) |
| $10,000 to $12,499 | 10,248 (3.2%) | 10,573 (3.8%) |
| $12,500 to $14,999 | 9,023 (2.8%) | 10,659 (3.8%) |
| $15,000 to $17,499 | 7,391 (2.3%) | 10,299 (3.7%) |
| $17,500 to $19,999 | 6,735 (2.1%) | 9,007 (3.2%) |
| $20,000 to $22,499 | 9,073 (2.8%) | 9,369 (3.4%) |
| $22,500 to $24,999 | 9,372 (2.9%) | 10,624 (3.8%) |
| $25,000 to $29,999 | 18,495 (5.8%) | 20,429 (7.3%) |
| $30,000 to $34,999 | 17,143 (5.3%) | 20,621 (7.4%) |
| $35,000 to $39,999 | 16,671 (5.2%) | 18,570 (6.6%) |
| $40,000 to $44,999 | 15,606 (4.9%) | 14,422 (5.1%) |
| $45,000 to $49,999 | 17,505 (5.4%) | 14,900 (5.3%) |
| $50,000 to $54,999 | 14,364 (4.5%) | 10,921 (3.9%) |
| $55,000 to $64,999 | 24,729 (7.7%) | 17,495 (6.2%) |
| $65,000 to $74,999 | 20,963 (6.5%) | 12,891 (4.6%) |
| $75,000 to $99,999 | 33,043 (10.3%) | 17,467 (6.2%) |
| $100,000+ | 45,487 (14.1%) | 15,300 (5.5%) |
| Total | 321,513 (100.0%) | 279,994 (100.0%) |
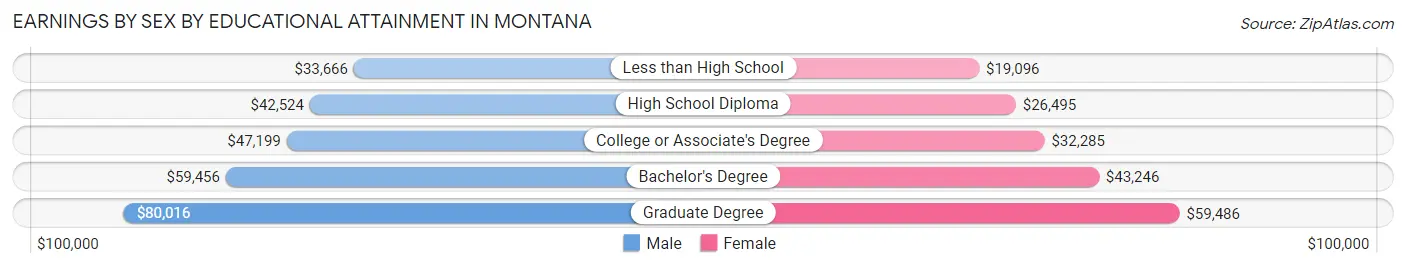
Earnings by Sex by Educational Attainment in Montana
Average earnings in Montana are $50,324 for men and $35,397 for women, a difference of 29.7%. Men with an educational attainment of graduate degree enjoy the highest average annual earnings of $80,016, while those with less than high school education earn the least with $33,666. Women with an educational attainment of graduate degree earn the most with the average annual earnings of $59,486, while those with less than high school education have the smallest earnings of $19,096.
| Educational Attainment | Male Income | Female Income |
| Less than High School | $33,666 | $19,096 |
| High School Diploma | $42,524 | $26,495 |
| College or Associate's Degree | $47,199 | $32,285 |
| Bachelor's Degree | $59,456 | $43,246 |
| Graduate Degree | $80,016 | $59,486 |
| Total | $50,324 | $35,397 |
Family Income in Montana
Family Income Brackets in Montana
According to the Montana family income data, there are 57,060 families falling into the $100,000 to $149,999 income range, which is the most common income bracket and makes up 21.1% of all families. Conversely, the $10,000 to $14,999 income bracket is the least frequent group with only 4,327 families (1.6%) belonging to this category.
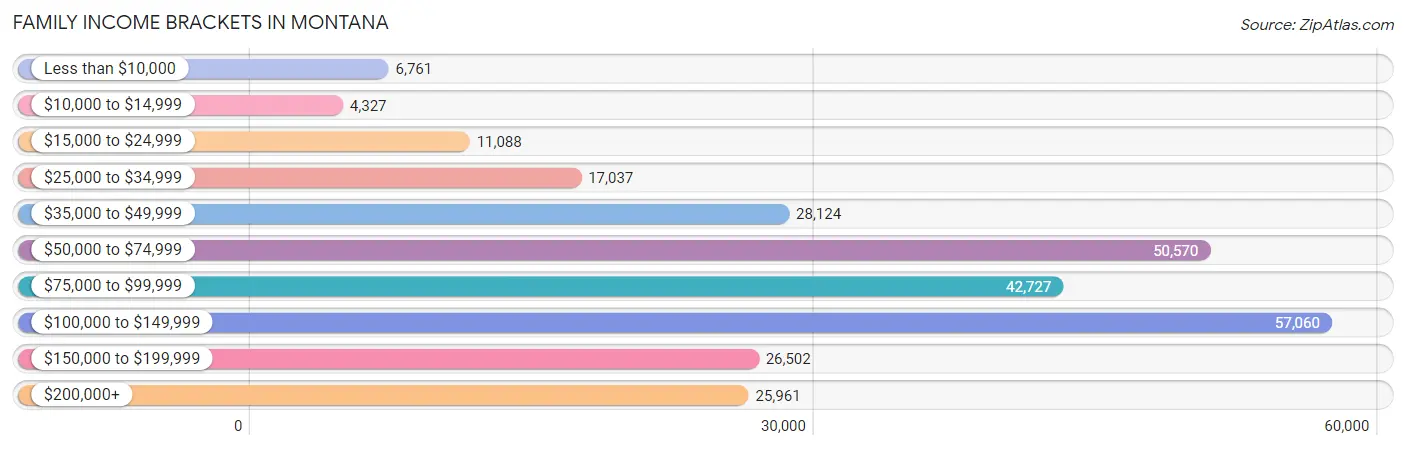
| Income Bracket | # Families | % Families |
| Less than $10,000 | 6,761 | 2.5% |
| $10,000 to $14,999 | 4,327 | 1.6% |
| $15,000 to $24,999 | 11,088 | 4.1% |
| $25,000 to $34,999 | 17,037 | 6.3% |
| $35,000 to $49,999 | 28,124 | 10.4% |
| $50,000 to $74,999 | 50,570 | 18.7% |
| $75,000 to $99,999 | 42,727 | 15.8% |
| $100,000 to $149,999 | 57,060 | 21.1% |
| $150,000 to $199,999 | 26,502 | 9.8% |
| $200,000+ | 25,961 | 9.6% |
Family Income by Famaliy Size in Montana
4-person families (42,658 | 15.8%) account for the highest median family income in Montana with $102,893 per family, while 2-person families (149,612 | 55.3%) have the highest median income of $38,469 per family member.
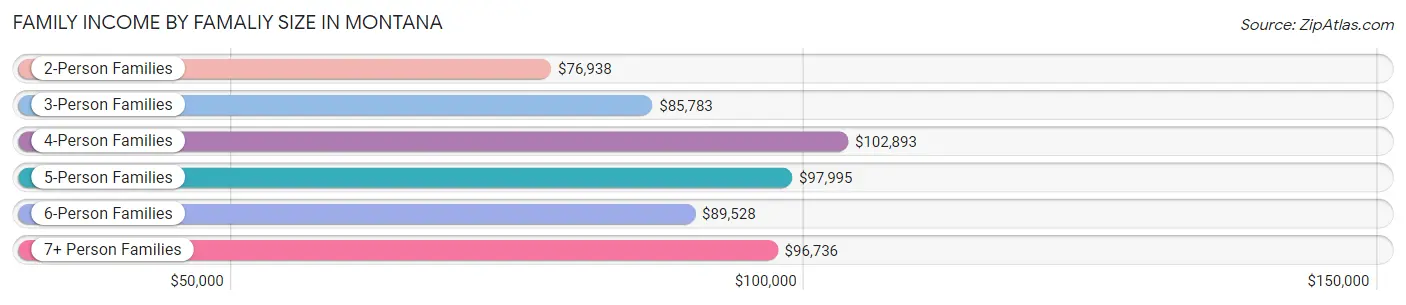
| Income Bracket | # Families | Median Income |
| 2-Person Families | 149,612 (55.3%) | $76,938 |
| 3-Person Families | 50,724 (18.8%) | $85,783 |
| 4-Person Families | 42,658 (15.8%) | $102,893 |
| 5-Person Families | 16,804 (6.2%) | $97,995 |
| 6-Person Families | 6,348 (2.4%) | $89,528 |
| 7+ Person Families | 4,281 (1.6%) | $96,736 |
| Total | 270,427 (100.0%) | $84,027 |
Family Income by Number of Earners in Montana
The median family income in Montana is $84,027, with families comprising 3+ earners (24,366) having the highest median family income of $129,547, while families with no earners (45,726) have the lowest median family income of $53,868, accounting for 9.0% and 16.9% of families, respectively.
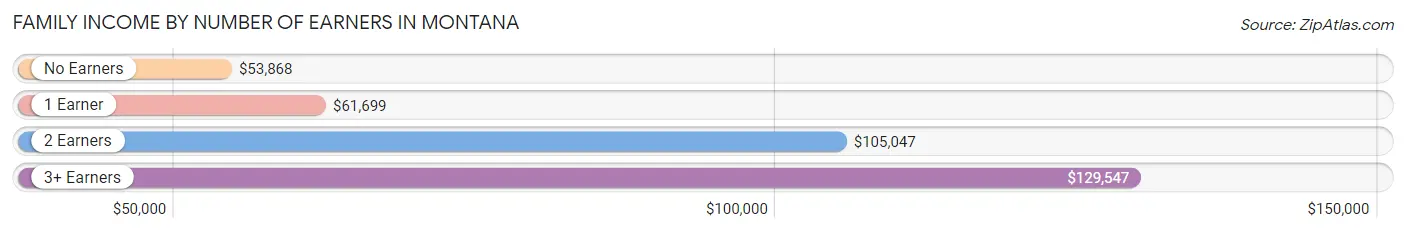
| Number of Earners | # Families | Median Income |
| No Earners | 45,726 (16.9%) | $53,868 |
| 1 Earner | 81,139 (30.0%) | $61,699 |
| 2 Earners | 119,196 (44.1%) | $105,047 |
| 3+ Earners | 24,366 (9.0%) | $129,547 |
| Total | 270,427 (100.0%) | $84,027 |
Household Income in Montana
Household Income Brackets in Montana
With 81,237 households falling in the category, the $50,000 to $74,999 income range is the most frequent in Montana, accounting for 18.3% of all households. In contrast, only 19,088 households (4.3%) fall into the $10,000 to $14,999 income bracket, making it the least populous group.
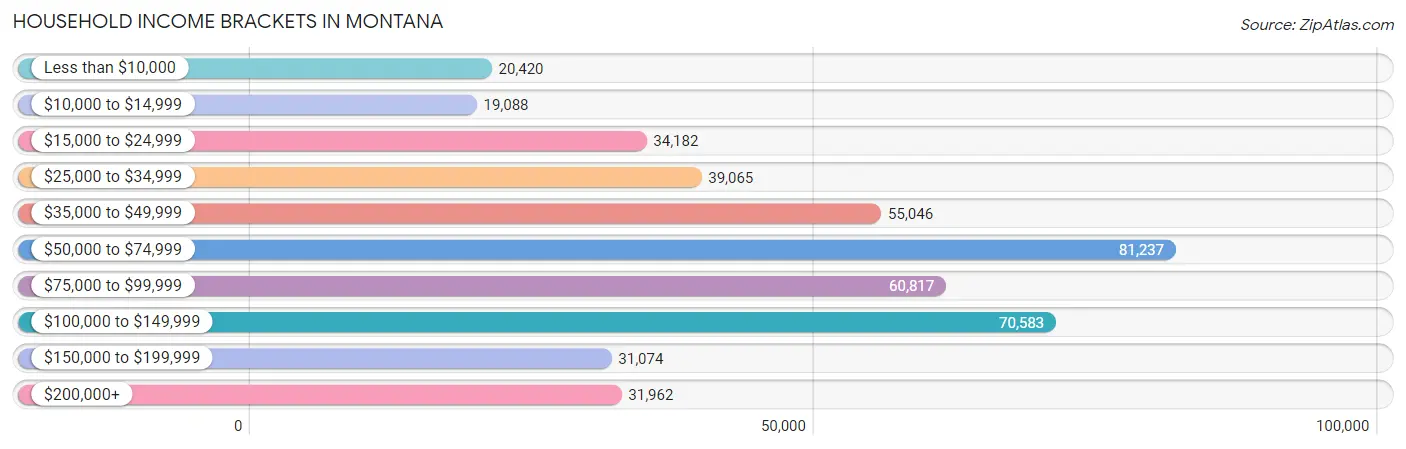
| Income Bracket | # Households | % Households |
| Less than $10,000 | 20,420 | 4.6% |
| $10,000 to $14,999 | 19,088 | 4.3% |
| $15,000 to $24,999 | 34,182 | 7.7% |
| $25,000 to $34,999 | 39,065 | 8.8% |
| $35,000 to $49,999 | 55,046 | 12.4% |
| $50,000 to $74,999 | 81,237 | 18.3% |
| $75,000 to $99,999 | 60,817 | 13.7% |
| $100,000 to $149,999 | 70,583 | 15.9% |
| $150,000 to $199,999 | 31,074 | 7.0% |
| $200,000+ | 31,962 | 7.2% |
Household Income by Householder Age in Montana
The median household income in Montana is $66,341, with the highest median household income of $78,432 found in the 45 to 64 years age bracket for the primary householder. A total of 151,924 households (34.2%) fall into this category. Meanwhile, the 15 to 24 years age bracket for the primary householder has the lowest median household income of $38,257, with 22,514 households (5.1%) in this group.
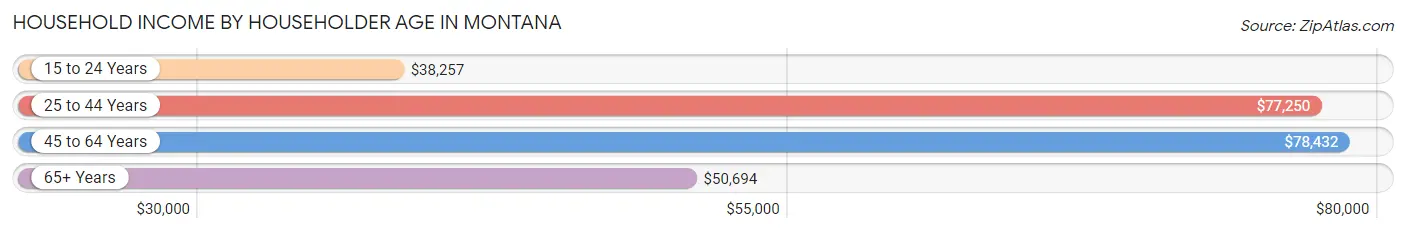
| Income Bracket | # Households | Median Income |
| 15 to 24 Years | 22,514 (5.1%) | $38,257 |
| 25 to 44 Years | 136,265 (30.7%) | $77,250 |
| 45 to 64 Years | 151,924 (34.2%) | $78,432 |
| 65+ Years | 133,214 (30.0%) | $50,694 |
| Total | 443,917 (100.0%) | $66,341 |
Poverty in Montana
Income Below Poverty by Sex and Age in Montana
With 11.8% poverty level for males and 13.1% for females among the residents of Montana, 18 to 24 year old males and 18 to 24 year old females are the most vulnerable to poverty, with 12,002 males (24.2%) and 11,677 females (26.7%) in their respective age groups living below the poverty level.
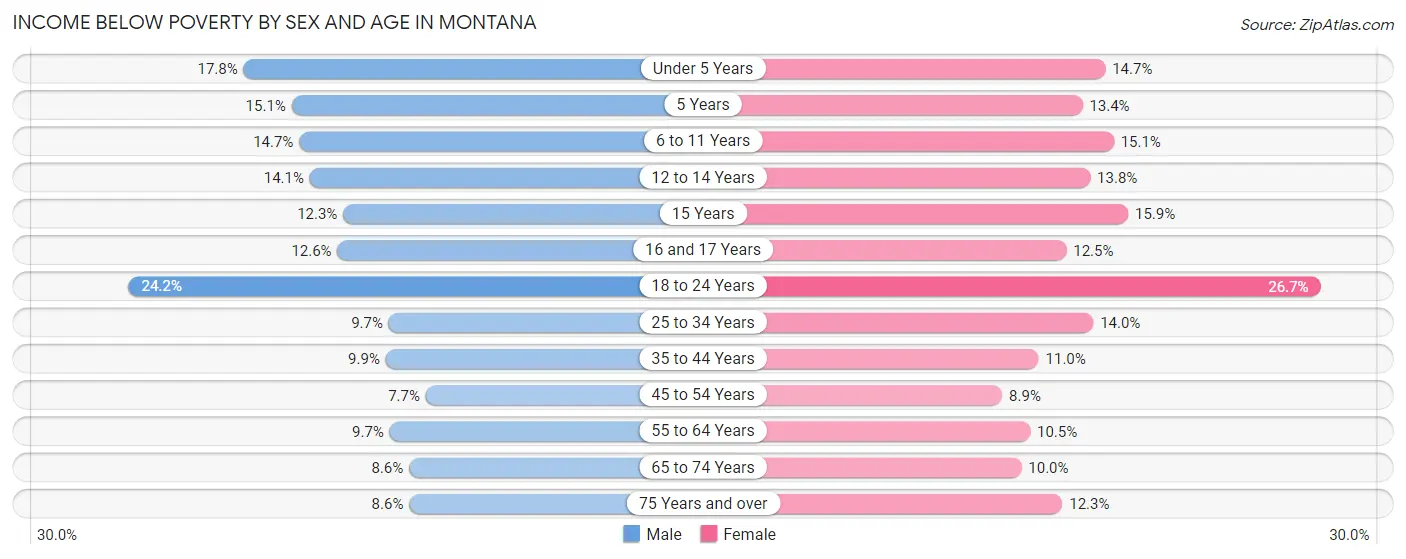
| Age Bracket | Male | Female |
| Under 5 Years | 5,287 (17.8%) | 4,148 (14.7%) |
| 5 Years | 868 (15.1%) | 861 (13.4%) |
| 6 to 11 Years | 5,921 (14.7%) | 5,568 (15.1%) |
| 12 to 14 Years | 2,845 (14.1%) | 2,688 (13.8%) |
| 15 Years | 802 (12.3%) | 1,031 (15.9%) |
| 16 and 17 Years | 1,742 (12.6%) | 1,605 (12.5%) |
| 18 to 24 Years | 12,002 (24.2%) | 11,677 (26.7%) |
| 25 to 34 Years | 6,848 (9.7%) | 9,436 (14.0%) |
| 35 to 44 Years | 6,837 (9.9%) | 7,177 (11.0%) |
| 45 to 54 Years | 4,699 (7.7%) | 5,229 (8.9%) |
| 55 to 64 Years | 7,058 (9.7%) | 7,846 (10.5%) |
| 65 to 74 Years | 5,464 (8.6%) | 6,453 (10.0%) |
| 75 Years and over | 3,086 (8.6%) | 5,151 (12.3%) |
| Total | 63,459 (11.8%) | 68,870 (13.1%) |
Income Above Poverty by Sex and Age in Montana
According to the poverty statistics in Montana, males aged 45 to 54 years and females aged 45 to 54 years are the age groups that are most secure financially, with 92.3% of males and 91.1% of females in these age groups living above the poverty line.
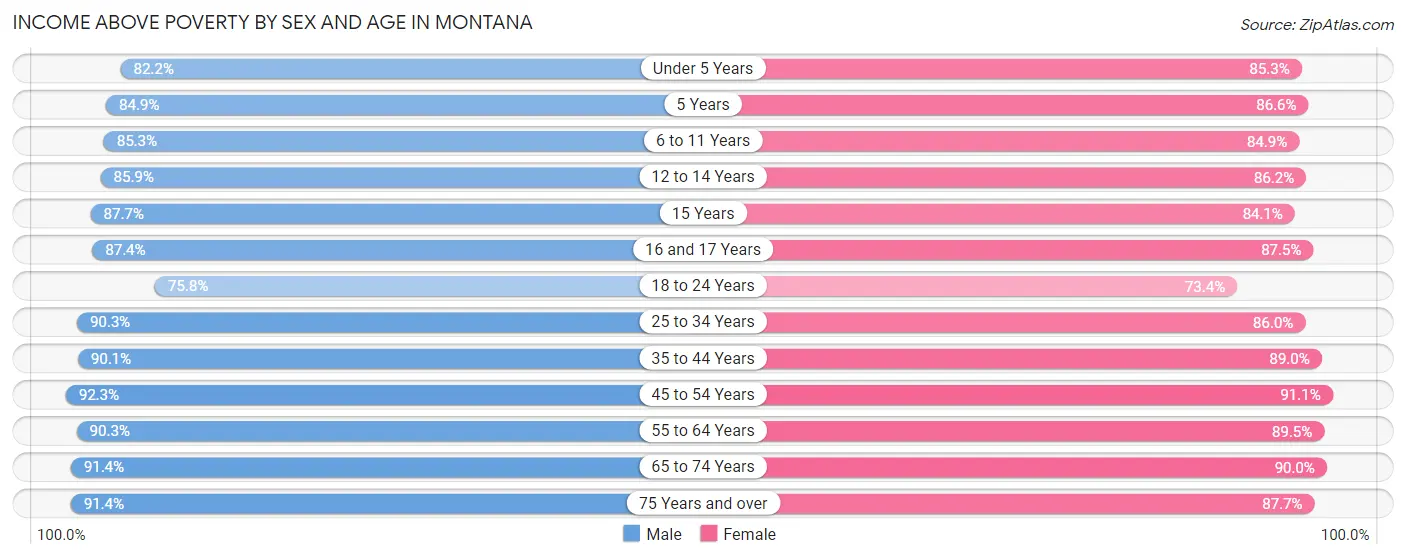
| Age Bracket | Male | Female |
| Under 5 Years | 24,398 (82.2%) | 24,137 (85.3%) |
| 5 Years | 4,869 (84.9%) | 5,562 (86.6%) |
| 6 to 11 Years | 34,320 (85.3%) | 31,214 (84.9%) |
| 12 to 14 Years | 17,300 (85.9%) | 16,743 (86.2%) |
| 15 Years | 5,741 (87.7%) | 5,438 (84.1%) |
| 16 and 17 Years | 12,102 (87.4%) | 11,230 (87.5%) |
| 18 to 24 Years | 37,581 (75.8%) | 32,138 (73.4%) |
| 25 to 34 Years | 63,630 (90.3%) | 57,979 (86.0%) |
| 35 to 44 Years | 62,324 (90.1%) | 58,301 (89.0%) |
| 45 to 54 Years | 56,649 (92.3%) | 53,338 (91.1%) |
| 55 to 64 Years | 65,896 (90.3%) | 67,040 (89.5%) |
| 65 to 74 Years | 58,140 (91.4%) | 58,060 (90.0%) |
| 75 Years and over | 32,900 (91.4%) | 36,786 (87.7%) |
| Total | 475,850 (88.2%) | 457,966 (86.9%) |
Income Below Poverty Among Married-Couple Families in Montana
The poverty statistics for married-couple families in Montana show that 3.9% or 8,525 of the total 216,250 families live below the poverty line. Families with 5 or more children have the highest poverty rate of 20.3%, comprising of 414 families. On the other hand, families with no children have the lowest poverty rate of 3.2%, which includes 4,410 families.
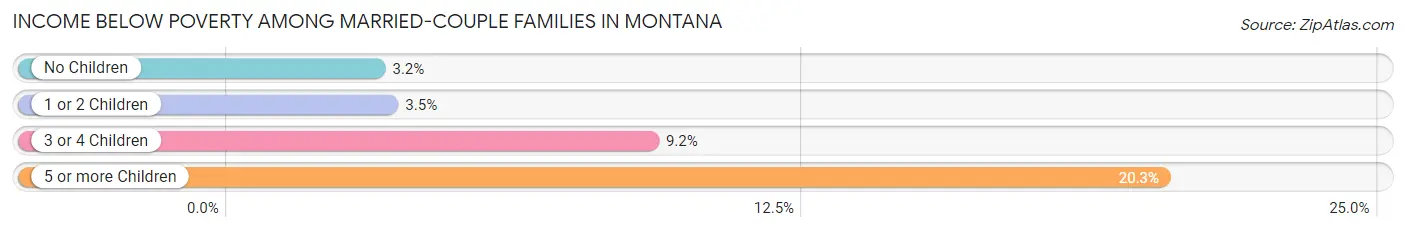
| Children | Above Poverty | Below Poverty |
| No Children | 132,783 (96.8%) | 4,410 (3.2%) |
| 1 or 2 Children | 57,132 (96.5%) | 2,069 (3.5%) |
| 3 or 4 Children | 16,185 (90.8%) | 1,632 (9.2%) |
| 5 or more Children | 1,625 (79.7%) | 414 (20.3%) |
| Total | 207,725 (96.1%) | 8,525 (3.9%) |
Income Below Poverty Among Single-Parent Households in Montana
According to the poverty data in Montana, 13.4% or 2,597 single-father households and 25.0% or 8,690 single-mother households are living below the poverty line. Among single-father households, those with 5 or more children have the highest poverty rate, with 93 households (78.1%) experiencing poverty. Likewise, among single-mother households, those with 5 or more children have the highest poverty rate, with 334 households (79.7%) falling below the poverty line.
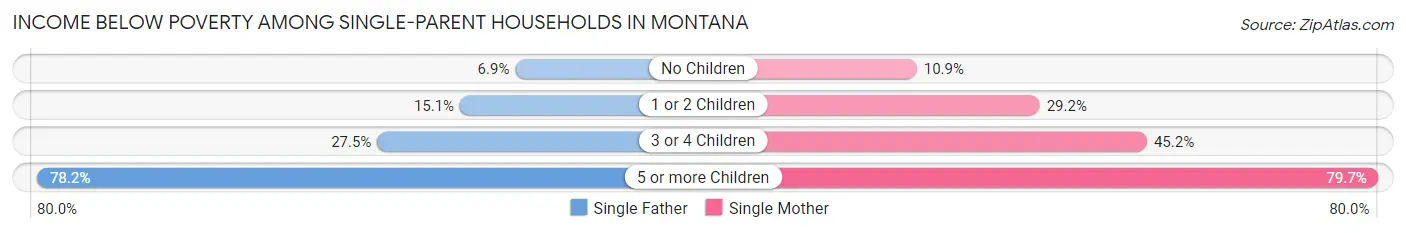
| Children | Single Father | Single Mother |
| No Children | 502 (6.9%) | 1,320 (10.9%) |
| 1 or 2 Children | 1,589 (15.1%) | 5,514 (29.2%) |
| 3 or 4 Children | 413 (27.5%) | 1,522 (45.2%) |
| 5 or more Children | 93 (78.1%) | 334 (79.7%) |
| Total | 2,597 (13.4%) | 8,690 (25.0%) |
Income Below Poverty Among Married-Couple vs Single-Parent Households in Montana
The poverty data for Montana shows that 8,525 of the married-couple family households (3.9%) and 11,287 of the single-parent households (20.8%) are living below the poverty level. Within the married-couple family households, those with 5 or more children have the highest poverty rate, with 414 households (20.3%) falling below the poverty line. Among the single-parent households, those with 5 or more children have the highest poverty rate, with 427 household (79.4%) living below poverty.
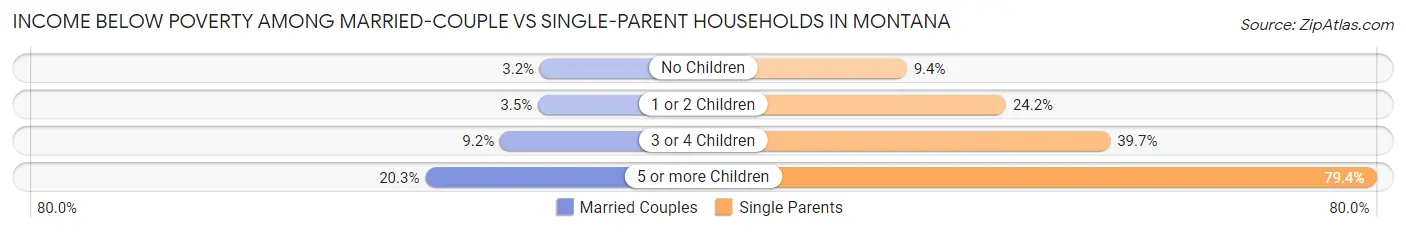
| Children | Married-Couple Families | Single-Parent Households |
| No Children | 4,410 (3.2%) | 1,822 (9.4%) |
| 1 or 2 Children | 2,069 (3.5%) | 7,103 (24.2%) |
| 3 or 4 Children | 1,632 (9.2%) | 1,935 (39.7%) |
| 5 or more Children | 414 (20.3%) | 427 (79.4%) |
| Total | 8,525 (3.9%) | 11,287 (20.8%) |
Largest Zip Codes by Population in Montana
The largest zip codes in Montana by population are 59901 (60,177), 59102 (48,480), 59718 (42,538), 59101 (40,848), and 59715 (39,061).
1.59901
60,177 (5.51%)
2.59102
48,480 (4.44%)
3.59718
42,538 (3.90%)
4.59101
40,848 (3.74%)
5.59715
39,061 (3.58%)
6.59105
34,895 (3.20%)
7.59405
34,010 (3.11%)
8.59701
33,990 (3.11%)
9.59601
31,447 (2.88%)
10.59801
31,094 (2.85%)
11.59602
29,846 (2.73%)
12.59404
28,417 (2.60%)
13.59714
23,248 (2.13%)
14.59808
22,921 (2.10%)
15.59802
19,533 (1.79%)
16.59106
19,057 (1.75%)
17.59803
17,109 (1.57%)
18.59912
15,381 (1.41%)
19.59840
14,625 (1.34%)
20.59937
14,183 (1.30%)
21.59401
13,660 (1.25%)
22.59047
13,565 (1.24%)
23.59044
12,851 (1.18%)
24.59501
12,358 (1.13%)
25.59870
12,182 (1.12%)
26.59301
11,610 (1.06%)
27.59860
11,528 (1.06%)
28.59923
9,545 (0.87%)
29.59711
9,424 (0.86%)
30.59911
9,161 (0.84%)
Largest Cities by Population in Montana
The largest cities in Montana by population are Billings (117,093), Missoula (74,627), Great Falls (60,373), Bozeman (53,500), and Butte Silver Bow balance (34,638).
1.Billings
117,093 (10.72%)
2.Missoula
74,627 (6.83%)
60,373 (5.53%)
4.Bozeman
53,500 (4.90%)
34,638 (3.17%)
6.Helena
32,529 (2.98%)
25,473 (2.33%)
8.Belgrade
10,941 (1.00%)
9,435 (0.86%)
9,374 (0.86%)
11.Havre
9,332 (0.85%)
12.Evergreen
8,514 (0.78%)
13.Livingston
8,489 (0.78%)
14.Miles City
8,432 (0.77%)
8,206 (0.75%)
16.Whitefish
8,098 (0.74%)
17.Lockwood
7,393 (0.68%)
18.Laurel
7,181 (0.66%)
19.Sidney
6,257 (0.57%)
20.Lewistown
5,988 (0.55%)
21.Four Corners
5,631 (0.52%)
5,435 (0.50%)
5,265 (0.48%)
24.Polson
5,218 (0.48%)
5,143 (0.47%)
26.Bigfork
4,953 (0.45%)
27.Glendive
4,861 (0.45%)
28.Hamilton
4,806 (0.44%)
29.Lolo
4,573 (0.42%)
4,281 (0.39%)
Largest Counties by Population in Montana
The largest counties in Montana by population are Yellowstone County (165,524), Gallatin County (119,685), Missoula County (118,541), Flathead County (105,950), and Cascade County (84,423).
165,524 (15.16%)
119,685 (10.96%)
118,541 (10.86%)
105,950 (9.70%)
84,423 (7.73%)
71,487 (6.55%)
44,876 (4.11%)
35,306 (3.23%)
31,509 (2.89%)
20,157 (1.85%)
11.Park County
17,320 (1.59%)
12.Hill County
16,238 (1.49%)
13,781 (1.26%)
13,090 (1.20%)
12,615 (1.16%)
12,273 (1.12%)
11,957 (1.10%)
11,496 (1.05%)
11,366 (1.04%)
10,799 (0.99%)
10,645 (0.97%)
9,469 (0.87%)
9,435 (0.86%)
8,978 (0.82%)
8,915 (0.82%)
8,742 (0.80%)
8,310 (0.76%)
7,552 (0.69%)
7,030 (0.64%)
6,998 (0.64%)
Race in Montana
The most populous races in Montana are White / Caucasian (943,827 | 86.4%), Native / Alaskan (63,493 | 5.8%), and Two or more Races (57,010 | 5.2%).
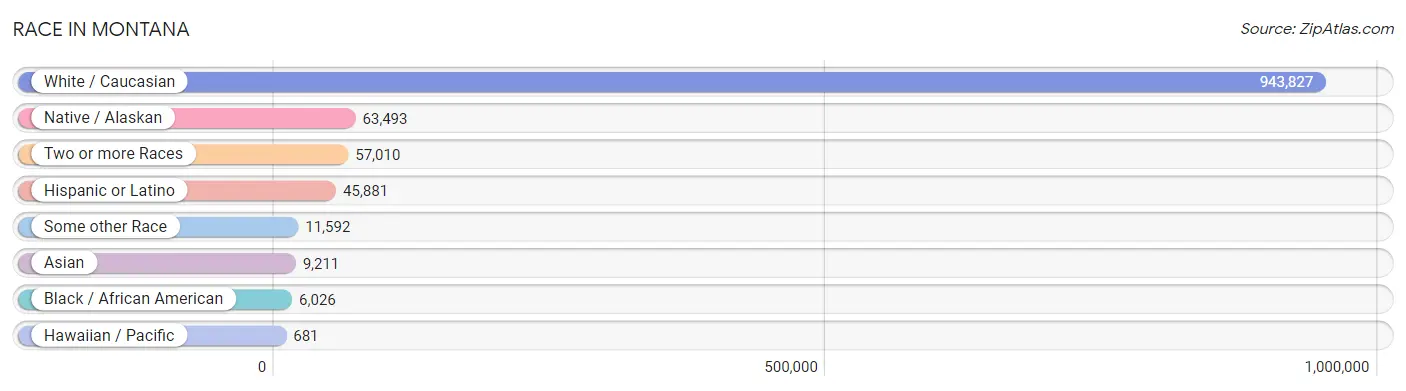
| Race | # Population | % Population |
| Asian | 9,211 | 0.8% |
| Black / African American | 6,026 | 0.5% |
| Hawaiian / Pacific | 681 | 0.1% |
| Hispanic or Latino | 45,881 | 4.2% |
| Native / Alaskan | 63,493 | 5.8% |
| White / Caucasian | 943,827 | 86.4% |
| Two or more Races | 57,010 | 5.2% |
| Some other Race | 11,592 | 1.1% |
| Total | 1,091,840 | 100.0% |
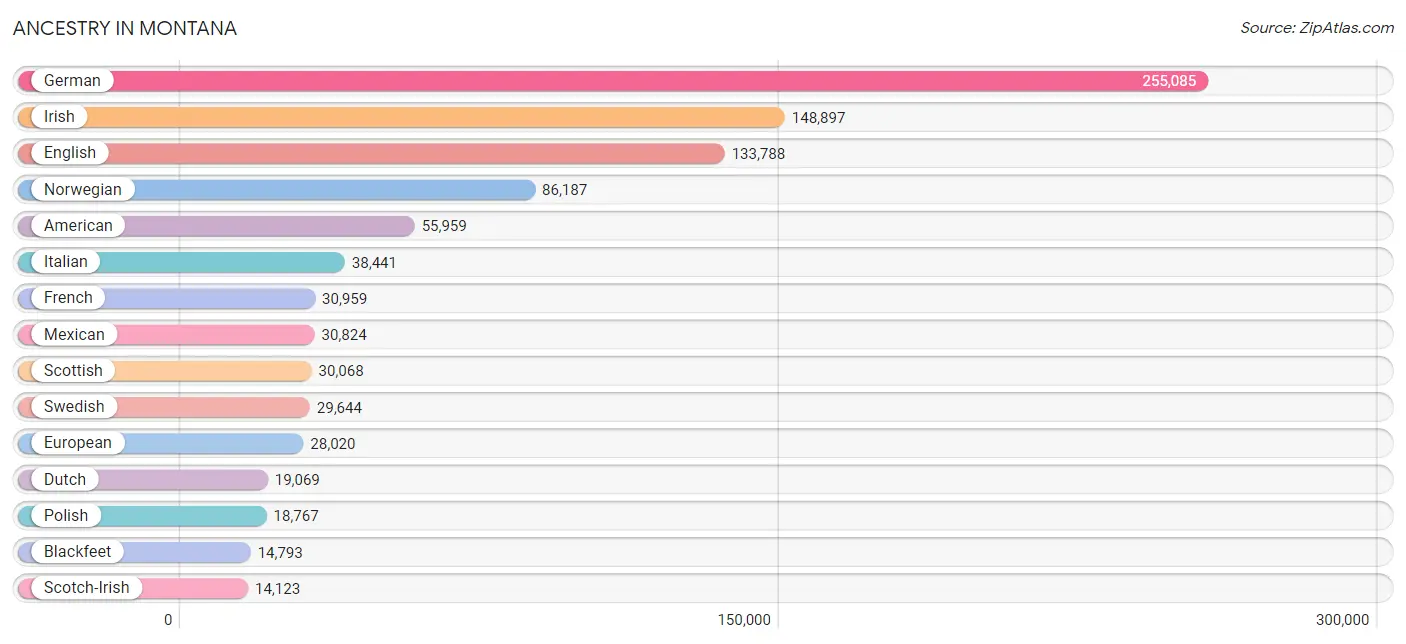
Ancestry in Montana
The most populous ancestries reported in Montana are German (255,085 | 23.4%), Irish (148,897 | 13.6%), English (133,788 | 12.2%), Norwegian (86,187 | 7.9%), and American (55,959 | 5.1%), together accounting for 62.3% of all Montana residents.
| Ancestry | # Population | % Population |
| Afghan | 6 | 0.0% |
| African | 795 | 0.1% |
| Alaska Native | 286 | 0.0% |
| Alaskan Athabascan | 54 | 0.0% |
| Albanian | 13 | 0.0% |
| Aleut | 239 | 0.0% |
| Alsatian | 25 | 0.0% |
| American | 55,959 | 5.1% |
| Apache | 560 | 0.1% |
| Arab | 1,644 | 0.2% |
| Arapaho | 384 | 0.0% |
| Argentinean | 314 | 0.0% |
| Armenian | 706 | 0.1% |
| Assyrian / Chaldean / Syriac | 30 | 0.0% |
| Australian | 389 | 0.0% |
| Austrian | 3,880 | 0.4% |
| Bahamian | 28 | 0.0% |
| Bangladeshi | 430 | 0.0% |
| Barbadian | 31 | 0.0% |
| Basque | 824 | 0.1% |
| Belgian | 2,100 | 0.2% |
| Belizean | 1 | 0.0% |
| Bermudan | 42 | 0.0% |
| Bhutanese | 2,864 | 0.3% |
| Blackfeet | 14,793 | 1.3% |
| Bolivian | 55 | 0.0% |
| Brazilian | 202 | 0.0% |
| British | 6,044 | 0.5% |
| Bulgarian | 318 | 0.0% |
| Burmese | 1,800 | 0.2% |
| Cajun | 46 | 0.0% |
| Cambodian | 39 | 0.0% |
| Canadian | 2,516 | 0.2% |
| Celtic | 261 | 0.0% |
| Central American | 1,155 | 0.1% |
| Central American Indian | 78 | 0.0% |
| Cherokee | 3,012 | 0.3% |
| Cheyenne | 5,776 | 0.5% |
| Chickasaw | 178 | 0.0% |
| Chilean | 321 | 0.0% |
| Chippewa | 4,828 | 0.4% |
| Choctaw | 669 | 0.1% |
| Colombian | 747 | 0.1% |
| Colville | 99 | 0.0% |
| Comanche | 110 | 0.0% |
| Costa Rican | 108 | 0.0% |
| Cree | 2,040 | 0.2% |
| Creek | 169 | 0.0% |
| Croatian | 2,375 | 0.2% |
| Crow | 10,074 | 0.9% |
| Cuban | 972 | 0.1% |
| Cypriot | 30 | 0.0% |
| Czech | 6,031 | 0.5% |
| Czechoslovakian | 1,430 | 0.1% |
| Danish | 11,805 | 1.1% |
| Delaware | 47 | 0.0% |
| Dominican | 349 | 0.0% |
| Dutch | 19,069 | 1.8% |
| Dutch West Indian | 133 | 0.0% |
| Eastern European | 2,146 | 0.2% |
| Ecuadorian | 156 | 0.0% |
| Egyptian | 240 | 0.0% |
| English | 133,788 | 12.2% |
| Estonian | 58 | 0.0% |
| Ethiopian | 272 | 0.0% |
| European | 28,020 | 2.6% |
| Fijian | 196 | 0.0% |
| Filipino | 214 | 0.0% |
| Finnish | 6,913 | 0.6% |
| French | 30,959 | 2.8% |
| French American Indian | 316 | 0.0% |
| French Canadian | 6,963 | 0.6% |
| German | 255,085 | 23.4% |
| German Russian | 201 | 0.0% |
| Ghanaian | 13 | 0.0% |
| Greek | 2,459 | 0.2% |
| Guamanian / Chamorro | 111 | 0.0% |
| Guatemalan | 304 | 0.0% |
| Guyanese | 39 | 0.0% |
| Haitian | 257 | 0.0% |
| Honduran | 254 | 0.0% |
| Hopi | 31 | 0.0% |
| Houma | 7 | 0.0% |
| Hungarian | 3,893 | 0.4% |
| Icelander | 283 | 0.0% |
| Indian (Asian) | 3,343 | 0.3% |
| Indonesian | 7 | 0.0% |
| Inupiat | 226 | 0.0% |
| Iranian | 379 | 0.0% |
| Irish | 148,897 | 13.6% |
| Iroquois | 291 | 0.0% |
| Israeli | 61 | 0.0% |
| Italian | 38,441 | 3.5% |
| Jamaican | 187 | 0.0% |
| Japanese | 26 | 0.0% |
| Kiowa | 53 | 0.0% |
| Korean | 5,441 | 0.5% |
| Laotian | 68 | 0.0% |
| Latvian | 99 | 0.0% |
| Lebanese | 808 | 0.1% |
| Lithuanian | 1,546 | 0.1% |
| Lumbee | 20 | 0.0% |
| Luxembourger | 421 | 0.0% |
| Macedonian | 68 | 0.0% |
| Malaysian | 200 | 0.0% |
| Maltese | 74 | 0.0% |
| Menominee | 24 | 0.0% |
| Mexican | 30,824 | 2.8% |
| Mexican American Indian | 354 | 0.0% |
| Mongolian | 53 | 0.0% |
| Moroccan | 6 | 0.0% |
| Native Hawaiian | 1,121 | 0.1% |
| Navajo | 901 | 0.1% |
| New Zealander | 62 | 0.0% |
| Nicaraguan | 149 | 0.0% |
| Nigerian | 64 | 0.0% |
| Northern European | 5,677 | 0.5% |
| Norwegian | 86,187 | 7.9% |
| Osage | 33 | 0.0% |
| Ottawa | 105 | 0.0% |
| Paiute | 66 | 0.0% |
| Pakistani | 332 | 0.0% |
| Palestinian | 35 | 0.0% |
| Panamanian | 219 | 0.0% |
| Paraguayan | 66 | 0.0% |
| Pennsylvania German | 1,230 | 0.1% |
| Peruvian | 430 | 0.0% |
| Pima | 5 | 0.0% |
| Polish | 18,767 | 1.7% |
| Portuguese | 1,921 | 0.2% |
| Potawatomi | 285 | 0.0% |
| Pueblo | 135 | 0.0% |
| Puerto Rican | 2,078 | 0.2% |
| Puget Sound Salish | 137 | 0.0% |
| Romanian | 1,089 | 0.1% |
| Russian | 8,616 | 0.8% |
| Salvadoran | 121 | 0.0% |
| Samoan | 537 | 0.1% |
| Scandinavian | 13,831 | 1.3% |
| Scotch-Irish | 14,123 | 1.3% |
| Scottish | 30,068 | 2.8% |
| Seminole | 72 | 0.0% |
| Serbian | 963 | 0.1% |
| Shoshone | 560 | 0.1% |
| Sioux | 3,531 | 0.3% |
| Slavic | 1,092 | 0.1% |
| Slovak | 1,168 | 0.1% |
| Slovene | 799 | 0.1% |
| South African | 201 | 0.0% |
| South American | 2,447 | 0.2% |
| South American Indian | 186 | 0.0% |
| Spaniard | 2,800 | 0.3% |
| Spanish | 2,743 | 0.3% |
| Spanish American | 154 | 0.0% |
| Sri Lankan | 1,136 | 0.1% |
| Subsaharan African | 1,571 | 0.1% |
| Swedish | 29,644 | 2.7% |
| Swiss | 5,191 | 0.5% |
| Syrian | 100 | 0.0% |
| Thai | 1,172 | 0.1% |
| Tlingit-Haida | 306 | 0.0% |
| Tohono O'Odham | 43 | 0.0% |
| Tongan | 435 | 0.0% |
| Trinidadian and Tobagonian | 61 | 0.0% |
| Tsimshian | 3 | 0.0% |
| Turkish | 376 | 0.0% |
| Ukrainian | 3,605 | 0.3% |
| Uruguayan | 58 | 0.0% |
| Ute | 187 | 0.0% |
| Venezuelan | 248 | 0.0% |
| Vietnamese | 3 | 0.0% |
| Welsh | 8,998 | 0.8% |
| West Indian | 185 | 0.0% |
| Yakama | 20 | 0.0% |
| Yaqui | 20 | 0.0% |
| Yugoslavian | 1,553 | 0.1% |
| Yup'ik | 88 | 0.0% |
| Zimbabwean | 15 | 0.0% | View All 178 Rows |
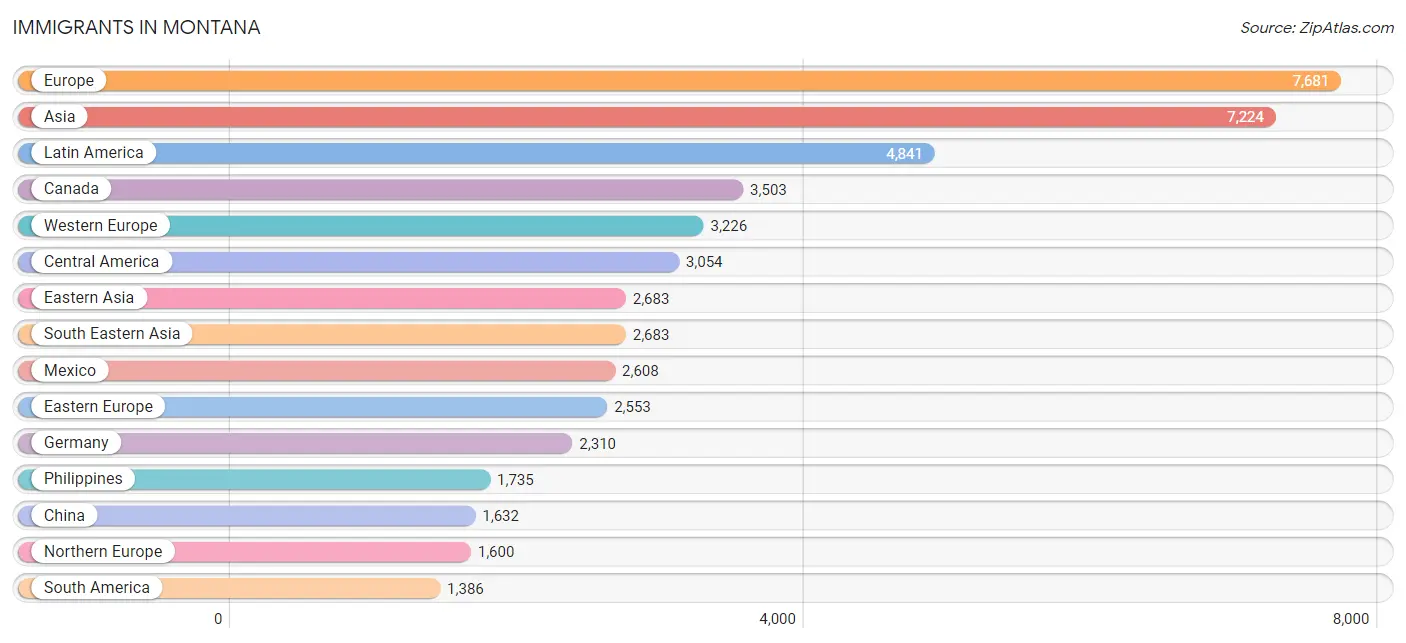
Immigrants in Montana
The most numerous immigrant groups reported in Montana came from Europe (7,681 | 0.7%), Asia (7,224 | 0.7%), Latin America (4,841 | 0.4%), Canada (3,503 | 0.3%), and Western Europe (3,226 | 0.3%), together accounting for 2.4% of all Montana residents.
| Immigration Origin | # Population | % Population |
| Africa | 971 | 0.1% |
| Albania | 3 | 0.0% |
| Argentina | 125 | 0.0% |
| Armenia | 20 | 0.0% |
| Asia | 7,224 | 0.7% |
| Australia | 250 | 0.0% |
| Austria | 44 | 0.0% |
| Bangladesh | 3 | 0.0% |
| Belarus | 276 | 0.0% |
| Belgium | 77 | 0.0% |
| Belize | 25 | 0.0% |
| Bolivia | 7 | 0.0% |
| Brazil | 268 | 0.0% |
| Bulgaria | 98 | 0.0% |
| Cambodia | 6 | 0.0% |
| Canada | 3,503 | 0.3% |
| Caribbean | 401 | 0.0% |
| Central America | 3,054 | 0.3% |
| Chile | 47 | 0.0% |
| China | 1,632 | 0.2% |
| Colombia | 255 | 0.0% |
| Costa Rica | 41 | 0.0% |
| Croatia | 12 | 0.0% |
| Cuba | 77 | 0.0% |
| Czechoslovakia | 155 | 0.0% |
| Denmark | 66 | 0.0% |
| Dominica | 31 | 0.0% |
| Dominican Republic | 107 | 0.0% |
| Eastern Africa | 413 | 0.0% |
| Eastern Asia | 2,683 | 0.3% |
| Eastern Europe | 2,553 | 0.2% |
| Ecuador | 104 | 0.0% |
| Egypt | 141 | 0.0% |
| El Salvador | 10 | 0.0% |
| England | 406 | 0.0% |
| Ethiopia | 162 | 0.0% |
| Europe | 7,681 | 0.7% |
| Fiji | 21 | 0.0% |
| France | 186 | 0.0% |
| Germany | 2,310 | 0.2% |
| Ghana | 50 | 0.0% |
| Greece | 13 | 0.0% |
| Guatemala | 147 | 0.0% |
| Guyana | 91 | 0.0% |
| Haiti | 126 | 0.0% |
| Honduras | 29 | 0.0% |
| Hong Kong | 244 | 0.0% |
| Hungary | 193 | 0.0% |
| India | 415 | 0.0% |
| Indonesia | 13 | 0.0% |
| Iran | 172 | 0.0% |
| Iraq | 50 | 0.0% |
| Ireland | 105 | 0.0% |
| Israel | 46 | 0.0% |
| Italy | 147 | 0.0% |
| Jamaica | 44 | 0.0% |
| Japan | 385 | 0.0% |
| Kazakhstan | 43 | 0.0% |
| Kenya | 26 | 0.0% |
| Korea | 666 | 0.1% |
| Kuwait | 110 | 0.0% |
| Laos | 85 | 0.0% |
| Latin America | 4,841 | 0.4% |
| Latvia | 32 | 0.0% |
| Lebanon | 61 | 0.0% |
| Liberia | 1 | 0.0% |
| Lithuania | 22 | 0.0% |
| Malaysia | 61 | 0.0% |
| Mexico | 2,608 | 0.2% |
| Micronesia | 23 | 0.0% |
| Middle Africa | 14 | 0.0% |
| Moldova | 213 | 0.0% |
| Nepal | 101 | 0.0% |
| Netherlands | 368 | 0.0% |
| Nicaragua | 90 | 0.0% |
| Nigeria | 23 | 0.0% |
| North Macedonia | 10 | 0.0% |
| Northern Africa | 142 | 0.0% |
| Northern Europe | 1,600 | 0.2% |
| Norway | 50 | 0.0% |
| Oceania | 493 | 0.1% |
| Pakistan | 27 | 0.0% |
| Panama | 104 | 0.0% |
| Peru | 240 | 0.0% |
| Philippines | 1,735 | 0.2% |
| Poland | 196 | 0.0% |
| Portugal | 13 | 0.0% |
| Romania | 259 | 0.0% |
| Russia | 425 | 0.0% |
| Saudi Arabia | 231 | 0.0% |
| Scotland | 151 | 0.0% |
| Singapore | 16 | 0.0% |
| South Africa | 241 | 0.0% |
| South America | 1,386 | 0.1% |
| South Central Asia | 1,068 | 0.1% |
| South Eastern Asia | 2,683 | 0.3% |
| Southern Europe | 293 | 0.0% |
| Spain | 120 | 0.0% |
| Sri Lanka | 182 | 0.0% |
| St. Vincent and the Grenadines | 4 | 0.0% |
| Sweden | 40 | 0.0% |
| Switzerland | 241 | 0.0% |
| Taiwan | 204 | 0.0% |
| Thailand | 189 | 0.0% |
| Trinidad and Tobago | 12 | 0.0% |
| Turkey | 170 | 0.0% |
| Ukraine | 567 | 0.1% |
| Uruguay | 43 | 0.0% |
| Venezuela | 137 | 0.0% |
| Vietnam | 578 | 0.1% |
| Western Africa | 119 | 0.0% |
| Western Asia | 790 | 0.1% |
| Western Europe | 3,226 | 0.3% |
| Zimbabwe | 18 | 0.0% | View All 114 Rows |
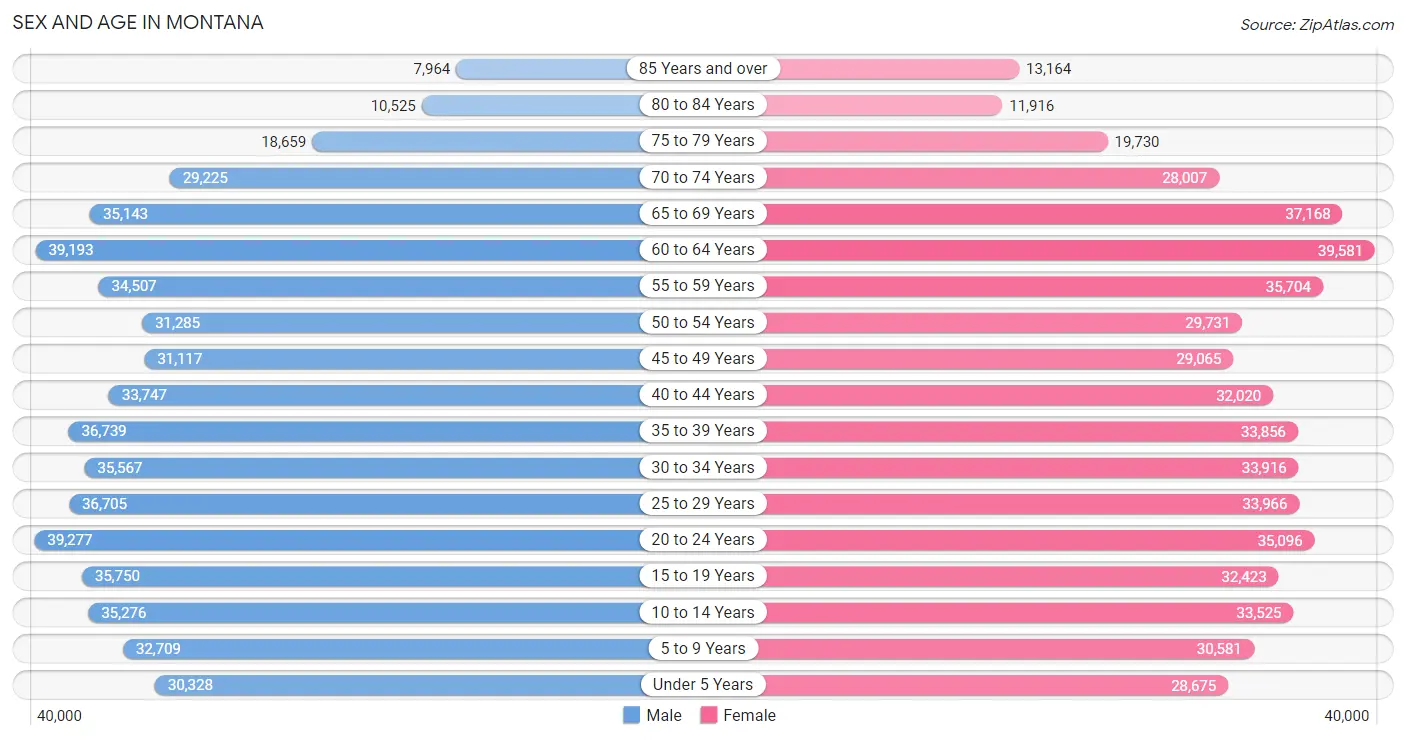
Sex and Age in Montana
Sex and Age in Montana
The most populous age groups in Montana are 20 to 24 Years (39,277 | 7.1%) for men and 60 to 64 Years (39,581 | 7.4%) for women.
| Age Bracket | Male | Female |
| Under 5 Years | 30,328 (5.5%) | 28,675 (5.3%) |
| 5 to 9 Years | 32,709 (5.9%) | 30,581 (5.7%) |
| 10 to 14 Years | 35,276 (6.4%) | 33,525 (6.2%) |
| 15 to 19 Years | 35,750 (6.5%) | 32,423 (6.0%) |
| 20 to 24 Years | 39,277 (7.1%) | 35,096 (6.5%) |
| 25 to 29 Years | 36,705 (6.6%) | 33,966 (6.3%) |
| 30 to 34 Years | 35,567 (6.4%) | 33,916 (6.3%) |
| 35 to 39 Years | 36,739 (6.6%) | 33,856 (6.3%) |
| 40 to 44 Years | 33,747 (6.1%) | 32,020 (5.9%) |
| 45 to 49 Years | 31,117 (5.6%) | 29,065 (5.4%) |
| 50 to 54 Years | 31,285 (5.7%) | 29,731 (5.5%) |
| 55 to 59 Years | 34,507 (6.2%) | 35,704 (6.6%) |
| 60 to 64 Years | 39,193 (7.1%) | 39,581 (7.4%) |
| 65 to 69 Years | 35,143 (6.4%) | 37,168 (6.9%) |
| 70 to 74 Years | 29,225 (5.3%) | 28,007 (5.2%) |
| 75 to 79 Years | 18,659 (3.4%) | 19,730 (3.7%) |
| 80 to 84 Years | 10,525 (1.9%) | 11,916 (2.2%) |
| 85 Years and over | 7,964 (1.4%) | 13,164 (2.5%) |
| Total | 553,716 (100.0%) | 538,124 (100.0%) |
Families and Households in Montana
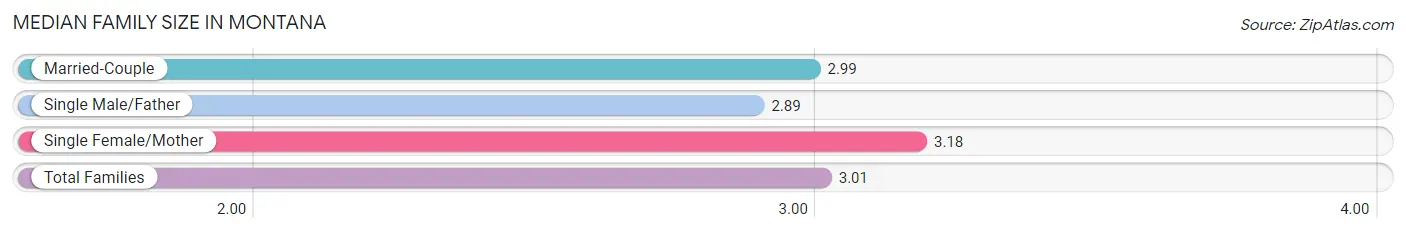
Median Family Size in Montana
The median family size in Montana is 3.01 persons per family, with single female/mother families (34,767 | 12.9%) accounting for the largest median family size of 3.18 persons per family. On the other hand, single male/father families (19,410 | 7.2%) represent the smallest median family size with 2.89 persons per family.
| Family Type | # Families | Family Size |
| Married-Couple | 216,250 (80.0%) | 2.99 |
| Single Male/Father | 19,410 (7.2%) | 2.89 |
| Single Female/Mother | 34,767 (12.9%) | 3.18 |
| Total Families | 270,427 (100.0%) | 3.01 |
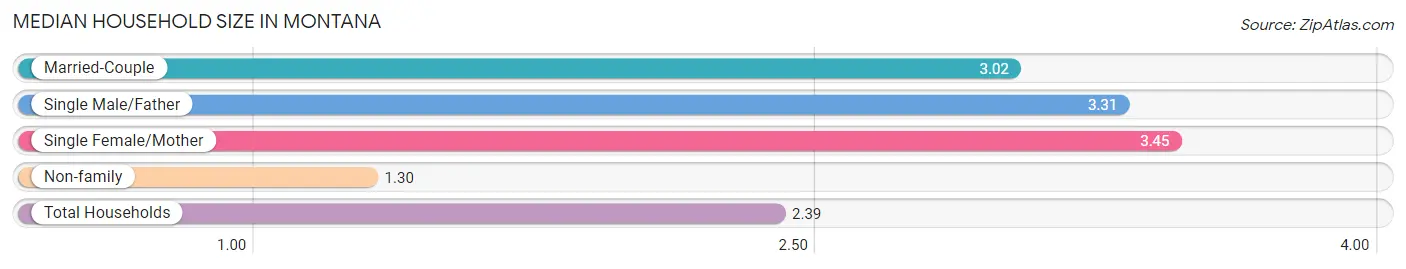
Median Household Size in Montana
The median household size in Montana is 2.39 persons per household, with single female/mother households (34,767 | 7.8%) accounting for the largest median household size of 3.45 persons per household. non-family households (173,490 | 39.1%) represent the smallest median household size with 1.30 persons per household.
| Household Type | # Households | Household Size |
| Married-Couple | 216,250 (48.7%) | 3.02 |
| Single Male/Father | 19,410 (4.4%) | 3.31 |
| Single Female/Mother | 34,767 (7.8%) | 3.45 |
| Non-family | 173,490 (39.1%) | 1.30 |
| Total Households | 443,917 (100.0%) | 2.39 |
Household Size by Marriage Status in Montana
Out of a total of 443,917 households in Montana, 270,427 (60.9%) are family households, while 173,490 (39.1%) are nonfamily households. The most numerous type of family households are 2-person households, comprising 141,404, and the most common type of nonfamily households are 1-person households, comprising 137,338.
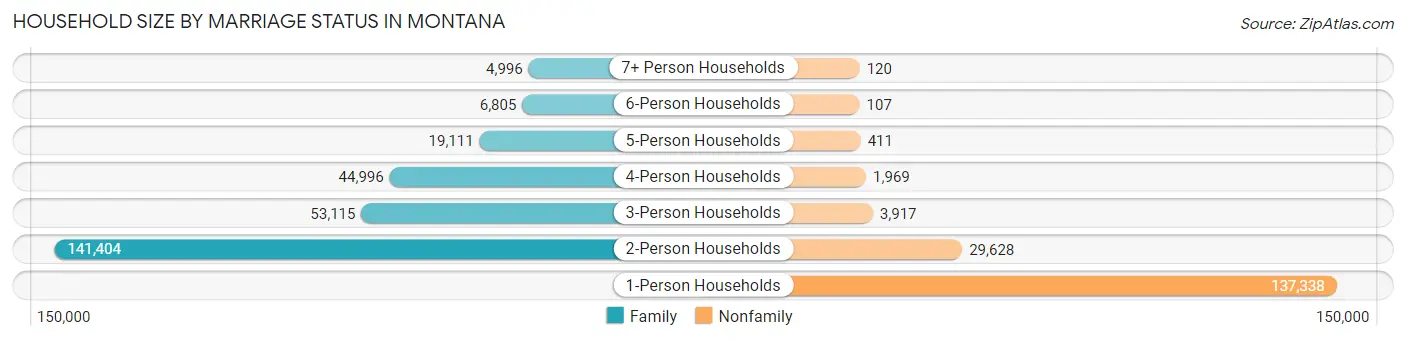
| Household Size | Family Households | Nonfamily Households |
| 1-Person Households | - | 137,338 (30.9%) |
| 2-Person Households | 141,404 (31.9%) | 29,628 (6.7%) |
| 3-Person Households | 53,115 (12.0%) | 3,917 (0.9%) |
| 4-Person Households | 44,996 (10.1%) | 1,969 (0.4%) |
| 5-Person Households | 19,111 (4.3%) | 411 (0.1%) |
| 6-Person Households | 6,805 (1.5%) | 107 (0.0%) |
| 7+ Person Households | 4,996 (1.1%) | 120 (0.0%) |
| Total | 270,427 (60.9%) | 173,490 (39.1%) |
Female Fertility in Montana
Fertility by Age in Montana
Average fertility rate in Montana is 55.0 births per 1,000 women. Women in the age bracket of 20 to 34 years have the highest fertility rate with 90.0 births per 1,000 women. Women in the age bracket of 20 to 34 years acount for 70.9% of all women with births.
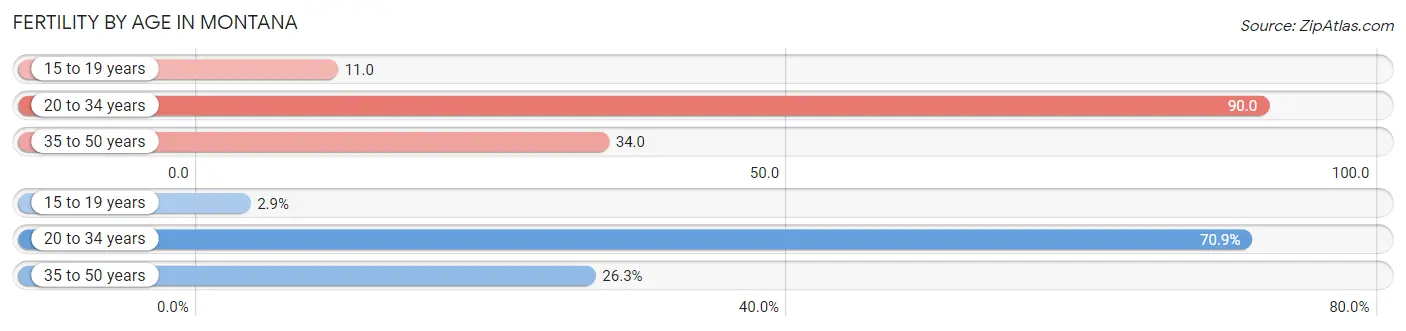
| Age Bracket | Women with Births | Births / 1,000 Women |
| 15 to 19 years | 372 (2.9%) | 11.0 |
| 20 to 34 years | 9,228 (70.9%) | 90.0 |
| 35 to 50 years | 3,424 (26.3%) | 34.0 |
| Total | 13,024 (100.0%) | 55.0 |
Fertility by Age by Marriage Status in Montana
74.4% of women with births (13,024) in Montana are married. The highest percentage of unmarried women with births falls into 15 to 19 years age bracket with 87.4% of them unmarried at the time of birth, while the lowest percentage of unmarried women with births belong to 35 to 50 years age bracket with 19.9% of them unmarried.
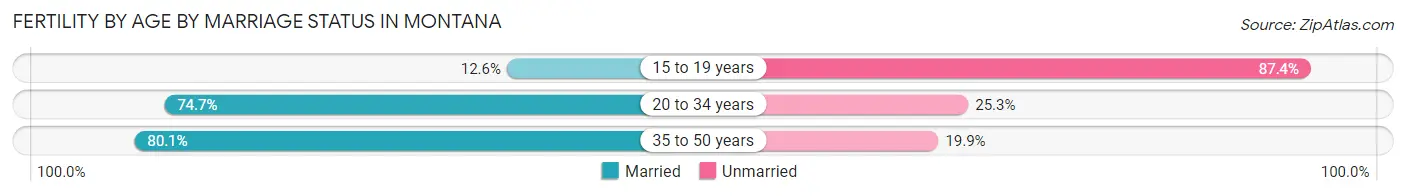
| Age Bracket | Married | Unmarried |
| 15 to 19 years | 47 (12.6%) | 325 (87.4%) |
| 20 to 34 years | 6,893 (74.7%) | 2,335 (25.3%) |
| 35 to 50 years | 2,743 (80.1%) | 681 (19.9%) |
| Total | 9,690 (74.4%) | 3,334 (25.6%) |
Fertility by Education in Montana
Average fertility rate in Montana is 55.0 births per 1,000 women. Women with the education attainment of graduate degree have the highest fertility rate of 63.0 births per 1,000 women, while women with the education attainment of less than high school have the lowest fertility at 37.0 births per 1,000 women. Women with the education attainment of college or associate's degree represent 32.0% of all women with births.
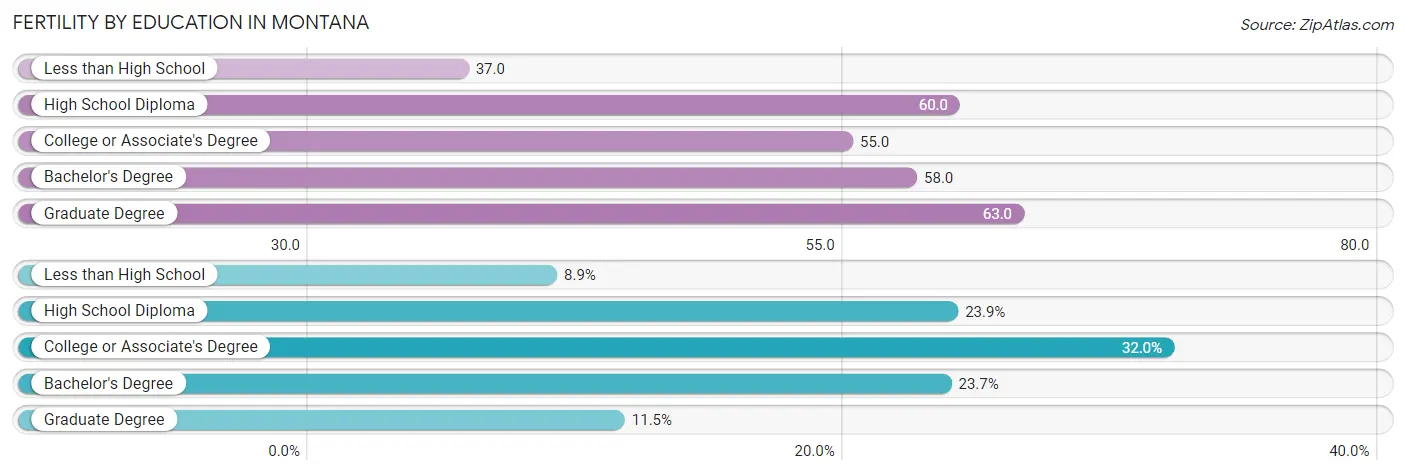
| Educational Attainment | Women with Births | Births / 1,000 Women |
| Less than High School | 1,160 (8.9%) | 37.0 |
| High School Diploma | 3,118 (23.9%) | 60.0 |
| College or Associate's Degree | 4,170 (32.0%) | 55.0 |
| Bachelor's Degree | 3,085 (23.7%) | 58.0 |
| Graduate Degree | 1,491 (11.5%) | 63.0 |
| Total | 13,024 (100.0%) | 55.0 |
Fertility by Education by Marriage Status in Montana
25.6% of women with births in Montana are unmarried. Women with the educational attainment of graduate degree are most likely to be married with 94.8% of them married at childbirth, while women with the educational attainment of less than high school are least likely to be married with 50.4% of them unmarried at childbirth.
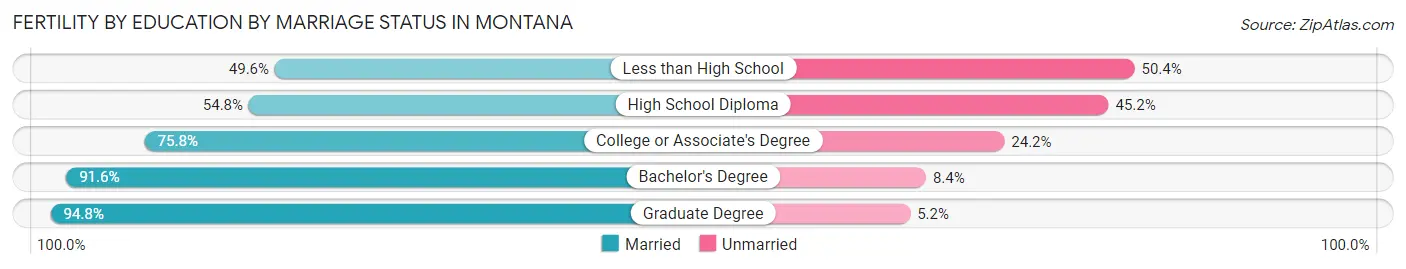
| Educational Attainment | Married | Unmarried |
| Less than High School | 575 (49.6%) | 585 (50.4%) |
| High School Diploma | 1,709 (54.8%) | 1,409 (45.2%) |
| College or Associate's Degree | 3,161 (75.8%) | 1,009 (24.2%) |
| Bachelor's Degree | 2,826 (91.6%) | 259 (8.4%) |
| Graduate Degree | 1,413 (94.8%) | 78 (5.2%) |
| Total | 9,690 (74.4%) | 3,334 (25.6%) |
Employment Characteristics in Montana
Employment by Class of Employer in Montana
Among the 526,969 employed individuals in Montana, private company employees (305,871 | 58.0%), not-for-profit organizations (51,949 | 9.9%), and self-employed (not incorporated) (46,271 | 8.8%) make up the most common classes of employment.
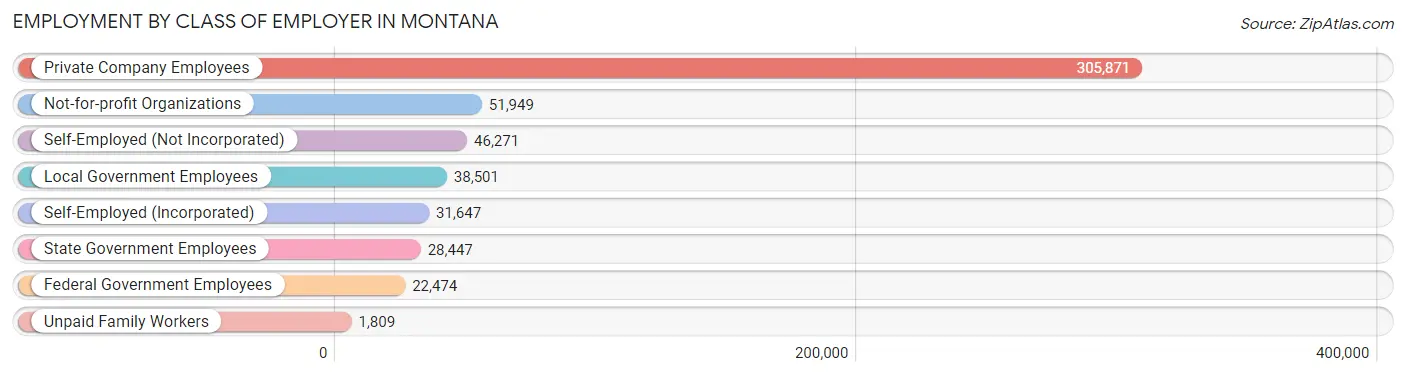
| Employer Class | # Employees | % Employees |
| Private Company Employees | 305,871 | 58.0% |
| Self-Employed (Incorporated) | 31,647 | 6.0% |
| Self-Employed (Not Incorporated) | 46,271 | 8.8% |
| Not-for-profit Organizations | 51,949 | 9.9% |
| Local Government Employees | 38,501 | 7.3% |
| State Government Employees | 28,447 | 5.4% |
| Federal Government Employees | 22,474 | 4.3% |
| Unpaid Family Workers | 1,809 | 0.3% |
| Total | 526,969 | 100.0% |
Employment Status by Age in Montana
According to the labor force statistics for Montana, out of the total population over 16 years of age (887,607), 63.0% or 559,192 individuals are in the labor force, with 3.9% or 21,808 of them unemployed. The age group with the highest labor force participation rate is 30 to 34 years, with 84.8% or 58,922 individuals in the labor force. Within the labor force, the 16 to 19 years age range has the highest percentage of unemployed individuals, with 12.6% or 3,384 of them being unemployed.
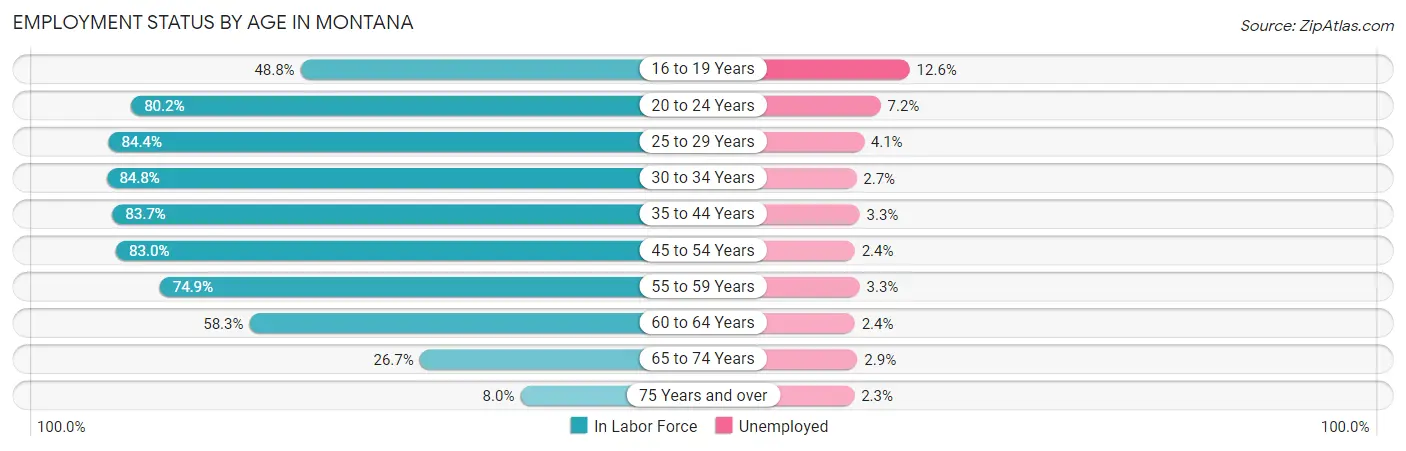
| Age Bracket | In Labor Force | Unemployed |
| 16 to 19 Years | 26,857 (48.8%) | 3,384 (12.6%) |
| 20 to 24 Years | 59,647 (80.2%) | 4,295 (7.2%) |
| 25 to 29 Years | 59,646 (84.4%) | 2,445 (4.1%) |
| 30 to 34 Years | 58,922 (84.8%) | 1,591 (2.7%) |
| 35 to 44 Years | 114,135 (83.7%) | 3,766 (3.3%) |
| 45 to 54 Years | 100,594 (83.0%) | 2,414 (2.4%) |
| 55 to 59 Years | 52,588 (74.9%) | 1,735 (3.3%) |
| 60 to 64 Years | 45,925 (58.3%) | 1,102 (2.4%) |
| 65 to 74 Years | 34,588 (26.7%) | 1,003 (2.9%) |
| 75 Years and over | 6,557 (8.0%) | 151 (2.3%) |
| Total | 559,192 (63.0%) | 21,808 (3.9%) |
Employment Status by Educational Attainment in Montana
According to labor force statistics for Montana, 79.0% of individuals (431,892) out of the total population between 25 and 64 years of age (546,699) are in the labor force, with 3.0% or 12,957 of them being unemployed. The group with the highest labor force participation rate are those with the educational attainment of bachelor's degree or higher, with 86.3% or 164,305 individuals in the labor force. Within the labor force, individuals with less than high school education have the highest percentage of unemployment, with 9.6% or 1,627 of them being unemployed.
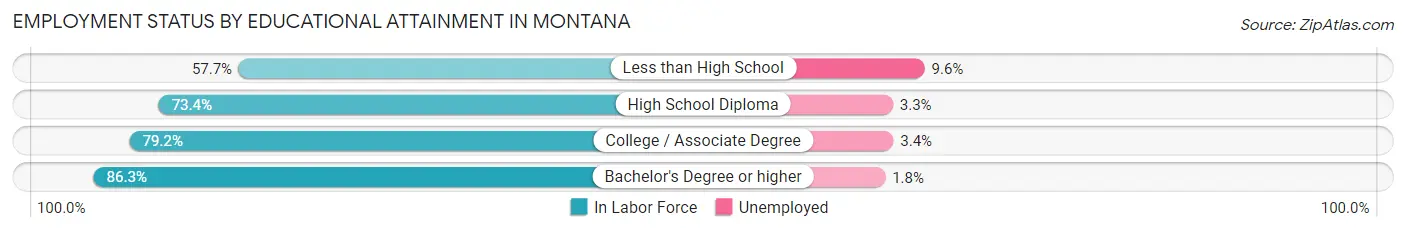
| Educational Attainment | In Labor Force | Unemployed |
| Less than High School | 16,949 (57.7%) | 2,820 (9.6%) |
| High School Diploma | 107,903 (73.4%) | 4,851 (3.3%) |
| College / Associate Degree | 142,504 (79.2%) | 6,118 (3.4%) |
| Bachelor's Degree or higher | 164,305 (86.3%) | 3,427 (1.8%) |
| Total | 431,892 (79.0%) | 16,401 (3.0%) |
Employment Occupations by Sex in Montana
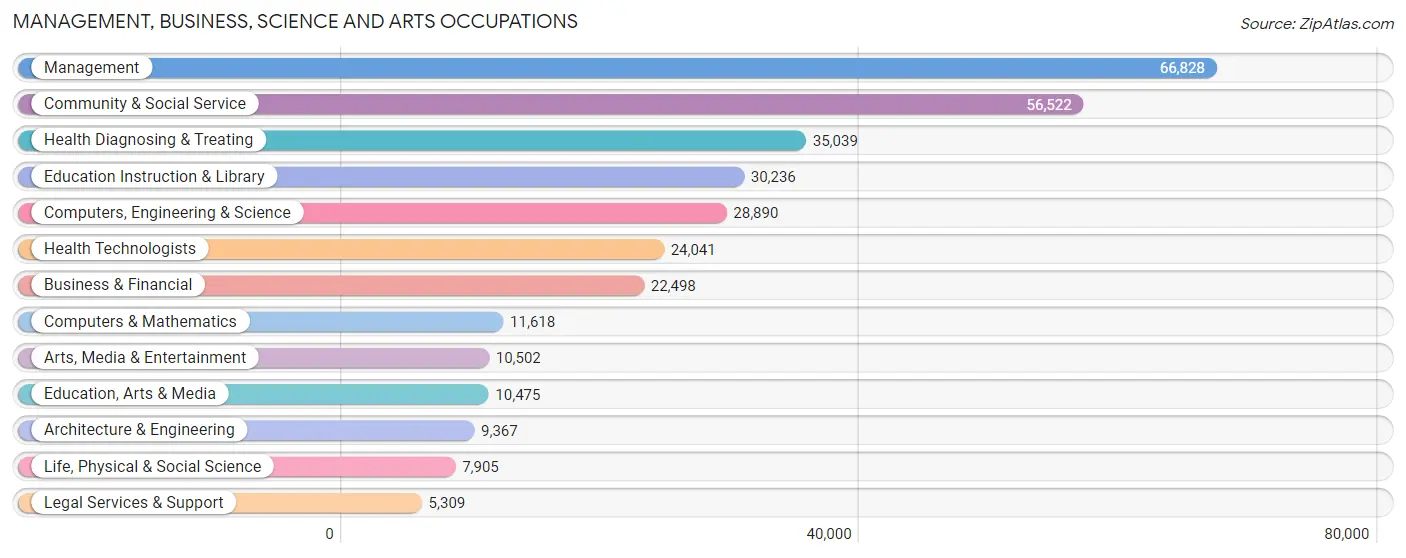
Management, Business, Science and Arts Occupations
The most common Management, Business, Science and Arts occupations in Montana are Management (66,828 | 12.5%), Community & Social Service (56,522 | 10.6%), Health Diagnosing & Treating (35,039 | 6.6%), Education Instruction & Library (30,236 | 5.7%), and Computers, Engineering & Science (28,890 | 5.4%).
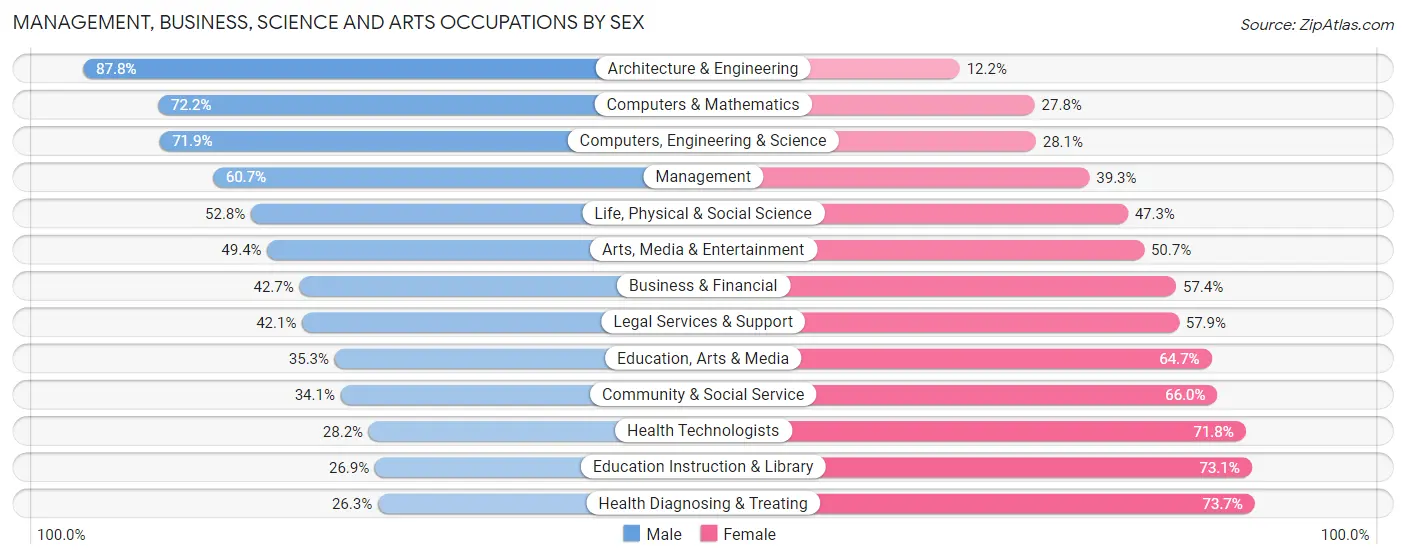
Management, Business, Science and Arts Occupations by Sex
Within the Management, Business, Science and Arts occupations in Montana, the most male-oriented occupations are Architecture & Engineering (87.8%), Computers & Mathematics (72.2%), and Computers, Engineering & Science (71.9%), while the most female-oriented occupations are Health Diagnosing & Treating (73.7%), Education Instruction & Library (73.1%), and Health Technologists (71.8%).
| Occupation | Male | Female |
| Management | 40,591 (60.7%) | 26,237 (39.3%) |
| Business & Financial | 9,596 (42.6%) | 12,902 (57.4%) |
| Computers, Engineering & Science | 20,775 (71.9%) | 8,115 (28.1%) |
| Computers & Mathematics | 8,383 (72.2%) | 3,235 (27.8%) |
| Architecture & Engineering | 8,222 (87.8%) | 1,145 (12.2%) |
| Life, Physical & Social Science | 4,170 (52.7%) | 3,735 (47.2%) |
| Community & Social Service | 19,246 (34.1%) | 37,276 (65.9%) |
| Education, Arts & Media | 3,696 (35.3%) | 6,779 (64.7%) |
| Legal Services & Support | 2,234 (42.1%) | 3,075 (57.9%) |
| Education Instruction & Library | 8,133 (26.9%) | 22,103 (73.1%) |
| Arts, Media & Entertainment | 5,183 (49.3%) | 5,319 (50.6%) |
| Health Diagnosing & Treating | 9,210 (26.3%) | 25,829 (73.7%) |
| Health Technologists | 6,772 (28.2%) | 17,269 (71.8%) |
| Total (Category) | 99,418 (47.4%) | 110,359 (52.6%) |
| Total (Overall) | 283,823 (53.1%) | 250,284 (46.9%) |
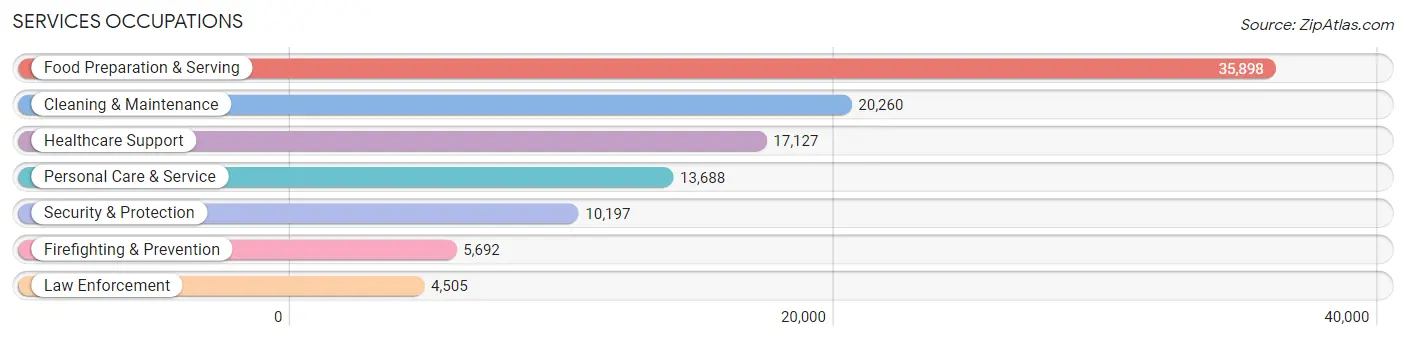
Services Occupations
The most common Services occupations in Montana are Food Preparation & Serving (35,898 | 6.7%), Cleaning & Maintenance (20,260 | 3.8%), Healthcare Support (17,127 | 3.2%), Personal Care & Service (13,688 | 2.6%), and Security & Protection (10,197 | 1.9%).
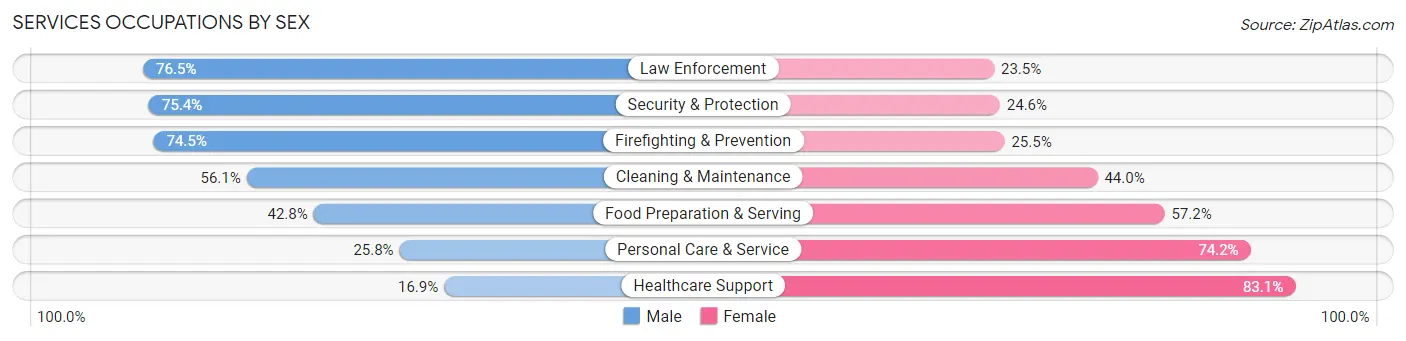
Services Occupations by Sex
Within the Services occupations in Montana, the most male-oriented occupations are Law Enforcement (76.5%), Security & Protection (75.4%), and Firefighting & Prevention (74.5%), while the most female-oriented occupations are Healthcare Support (83.1%), Personal Care & Service (74.2%), and Food Preparation & Serving (57.2%).
| Occupation | Male | Female |
| Healthcare Support | 2,902 (16.9%) | 14,225 (83.1%) |
| Security & Protection | 7,687 (75.4%) | 2,510 (24.6%) |
| Firefighting & Prevention | 4,239 (74.5%) | 1,453 (25.5%) |
| Law Enforcement | 3,448 (76.5%) | 1,057 (23.5%) |
| Food Preparation & Serving | 15,356 (42.8%) | 20,542 (57.2%) |
| Cleaning & Maintenance | 11,355 (56.0%) | 8,905 (44.0%) |
| Personal Care & Service | 3,527 (25.8%) | 10,161 (74.2%) |
| Total (Category) | 40,827 (42.0%) | 56,343 (58.0%) |
| Total (Overall) | 283,823 (53.1%) | 250,284 (46.9%) |
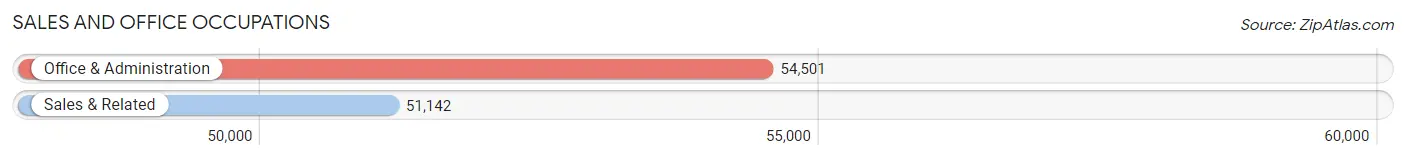
Sales and Office Occupations
The most common Sales and Office occupations in Montana are Office & Administration (54,501 | 10.2%), and Sales & Related (51,142 | 9.6%).
Sales and Office Occupations by Sex
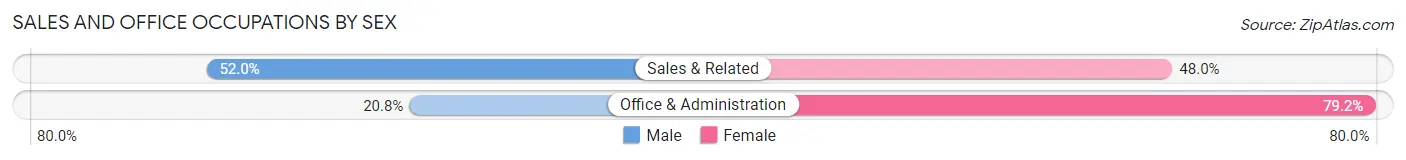
| Occupation | Male | Female |
| Sales & Related | 26,602 (52.0%) | 24,540 (48.0%) |
| Office & Administration | 11,350 (20.8%) | 43,151 (79.2%) |
| Total (Category) | 37,952 (35.9%) | 67,691 (64.1%) |
| Total (Overall) | 283,823 (53.1%) | 250,284 (46.9%) |
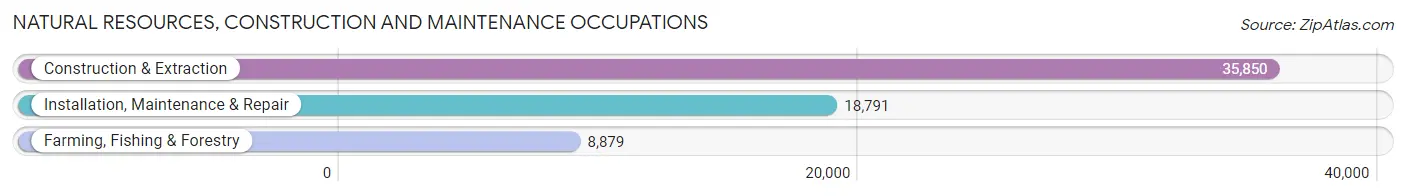
Natural Resources, Construction and Maintenance Occupations
The most common Natural Resources, Construction and Maintenance occupations in Montana are Construction & Extraction (35,850 | 6.7%), Installation, Maintenance & Repair (18,791 | 3.5%), and Farming, Fishing & Forestry (8,879 | 1.7%).
Natural Resources, Construction and Maintenance Occupations by Sex
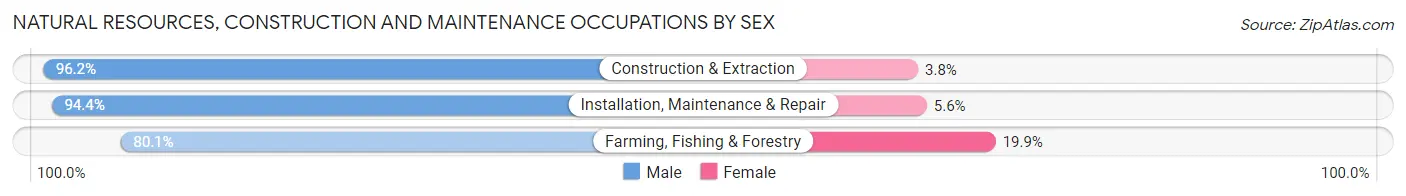
| Occupation | Male | Female |
| Farming, Fishing & Forestry | 7,109 (80.1%) | 1,770 (19.9%) |
| Construction & Extraction | 34,492 (96.2%) | 1,358 (3.8%) |
| Installation, Maintenance & Repair | 17,738 (94.4%) | 1,053 (5.6%) |
| Total (Category) | 59,339 (93.4%) | 4,181 (6.6%) |
| Total (Overall) | 283,823 (53.1%) | 250,284 (46.9%) |
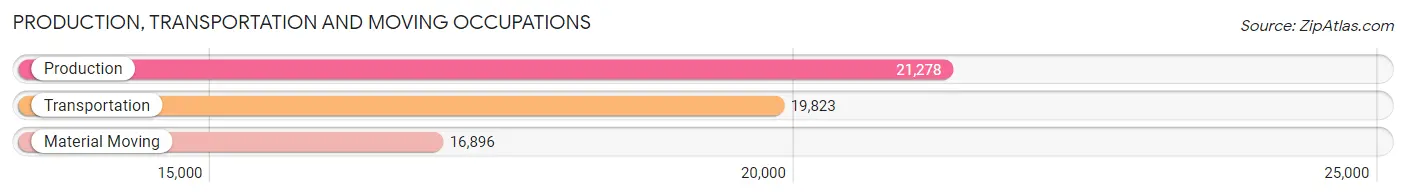
Production, Transportation and Moving Occupations
The most common Production, Transportation and Moving occupations in Montana are Production (21,278 | 4.0%), Transportation (19,823 | 3.7%), and Material Moving (16,896 | 3.2%).
Production, Transportation and Moving Occupations by Sex
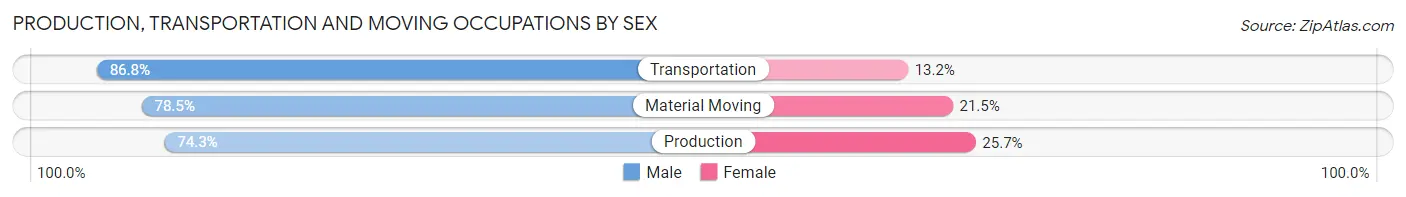
| Occupation | Male | Female |
| Production | 15,819 (74.3%) | 5,459 (25.7%) |
| Transportation | 17,199 (86.8%) | 2,624 (13.2%) |
| Material Moving | 13,269 (78.5%) | 3,627 (21.5%) |
| Total (Category) | 46,287 (79.8%) | 11,710 (20.2%) |
| Total (Overall) | 283,823 (53.1%) | 250,284 (46.9%) |
Employment Industries by Sex in Montana
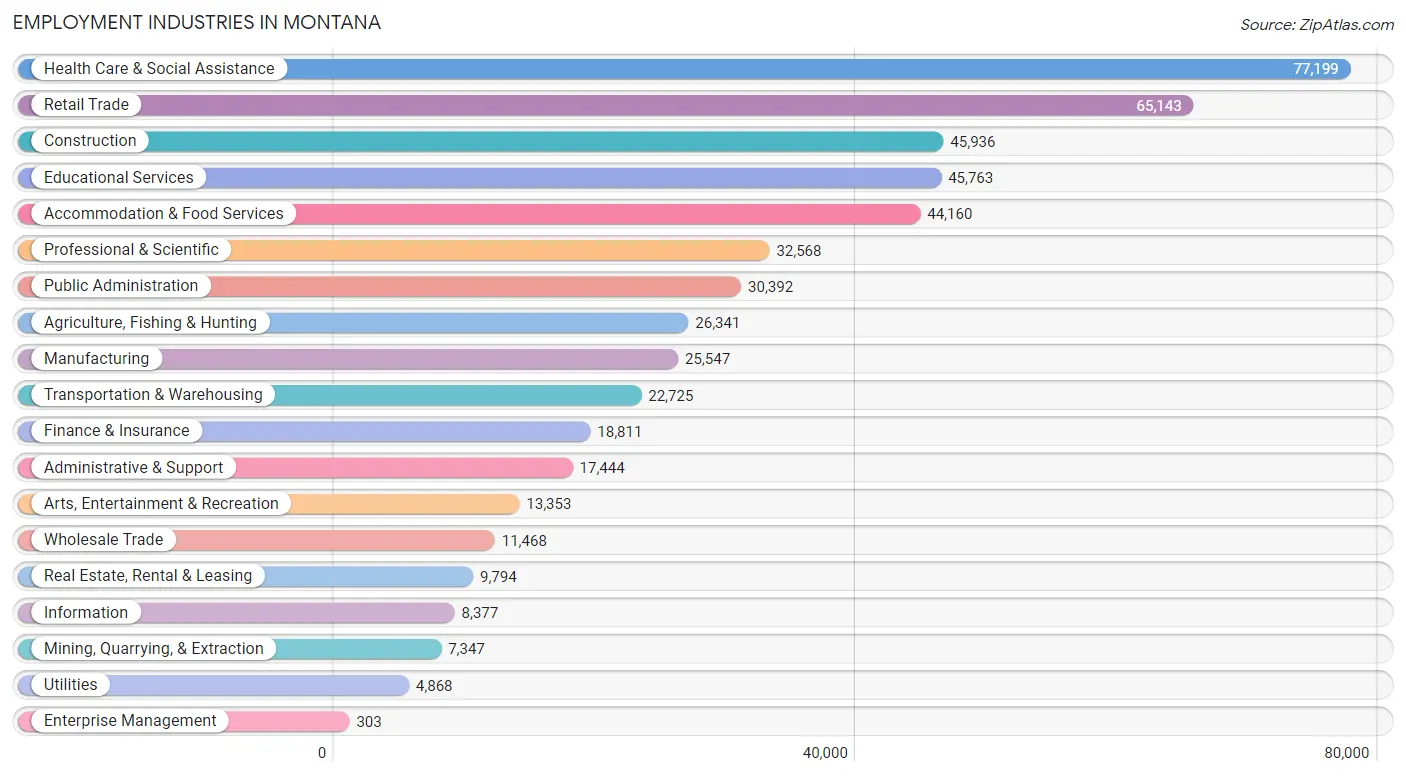
Employment Industries in Montana
The major employment industries in Montana include Health Care & Social Assistance (77,199 | 14.4%), Retail Trade (65,143 | 12.2%), Construction (45,936 | 8.6%), Educational Services (45,763 | 8.6%), and Accommodation & Food Services (44,160 | 8.3%).
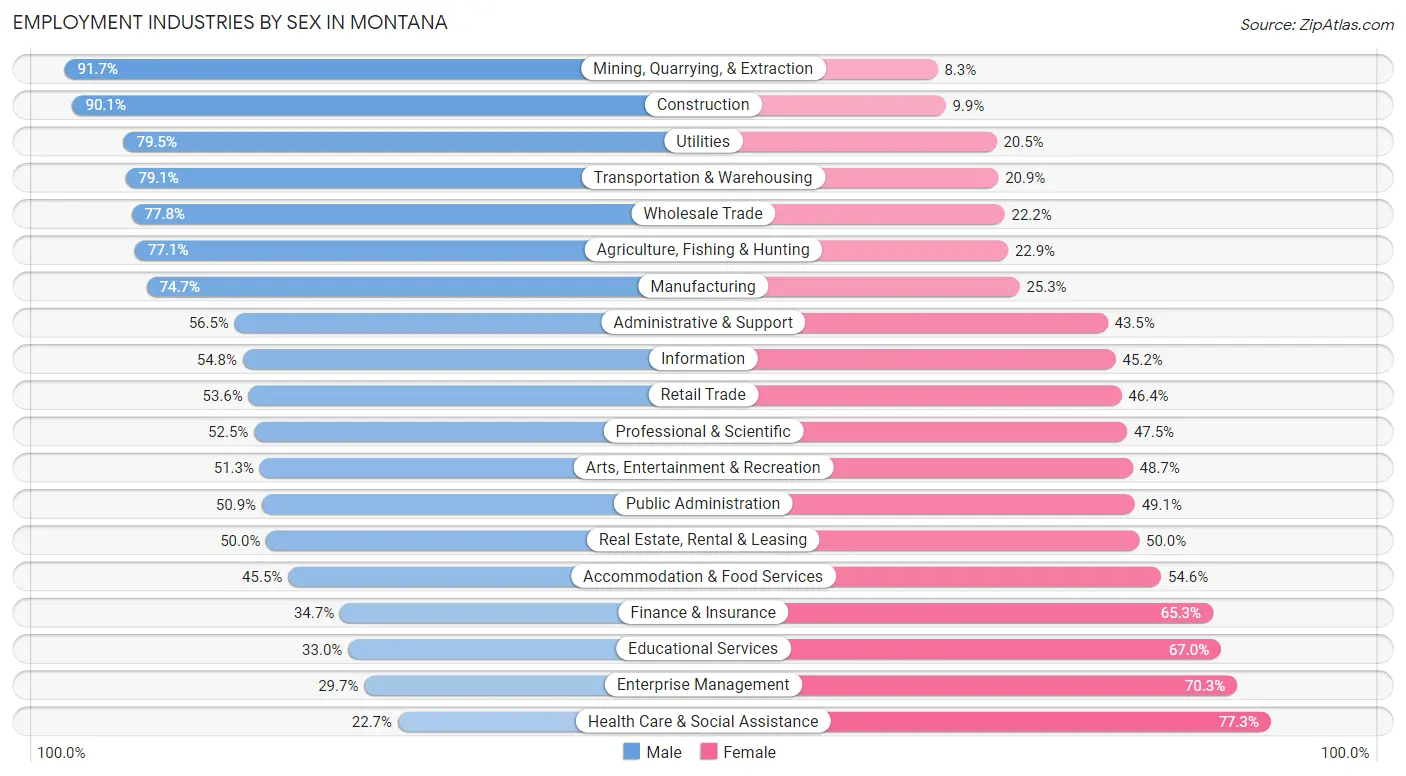
Employment Industries by Sex in Montana
The Montana industries that see more men than women are Mining, Quarrying, & Extraction (91.7%), Construction (90.1%), and Utilities (79.5%), whereas the industries that tend to have a higher number of women are Health Care & Social Assistance (77.3%), Enterprise Management (70.3%), and Educational Services (67.0%).
| Industry | Male | Female |
| Agriculture, Fishing & Hunting | 20,314 (77.1%) | 6,027 (22.9%) |
| Mining, Quarrying, & Extraction | 6,739 (91.7%) | 608 (8.3%) |
| Construction | 41,371 (90.1%) | 4,565 (9.9%) |
| Manufacturing | 19,095 (74.7%) | 6,452 (25.3%) |
| Wholesale Trade | 8,926 (77.8%) | 2,542 (22.2%) |
| Retail Trade | 34,945 (53.6%) | 30,198 (46.4%) |
| Transportation & Warehousing | 17,984 (79.1%) | 4,741 (20.9%) |
| Utilities | 3,870 (79.5%) | 998 (20.5%) |
| Information | 4,593 (54.8%) | 3,784 (45.2%) |
| Finance & Insurance | 6,532 (34.7%) | 12,279 (65.3%) |
| Real Estate, Rental & Leasing | 4,895 (50.0%) | 4,899 (50.0%) |
| Professional & Scientific | 17,095 (52.5%) | 15,473 (47.5%) |
| Enterprise Management | 90 (29.7%) | 213 (70.3%) |
| Administrative & Support | 9,857 (56.5%) | 7,587 (43.5%) |
| Educational Services | 15,115 (33.0%) | 30,648 (67.0%) |
| Health Care & Social Assistance | 17,552 (22.7%) | 59,647 (77.3%) |
| Arts, Entertainment & Recreation | 6,853 (51.3%) | 6,500 (48.7%) |
| Accommodation & Food Services | 20,072 (45.5%) | 24,088 (54.5%) |
| Public Administration | 15,462 (50.9%) | 14,930 (49.1%) |
| Total | 283,823 (53.1%) | 250,284 (46.9%) |
Education in Montana
School Enrollment in Montana
The most common levels of schooling among the 241,030 students in Montana are middle school (52,836 | 21.9%), high school (50,682 | 21.0%), and elementary school (49,934 | 20.7%).
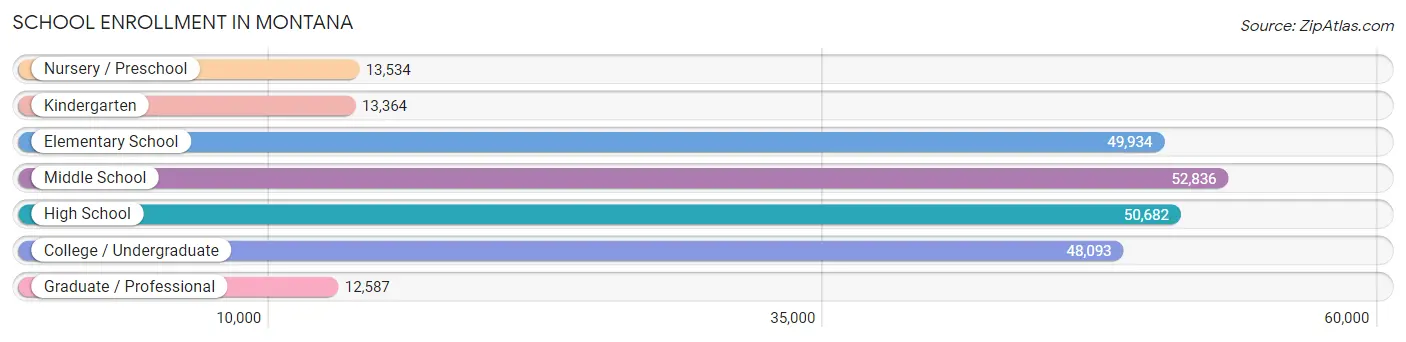
| School Level | # Students | % Students |
| Nursery / Preschool | 13,534 | 5.6% |
| Kindergarten | 13,364 | 5.5% |
| Elementary School | 49,934 | 20.7% |
| Middle School | 52,836 | 21.9% |
| High School | 50,682 | 21.0% |
| College / Undergraduate | 48,093 | 20.0% |
| Graduate / Professional | 12,587 | 5.2% |
| Total | 241,030 | 100.0% |
School Enrollment by Age by Funding Source in Montana
Out of a total of 241,030 students who are enrolled in schools in Montana, 35,672 (14.8%) attend a private institution, while the remaining 205,358 (85.2%) are enrolled in public schools. The age group of 3 to 4 year olds has the highest likelihood of being enrolled in private schools, with 4,739 (47.8% in the age bracket) enrolled. Conversely, the age group of 15 to 17 year olds has the lowest likelihood of being enrolled in a private school, with 34,060 (90.1% in the age bracket) attending a public institution.
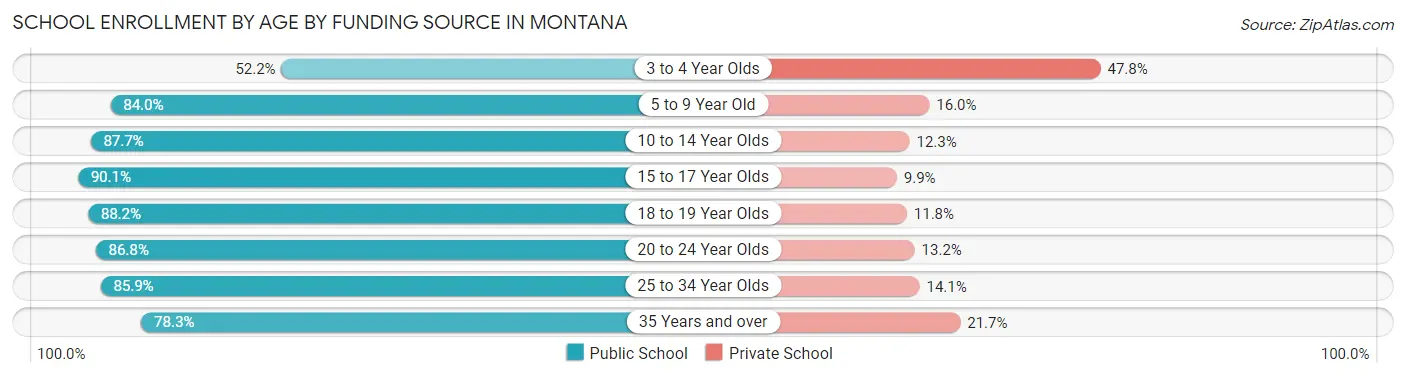
| Age Bracket | Public School | Private School |
| 3 to 4 Year Olds | 5,166 (52.2%) | 4,739 (47.8%) |
| 5 to 9 Year Old | 48,953 (84.0%) | 9,296 (16.0%) |
| 10 to 14 Year Olds | 58,100 (87.7%) | 8,128 (12.3%) |
| 15 to 17 Year Olds | 34,060 (90.1%) | 3,742 (9.9%) |
| 18 to 19 Year Olds | 16,379 (88.2%) | 2,185 (11.8%) |
| 20 to 24 Year Olds | 22,550 (86.8%) | 3,436 (13.2%) |
| 25 to 34 Year Olds | 11,514 (85.9%) | 1,895 (14.1%) |
| 35 Years and over | 8,522 (78.3%) | 2,365 (21.7%) |
| Total | 205,358 (85.2%) | 35,672 (14.8%) |
Educational Attainment by Field of Study in Montana
Business (43,753 | 15.4%), education (43,124 | 15.2%), bio, nature & agricultural (31,848 | 11.2%), science & technology (31,347 | 11.0%), and social sciences (20,184 | 7.1%) are the most common fields of study among 284,413 individuals in Montana who have obtained a bachelor's degree or higher.
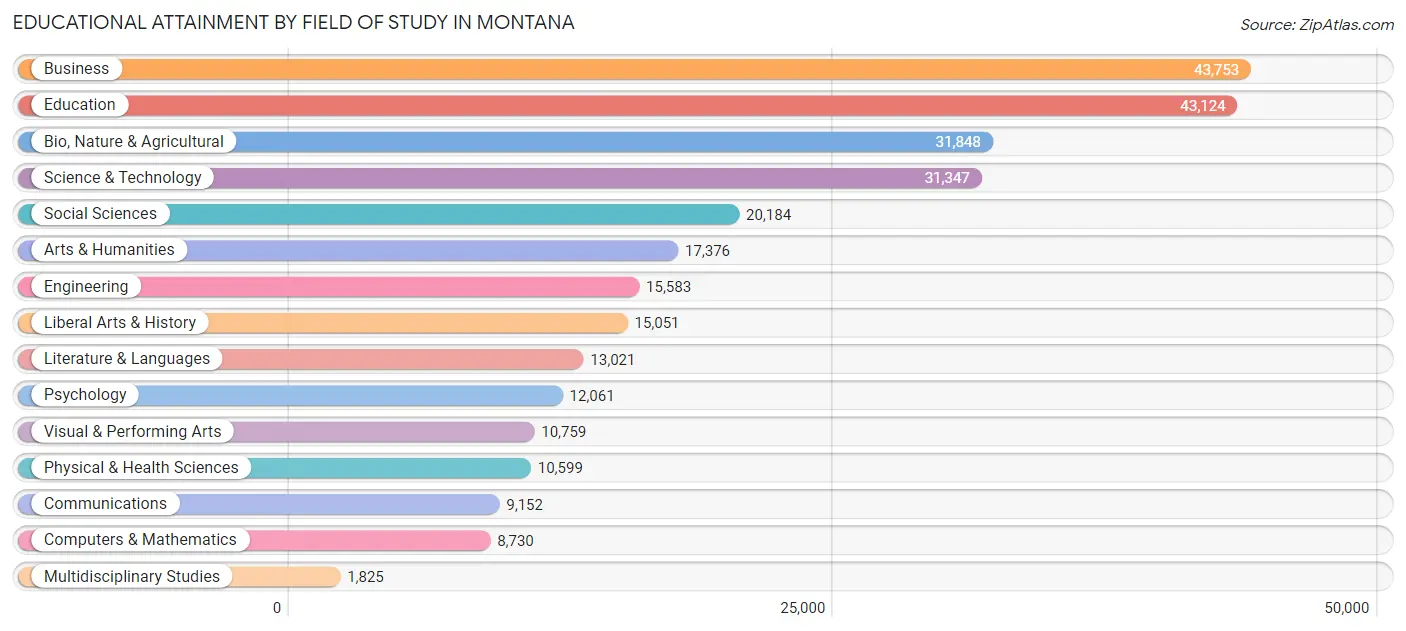
| Field of Study | # Graduates | % Graduates |
| Computers & Mathematics | 8,730 | 3.1% |
| Bio, Nature & Agricultural | 31,848 | 11.2% |
| Physical & Health Sciences | 10,599 | 3.7% |
| Psychology | 12,061 | 4.2% |
| Social Sciences | 20,184 | 7.1% |
| Engineering | 15,583 | 5.5% |
| Multidisciplinary Studies | 1,825 | 0.6% |
| Science & Technology | 31,347 | 11.0% |
| Business | 43,753 | 15.4% |
| Education | 43,124 | 15.2% |
| Literature & Languages | 13,021 | 4.6% |
| Liberal Arts & History | 15,051 | 5.3% |
| Visual & Performing Arts | 10,759 | 3.8% |
| Communications | 9,152 | 3.2% |
| Arts & Humanities | 17,376 | 6.1% |
| Total | 284,413 | 100.0% |
Transportation & Commute in Montana
Vehicle Availability by Sex in Montana
The most prevalent vehicle ownership categories in Montana are males with 2 vehicles (104,401, accounting for 37.7%) and females with 2 vehicles (90,777, making up 43.1%).
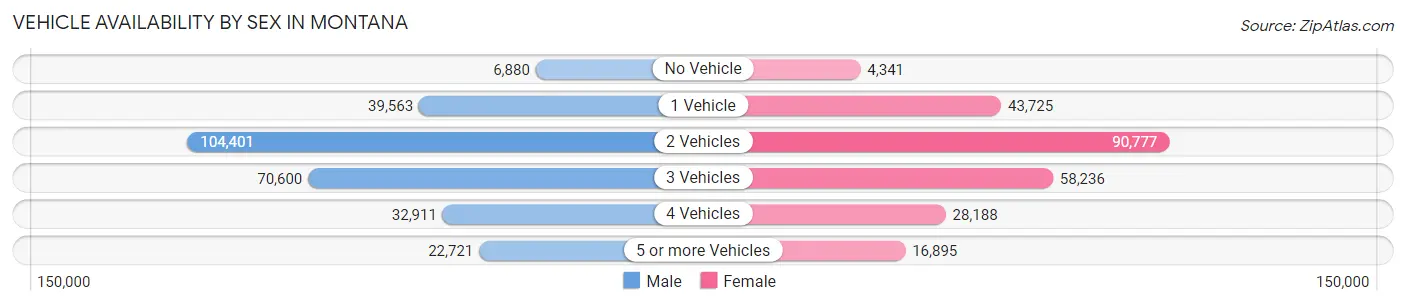
| Vehicles Available | Male | Female |
| No Vehicle | 6,880 (2.5%) | 4,341 (1.8%) |
| 1 Vehicle | 39,563 (14.3%) | 43,725 (18.1%) |
| 2 Vehicles | 104,401 (37.7%) | 90,777 (37.5%) |
| 3 Vehicles | 70,600 (25.5%) | 58,236 (24.0%) |
| 4 Vehicles | 32,911 (11.9%) | 28,188 (11.6%) |
| 5 or more Vehicles | 22,721 (8.2%) | 16,895 (7.0%) |
| Total | 277,076 (100.0%) | 242,162 (100.0%) |
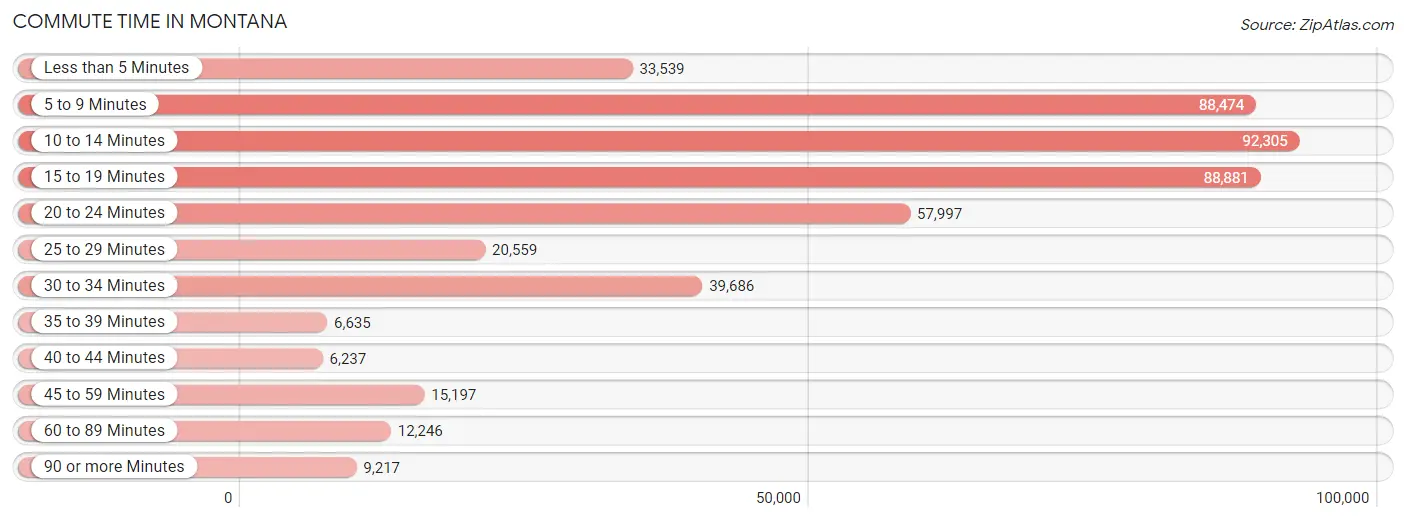
Commute Time in Montana
The most frequently occuring commute durations in Montana are 10 to 14 minutes (92,305 commuters, 19.6%), 15 to 19 minutes (88,881 commuters, 18.9%), and 5 to 9 minutes (88,474 commuters, 18.8%).
| Commute Time | # Commuters | % Commuters |
| Less than 5 Minutes | 33,539 | 7.1% |
| 5 to 9 Minutes | 88,474 | 18.8% |
| 10 to 14 Minutes | 92,305 | 19.6% |
| 15 to 19 Minutes | 88,881 | 18.9% |
| 20 to 24 Minutes | 57,997 | 12.3% |
| 25 to 29 Minutes | 20,559 | 4.4% |
| 30 to 34 Minutes | 39,686 | 8.4% |
| 35 to 39 Minutes | 6,635 | 1.4% |
| 40 to 44 Minutes | 6,237 | 1.3% |
| 45 to 59 Minutes | 15,197 | 3.2% |
| 60 to 89 Minutes | 12,246 | 2.6% |
| 90 or more Minutes | 9,217 | 2.0% |
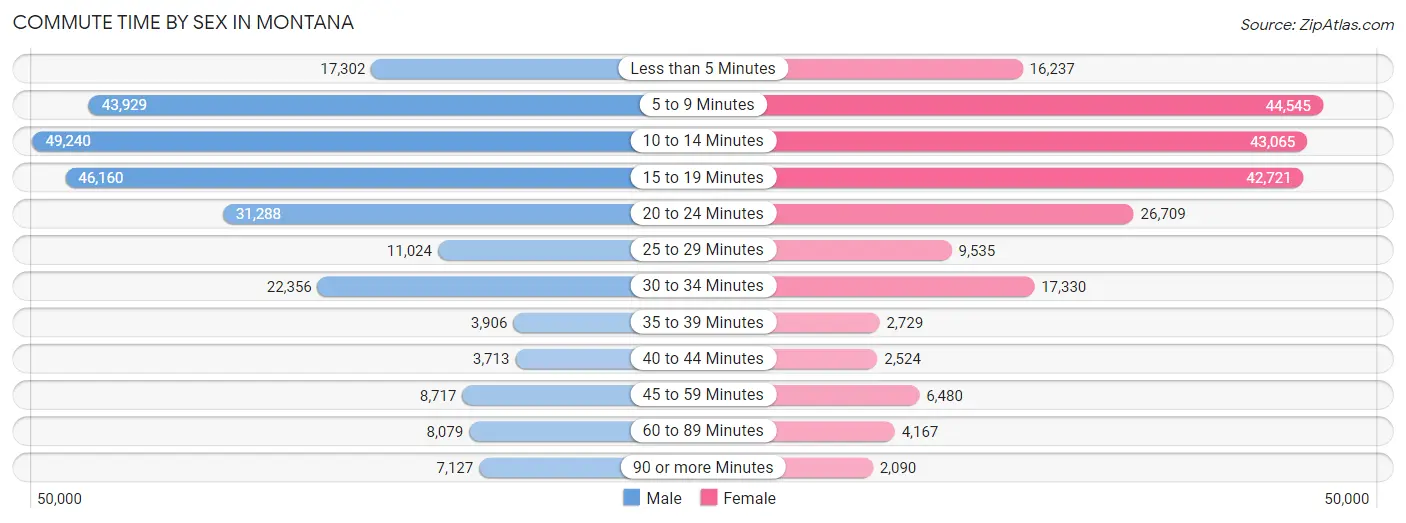
Commute Time by Sex in Montana
The most common commute times in Montana are 10 to 14 minutes (49,240 commuters, 19.5%) for males and 5 to 9 minutes (44,545 commuters, 20.4%) for females.
| Commute Time | Male | Female |
| Less than 5 Minutes | 17,302 (6.8%) | 16,237 (7.4%) |
| 5 to 9 Minutes | 43,929 (17.4%) | 44,545 (20.4%) |
| 10 to 14 Minutes | 49,240 (19.5%) | 43,065 (19.7%) |
| 15 to 19 Minutes | 46,160 (18.3%) | 42,721 (19.6%) |
| 20 to 24 Minutes | 31,288 (12.4%) | 26,709 (12.2%) |
| 25 to 29 Minutes | 11,024 (4.4%) | 9,535 (4.4%) |
| 30 to 34 Minutes | 22,356 (8.8%) | 17,330 (7.9%) |
| 35 to 39 Minutes | 3,906 (1.5%) | 2,729 (1.3%) |
| 40 to 44 Minutes | 3,713 (1.5%) | 2,524 (1.2%) |
| 45 to 59 Minutes | 8,717 (3.5%) | 6,480 (3.0%) |
| 60 to 89 Minutes | 8,079 (3.2%) | 4,167 (1.9%) |
| 90 or more Minutes | 7,127 (2.8%) | 2,090 (1.0%) |
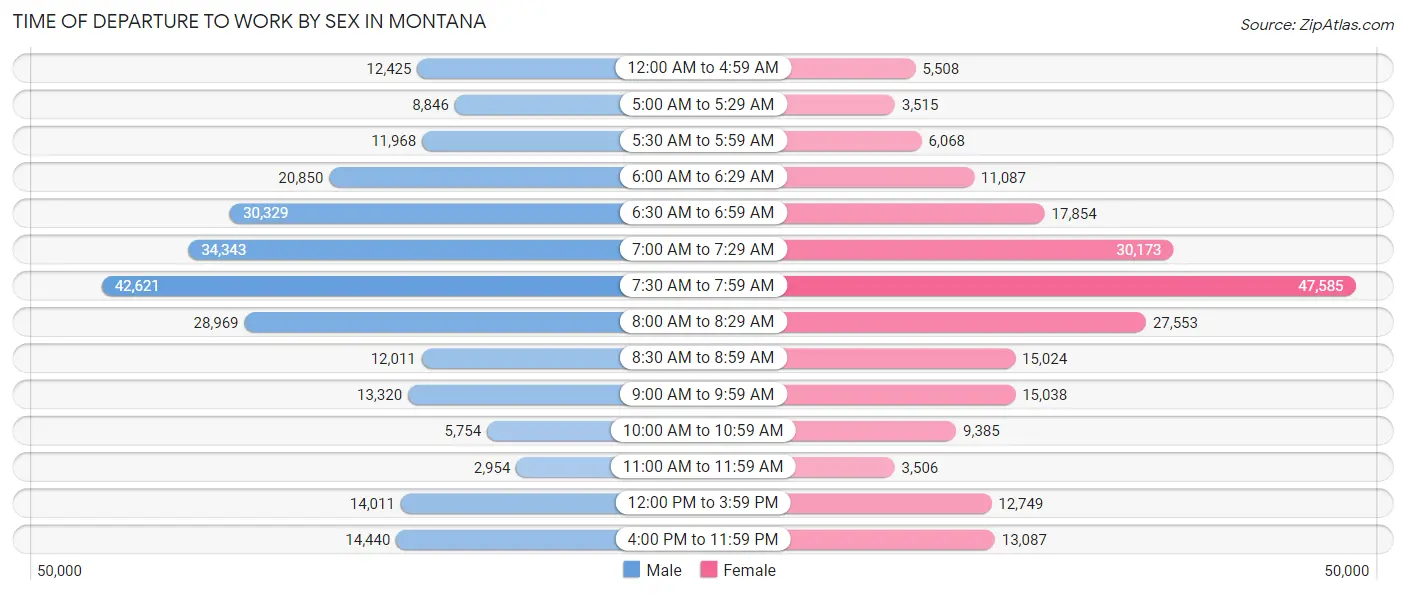
Time of Departure to Work by Sex in Montana
The most frequent times of departure to work in Montana are 7:30 AM to 7:59 AM (42,621, 16.9%) for males and 7:30 AM to 7:59 AM (47,585, 21.8%) for females.
| Time of Departure | Male | Female |
| 12:00 AM to 4:59 AM | 12,425 (4.9%) | 5,508 (2.5%) |
| 5:00 AM to 5:29 AM | 8,846 (3.5%) | 3,515 (1.6%) |
| 5:30 AM to 5:59 AM | 11,968 (4.7%) | 6,068 (2.8%) |
| 6:00 AM to 6:29 AM | 20,850 (8.3%) | 11,087 (5.1%) |
| 6:30 AM to 6:59 AM | 30,329 (12.0%) | 17,854 (8.2%) |
| 7:00 AM to 7:29 AM | 34,343 (13.6%) | 30,173 (13.8%) |
| 7:30 AM to 7:59 AM | 42,621 (16.9%) | 47,585 (21.8%) |
| 8:00 AM to 8:29 AM | 28,969 (11.5%) | 27,553 (12.6%) |
| 8:30 AM to 8:59 AM | 12,011 (4.8%) | 15,024 (6.9%) |
| 9:00 AM to 9:59 AM | 13,320 (5.3%) | 15,038 (6.9%) |
| 10:00 AM to 10:59 AM | 5,754 (2.3%) | 9,385 (4.3%) |
| 11:00 AM to 11:59 AM | 2,954 (1.2%) | 3,506 (1.6%) |
| 12:00 PM to 3:59 PM | 14,011 (5.5%) | 12,749 (5.8%) |
| 4:00 PM to 11:59 PM | 14,440 (5.7%) | 13,087 (6.0%) |
| Total | 252,841 (100.0%) | 218,132 (100.0%) |
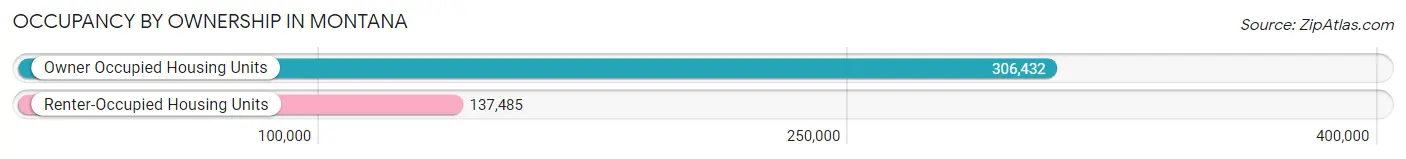
Housing Occupancy in Montana
Occupancy by Ownership in Montana
Of the total 443,917 dwellings in Montana, owner-occupied units account for 306,432 (69.0%), while renter-occupied units make up 137,485 (31.0%).
| Occupancy | # Housing Units | % Housing Units |
| Owner Occupied Housing Units | 306,432 | 69.0% |
| Renter-Occupied Housing Units | 137,485 | 31.0% |
| Total Occupied Housing Units | 443,917 | 100.0% |
Occupancy by Household Size in Montana
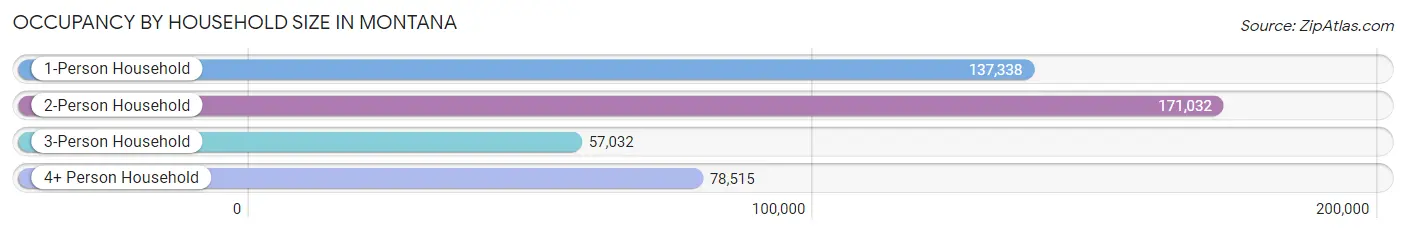
| Household Size | # Housing Units | % Housing Units |
| 1-Person Household | 137,338 | 30.9% |
| 2-Person Household | 171,032 | 38.5% |
| 3-Person Household | 57,032 | 12.9% |
| 4+ Person Household | 78,515 | 17.7% |
| Total Housing Units | 443,917 | 100.0% |
Occupancy by Ownership by Household Size in Montana
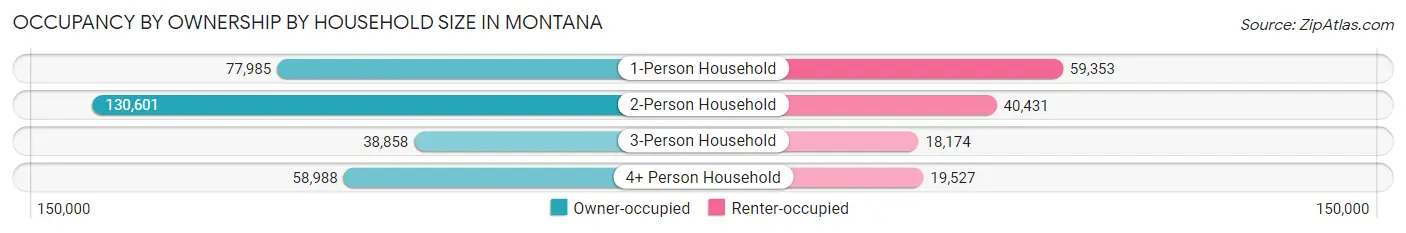
| Household Size | Owner-occupied | Renter-occupied |
| 1-Person Household | 77,985 (56.8%) | 59,353 (43.2%) |
| 2-Person Household | 130,601 (76.4%) | 40,431 (23.6%) |
| 3-Person Household | 38,858 (68.1%) | 18,174 (31.9%) |
| 4+ Person Household | 58,988 (75.1%) | 19,527 (24.9%) |
| Total Housing Units | 306,432 (69.0%) | 137,485 (31.0%) |
Occupancy by Educational Attainment in Montana
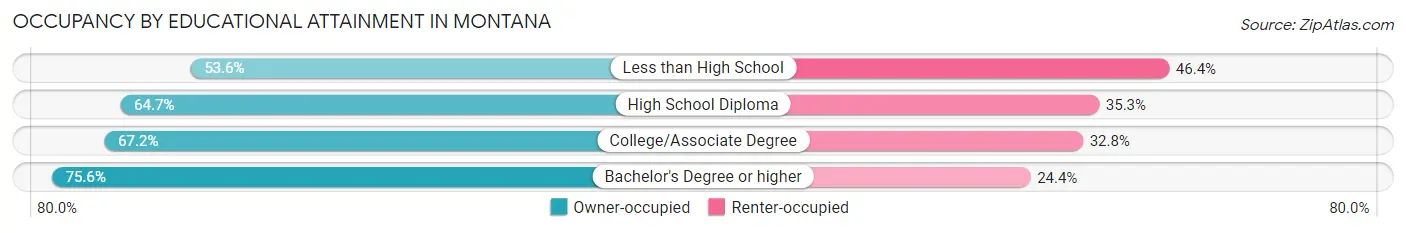
| Household Size | Owner-occupied | Renter-occupied |
| Less than High School | 9,894 (53.6%) | 8,575 (46.4%) |
| High School Diploma | 72,685 (64.7%) | 39,699 (35.3%) |
| College/Associate Degree | 102,656 (67.2%) | 50,023 (32.8%) |
| Bachelor's Degree or higher | 121,197 (75.6%) | 39,188 (24.4%) |
Occupancy by Age of Householder in Montana
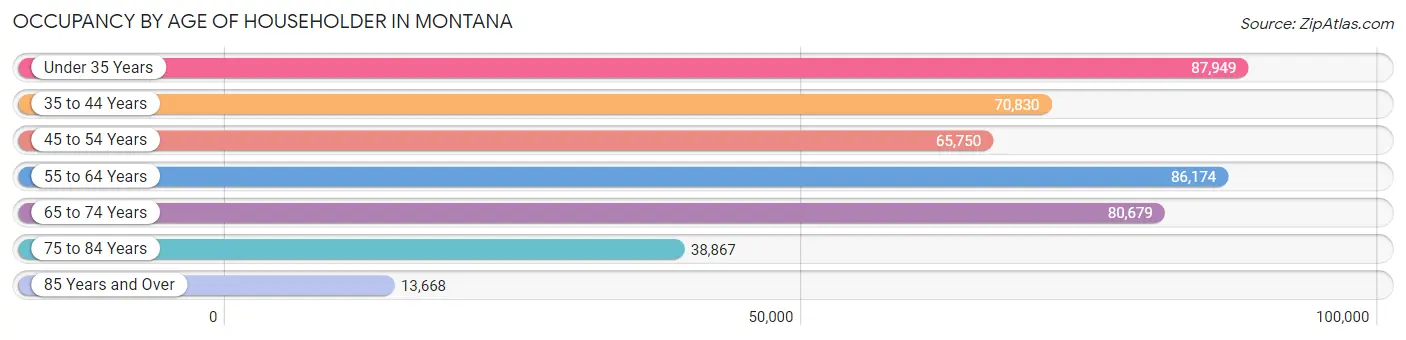
| Age Bracket | # Households | % Households |
| Under 35 Years | 87,949 | 19.8% |
| 35 to 44 Years | 70,830 | 16.0% |
| 45 to 54 Years | 65,750 | 14.8% |
| 55 to 64 Years | 86,174 | 19.4% |
| 65 to 74 Years | 80,679 | 18.2% |
| 75 to 84 Years | 38,867 | 8.8% |
| 85 Years and Over | 13,668 | 3.1% |
| Total | 443,917 | 100.0% |
Housing Finances in Montana
Median Income by Occupancy in Montana
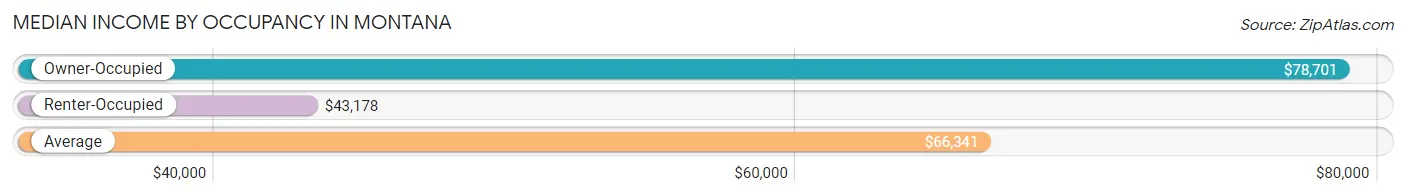
| Occupancy Type | # Households | Median Income |
| Owner-Occupied | 306,432 (69.0%) | $78,701 |
| Renter-Occupied | 137,485 (31.0%) | $43,178 |
| Average | 443,917 (100.0%) | $66,341 |
Occupancy by Householder Income Bracket in Montana
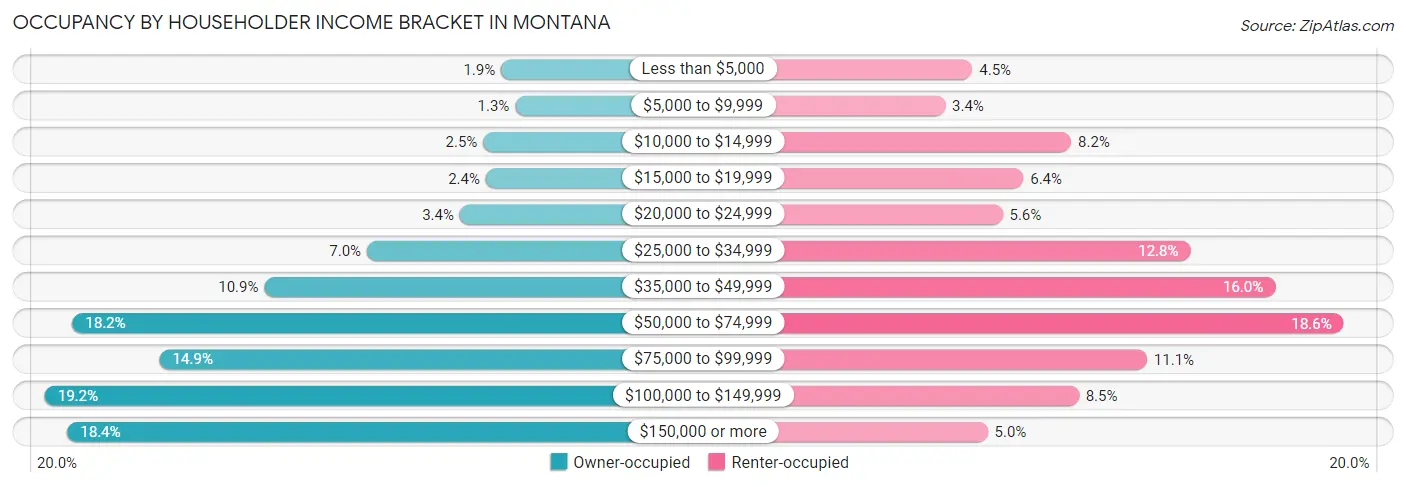
| Income Bracket | Owner-occupied | Renter-occupied |
| Less than $5,000 | 5,678 (1.8%) | 6,122 (4.4%) |
| $5,000 to $9,999 | 3,999 (1.3%) | 4,688 (3.4%) |
| $10,000 to $14,999 | 7,744 (2.5%) | 11,282 (8.2%) |
| $15,000 to $19,999 | 7,434 (2.4%) | 8,788 (6.4%) |
| $20,000 to $24,999 | 10,485 (3.4%) | 7,695 (5.6%) |
| $25,000 to $34,999 | 21,325 (7.0%) | 17,524 (12.8%) |
| $35,000 to $49,999 | 33,295 (10.9%) | 21,964 (16.0%) |
| $50,000 to $74,999 | 55,704 (18.2%) | 25,554 (18.6%) |
| $75,000 to $99,999 | 45,525 (14.9%) | 15,266 (11.1%) |
| $100,000 to $149,999 | 58,939 (19.2%) | 11,683 (8.5%) |
| $150,000 or more | 56,304 (18.4%) | 6,919 (5.0%) |
| Total | 306,432 (100.0%) | 137,485 (100.0%) |
Monthly Housing Cost Tiers in Montana
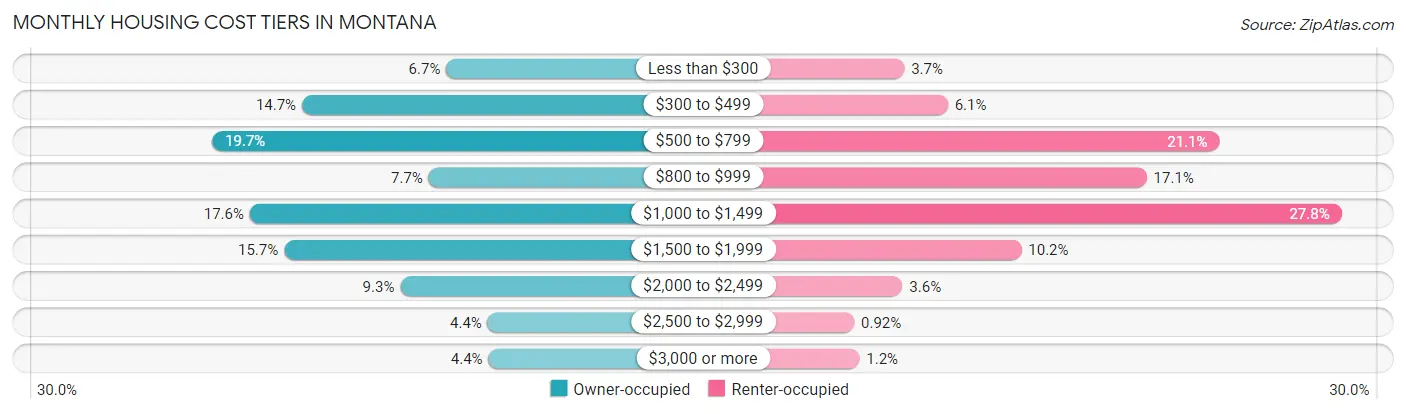
| Monthly Cost | Owner-occupied | Renter-occupied |
| Less than $300 | 20,574 (6.7%) | 5,078 (3.7%) |
| $300 to $499 | 44,972 (14.7%) | 8,379 (6.1%) |
| $500 to $799 | 60,218 (19.7%) | 28,993 (21.1%) |
| $800 to $999 | 23,548 (7.7%) | 23,477 (17.1%) |
| $1,000 to $1,499 | 53,808 (17.6%) | 38,273 (27.8%) |
| $1,500 to $1,999 | 48,027 (15.7%) | 13,970 (10.2%) |
| $2,000 to $2,499 | 28,330 (9.2%) | 4,930 (3.6%) |
| $2,500 to $2,999 | 13,543 (4.4%) | 1,269 (0.9%) |
| $3,000 or more | 13,412 (4.4%) | 1,658 (1.2%) |
| Total | 306,432 (100.0%) | 137,485 (100.0%) |
Physical Housing Characteristics in Montana
Housing Structures in Montana
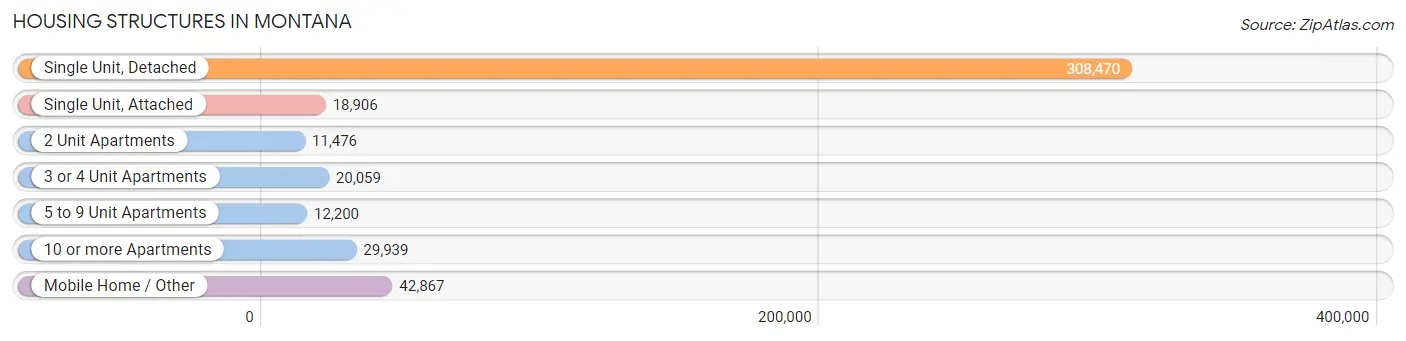
| Structure Type | # Housing Units | % Housing Units |
| Single Unit, Detached | 308,470 | 69.5% |
| Single Unit, Attached | 18,906 | 4.3% |
| 2 Unit Apartments | 11,476 | 2.6% |
| 3 or 4 Unit Apartments | 20,059 | 4.5% |
| 5 to 9 Unit Apartments | 12,200 | 2.8% |
| 10 or more Apartments | 29,939 | 6.7% |
| Mobile Home / Other | 42,867 | 9.7% |
| Total | 443,917 | 100.0% |
Housing Structures by Occupancy in Montana
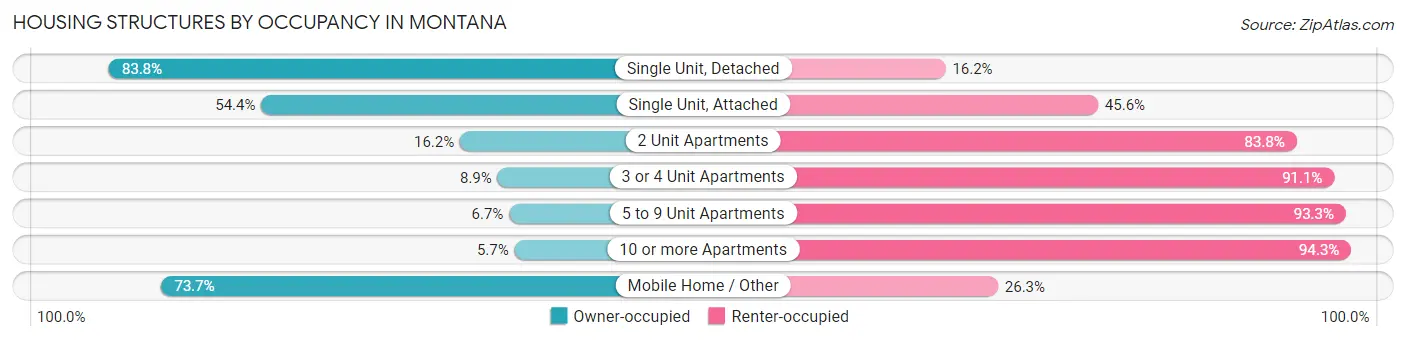
| Structure Type | Owner-occupied | Renter-occupied |
| Single Unit, Detached | 258,398 (83.8%) | 50,072 (16.2%) |
| Single Unit, Attached | 10,288 (54.4%) | 8,618 (45.6%) |
| 2 Unit Apartments | 1,855 (16.2%) | 9,621 (83.8%) |
| 3 or 4 Unit Apartments | 1,791 (8.9%) | 18,268 (91.1%) |
| 5 to 9 Unit Apartments | 818 (6.7%) | 11,382 (93.3%) |
| 10 or more Apartments | 1,698 (5.7%) | 28,241 (94.3%) |
| Mobile Home / Other | 31,584 (73.7%) | 11,283 (26.3%) |
| Total | 306,432 (69.0%) | 137,485 (31.0%) |
Housing Structures by Number of Rooms in Montana
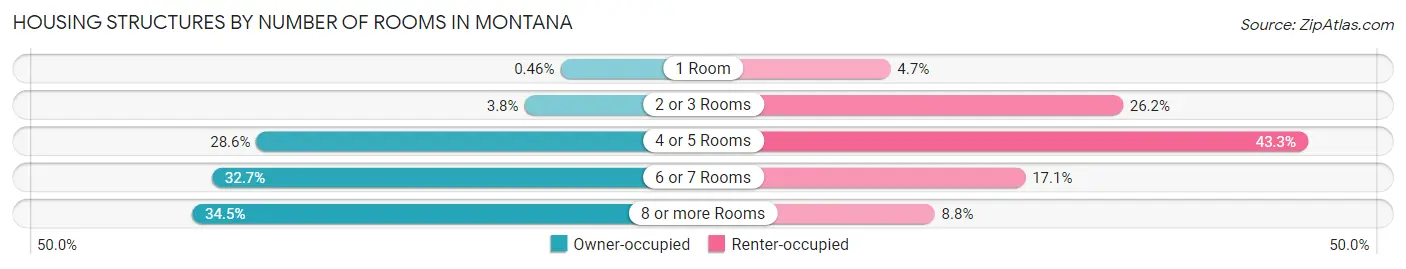
| Number of Rooms | Owner-occupied | Renter-occupied |
| 1 Room | 1,420 (0.5%) | 6,424 (4.7%) |
| 2 or 3 Rooms | 11,580 (3.8%) | 35,962 (26.2%) |
| 4 or 5 Rooms | 87,555 (28.6%) | 59,489 (43.3%) |
| 6 or 7 Rooms | 100,140 (32.7%) | 23,560 (17.1%) |
| 8 or more Rooms | 105,737 (34.5%) | 12,050 (8.8%) |
| Total | 306,432 (100.0%) | 137,485 (100.0%) |
Housing Structure by Heating Type in Montana
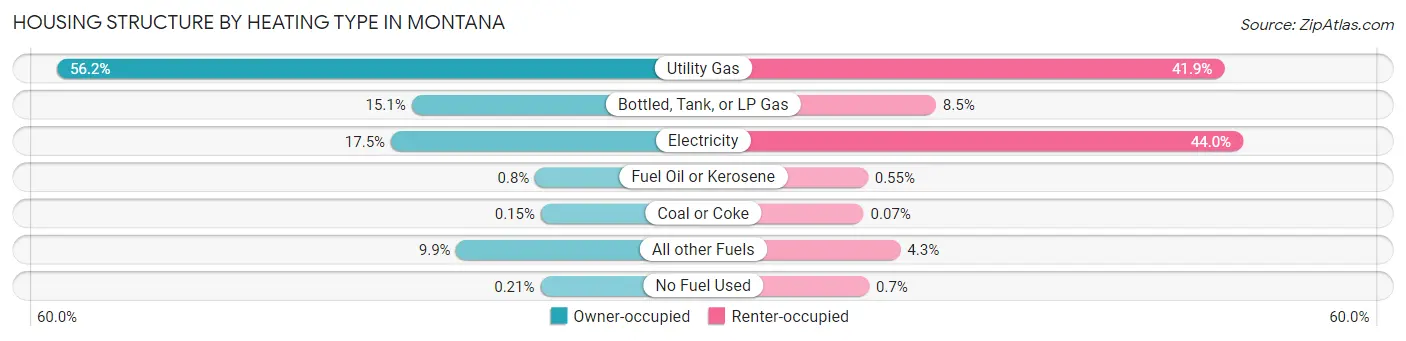
| Heating Type | Owner-occupied | Renter-occupied |
| Utility Gas | 172,332 (56.2%) | 57,559 (41.9%) |
| Bottled, Tank, or LP Gas | 46,403 (15.1%) | 11,613 (8.5%) |
| Electricity | 53,730 (17.5%) | 60,544 (44.0%) |
| Fuel Oil or Kerosene | 2,441 (0.8%) | 750 (0.5%) |
| Coal or Coke | 447 (0.2%) | 103 (0.1%) |
| All other Fuels | 30,442 (9.9%) | 5,953 (4.3%) |
| No Fuel Used | 637 (0.2%) | 963 (0.7%) |
| Total | 306,432 (100.0%) | 137,485 (100.0%) |
Household Vehicle Usage in Montana
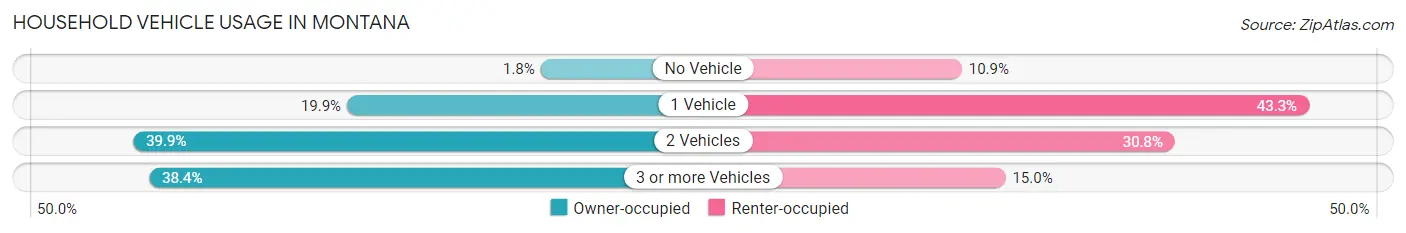
| Vehicles per Household | Owner-occupied | Renter-occupied |
| No Vehicle | 5,605 (1.8%) | 15,004 (10.9%) |
| 1 Vehicle | 61,015 (19.9%) | 59,550 (43.3%) |
| 2 Vehicles | 122,197 (39.9%) | 42,328 (30.8%) |
| 3 or more Vehicles | 117,615 (38.4%) | 20,603 (15.0%) |
| Total | 306,432 (100.0%) | 137,485 (100.0%) |
Real Estate & Mortgages in Montana
Real Estate and Mortgage Overview in Montana
| Characteristic | Without Mortgage | With Mortgage |
| Housing Units | 137,509 | 168,923 |
| Median Property Value | $268,300 | $335,700 |
| Median Household Income | $60,133 | $38,831 |
| Monthly Housing Costs | $519 | $13,078 |
| Real Estate Taxes | $2,195 | $3,513 |
Property Value by Mortgage Status in Montana
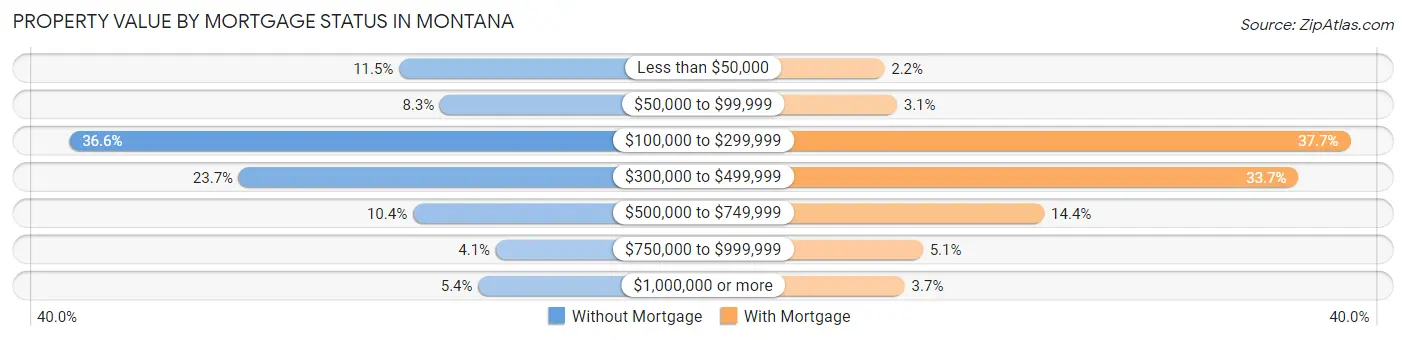
| Property Value | Without Mortgage | With Mortgage |
| Less than $50,000 | 15,758 (11.5%) | 3,696 (2.2%) |
| $50,000 to $99,999 | 11,475 (8.3%) | 5,301 (3.1%) |
| $100,000 to $299,999 | 50,328 (36.6%) | 63,678 (37.7%) |
| $300,000 to $499,999 | 32,550 (23.7%) | 57,002 (33.7%) |
| $500,000 to $749,999 | 14,309 (10.4%) | 24,277 (14.4%) |
| $750,000 to $999,999 | 5,624 (4.1%) | 8,657 (5.1%) |
| $1,000,000 or more | 7,465 (5.4%) | 6,312 (3.7%) |
| Total | 137,509 (100.0%) | 168,923 (100.0%) |
Household Income by Mortgage Status in Montana
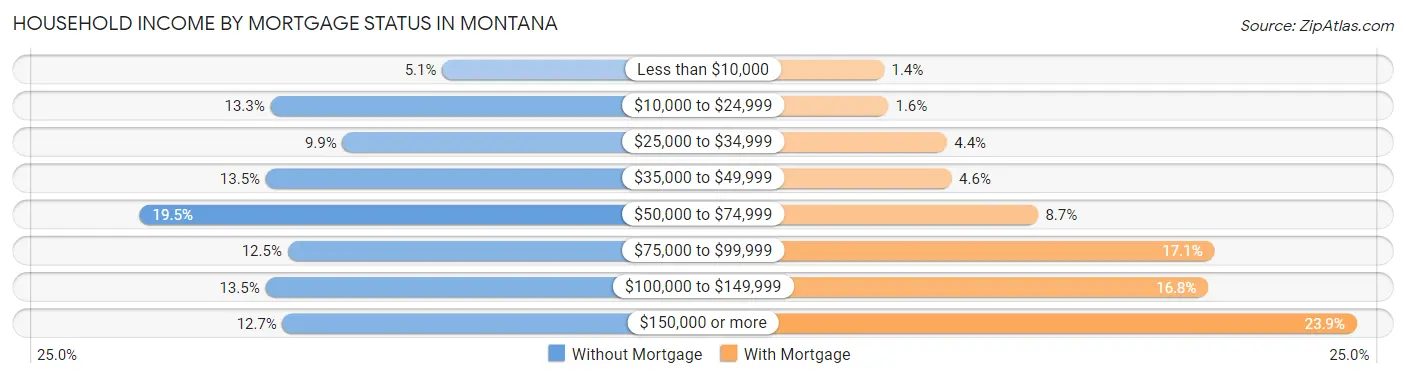
| Household Income | Without Mortgage | With Mortgage |
| Less than $10,000 | 7,029 (5.1%) | 2,333 (1.4%) |
| $10,000 to $24,999 | 18,276 (13.3%) | 2,648 (1.6%) |
| $25,000 to $34,999 | 13,553 (9.9%) | 7,387 (4.4%) |
| $35,000 to $49,999 | 18,583 (13.5%) | 7,772 (4.6%) |
| $50,000 to $74,999 | 26,841 (19.5%) | 14,712 (8.7%) |
| $75,000 to $99,999 | 17,144 (12.5%) | 28,863 (17.1%) |
| $100,000 to $149,999 | 18,610 (13.5%) | 28,381 (16.8%) |
| $150,000 or more | 17,473 (12.7%) | 40,329 (23.9%) |
| Total | 137,509 (100.0%) | 168,923 (100.0%) |
Property Value to Household Income Ratio in Montana
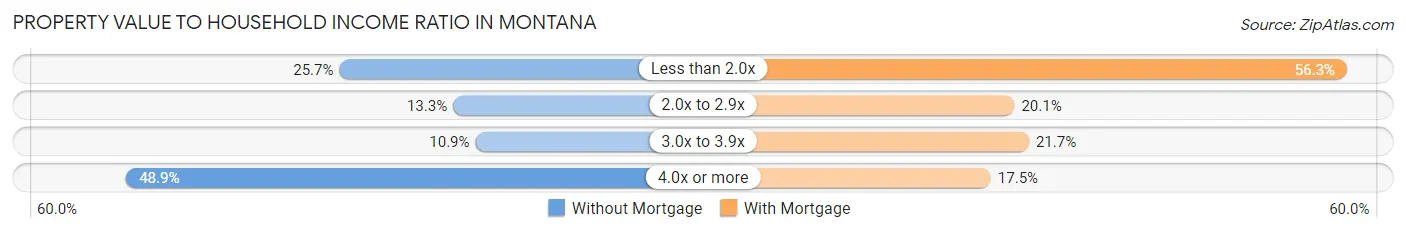
| Value-to-Income Ratio | Without Mortgage | With Mortgage |
| Less than 2.0x | 35,350 (25.7%) | 95,149 (56.3%) |
| 2.0x to 2.9x | 18,322 (13.3%) | 33,975 (20.1%) |
| 3.0x to 3.9x | 14,966 (10.9%) | 36,631 (21.7%) |
| 4.0x or more | 67,266 (48.9%) | 29,628 (17.5%) |
| Total | 137,509 (100.0%) | 168,923 (100.0%) |
Real Estate Taxes by Mortgage Status in Montana
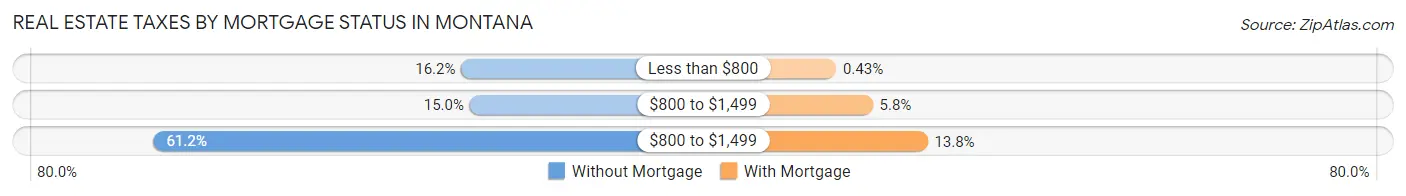
| Property Taxes | Without Mortgage | With Mortgage |
| Less than $800 | 22,264 (16.2%) | 727 (0.4%) |
| $800 to $1,499 | 20,559 (14.9%) | 9,767 (5.8%) |
| $800 to $1,499 | 84,107 (61.2%) | 23,296 (13.8%) |
| Total | 137,509 (100.0%) | 168,923 (100.0%) |
Health & Disability in Montana
Health Insurance Coverage by Age in Montana
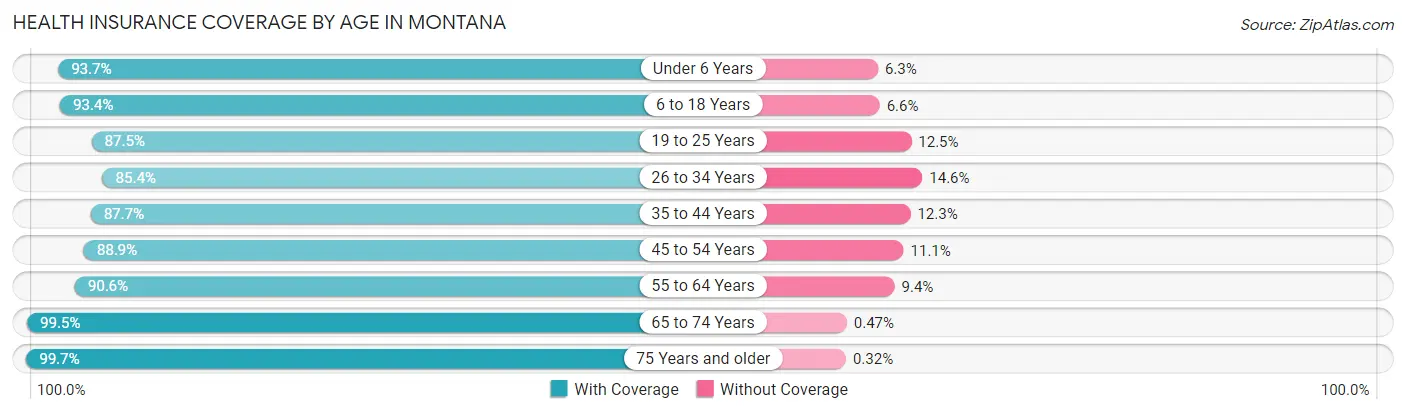
| Age Bracket | With Coverage | Without Coverage |
| Under 6 Years | 66,875 (93.7%) | 4,482 (6.3%) |
| 6 to 18 Years | 162,467 (93.4%) | 11,491 (6.6%) |
| 19 to 25 Years | 86,603 (87.5%) | 12,382 (12.5%) |
| 26 to 34 Years | 105,407 (85.4%) | 17,957 (14.6%) |
| 35 to 44 Years | 117,505 (87.7%) | 16,535 (12.3%) |
| 45 to 54 Years | 106,478 (88.9%) | 13,242 (11.1%) |
| 55 to 64 Years | 133,892 (90.6%) | 13,853 (9.4%) |
| 65 to 74 Years | 127,510 (99.5%) | 607 (0.5%) |
| 75 Years and older | 77,675 (99.7%) | 248 (0.3%) |
| Total | 984,412 (91.6%) | 90,797 (8.4%) |
Health Insurance Coverage by Citizenship Status in Montana
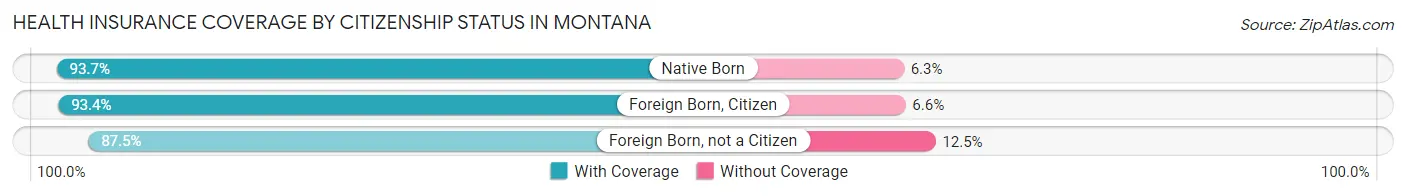
| Citizenship Status | With Coverage | Without Coverage |
| Native Born | 66,875 (93.7%) | 4,482 (6.3%) |
| Foreign Born, Citizen | 162,467 (93.4%) | 11,491 (6.6%) |
| Foreign Born, not a Citizen | 86,603 (87.5%) | 12,382 (12.5%) |
Health Insurance Coverage by Household Income in Montana
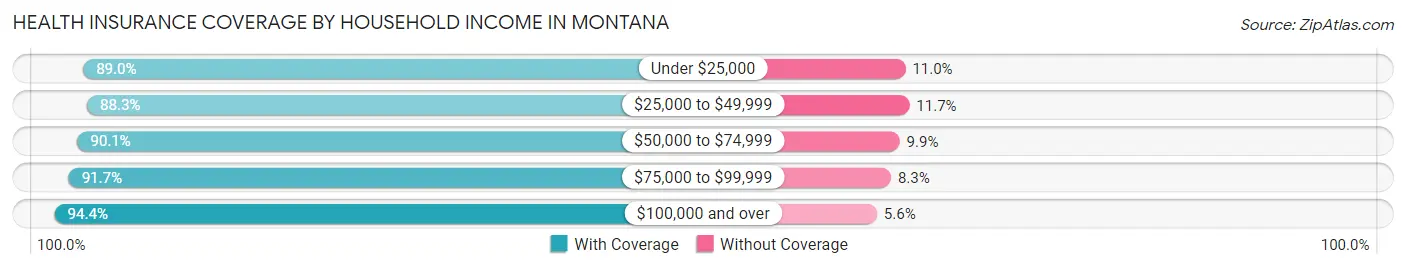
| Household Income | With Coverage | Without Coverage |
| Under $25,000 | 105,650 (89.0%) | 13,049 (11.0%) |
| $25,000 to $49,999 | 164,160 (88.3%) | 21,824 (11.7%) |
| $50,000 to $74,999 | 173,952 (90.1%) | 19,108 (9.9%) |
| $75,000 to $99,999 | 146,632 (91.7%) | 13,239 (8.3%) |
| $100,000 and over | 379,275 (94.4%) | 22,650 (5.6%) |
Public vs Private Health Insurance Coverage by Age in Montana
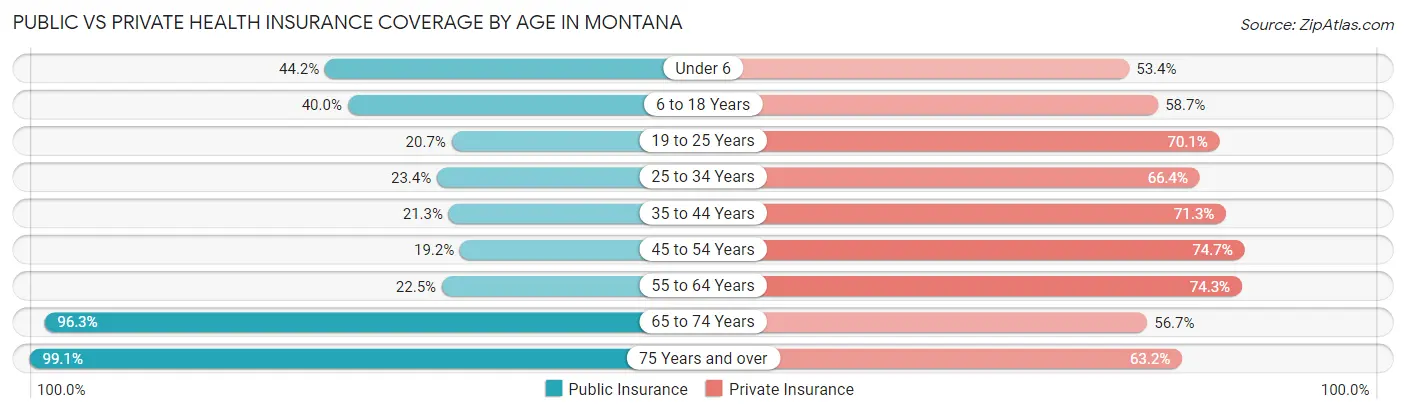
| Age Bracket | Public Insurance | Private Insurance |
| Under 6 | 31,555 (44.2%) | 38,080 (53.4%) |
| 6 to 18 Years | 69,615 (40.0%) | 102,169 (58.7%) |
| 19 to 25 Years | 20,519 (20.7%) | 69,420 (70.1%) |
| 25 to 34 Years | 28,918 (23.4%) | 81,961 (66.4%) |
| 35 to 44 Years | 28,494 (21.3%) | 95,627 (71.3%) |
| 45 to 54 Years | 22,951 (19.2%) | 89,475 (74.7%) |
| 55 to 64 Years | 33,305 (22.5%) | 109,731 (74.3%) |
| 65 to 74 Years | 123,410 (96.3%) | 72,661 (56.7%) |
| 75 Years and over | 77,198 (99.1%) | 49,225 (63.2%) |
| Total | 435,965 (40.6%) | 708,349 (65.9%) |
Disability Status by Sex by Age in Montana
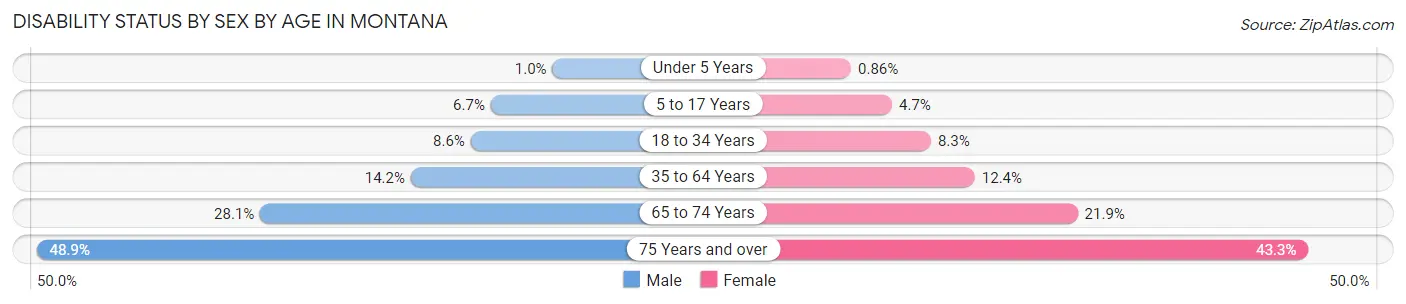
| Age Bracket | Male | Female |
| Under 5 Years | 307 (1.0%) | 246 (0.9%) |
| 5 to 17 Years | 5,945 (6.7%) | 3,890 (4.7%) |
| 18 to 34 Years | 10,530 (8.6%) | 9,498 (8.3%) |
| 35 to 64 Years | 28,713 (14.2%) | 24,554 (12.3%) |
| 65 to 74 Years | 17,897 (28.1%) | 14,123 (21.9%) |
| 75 Years and over | 17,593 (48.9%) | 18,156 (43.3%) |
Disability Class by Sex by Age in Montana
Disability Class: Hearing Difficulty
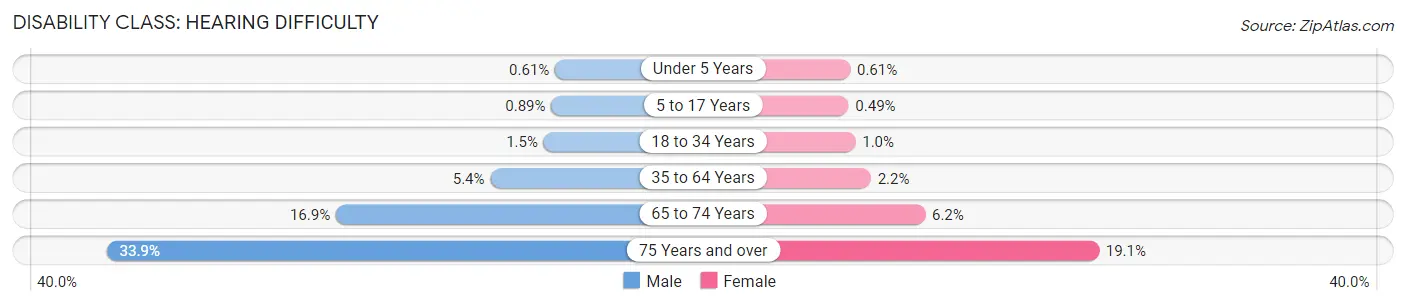
| Age Bracket | Male | Female |
| Under 5 Years | 185 (0.6%) | 175 (0.6%) |
| 5 to 17 Years | 781 (0.9%) | 409 (0.5%) |
| 18 to 34 Years | 1,773 (1.5%) | 1,145 (1.0%) |
| 35 to 64 Years | 10,987 (5.4%) | 4,278 (2.1%) |
| 65 to 74 Years | 10,739 (16.9%) | 3,984 (6.2%) |
| 75 Years and over | 12,203 (33.9%) | 8,000 (19.1%) |
Disability Class: Vision Difficulty
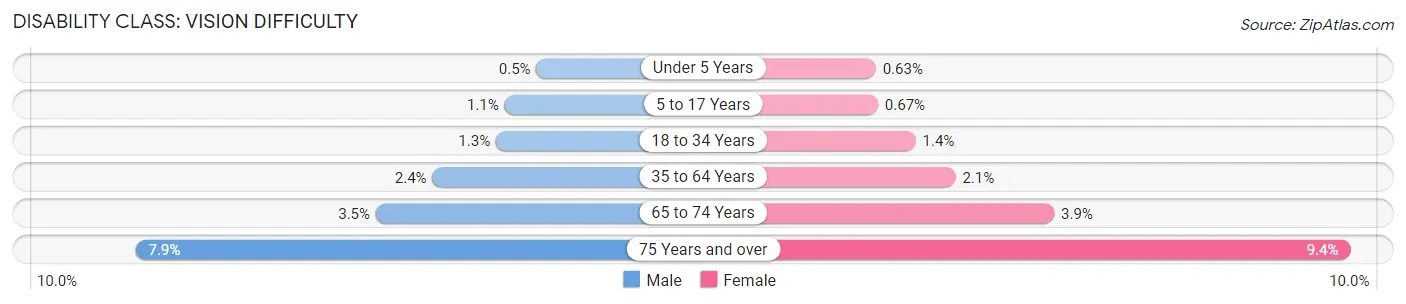
| Age Bracket | Male | Female |
| Under 5 Years | 151 (0.5%) | 181 (0.6%) |
| 5 to 17 Years | 963 (1.1%) | 558 (0.7%) |
| 18 to 34 Years | 1,534 (1.3%) | 1,577 (1.4%) |
| 35 to 64 Years | 4,922 (2.4%) | 4,190 (2.1%) |
| 65 to 74 Years | 2,215 (3.5%) | 2,542 (3.9%) |
| 75 Years and over | 2,856 (7.9%) | 3,960 (9.4%) |
Disability Class: Cognitive Difficulty
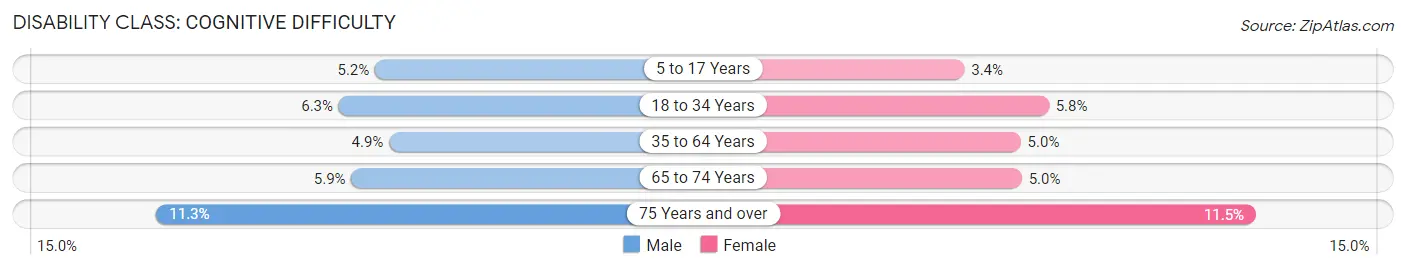
| Age Bracket | Male | Female |
| 5 to 17 Years | 4,626 (5.2%) | 2,844 (3.4%) |
| 18 to 34 Years | 7,653 (6.2%) | 6,607 (5.8%) |
| 35 to 64 Years | 9,841 (4.9%) | 9,893 (5.0%) |
| 65 to 74 Years | 3,754 (5.9%) | 3,233 (5.0%) |
| 75 Years and over | 4,078 (11.3%) | 4,835 (11.5%) |
Disability Class: Ambulatory Difficulty
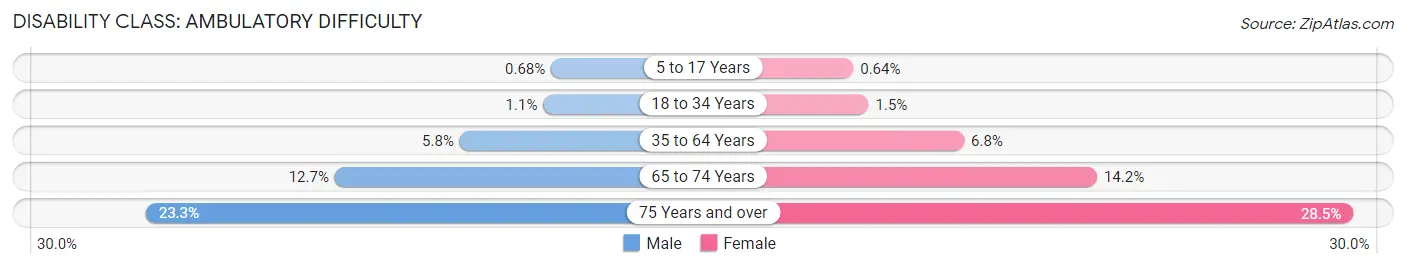
| Age Bracket | Male | Female |
| 5 to 17 Years | 599 (0.7%) | 536 (0.6%) |
| 18 to 34 Years | 1,374 (1.1%) | 1,709 (1.5%) |
| 35 to 64 Years | 11,696 (5.8%) | 13,545 (6.8%) |
| 65 to 74 Years | 8,095 (12.7%) | 9,168 (14.2%) |
| 75 Years and over | 8,366 (23.3%) | 11,940 (28.5%) |
Disability Class: Self-Care Difficulty
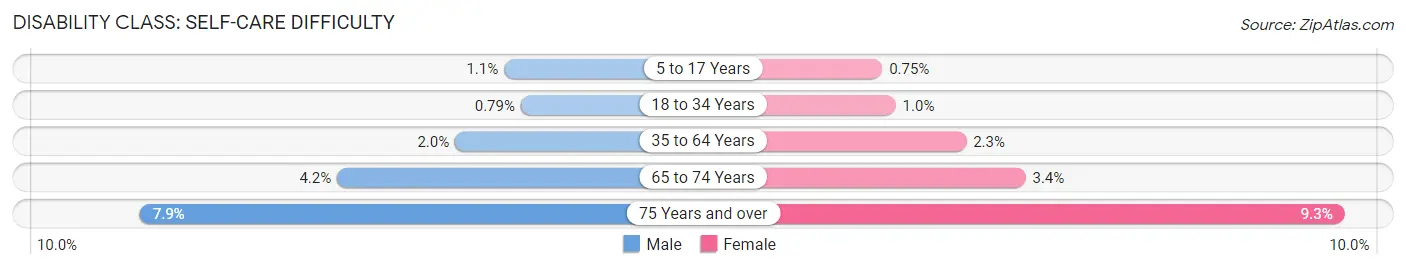
| Age Bracket | Male | Female |
| 5 to 17 Years | 972 (1.1%) | 624 (0.7%) |
| 18 to 34 Years | 970 (0.8%) | 1,150 (1.0%) |
| 35 to 64 Years | 4,076 (2.0%) | 4,585 (2.3%) |
| 65 to 74 Years | 2,674 (4.2%) | 2,203 (3.4%) |
| 75 Years and over | 2,830 (7.9%) | 3,914 (9.3%) |
Technology Access in Montana
Computing Device Access in Montana
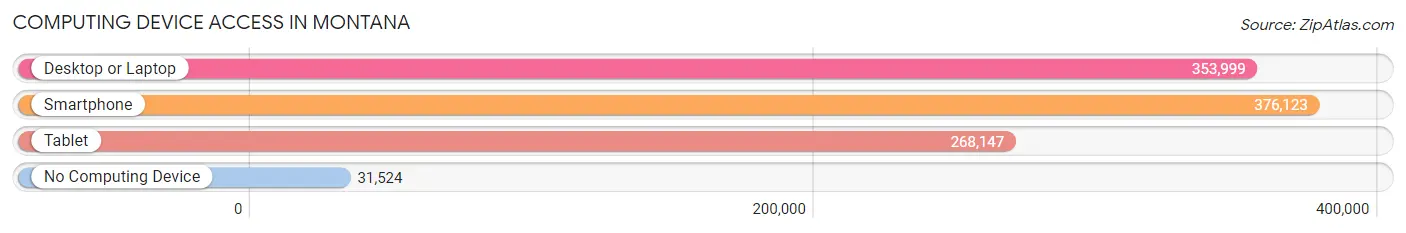
| Device Type | # Households | % Households |
| Desktop or Laptop | 353,999 | 79.7% |
| Smartphone | 376,123 | 84.7% |
| Tablet | 268,147 | 60.4% |
| No Computing Device | 31,524 | 7.1% |
| Total | 443,917 | 100.0% |
Internet Access in Montana
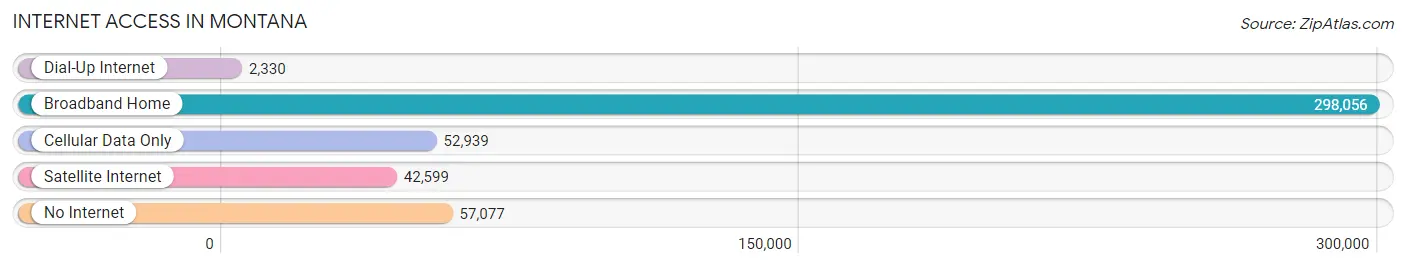
| Internet Type | # Households | % Households |
| Dial-Up Internet | 2,330 | 0.5% |
| Broadband Home | 298,056 | 67.1% |
| Cellular Data Only | 52,939 | 11.9% |
| Satellite Internet | 42,599 | 9.6% |
| No Internet | 57,077 | 12.9% |
| Total | 443,917 | 100.0% |
Montana Summary
Montana is a state located in the western United States. It is the fourth largest state in the country, with an area of 147,042 square miles. Montana is bordered by Idaho to the west, Wyoming to the south, North Dakota and South Dakota to the east, and the Canadian provinces of Alberta, British Columbia, and Saskatchewan to the north. Montana is known for its rugged terrain and vast open spaces, and is home to some of the most spectacular scenery in the United States.
History
The area that is now Montana has been inhabited by Native Americans for thousands of years. The first Europeans to explore the area were French fur traders, who arrived in the late 1700s. In 1803, the United States acquired the area as part of the Louisiana Purchase. In 1805, the Lewis and Clark Expedition passed through the area, and in 1806, the first permanent white settlement was established in the area.
In 1864, Montana became a U.S. territory, and in 1889, it was admitted to the Union as the 41st state. During the late 1800s and early 1900s, Montana experienced a period of rapid growth and development, as gold and silver were discovered in the area. This led to a population boom, and the state's economy was largely based on mining and ranching.
Geography
Montana is located in the western United States, and is bordered by Idaho to the west, Wyoming to the south, North Dakota and South Dakota to the east, and the Canadian provinces of Alberta, British Columbia, and Saskatchewan to the north. Montana is the fourth largest state in the country, with an area of 147,042 square miles.
Montana is known for its rugged terrain and vast open spaces. The eastern part of the state is characterized by rolling hills and plains, while the western part of the state is dominated by the Rocky Mountains. The highest point in the state is Granite Peak, which rises to an elevation of 12,807 feet.
Economy
Montana's economy is largely based on agriculture, mining, and tourism. Agriculture is the state's largest industry, and the state is a major producer of wheat, barley, and other grains. Mining is also an important part of the state's economy, and Montana is a major producer of coal, copper, and other minerals. Tourism is also an important part of the state's economy, and Montana is home to some of the most spectacular scenery in the United States.
Demographics
As of 2020, Montana had an estimated population of 1,068,778. The state has a population density of 7.3 people per square mile, making it the fourth least densely populated state in the country. The largest city in the state is Billings, with a population of 109,059. The state's capital is Helena, with a population of 28,190.
The majority of Montana's population is of European descent, with the largest ethnic groups being German (25.3%), Irish (13.2%), English (11.2%), and Norwegian (7.2%). The state also has a significant Native American population, with the largest tribes being the Blackfeet, Crow, and Chippewa. The state also has a small Hispanic population, with the largest groups being Mexican (2.3%) and Puerto Rican (0.3%).
Common Questions
When was Montana Incorporated?
Montana was Incorporated into the Union on Nov 8, 1889.
What is the Total Area of Montana?
Total Area of Montana is 147,039 Square Miles.
What is the Total Land Area of Montana?
Total Land Area of Montana is 145,541 Square Miles.
What is the Total Water Area of Montana?
Total Water Area of Montana is 1,498 Square Miles.
What is the Average Elevation in Montana?
Average Elevation in Montana is 3,400 Feet.
What is the Highest Elevation in Montana?
Highest Elevation in Montana is 12,799 Feet.
What is the Lowest Elevation in Montana?
Lowest Elevation in Montana is 1800 Feet.
What is the Population Density in Montana?
Population Density in Montana is 7.5 People per Square Mile.
What is Per Capita Income in Montana?
Per Capita income in Montana is $37,837.
What is the Median Family Income in Montana?
Median Family Income in Montana is $84,027.
What is the Median Household income in Montana?
Median Household Income in Montana is $66,341.
What is Income or Wage Gap in Montana?
Income or Wage Gap in Montana is 29.0%.
Women in Montana earn 71.0 cents for every dollar earned by a man.
What is Family Income Deficit in Montana?
Family Income Deficit in Montana is $10,359.
Families that are below poverty line in Montana earn $10,359 less on average than the poverty threshold level.
What is Inequality or Gini Index in Montana?
Inequality or Gini Index in Montana is 0.46.
What is the Total Population of Montana?
Total Population of Montana is 1,091,840.
What is the Total Male Population of Montana?
Total Male Population of Montana is 553,716.
What is the Total Female Population of Montana?
Total Female Population of Montana is 538,124.
What is the Ratio of Males per 100 Females in Montana?
There are 102.90 Males per 100 Females in Montana.
What is the Ratio of Females per 100 Males in Montana?
There are 97.18 Females per 100 Males in Montana.
What is the Median Population Age in Montana?
Median Population Age in Montana is 40.1 Years.
What is the Average Family Size in Montana
Average Family Size in Montana is 3.0 People.
What is the Average Household Size in Montana
Average Household Size in Montana is 2.4 People.
How Large is the Labor Force in Montana?
There are 559,192 People in the Labor Forcein in Montana.
What is the Percentage of People in the Labor Force in Montana?
63.0% of People are in the Labor Force in Montana.
What is the Unemployment Rate in Montana?
Unemployment Rate in Montana is 3.9%.