Cities with the Highest Percentage of Population Employed in Installation, Maintenance & Repair in Michigan
RELATED REPORTS & OPTIONS
Installation, Maintenance & Repair
Michigan
Compare Cities
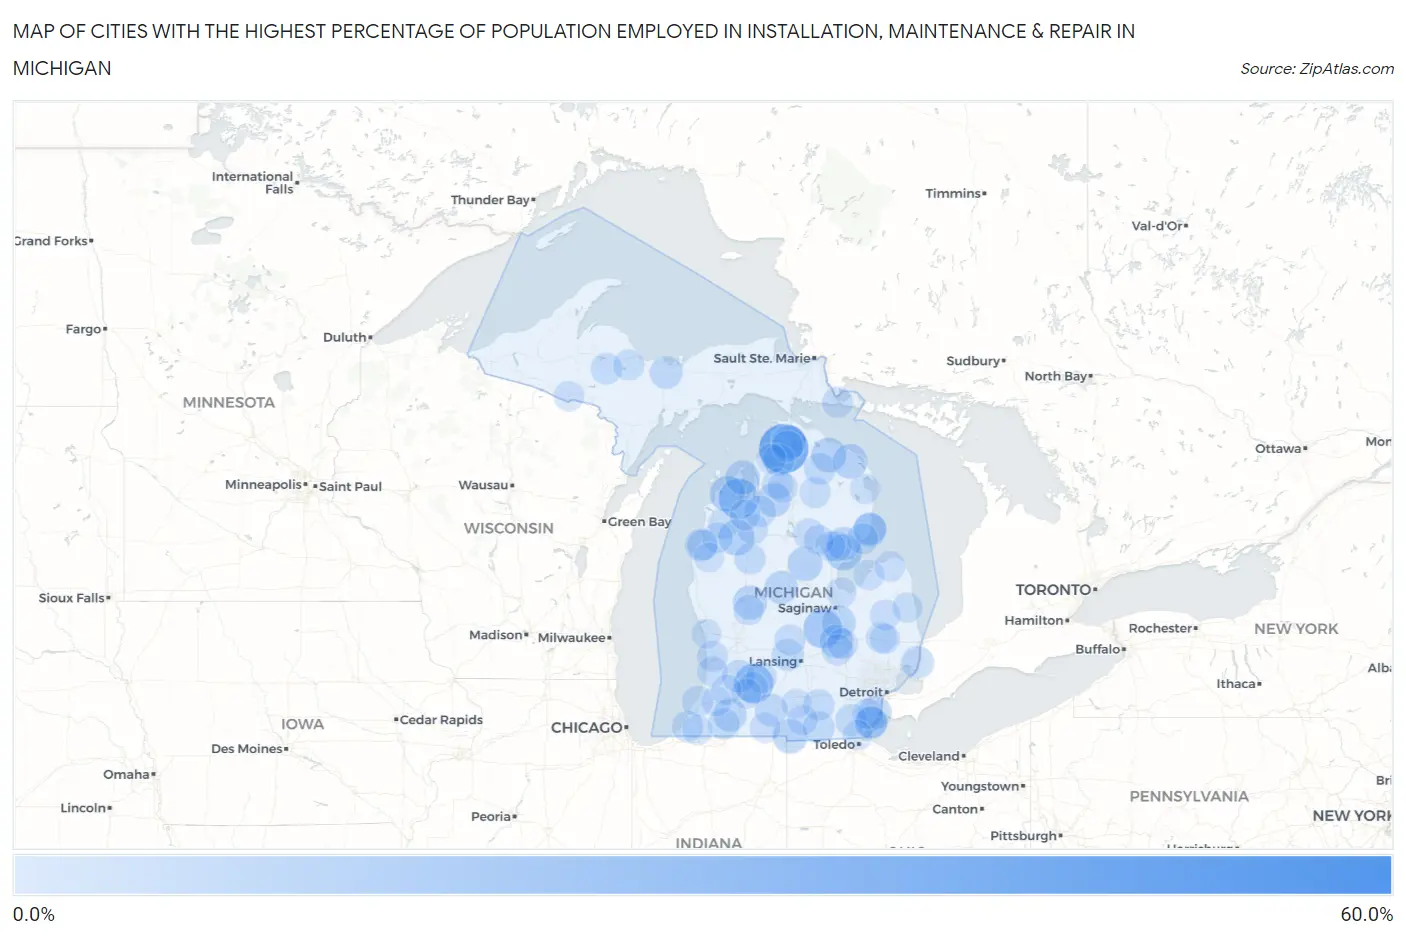
Map of Cities with the Highest Percentage of Population Employed in Installation, Maintenance & Repair in Michigan
0.0%
60.0%
Cities with the Highest Percentage of Population Employed in Installation, Maintenance & Repair in Michigan
| City | % Employed | vs State | vs National | |
| 1. | Trimountain | 56.2% | 3.1%(+53.2)#1 | 3.1%(+53.2)#53 |
| 2. | Winn | 45.9% | 3.1%(+42.8)#2 | 3.1%(+42.8)#100 |
| 3. | Conway | 38.5% | 3.1%(+35.4)#3 | 3.1%(+35.4)#159 |
| 4. | Palo | 35.5% | 3.1%(+32.4)#4 | 3.1%(+32.5)#188 |
| 5. | Scotts | 28.6% | 3.1%(+25.5)#5 | 3.1%(+25.5)#316 |
| 6. | Elm Hall | 26.2% | 3.1%(+23.1)#6 | 3.1%(+23.2)#376 |
| 7. | Greilickville | 22.7% | 3.1%(+19.6)#7 | 3.1%(+19.7)#515 |
| 8. | Hickory Corners | 21.5% | 3.1%(+18.4)#8 | 3.1%(+18.4)#570 |
| 9. | Oakley | 20.4% | 3.1%(+17.3)#9 | 3.1%(+17.3)#648 |
| 10. | Twining | 16.4% | 3.1%(+13.3)#10 | 3.1%(+13.4)#973 |
| 11. | Three Lakes | 16.2% | 3.1%(+13.1)#11 | 3.1%(+13.1)#1,002 |
| 12. | Harrietta | 16.1% | 3.1%(+13.0)#12 | 3.1%(+13.1)#1,007 |
| 13. | Maple City | 15.2% | 3.1%(+12.1)#13 | 3.1%(+12.1)#1,119 |
| 14. | Ramsay | 14.4% | 3.1%(+11.3)#14 | 3.1%(+11.3)#1,247 |
| 15. | Painesdale | 14.3% | 3.1%(+11.2)#15 | 3.1%(+11.2)#1,263 |
| 16. | Millersburg | 14.3% | 3.1%(+11.2)#16 | 3.1%(+11.2)#1,273 |
| 17. | Posen | 14.1% | 3.1%(+11.0)#17 | 3.1%(+11.1)#1,310 |
| 18. | Gladwin | 13.9% | 3.1%(+10.8)#18 | 3.1%(+10.8)#1,360 |
| 19. | Camden | 13.8% | 3.1%(+10.7)#19 | 3.1%(+10.7)#1,383 |
| 20. | Omena | 13.5% | 3.1%(+10.4)#20 | 3.1%(+10.4)#1,448 |
| 21. | Brutus | 13.4% | 3.1%(+10.3)#21 | 3.1%(+10.3)#1,470 |
| 22. | Manistee Lake | 13.1% | 3.1%(+9.98)#22 | 3.1%(+10.0)#1,545 |
| 23. | Morley | 13.0% | 3.1%(+9.86)#23 | 3.1%(+9.90)#1,579 |
| 24. | Whittemore | 12.8% | 3.1%(+9.70)#24 | 3.1%(+9.73)#1,631 |
| 25. | Burt | 12.6% | 3.1%(+9.51)#25 | 3.1%(+9.54)#1,664 |
| 26. | Au Sable | 12.6% | 3.1%(+9.46)#26 | 3.1%(+9.49)#1,681 |
| 27. | Lennon | 12.3% | 3.1%(+9.18)#27 | 3.1%(+9.21)#1,754 |
| 28. | Beal City | 12.0% | 3.1%(+8.95)#28 | 3.1%(+8.98)#1,812 |
| 29. | Marcellus | 11.9% | 3.1%(+8.77)#29 | 3.1%(+8.80)#1,869 |
| 30. | Greenland | 11.8% | 3.1%(+8.74)#30 | 3.1%(+8.77)#1,877 |
| 31. | Rockwood | 11.8% | 3.1%(+8.71)#31 | 3.1%(+8.74)#1,885 |
| 32. | Detroit Beach | 11.7% | 3.1%(+8.56)#32 | 3.1%(+8.59)#1,928 |
| 33. | Marine City | 11.2% | 3.1%(+8.14)#33 | 3.1%(+8.17)#2,063 |
| 34. | Burlington | 11.1% | 3.1%(+8.01)#34 | 3.1%(+8.04)#2,106 |
| 35. | Chatham | 11.1% | 3.1%(+8.01)#35 | 3.1%(+8.04)#2,112 |
| 36. | Martin | 11.1% | 3.1%(+7.97)#36 | 3.1%(+8.00)#2,131 |
| 37. | Oak Hill | 10.9% | 3.1%(+7.83)#37 | 3.1%(+7.86)#2,161 |
| 38. | Clayton | 10.1% | 3.1%(+7.01)#38 | 3.1%(+7.04)#2,506 |
| 39. | Oscoda | 10.1% | 3.1%(+6.97)#39 | 3.1%(+7.00)#2,523 |
| 40. | Dundee | 10.0% | 3.1%(+6.86)#40 | 3.1%(+6.89)#2,582 |
| 41. | Shaftsburg | 9.8% | 3.1%(+6.70)#41 | 3.1%(+6.73)#2,678 |
| 42. | Canada Creek Ranch | 9.8% | 3.1%(+6.66)#42 | 3.1%(+6.69)#2,693 |
| 43. | Eagle | 9.7% | 3.1%(+6.58)#43 | 3.1%(+6.61)#2,750 |
| 44. | South Boardman | 9.5% | 3.1%(+6.38)#44 | 3.1%(+6.41)#2,849 |
| 45. | Walloon Lake | 9.3% | 3.1%(+6.22)#45 | 3.1%(+6.25)#2,942 |
| 46. | Vandalia | 9.1% | 3.1%(+5.99)#46 | 3.1%(+6.02)#3,054 |
| 47. | Alanson | 9.0% | 3.1%(+5.92)#47 | 3.1%(+5.95)#3,110 |
| 48. | Atlantic Mine | 8.9% | 3.1%(+5.85)#48 | 3.1%(+5.88)#3,153 |
| 49. | Republic | 8.9% | 3.1%(+5.79)#49 | 3.1%(+5.82)#3,190 |
| 50. | Le Roy | 8.9% | 3.1%(+5.79)#50 | 3.1%(+5.82)#3,192 |
| 51. | Napoleon | 8.9% | 3.1%(+5.77)#51 | 3.1%(+5.80)#3,208 |
| 52. | Woodland Beach | 8.8% | 3.1%(+5.75)#52 | 3.1%(+5.78)#3,222 |
| 53. | New Troy | 8.8% | 3.1%(+5.72)#53 | 3.1%(+5.76)#3,236 |
| 54. | Fowler | 8.6% | 3.1%(+5.49)#54 | 3.1%(+5.52)#3,427 |
| 55. | East Tawas | 8.6% | 3.1%(+5.49)#55 | 3.1%(+5.52)#3,428 |
| 56. | Lewiston | 8.6% | 3.1%(+5.46)#56 | 3.1%(+5.50)#3,456 |
| 57. | Gaines | 8.5% | 3.1%(+5.41)#57 | 3.1%(+5.44)#3,489 |
| 58. | Palmer | 8.5% | 3.1%(+5.37)#58 | 3.1%(+5.40)#3,532 |
| 59. | Lake Michigan Beach | 8.4% | 3.1%(+5.30)#59 | 3.1%(+5.33)#3,579 |
| 60. | Hartland | 8.4% | 3.1%(+5.28)#60 | 3.1%(+5.31)#3,602 |
| 61. | St Helen | 8.3% | 3.1%(+5.22)#61 | 3.1%(+5.26)#3,658 |
| 62. | Alba | 8.2% | 3.1%(+5.14)#62 | 3.1%(+5.17)#3,731 |
| 63. | Copemish | 8.2% | 3.1%(+5.14)#63 | 3.1%(+5.17)#3,734 |
| 64. | De Tour Village | 8.2% | 3.1%(+5.12)#64 | 3.1%(+5.15)#3,745 |
| 65. | Manton | 8.2% | 3.1%(+5.08)#65 | 3.1%(+5.11)#3,779 |
| 66. | Beechwood | 8.1% | 3.1%(+5.00)#66 | 3.1%(+5.03)#3,853 |
| 67. | Attica | 8.0% | 3.1%(+4.94)#67 | 3.1%(+4.97)#3,903 |
| 68. | Dowling | 8.0% | 3.1%(+4.93)#68 | 3.1%(+4.96)#3,914 |
| 69. | South Gull Lake | 7.9% | 3.1%(+4.85)#69 | 3.1%(+4.88)#3,977 |
| 70. | Bronson | 7.9% | 3.1%(+4.80)#70 | 3.1%(+4.83)#4,021 |
| 71. | Carleton | 7.8% | 3.1%(+4.72)#71 | 3.1%(+4.76)#4,085 |
| 72. | Kingsley | 7.8% | 3.1%(+4.69)#72 | 3.1%(+4.72)#4,111 |
| 73. | Swartz Creek | 7.8% | 3.1%(+4.67)#73 | 3.1%(+4.71)#4,126 |
| 74. | Prescott | 7.8% | 3.1%(+4.66)#74 | 3.1%(+4.69)#4,140 |
| 75. | Marlette | 7.7% | 3.1%(+4.62)#75 | 3.1%(+4.66)#4,169 |
| 76. | Fennville | 7.7% | 3.1%(+4.61)#76 | 3.1%(+4.64)#4,178 |
| 77. | Lakes Of The North | 7.6% | 3.1%(+4.54)#77 | 3.1%(+4.57)#4,280 |
| 78. | Bay Port | 7.6% | 3.1%(+4.53)#78 | 3.1%(+4.56)#4,289 |
| 79. | Kinde | 7.6% | 3.1%(+4.50)#79 | 3.1%(+4.53)#4,323 |
| 80. | Brethren | 7.6% | 3.1%(+4.48)#80 | 3.1%(+4.51)#4,343 |
| 81. | Howard City | 7.5% | 3.1%(+4.40)#81 | 3.1%(+4.44)#4,423 |
| 82. | North Adams | 7.5% | 3.1%(+4.40)#82 | 3.1%(+4.43)#4,427 |
| 83. | Dodgeville | 7.5% | 3.1%(+4.39)#83 | 3.1%(+4.42)#4,448 |
| 84. | Carsonville | 7.4% | 3.1%(+4.29)#84 | 3.1%(+4.32)#4,534 |
| 85. | Filer City | 7.3% | 3.1%(+4.24)#85 | 3.1%(+4.27)#4,594 |
| 86. | Essexville | 7.3% | 3.1%(+4.21)#86 | 3.1%(+4.24)#4,638 |
| 87. | Caspian | 7.3% | 3.1%(+4.17)#87 | 3.1%(+4.20)#4,694 |
| 88. | West Branch | 7.2% | 3.1%(+4.10)#88 | 3.1%(+4.13)#4,774 |
| 89. | Comstock Northwest | 7.1% | 3.1%(+4.02)#89 | 3.1%(+4.06)#4,855 |
| 90. | Ossineke | 7.1% | 3.1%(+4.02)#90 | 3.1%(+4.06)#4,856 |
| 91. | Gobles | 7.1% | 3.1%(+4.02)#91 | 3.1%(+4.05)#4,867 |
| 92. | Horton Bay | 7.1% | 3.1%(+4.00)#92 | 3.1%(+4.03)#4,896 |
| 93. | Skidway Lake | 7.1% | 3.1%(+3.99)#93 | 3.1%(+4.02)#4,911 |
| 94. | Temperance | 7.1% | 3.1%(+3.96)#94 | 3.1%(+3.99)#4,939 |
| 95. | Lawrence | 7.1% | 3.1%(+3.96)#95 | 3.1%(+3.99)#4,940 |
| 96. | Imlay City | 6.8% | 3.1%(+3.74)#96 | 3.1%(+3.78)#5,183 |
| 97. | Concord | 6.8% | 3.1%(+3.73)#97 | 3.1%(+3.76)#5,214 |
| 98. | Buchanan | 6.8% | 3.1%(+3.69)#98 | 3.1%(+3.73)#5,272 |
| 99. | Ferrysburg | 6.8% | 3.1%(+3.66)#99 | 3.1%(+3.69)#5,315 |
| 100. | Fountain | 6.8% | 3.1%(+3.66)#100 | 3.1%(+3.69)#5,320 |
Common Questions
What are the Top 10 Cities with the Highest Percentage of Population Employed in Installation, Maintenance & Repair in Michigan?
Top 10 Cities with the Highest Percentage of Population Employed in Installation, Maintenance & Repair in Michigan are:
#1
38.5%
#2
22.7%
#3
21.5%
#4
20.4%
#5
16.4%
#6
16.1%
#7
15.2%
#8
14.3%
#9
14.1%
#10
13.9%
What city has the Highest Percentage of Population Employed in Installation, Maintenance & Repair in Michigan?
Conway has the Highest Percentage of Population Employed in Installation, Maintenance & Repair in Michigan with 38.5%.
What is the Percentage of Population Employed in Installation, Maintenance & Repair in the State of Michigan?
Percentage of Population Employed in Installation, Maintenance & Repair in Michigan is 3.1%.
What is the Percentage of Population Employed in Installation, Maintenance & Repair in the United States?
Percentage of Population Employed in Installation, Maintenance & Repair in the United States is 3.1%.