Cities with the Most Immigrants from Vietnam in California
RELATED REPORTS & OPTIONS
Vietnam
California
Compare Cities
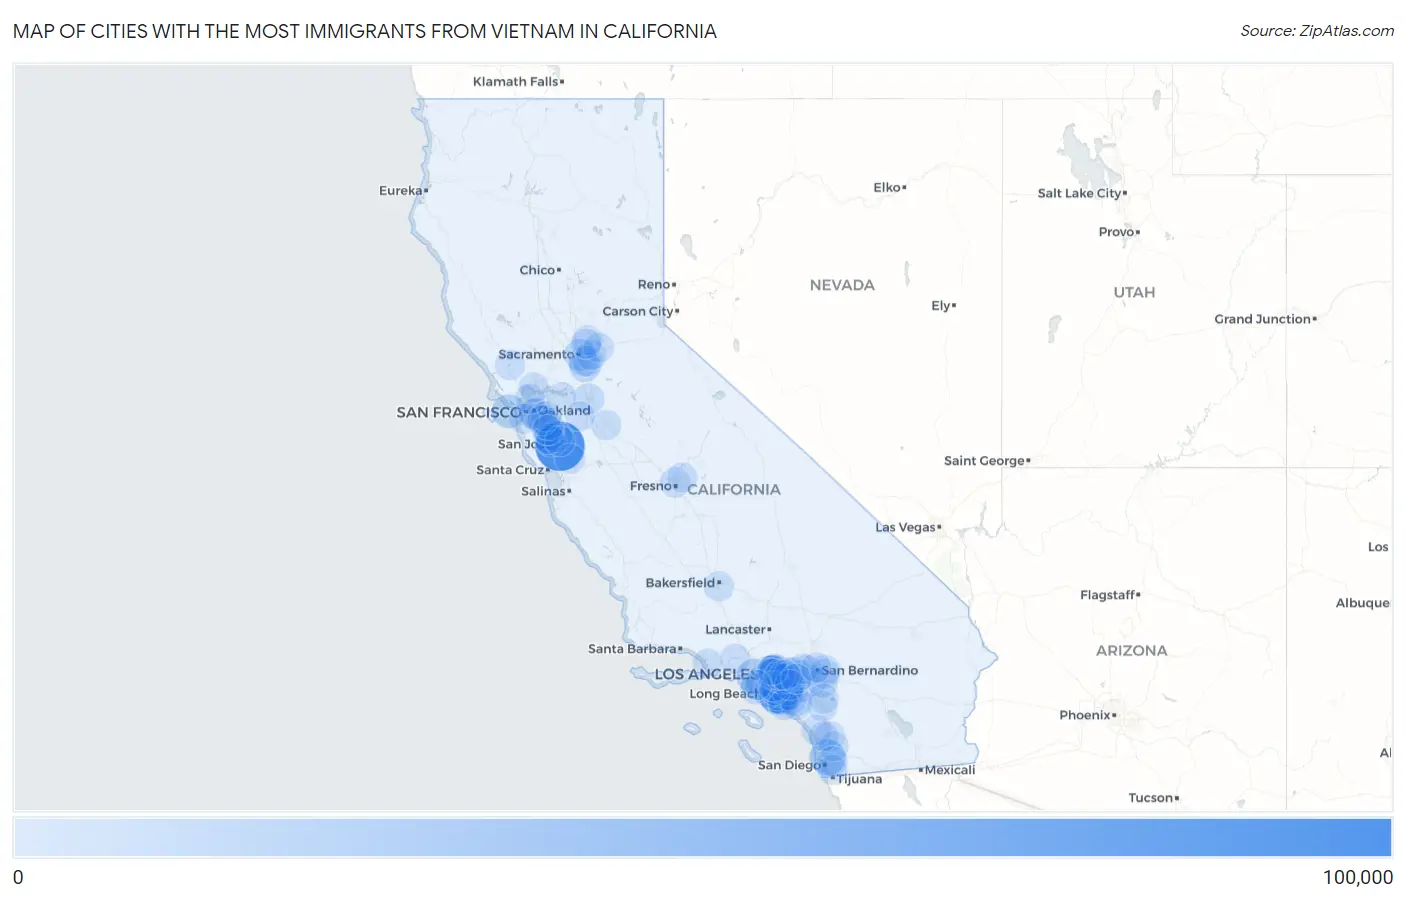
Map of Cities with the Most Immigrants from Vietnam in California
0
100,000
Cities with the Most Immigrants from Vietnam in California
| City | Vietnam | vs State | vs National | |
| 1. | San Jose | 81,213 | 512,335(15.85%)#1 | 1,349,684(6.02%)#1 |
| 2. | Garden Grove | 39,594 | 512,335(7.73%)#2 | 1,349,684(2.93%)#2 |
| 3. | Westminster | 27,434 | 512,335(5.35%)#3 | 1,349,684(2.03%)#4 |
| 4. | San Diego | 24,509 | 512,335(4.78%)#4 | 1,349,684(1.82%)#5 |
| 5. | Los Angeles | 18,876 | 512,335(3.68%)#5 | 1,349,684(1.40%)#6 |
| 6. | Santa Ana | 16,542 | 512,335(3.23%)#6 | 1,349,684(1.23%)#7 |
| 7. | San Francisco | 14,746 | 512,335(2.88%)#7 | 1,349,684(1.09%)#8 |
| 8. | Anaheim | 14,160 | 512,335(2.76%)#8 | 1,349,684(1.05%)#10 |
| 9. | El Monte | 10,416 | 512,335(2.03%)#9 | 1,349,684(0.77%)#14 |
| 10. | Rosemead | 9,504 | 512,335(1.86%)#10 | 1,349,684(0.70%)#16 |
| 11. | Fountain Valley | 8,447 | 512,335(1.65%)#11 | 1,349,684(0.63%)#18 |
| 12. | Oakland | 7,875 | 512,335(1.54%)#12 | 1,349,684(0.58%)#20 |
| 13. | Sacramento | 7,446 | 512,335(1.45%)#13 | 1,349,684(0.55%)#23 |
| 14. | Milpitas | 7,275 | 512,335(1.42%)#14 | 1,349,684(0.54%)#24 |
| 15. | Huntington Beach | 6,752 | 512,335(1.32%)#15 | 1,349,684(0.50%)#25 |
| 16. | Irvine | 6,631 | 512,335(1.29%)#16 | 1,349,684(0.49%)#26 |
| 17. | Elk Grove | 6,326 | 512,335(1.23%)#17 | 1,349,684(0.47%)#27 |
| 18. | Stanton | 5,338 | 512,335(1.04%)#18 | 1,349,684(0.40%)#32 |
| 19. | Alhambra | 5,125 | 512,335(1.00%)#19 | 1,349,684(0.38%)#33 |
| 20. | San Gabriel | 4,604 | 512,335(0.90%)#20 | 1,349,684(0.34%)#36 |
| 21. | Monterey Park | 3,970 | 512,335(0.77%)#21 | 1,349,684(0.29%)#41 |
| 22. | Fremont | 3,913 | 512,335(0.76%)#22 | 1,349,684(0.29%)#42 |
| 23. | Stockton | 3,791 | 512,335(0.74%)#23 | 1,349,684(0.28%)#44 |
| 24. | Hayward | 3,775 | 512,335(0.74%)#24 | 1,349,684(0.28%)#45 |
| 25. | Florin | 3,623 | 512,335(0.71%)#25 | 1,349,684(0.27%)#48 |
| 26. | West Covina | 3,260 | 512,335(0.64%)#26 | 1,349,684(0.24%)#53 |
| 27. | Vineyard | 3,108 | 512,335(0.61%)#27 | 1,349,684(0.23%)#57 |
| 28. | Baldwin Park | 2,876 | 512,335(0.56%)#28 | 1,349,684(0.21%)#60 |
| 29. | San Leandro | 2,746 | 512,335(0.54%)#29 | 1,349,684(0.20%)#62 |
| 30. | Orange | 2,741 | 512,335(0.54%)#30 | 1,349,684(0.20%)#63 |
| 31. | Santa Clara | 2,683 | 512,335(0.52%)#31 | 1,349,684(0.20%)#66 |
| 32. | Temple City | 2,590 | 512,335(0.51%)#32 | 1,349,684(0.19%)#70 |
| 33. | Midway City | 2,337 | 512,335(0.46%)#33 | 1,349,684(0.17%)#74 |
| 34. | Riverside | 2,265 | 512,335(0.44%)#34 | 1,349,684(0.17%)#76 |
| 35. | Torrance | 2,187 | 512,335(0.43%)#35 | 1,349,684(0.16%)#78 |
| 36. | Sunnyvale | 2,001 | 512,335(0.39%)#36 | 1,349,684(0.15%)#83 |
| 37. | Long Beach | 1,991 | 512,335(0.39%)#37 | 1,349,684(0.15%)#84 |
| 38. | Costa Mesa | 1,934 | 512,335(0.38%)#38 | 1,349,684(0.14%)#86 |
| 39. | Fresno | 1,906 | 512,335(0.37%)#39 | 1,349,684(0.14%)#90 |
| 40. | Mission Viejo | 1,855 | 512,335(0.36%)#40 | 1,349,684(0.14%)#93 |
| 41. | Corona | 1,702 | 512,335(0.33%)#41 | 1,349,684(0.13%)#101 |
| 42. | Fullerton | 1,686 | 512,335(0.33%)#42 | 1,349,684(0.12%)#102 |
| 43. | Tustin | 1,634 | 512,335(0.32%)#43 | 1,349,684(0.12%)#107 |
| 44. | Alameda | 1,582 | 512,335(0.31%)#44 | 1,349,684(0.12%)#109 |
| 45. | Antioch | 1,557 | 512,335(0.30%)#45 | 1,349,684(0.12%)#111 |
| 46. | Lake Forest | 1,527 | 512,335(0.30%)#46 | 1,349,684(0.11%)#112 |
| 47. | Union City | 1,412 | 512,335(0.28%)#47 | 1,349,684(0.10%)#118 |
| 48. | Gardena | 1,406 | 512,335(0.27%)#48 | 1,349,684(0.10%)#120 |
| 49. | Arcadia | 1,404 | 512,335(0.27%)#49 | 1,349,684(0.10%)#121 |
| 50. | South San Gabriel | 1,359 | 512,335(0.27%)#50 | 1,349,684(0.10%)#123 |
| 51. | Castro Valley | 1,314 | 512,335(0.26%)#51 | 1,349,684(0.10%)#127 |
| 52. | Buena Park | 1,304 | 512,335(0.25%)#52 | 1,349,684(0.10%)#128 |
| 53. | Montclair | 1,281 | 512,335(0.25%)#53 | 1,349,684(0.09%)#130 |
| 54. | Escondido | 1,261 | 512,335(0.25%)#54 | 1,349,684(0.09%)#136 |
| 55. | Bakersfield | 1,249 | 512,335(0.24%)#55 | 1,349,684(0.09%)#141 |
| 56. | Fontana | 1,231 | 512,335(0.24%)#56 | 1,349,684(0.09%)#145 |
| 57. | Ontario | 1,228 | 512,335(0.24%)#57 | 1,349,684(0.09%)#146 |
| 58. | South El Monte | 1,228 | 512,335(0.24%)#58 | 1,349,684(0.09%)#147 |
| 59. | Daly City | 1,222 | 512,335(0.24%)#59 | 1,349,684(0.09%)#149 |
| 60. | Cypress | 1,218 | 512,335(0.24%)#60 | 1,349,684(0.09%)#151 |
| 61. | Hacienda Heights | 1,166 | 512,335(0.23%)#61 | 1,349,684(0.09%)#158 |
| 62. | Santa Rosa | 1,161 | 512,335(0.23%)#62 | 1,349,684(0.09%)#159 |
| 63. | Pomona | 1,155 | 512,335(0.23%)#63 | 1,349,684(0.09%)#160 |
| 64. | Oceanside | 1,126 | 512,335(0.22%)#64 | 1,349,684(0.08%)#162 |
| 65. | Rowland Heights | 1,126 | 512,335(0.22%)#65 | 1,349,684(0.08%)#163 |
| 66. | Morgan Hill | 1,096 | 512,335(0.21%)#66 | 1,349,684(0.08%)#166 |
| 67. | Highland | 1,081 | 512,335(0.21%)#67 | 1,349,684(0.08%)#168 |
| 68. | Murrieta | 1,080 | 512,335(0.21%)#68 | 1,349,684(0.08%)#169 |
| 69. | Cerritos | 1,035 | 512,335(0.20%)#69 | 1,349,684(0.08%)#175 |
| 70. | Rancho Cordova | 1,028 | 512,335(0.20%)#70 | 1,349,684(0.08%)#176 |
| 71. | La Puente | 1,007 | 512,335(0.20%)#71 | 1,349,684(0.07%)#178 |
| 72. | Rancho Cucamonga | 952 | 512,335(0.19%)#72 | 1,349,684(0.07%)#188 |
| 73. | Chula Vista | 943 | 512,335(0.18%)#73 | 1,349,684(0.07%)#191 |
| 74. | Moreno Valley | 936 | 512,335(0.18%)#74 | 1,349,684(0.07%)#194 |
| 75. | Roseville | 922 | 512,335(0.18%)#75 | 1,349,684(0.07%)#198 |
| 76. | Diamond Bar | 920 | 512,335(0.18%)#76 | 1,349,684(0.07%)#199 |
| 77. | San Lorenzo | 917 | 512,335(0.18%)#77 | 1,349,684(0.07%)#200 |
| 78. | Walnut | 914 | 512,335(0.18%)#78 | 1,349,684(0.07%)#201 |
| 79. | Folsom | 911 | 512,335(0.18%)#79 | 1,349,684(0.07%)#202 |
| 80. | Oxnard | 908 | 512,335(0.18%)#80 | 1,349,684(0.07%)#204 |
| 81. | Yorba Linda | 896 | 512,335(0.17%)#81 | 1,349,684(0.07%)#207 |
| 82. | Simi Valley | 890 | 512,335(0.17%)#82 | 1,349,684(0.07%)#209 |
| 83. | Redlands | 888 | 512,335(0.17%)#83 | 1,349,684(0.07%)#210 |
| 84. | Richmond | 875 | 512,335(0.17%)#84 | 1,349,684(0.06%)#213 |
| 85. | Alum Rock | 875 | 512,335(0.17%)#85 | 1,349,684(0.06%)#214 |
| 86. | Modesto | 874 | 512,335(0.17%)#86 | 1,349,684(0.06%)#215 |
| 87. | San Bernardino | 855 | 512,335(0.17%)#87 | 1,349,684(0.06%)#218 |
| 88. | Menifee | 839 | 512,335(0.16%)#88 | 1,349,684(0.06%)#223 |
| 89. | East San Gabriel | 839 | 512,335(0.16%)#89 | 1,349,684(0.06%)#224 |
| 90. | Poway | 838 | 512,335(0.16%)#90 | 1,349,684(0.06%)#225 |
| 91. | Lawndale | 796 | 512,335(0.16%)#91 | 1,349,684(0.06%)#230 |
| 92. | Vallejo | 786 | 512,335(0.15%)#92 | 1,349,684(0.06%)#232 |
| 93. | San Marcos | 779 | 512,335(0.15%)#93 | 1,349,684(0.06%)#235 |
| 94. | La Mesa | 776 | 512,335(0.15%)#94 | 1,349,684(0.06%)#236 |
| 95. | Newark | 762 | 512,335(0.15%)#95 | 1,349,684(0.06%)#242 |
| 96. | Clovis | 741 | 512,335(0.14%)#96 | 1,349,684(0.05%)#252 |
| 97. | Newport Beach | 733 | 512,335(0.14%)#97 | 1,349,684(0.05%)#253 |
| 98. | Chino | 732 | 512,335(0.14%)#98 | 1,349,684(0.05%)#254 |
| 99. | Antelope | 716 | 512,335(0.14%)#99 | 1,349,684(0.05%)#258 |
| 100. | Tracy | 689 | 512,335(0.13%)#100 | 1,349,684(0.05%)#265 |
Common Questions
What are the Top 10 Cities with the Most Immigrants from Vietnam in California?
Top 10 Cities with the Most Immigrants from Vietnam in California are:
#1
81,213
#2
39,594
#3
27,434
#4
24,509
#5
18,876
#6
16,542
#7
14,746
#8
14,160
#9
10,416
#10
9,504
What city has the Most Immigrants from Vietnam in California?
San Jose has the Most Immigrants from Vietnam in California with 81,213.
What is the Total Immigrants from Vietnam in the State of California?
Total Immigrants from Vietnam in California is 512,335.
What is the Total Immigrants from Vietnam in the United States?
Total Immigrants from Vietnam in the United States is 1,349,684.