Buttonwillow, CA Map & Demographics
Buttonwillow Map
Buttonwillow Overview
$18,173
PER CAPITA INCOME
$32,054
AVG FAMILY INCOME
$38,750
AVG HOUSEHOLD INCOME
40.0%
WAGE / INCOME GAP [ % ]
60.0¢/ $1
WAGE / INCOME GAP [ $ ]
$9,683
FAMILY INCOME DEFICIT
0.51
INEQUALITY / GINI INDEX
1,148
TOTAL POPULATION
594
MALE POPULATION
554
FEMALE POPULATION
107.22
MALES / 100 FEMALES
93.27
FEMALES / 100 MALES
28.7
MEDIAN AGE
3.8
AVG FAMILY SIZE
3.4
AVG HOUSEHOLD SIZE
385
LABOR FORCE [ PEOPLE ]
48.4%
PERCENT IN LABOR FORCE
8.8%
UNEMPLOYMENT RATE
Buttonwillow Zip Codes
Buttonwillow Area Codes
Income in Buttonwillow
Income Overview in Buttonwillow
Per Capita Income in Buttonwillow is $18,173, while median incomes of families and households are $32,054 and $38,750 respectively.
| Characteristic | Number | Measure |
| Per Capita Income | 1,148 | $18,173 |
| Median Family Income | 273 | $32,054 |
| Mean Family Income | 273 | $55,174 |
| Median Household Income | 342 | $38,750 |
| Mean Household Income | 342 | $56,492 |
| Income Deficit | 273 | $9,683 |
| Wage / Income Gap (%) | 1,148 | 39.97% |
| Wage / Income Gap ($) | 1,148 | 60.03¢ per $1 |
| Gini / Inequality Index | 1,148 | 0.51 |
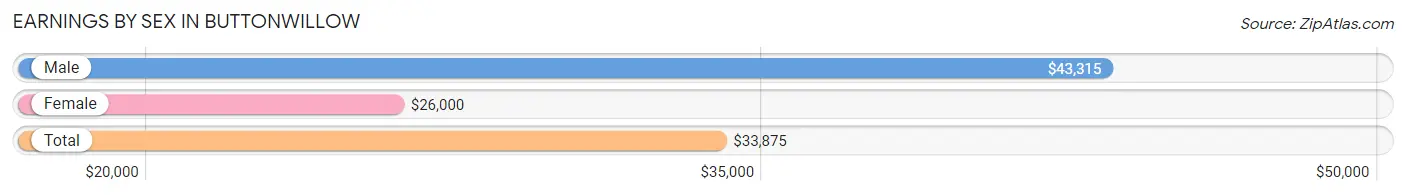
Earnings by Sex in Buttonwillow
Average Earnings in Buttonwillow are $33,875, $43,315 for men and $26,000 for women, a difference of 40.0%.
| Sex | Number | Average Earnings |
| Male | 251 (63.5%) | $43,315 |
| Female | 144 (36.5%) | $26,000 |
| Total | 395 (100.0%) | $33,875 |
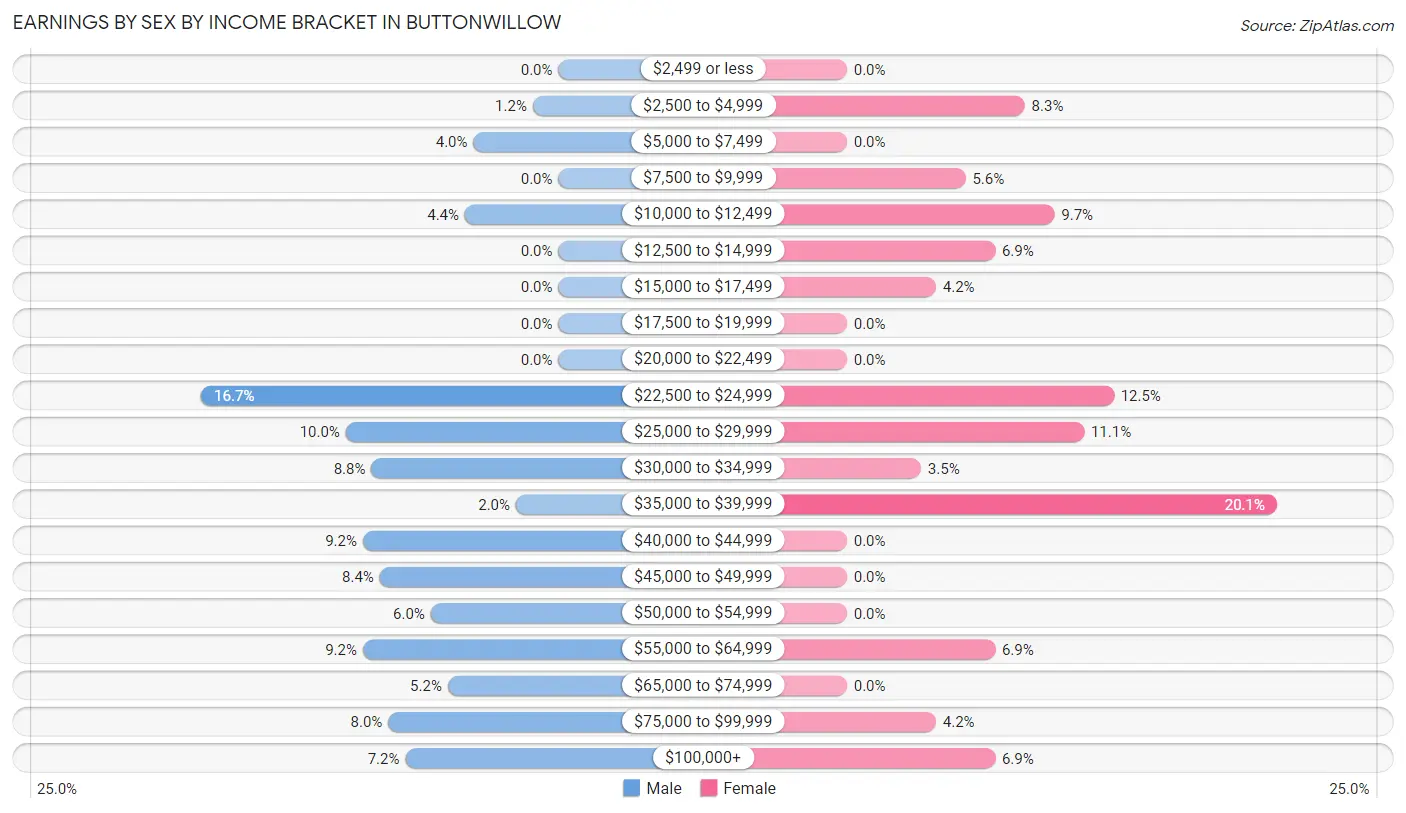
Earnings by Sex by Income Bracket in Buttonwillow
The most common earnings brackets in Buttonwillow are $22,500 to $24,999 for men (42 | 16.7%) and $35,000 to $39,999 for women (29 | 20.1%).
| Income | Male | Female |
| $2,499 or less | 0 (0.0%) | 0 (0.0%) |
| $2,500 to $4,999 | 3 (1.2%) | 12 (8.3%) |
| $5,000 to $7,499 | 10 (4.0%) | 0 (0.0%) |
| $7,500 to $9,999 | 0 (0.0%) | 8 (5.6%) |
| $10,000 to $12,499 | 11 (4.4%) | 14 (9.7%) |
| $12,500 to $14,999 | 0 (0.0%) | 10 (6.9%) |
| $15,000 to $17,499 | 0 (0.0%) | 6 (4.2%) |
| $17,500 to $19,999 | 0 (0.0%) | 0 (0.0%) |
| $20,000 to $22,499 | 0 (0.0%) | 0 (0.0%) |
| $22,500 to $24,999 | 42 (16.7%) | 18 (12.5%) |
| $25,000 to $29,999 | 25 (10.0%) | 16 (11.1%) |
| $30,000 to $34,999 | 22 (8.8%) | 5 (3.5%) |
| $35,000 to $39,999 | 5 (2.0%) | 29 (20.1%) |
| $40,000 to $44,999 | 23 (9.2%) | 0 (0.0%) |
| $45,000 to $49,999 | 21 (8.4%) | 0 (0.0%) |
| $50,000 to $54,999 | 15 (6.0%) | 0 (0.0%) |
| $55,000 to $64,999 | 23 (9.2%) | 10 (6.9%) |
| $65,000 to $74,999 | 13 (5.2%) | 0 (0.0%) |
| $75,000 to $99,999 | 20 (8.0%) | 6 (4.2%) |
| $100,000+ | 18 (7.2%) | 10 (6.9%) |
| Total | 251 (100.0%) | 144 (100.0%) |
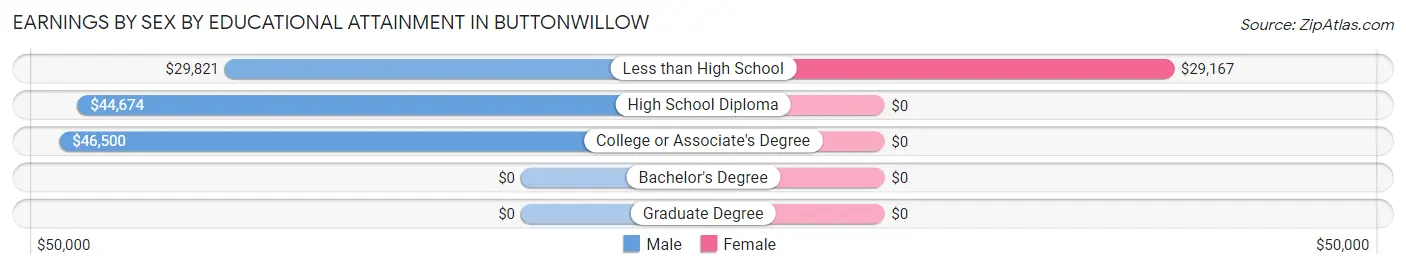
Earnings by Sex by Educational Attainment in Buttonwillow
Average earnings in Buttonwillow are $44,130 for men and $27,125 for women, a difference of 38.5%. Men with an educational attainment of college or associate's degree enjoy the highest average annual earnings of $46,500, while those with less than high school education earn the least with $29,821. Women with an educational attainment of less than high school earn the most with the average annual earnings of $29,167, while those with less than high school education have the smallest earnings of $29,167.
| Educational Attainment | Male Income | Female Income |
| Less than High School | $29,821 | $29,167 |
| High School Diploma | $44,674 | $0 |
| College or Associate's Degree | $46,500 | $0 |
| Bachelor's Degree | - | - |
| Graduate Degree | - | - |
| Total | $44,130 | $27,125 |
Family Income in Buttonwillow
Family Income Brackets in Buttonwillow
According to the Buttonwillow family income data, there are 54 families falling into the $10,000 to $14,999 income range, which is the most common income bracket and makes up 19.8% of all families.
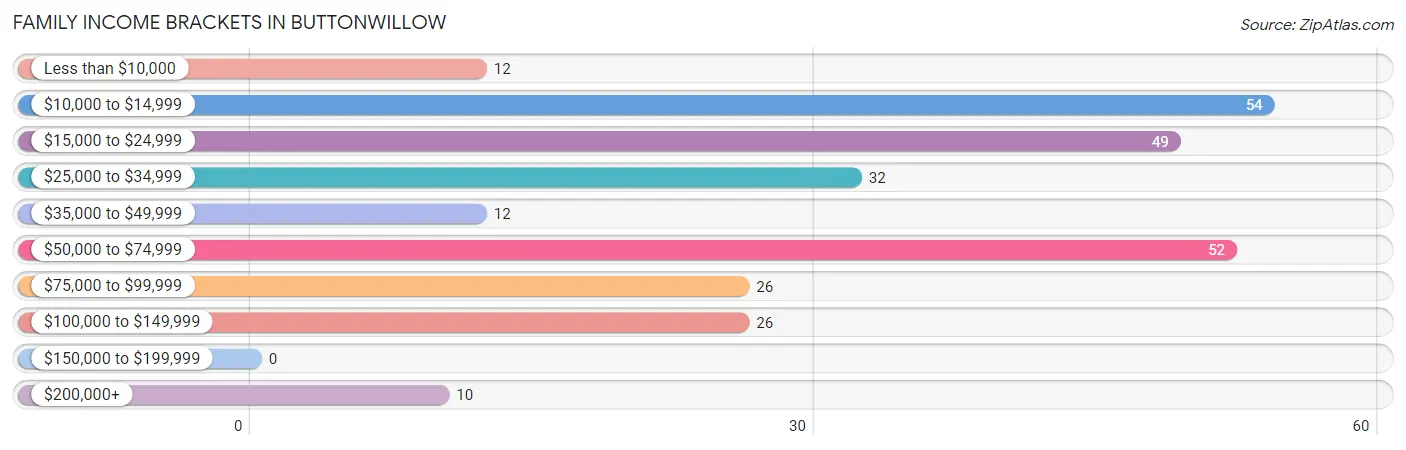
| Income Bracket | # Families | % Families |
| Less than $10,000 | 12 | 4.4% |
| $10,000 to $14,999 | 54 | 19.8% |
| $15,000 to $24,999 | 49 | 17.9% |
| $25,000 to $34,999 | 32 | 11.7% |
| $35,000 to $49,999 | 12 | 4.4% |
| $50,000 to $74,999 | 52 | 19.0% |
| $75,000 to $99,999 | 26 | 9.5% |
| $100,000 to $149,999 | 26 | 9.5% |
| $150,000 to $199,999 | 0 | 0.0% |
| $200,000+ | 10 | 3.7% |
Family Income by Famaliy Size in Buttonwillow
6-person families (46 | 16.9%) account for the highest median family income in Buttonwillow with $98,542 per family, while 6-person families (46 | 16.9%) have the highest median income of $16,424 per family member.
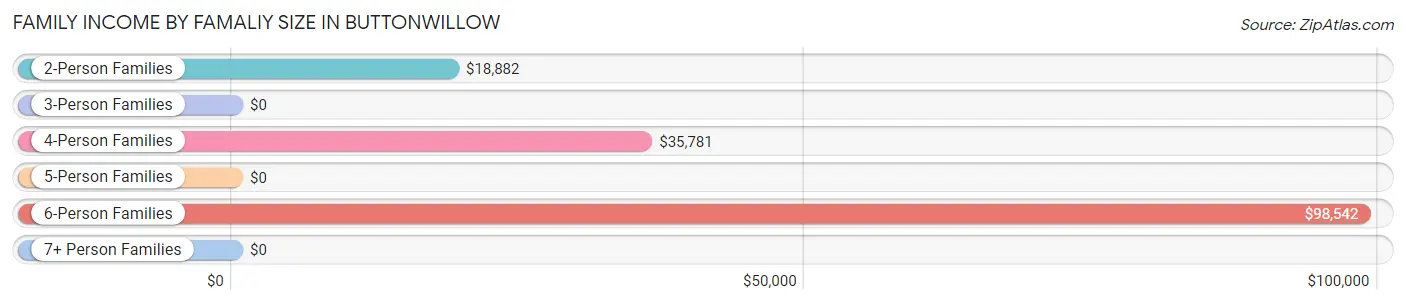
| Income Bracket | # Families | Median Income |
| 2-Person Families | 105 (38.5%) | $18,882 |
| 3-Person Families | 45 (16.5%) | $0 |
| 4-Person Families | 51 (18.7%) | $35,781 |
| 5-Person Families | 26 (9.5%) | $0 |
| 6-Person Families | 46 (16.9%) | $98,542 |
| 7+ Person Families | 0 (0.0%) | $0 |
| Total | 273 (100.0%) | $32,054 |
Family Income by Number of Earners in Buttonwillow
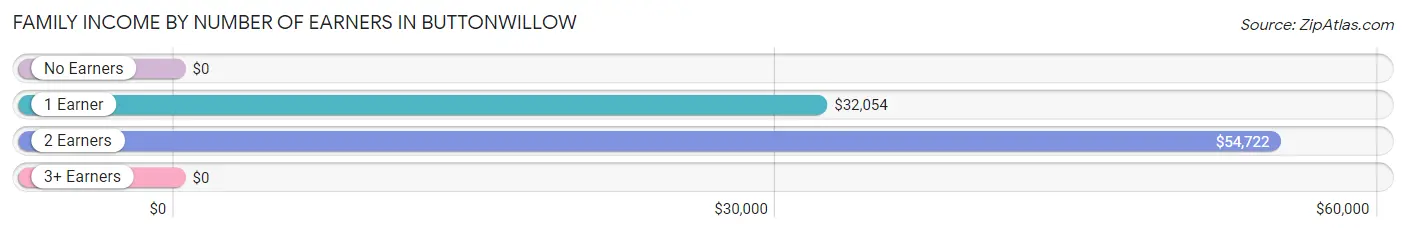
| Number of Earners | # Families | Median Income |
| No Earners | 79 (28.9%) | $0 |
| 1 Earner | 115 (42.1%) | $32,054 |
| 2 Earners | 54 (19.8%) | $54,722 |
| 3+ Earners | 25 (9.2%) | $0 |
| Total | 273 (100.0%) | $32,054 |
Household Income in Buttonwillow
Household Income Brackets in Buttonwillow
With 61 households falling in the category, the $10,000 to $14,999 income range is the most frequent in Buttonwillow, accounting for 17.8% of all households. In contrast, only 4 households (1.2%) fall into the $150,000 to $199,999 income bracket, making it the least populous group.
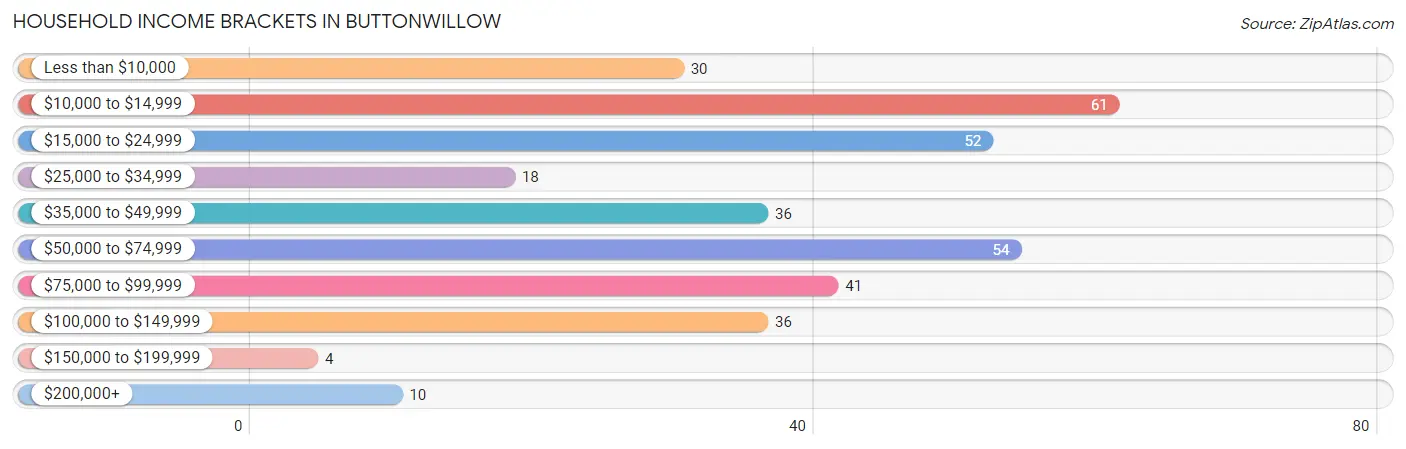
| Income Bracket | # Households | % Households |
| Less than $10,000 | 30 | 8.8% |
| $10,000 to $14,999 | 61 | 17.8% |
| $15,000 to $24,999 | 52 | 15.2% |
| $25,000 to $34,999 | 18 | 5.3% |
| $35,000 to $49,999 | 36 | 10.5% |
| $50,000 to $74,999 | 54 | 15.8% |
| $75,000 to $99,999 | 41 | 12.0% |
| $100,000 to $149,999 | 36 | 10.5% |
| $150,000 to $199,999 | 4 | 1.2% |
| $200,000+ | 10 | 2.9% |
Household Income by Householder Age in Buttonwillow
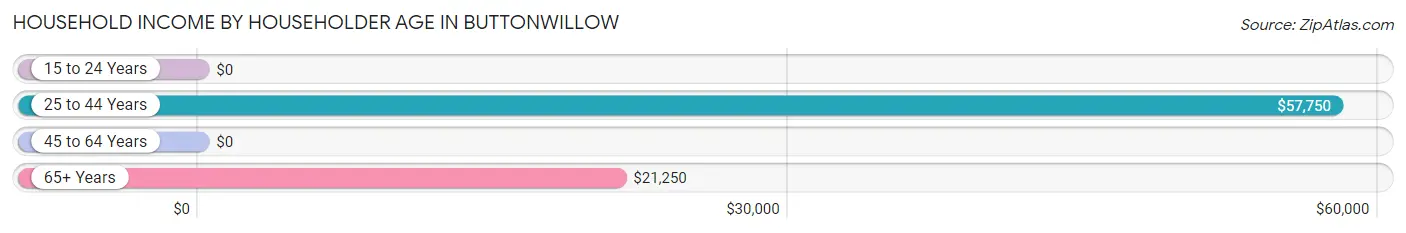
The median household income in Buttonwillow is $38,750, with the highest median household income of $57,750 found in the 25 to 44 years age bracket for the primary householder. A total of 142 households (41.5%) fall into this category. Meanwhile, the 15 to 24 years age bracket for the primary householder has the lowest median household income of $0, with 9 households (2.6%) in this group.
| Income Bracket | # Households | Median Income |
| 15 to 24 Years | 9 (2.6%) | $0 |
| 25 to 44 Years | 142 (41.5%) | $57,750 |
| 45 to 64 Years | 111 (32.5%) | $0 |
| 65+ Years | 80 (23.4%) | $21,250 |
| Total | 342 (100.0%) | $38,750 |
Poverty in Buttonwillow
Income Below Poverty by Sex and Age in Buttonwillow
With 22.3% poverty level for males and 28.3% for females among the residents of Buttonwillow, 12 to 14 year old males and 55 to 64 year old females are the most vulnerable to poverty, with 14 males (58.3%) and 28 females (56.0%) in their respective age groups living below the poverty level.
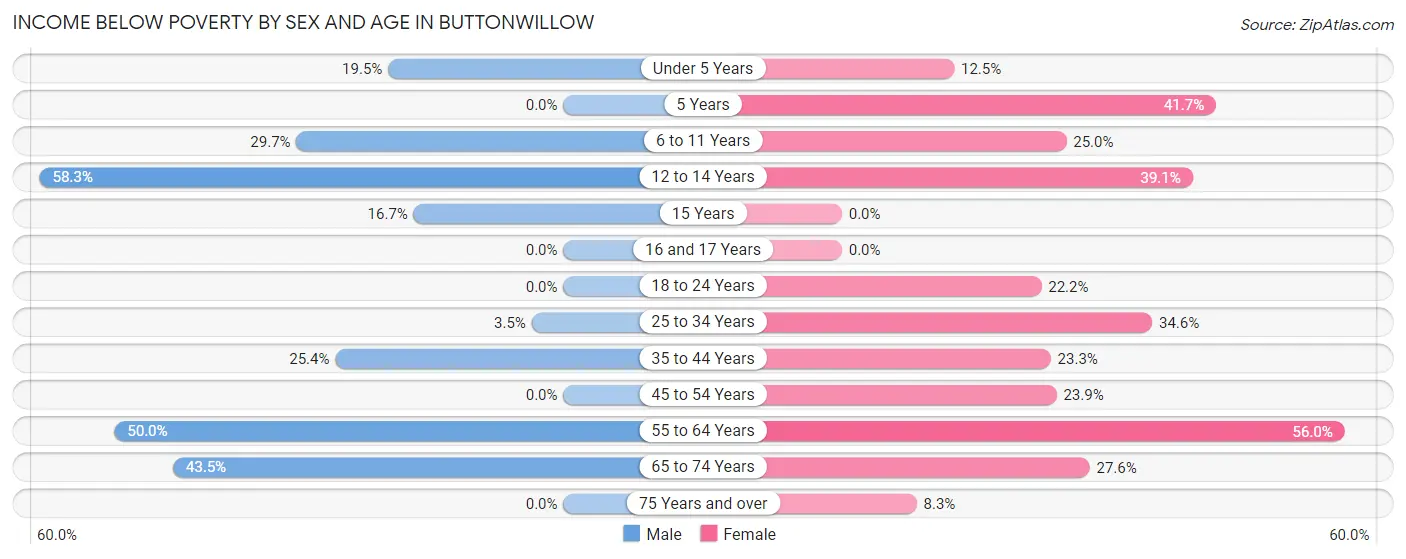
| Age Bracket | Male | Female |
| Under 5 Years | 8 (19.5%) | 3 (12.5%) |
| 5 Years | 0 (0.0%) | 10 (41.7%) |
| 6 to 11 Years | 22 (29.7%) | 18 (25.0%) |
| 12 to 14 Years | 14 (58.3%) | 25 (39.1%) |
| 15 Years | 4 (16.7%) | 0 (0.0%) |
| 16 and 17 Years | 0 (0.0%) | 0 (0.0%) |
| 18 to 24 Years | 0 (0.0%) | 12 (22.2%) |
| 25 to 34 Years | 3 (3.5%) | 19 (34.5%) |
| 35 to 44 Years | 16 (25.4%) | 20 (23.3%) |
| 45 to 54 Years | 0 (0.0%) | 11 (23.9%) |
| 55 to 64 Years | 45 (50.0%) | 28 (56.0%) |
| 65 to 74 Years | 20 (43.5%) | 8 (27.6%) |
| 75 Years and over | 0 (0.0%) | 3 (8.3%) |
| Total | 132 (22.3%) | 157 (28.3%) |
Income Above Poverty by Sex and Age in Buttonwillow
According to the poverty statistics in Buttonwillow, males aged 5 years and females aged 16 and 17 years are the age groups that are most secure financially, with 100.0% of males and 100.0% of females in these age groups living above the poverty line.
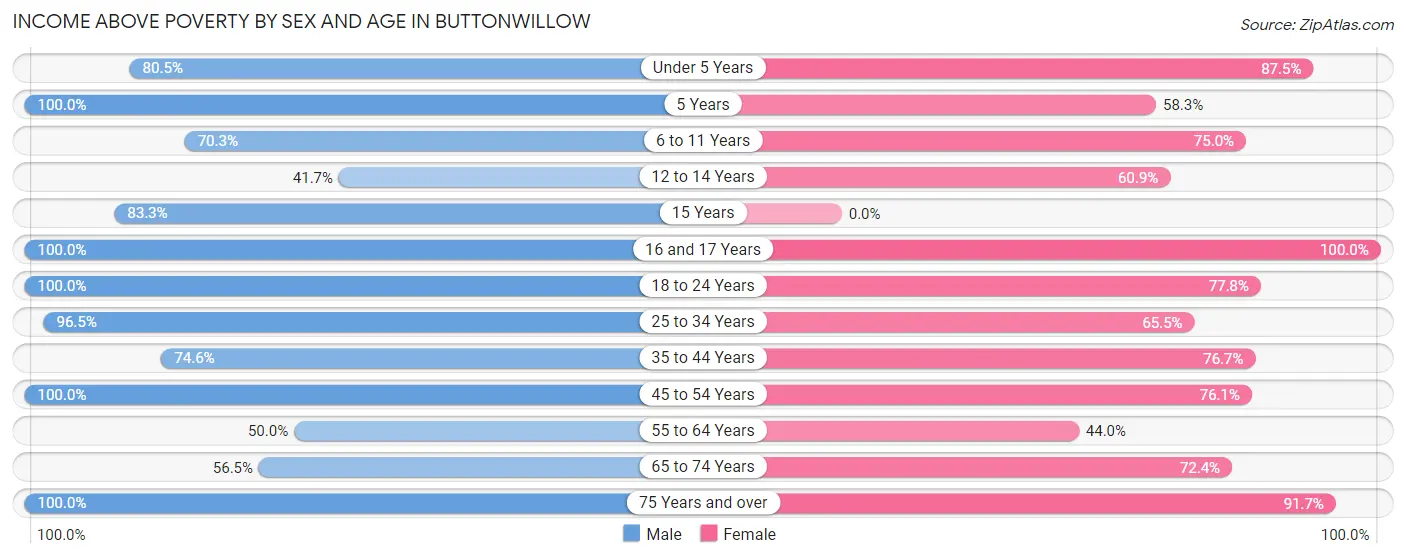
| Age Bracket | Male | Female |
| Under 5 Years | 33 (80.5%) | 21 (87.5%) |
| 5 Years | 4 (100.0%) | 14 (58.3%) |
| 6 to 11 Years | 52 (70.3%) | 54 (75.0%) |
| 12 to 14 Years | 10 (41.7%) | 39 (60.9%) |
| 15 Years | 20 (83.3%) | 0 (0.0%) |
| 16 and 17 Years | 25 (100.0%) | 14 (100.0%) |
| 18 to 24 Years | 61 (100.0%) | 42 (77.8%) |
| 25 to 34 Years | 82 (96.5%) | 36 (65.4%) |
| 35 to 44 Years | 47 (74.6%) | 66 (76.7%) |
| 45 to 54 Years | 29 (100.0%) | 35 (76.1%) |
| 55 to 64 Years | 45 (50.0%) | 22 (44.0%) |
| 65 to 74 Years | 26 (56.5%) | 21 (72.4%) |
| 75 Years and over | 25 (100.0%) | 33 (91.7%) |
| Total | 459 (77.7%) | 397 (71.7%) |
Income Below Poverty Among Married-Couple Families in Buttonwillow
The poverty statistics for married-couple families in Buttonwillow show that 30.7% or 54 of the total 176 families live below the poverty line. Families with 3 or 4 children have the highest poverty rate of 55.6%, comprising of 15 families. On the other hand, families with 1 or 2 children have the lowest poverty rate of 1.6%, which includes 1 families.
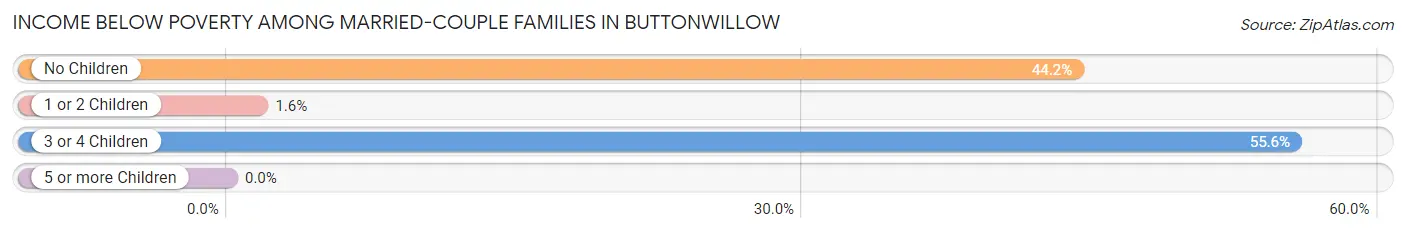
| Children | Above Poverty | Below Poverty |
| No Children | 48 (55.8%) | 38 (44.2%) |
| 1 or 2 Children | 62 (98.4%) | 1 (1.6%) |
| 3 or 4 Children | 12 (44.4%) | 15 (55.6%) |
| 5 or more Children | 0 (0.0%) | 0 (0.0%) |
| Total | 122 (69.3%) | 54 (30.7%) |
Income Below Poverty Among Single-Parent Households in Buttonwillow
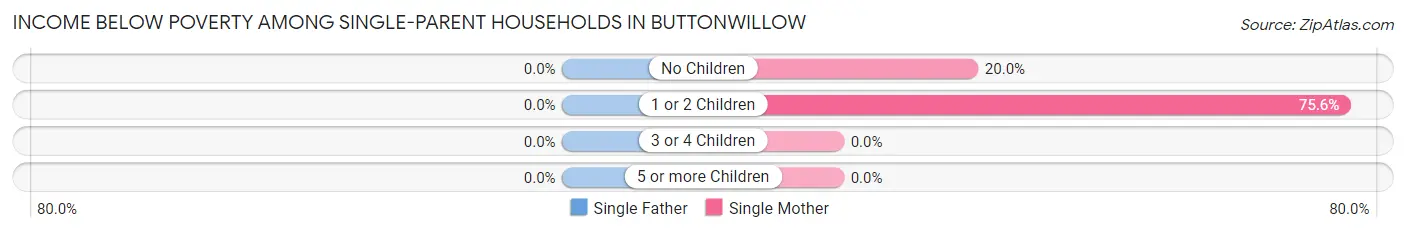
| Children | Single Father | Single Mother |
| No Children | 0 (0.0%) | 3 (20.0%) |
| 1 or 2 Children | 0 (0.0%) | 31 (75.6%) |
| 3 or 4 Children | 0 (0.0%) | 0 (0.0%) |
| 5 or more Children | 0 (0.0%) | 0 (0.0%) |
| Total | 0 (0.0%) | 34 (51.5%) |
Income Below Poverty Among Married-Couple vs Single-Parent Households in Buttonwillow
The poverty data for Buttonwillow shows that 54 of the married-couple family households (30.7%) and 34 of the single-parent households (35.0%) are living below the poverty level. Within the married-couple family households, those with 3 or 4 children have the highest poverty rate, with 15 households (55.6%) falling below the poverty line. Among the single-parent households, those with 1 or 2 children have the highest poverty rate, with 31 household (66.0%) living below poverty.
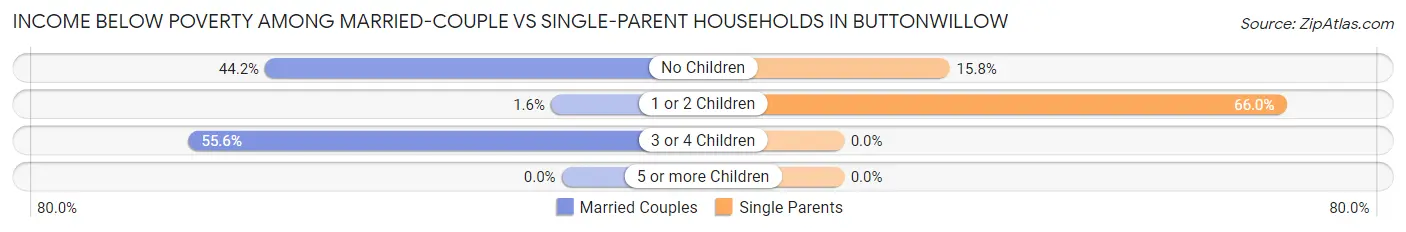
| Children | Married-Couple Families | Single-Parent Households |
| No Children | 38 (44.2%) | 3 (15.8%) |
| 1 or 2 Children | 1 (1.6%) | 31 (66.0%) |
| 3 or 4 Children | 15 (55.6%) | 0 (0.0%) |
| 5 or more Children | 0 (0.0%) | 0 (0.0%) |
| Total | 54 (30.7%) | 34 (35.0%) |
Race in Buttonwillow
The most populous races in Buttonwillow are Hispanic or Latino (974 | 84.8%), White / Caucasian (589 | 51.3%), and Two or more Races (290 | 25.3%).
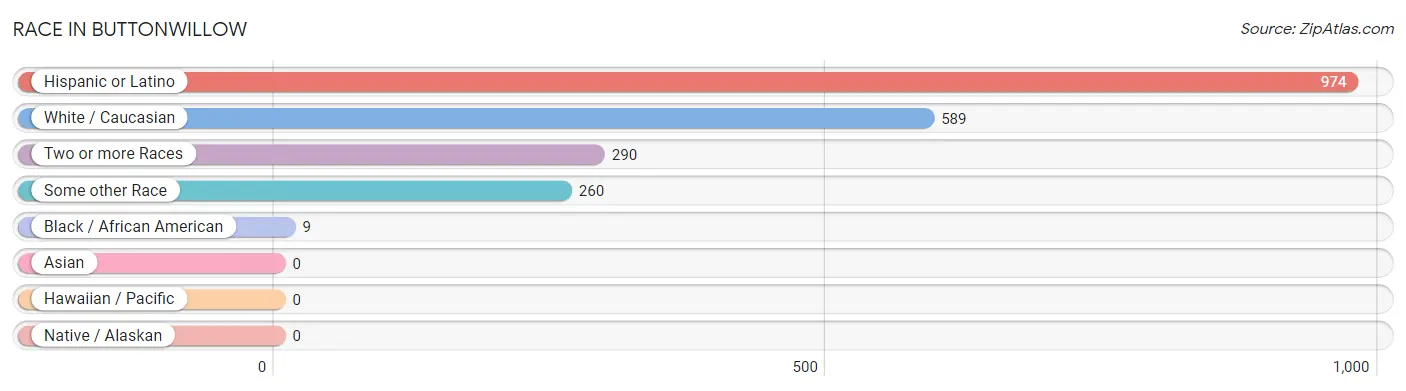
| Race | # Population | % Population |
| Asian | 0 | 0.0% |
| Black / African American | 9 | 0.8% |
| Hawaiian / Pacific | 0 | 0.0% |
| Hispanic or Latino | 974 | 84.8% |
| Native / Alaskan | 0 | 0.0% |
| White / Caucasian | 589 | 51.3% |
| Two or more Races | 290 | 25.3% |
| Some other Race | 260 | 22.7% |
| Total | 1,148 | 100.0% |
Ancestry in Buttonwillow
The most populous ancestries reported in Buttonwillow are Mexican (956 | 83.3%), German (83 | 7.2%), Italian (32 | 2.8%), American (17 | 1.5%), and Irish (11 | 1.0%), together accounting for 95.7% of all Buttonwillow residents.
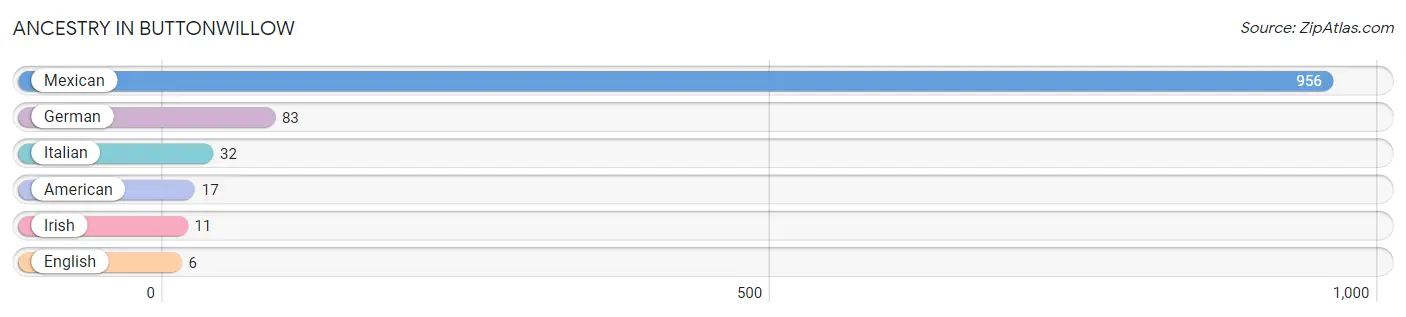
| Ancestry | # Population | % Population |
| American | 17 | 1.5% |
| English | 6 | 0.5% |
| German | 83 | 7.2% |
| Irish | 11 | 1.0% |
| Italian | 32 | 2.8% |
| Mexican | 956 | 83.3% | View All 6 Rows |
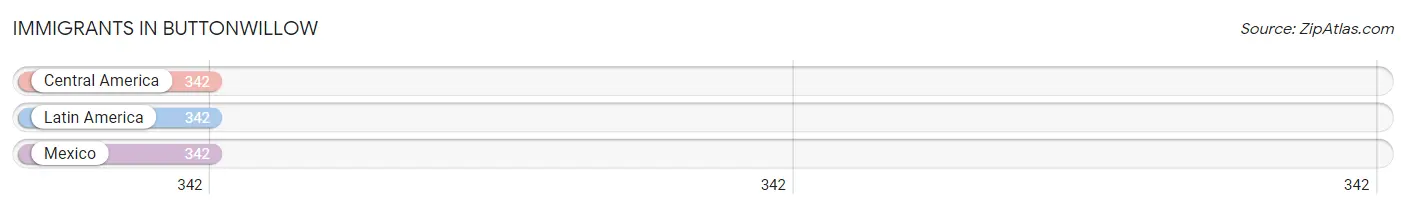
Immigrants in Buttonwillow
The most numerous immigrant groups reported in Buttonwillow came from Central America (342 | 29.8%), Latin America (342 | 29.8%), and Mexico (342 | 29.8%), together accounting for 89.4% of all Buttonwillow residents.
| Immigration Origin | # Population | % Population |
| Central America | 342 | 29.8% |
| Latin America | 342 | 29.8% |
| Mexico | 342 | 29.8% | View All 3 Rows |
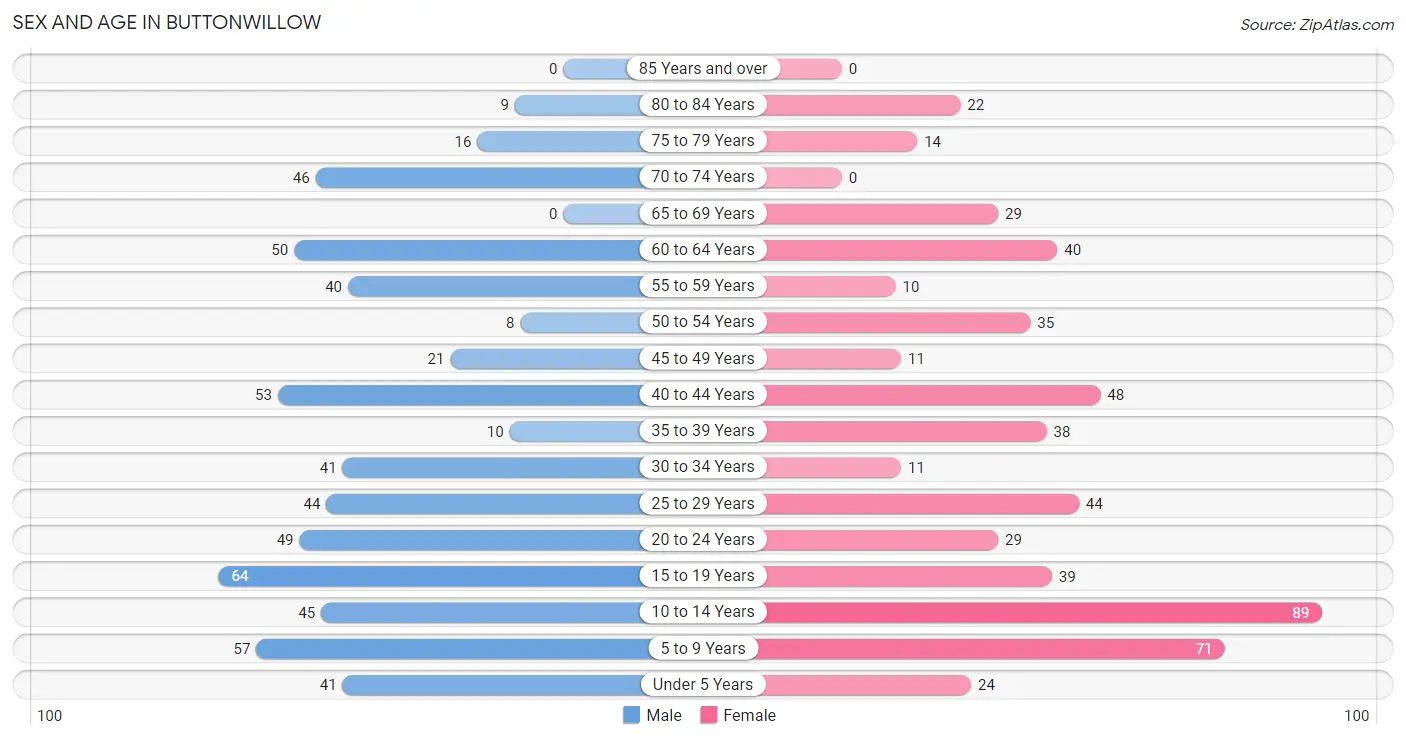
Sex and Age in Buttonwillow
Sex and Age in Buttonwillow
The most populous age groups in Buttonwillow are 15 to 19 Years (64 | 10.8%) for men and 10 to 14 Years (89 | 16.1%) for women.
| Age Bracket | Male | Female |
| Under 5 Years | 41 (6.9%) | 24 (4.3%) |
| 5 to 9 Years | 57 (9.6%) | 71 (12.8%) |
| 10 to 14 Years | 45 (7.6%) | 89 (16.1%) |
| 15 to 19 Years | 64 (10.8%) | 39 (7.0%) |
| 20 to 24 Years | 49 (8.3%) | 29 (5.2%) |
| 25 to 29 Years | 44 (7.4%) | 44 (7.9%) |
| 30 to 34 Years | 41 (6.9%) | 11 (2.0%) |
| 35 to 39 Years | 10 (1.7%) | 38 (6.9%) |
| 40 to 44 Years | 53 (8.9%) | 48 (8.7%) |
| 45 to 49 Years | 21 (3.5%) | 11 (2.0%) |
| 50 to 54 Years | 8 (1.3%) | 35 (6.3%) |
| 55 to 59 Years | 40 (6.7%) | 10 (1.8%) |
| 60 to 64 Years | 50 (8.4%) | 40 (7.2%) |
| 65 to 69 Years | 0 (0.0%) | 29 (5.2%) |
| 70 to 74 Years | 46 (7.7%) | 0 (0.0%) |
| 75 to 79 Years | 16 (2.7%) | 14 (2.5%) |
| 80 to 84 Years | 9 (1.5%) | 22 (4.0%) |
| 85 Years and over | 0 (0.0%) | 0 (0.0%) |
| Total | 594 (100.0%) | 554 (100.0%) |
Families and Households in Buttonwillow
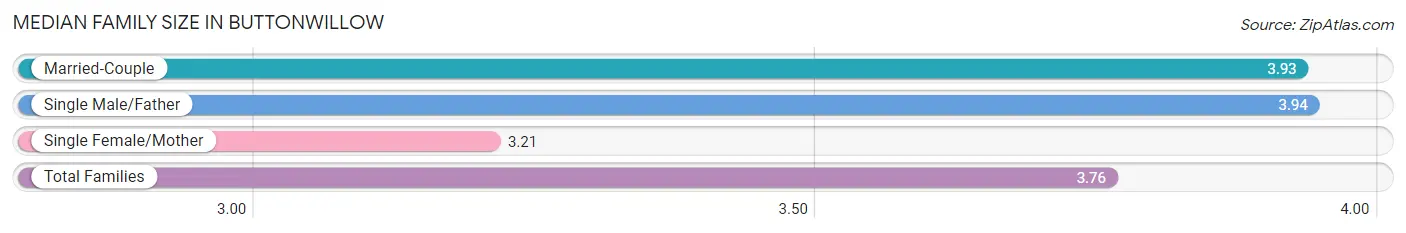
Median Family Size in Buttonwillow
The median family size in Buttonwillow is 3.76 persons per family, with single male/father families (31 | 11.4%) accounting for the largest median family size of 3.94 persons per family. On the other hand, single female/mother families (66 | 24.2%) represent the smallest median family size with 3.21 persons per family.
| Family Type | # Families | Family Size |
| Married-Couple | 176 (64.5%) | 3.93 |
| Single Male/Father | 31 (11.4%) | 3.94 |
| Single Female/Mother | 66 (24.2%) | 3.21 |
| Total Families | 273 (100.0%) | 3.76 |
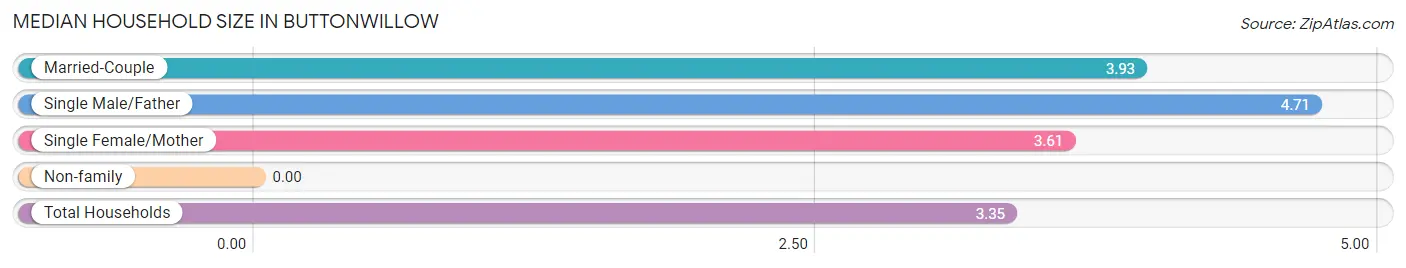
Median Household Size in Buttonwillow
| Household Type | # Households | Household Size |
| Married-Couple | 176 (51.5%) | 3.93 |
| Single Male/Father | 31 (9.1%) | 4.71 |
| Single Female/Mother | 66 (19.3%) | 3.61 |
| Non-family | 69 (20.2%) | - |
| Total Households | 342 (100.0%) | 3.35 |
Household Size by Marriage Status in Buttonwillow
Out of a total of 342 households in Buttonwillow, 273 (79.8%) are family households, while 69 (20.2%) are nonfamily households. The most numerous type of family households are 2-person households, comprising 95, and the most common type of nonfamily households are 1-person households, comprising 69.
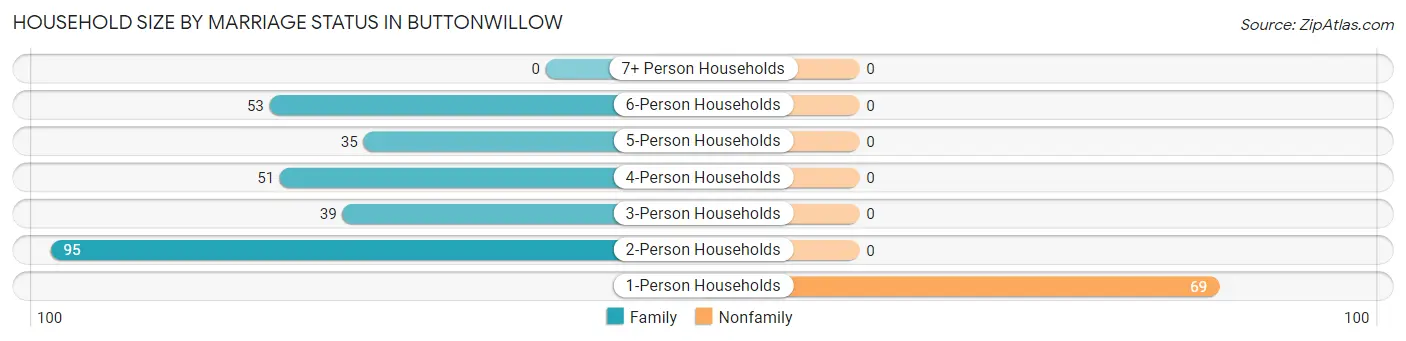
| Household Size | Family Households | Nonfamily Households |
| 1-Person Households | - | 69 (20.2%) |
| 2-Person Households | 95 (27.8%) | 0 (0.0%) |
| 3-Person Households | 39 (11.4%) | 0 (0.0%) |
| 4-Person Households | 51 (14.9%) | 0 (0.0%) |
| 5-Person Households | 35 (10.2%) | 0 (0.0%) |
| 6-Person Households | 53 (15.5%) | 0 (0.0%) |
| 7+ Person Households | 0 (0.0%) | 0 (0.0%) |
| Total | 273 (79.8%) | 69 (20.2%) |
Female Fertility in Buttonwillow
Fertility by Age in Buttonwillow
Average fertility rate in Buttonwillow is 51.0 births per 1,000 women. Women in the age bracket of 20 to 34 years have the highest fertility rate with 143.0 births per 1,000 women. Women in the age bracket of 20 to 34 years acount for 100.0% of all women with births.
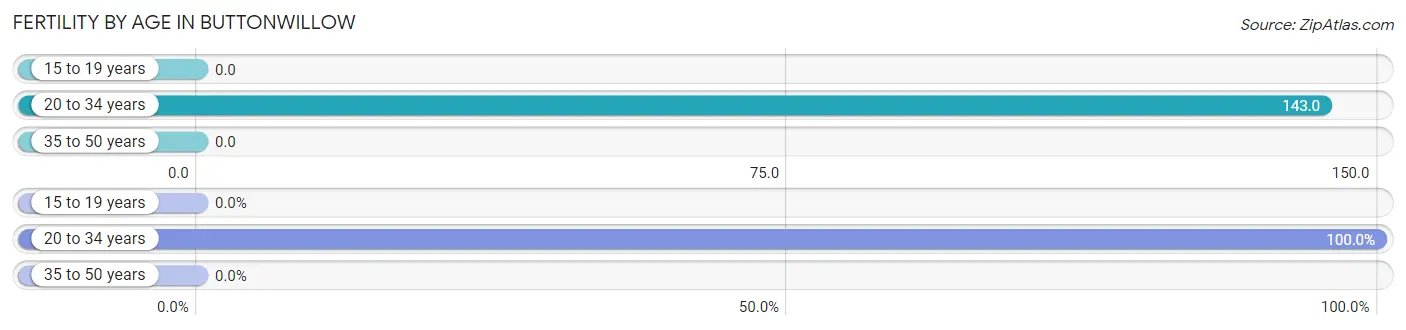
| Age Bracket | Women with Births | Births / 1,000 Women |
| 15 to 19 years | 0 (0.0%) | 0.0 |
| 20 to 34 years | 12 (100.0%) | 143.0 |
| 35 to 50 years | 0 (0.0%) | 0.0 |
| Total | 12 (100.0%) | 51.0 |
Fertility by Age by Marriage Status in Buttonwillow
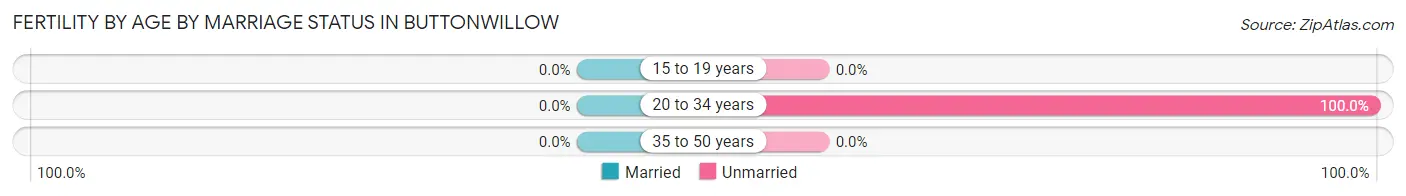
| Age Bracket | Married | Unmarried |
| 15 to 19 years | 0 (0.0%) | 0 (0.0%) |
| 20 to 34 years | 0 (0.0%) | 12 (100.0%) |
| 35 to 50 years | 0 (0.0%) | 0 (0.0%) |
| Total | 0 (0.0%) | 12 (100.0%) |
Fertility by Education in Buttonwillow
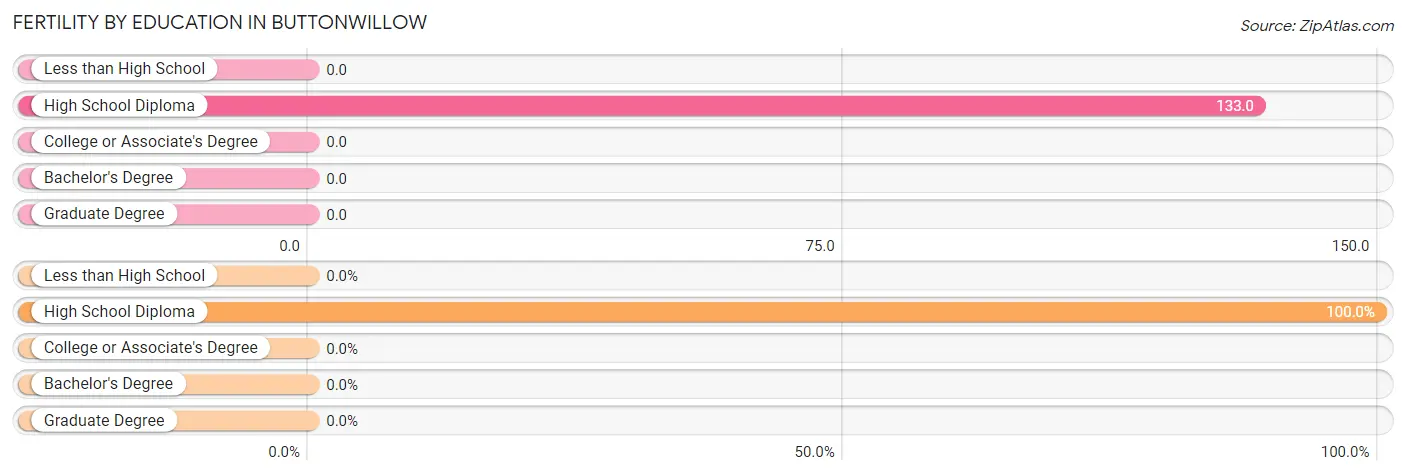
| Educational Attainment | Women with Births | Births / 1,000 Women |
| Less than High School | 0 (0.0%) | 0.0 |
| High School Diploma | 12 (100.0%) | 133.0 |
| College or Associate's Degree | 0 (0.0%) | 0.0 |
| Bachelor's Degree | 0 (0.0%) | 0.0 |
| Graduate Degree | 0 (0.0%) | 0.0 |
| Total | 12 (100.0%) | 51.0 |
Fertility by Education by Marriage Status in Buttonwillow
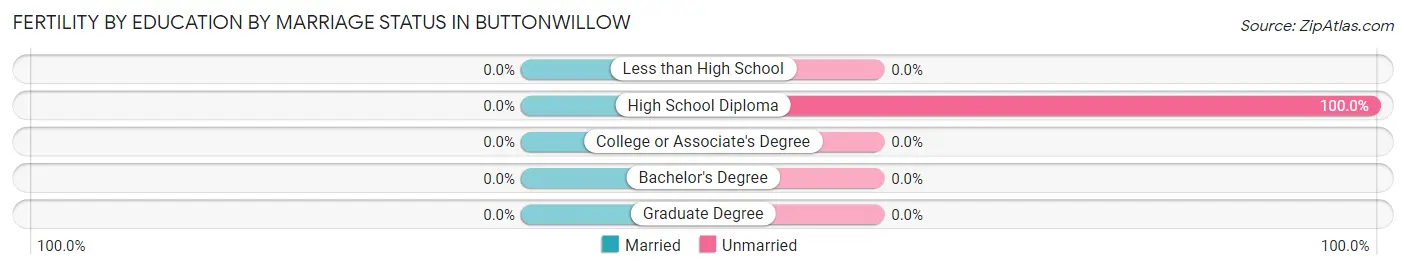
| Educational Attainment | Married | Unmarried |
| Less than High School | 0 (0.0%) | 0 (0.0%) |
| High School Diploma | 0 (0.0%) | 12 (100.0%) |
| College or Associate's Degree | 0 (0.0%) | 0 (0.0%) |
| Bachelor's Degree | 0 (0.0%) | 0 (0.0%) |
| Graduate Degree | 0 (0.0%) | 0 (0.0%) |
| Total | 0 (0.0%) | 12 (100.0%) |
Employment Characteristics in Buttonwillow
Employment by Class of Employer in Buttonwillow
Among the 336 employed individuals in Buttonwillow, private company employees (290 | 86.3%), local government employees (17 | 5.1%), and self-employed (incorporated) (14 | 4.2%) make up the most common classes of employment.
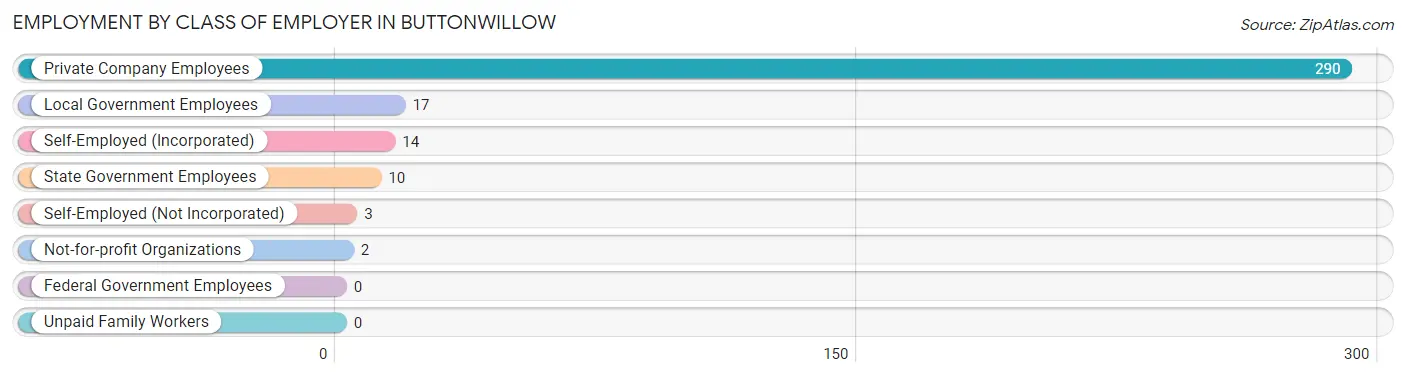
| Employer Class | # Employees | % Employees |
| Private Company Employees | 290 | 86.3% |
| Self-Employed (Incorporated) | 14 | 4.2% |
| Self-Employed (Not Incorporated) | 3 | 0.9% |
| Not-for-profit Organizations | 2 | 0.6% |
| Local Government Employees | 17 | 5.1% |
| State Government Employees | 10 | 3.0% |
| Federal Government Employees | 0 | 0.0% |
| Unpaid Family Workers | 0 | 0.0% |
| Total | 336 | 100.0% |
Employment Status by Age in Buttonwillow
According to the labor force statistics for Buttonwillow, out of the total population over 16 years of age (796), 48.4% or 385 individuals are in the labor force, with 8.8% or 34 of them unemployed. The age group with the highest labor force participation rate is 55 to 59 years, with 100.0% or 50 individuals in the labor force. Within the labor force, the 20 to 24 years age range has the highest percentage of unemployed individuals, with 47.1% or 16 of them being unemployed.
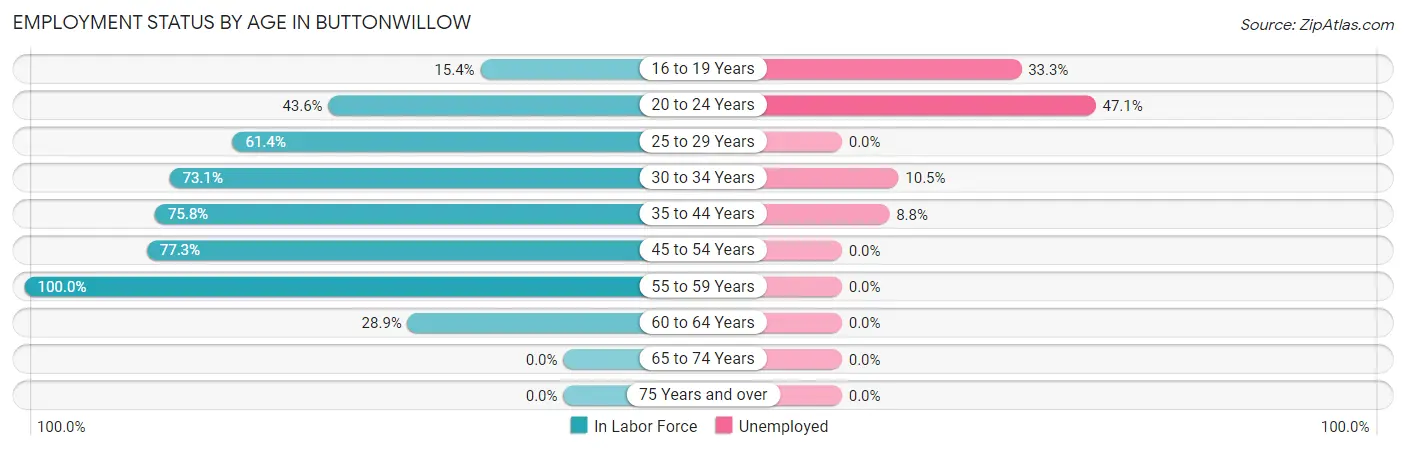
| Age Bracket | In Labor Force | Unemployed |
| 16 to 19 Years | 12 (15.4%) | 4 (33.3%) |
| 20 to 24 Years | 34 (43.6%) | 16 (47.1%) |
| 25 to 29 Years | 54 (61.4%) | 0 (0.0%) |
| 30 to 34 Years | 38 (73.1%) | 4 (10.5%) |
| 35 to 44 Years | 113 (75.8%) | 10 (8.8%) |
| 45 to 54 Years | 58 (77.3%) | 0 (0.0%) |
| 55 to 59 Years | 50 (100.0%) | 0 (0.0%) |
| 60 to 64 Years | 26 (28.9%) | 0 (0.0%) |
| 65 to 74 Years | 0 (0.0%) | 0 (0.0%) |
| 75 Years and over | 0 (0.0%) | 0 (0.0%) |
| Total | 385 (48.4%) | 34 (8.8%) |
Employment Status by Educational Attainment in Buttonwillow
According to labor force statistics for Buttonwillow, 67.3% of individuals (339) out of the total population between 25 and 64 years of age (504) are in the labor force, with 4.1% or 14 of them being unemployed. The group with the highest labor force participation rate are those with the educational attainment of bachelor's degree or higher, with 100.0% or 22 individuals in the labor force. Within the labor force, individuals with college / associate degree education have the highest percentage of unemployment, with 20.6% or 14 of them being unemployed.
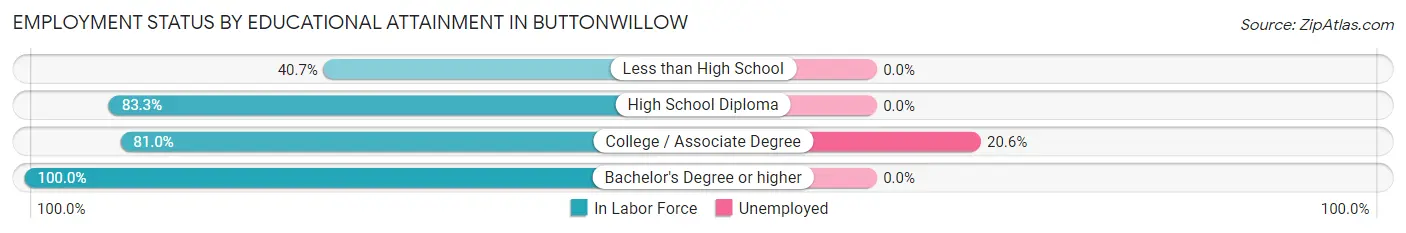
| Educational Attainment | In Labor Force | Unemployed |
| Less than High School | 79 (40.7%) | 0 (0.0%) |
| High School Diploma | 170 (83.3%) | 0 (0.0%) |
| College / Associate Degree | 68 (81.0%) | 17 (20.6%) |
| Bachelor's Degree or higher | 22 (100.0%) | 0 (0.0%) |
| Total | 339 (67.3%) | 21 (4.1%) |
Employment Occupations by Sex in Buttonwillow
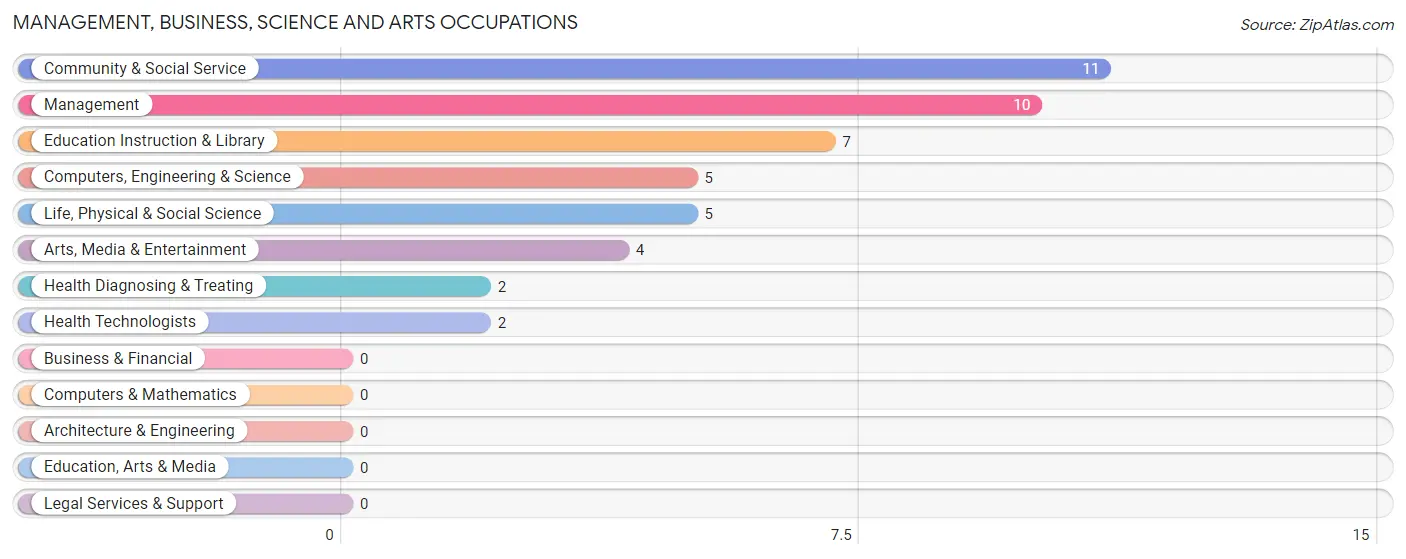
Management, Business, Science and Arts Occupations
The most common Management, Business, Science and Arts occupations in Buttonwillow are Community & Social Service (11 | 3.1%), Management (10 | 2.9%), Education Instruction & Library (7 | 2.0%), Computers, Engineering & Science (5 | 1.4%), and Life, Physical & Social Science (5 | 1.4%).
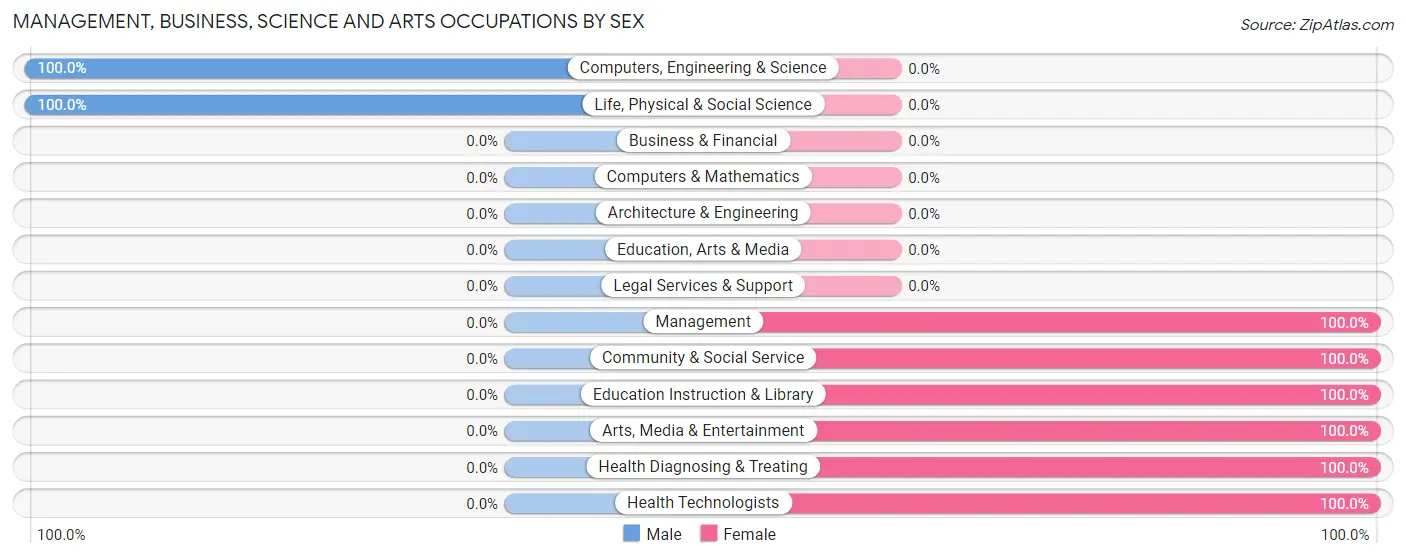
Management, Business, Science and Arts Occupations by Sex
Within the Management, Business, Science and Arts occupations in Buttonwillow, the most male-oriented occupations are Computers, Engineering & Science (100.0%), and Life, Physical & Social Science (100.0%), while the most female-oriented occupations are Management (100.0%), Community & Social Service (100.0%), and Education Instruction & Library (100.0%).
| Occupation | Male | Female |
| Management | 0 (0.0%) | 10 (100.0%) |
| Business & Financial | 0 (0.0%) | 0 (0.0%) |
| Computers, Engineering & Science | 5 (100.0%) | 0 (0.0%) |
| Computers & Mathematics | 0 (0.0%) | 0 (0.0%) |
| Architecture & Engineering | 0 (0.0%) | 0 (0.0%) |
| Life, Physical & Social Science | 5 (100.0%) | 0 (0.0%) |
| Community & Social Service | 0 (0.0%) | 11 (100.0%) |
| Education, Arts & Media | 0 (0.0%) | 0 (0.0%) |
| Legal Services & Support | 0 (0.0%) | 0 (0.0%) |
| Education Instruction & Library | 0 (0.0%) | 7 (100.0%) |
| Arts, Media & Entertainment | 0 (0.0%) | 4 (100.0%) |
| Health Diagnosing & Treating | 0 (0.0%) | 2 (100.0%) |
| Health Technologists | 0 (0.0%) | 2 (100.0%) |
| Total (Category) | 5 (17.9%) | 23 (82.1%) |
| Total (Overall) | 217 (61.8%) | 134 (38.2%) |
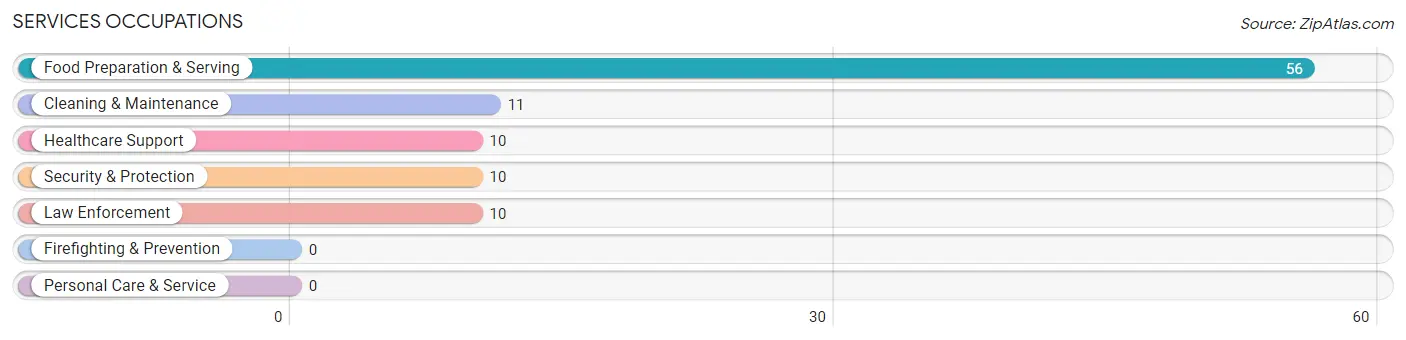
Services Occupations
The most common Services occupations in Buttonwillow are Food Preparation & Serving (56 | 16.0%), Cleaning & Maintenance (11 | 3.1%), Healthcare Support (10 | 2.9%), Security & Protection (10 | 2.9%), and Law Enforcement (10 | 2.9%).
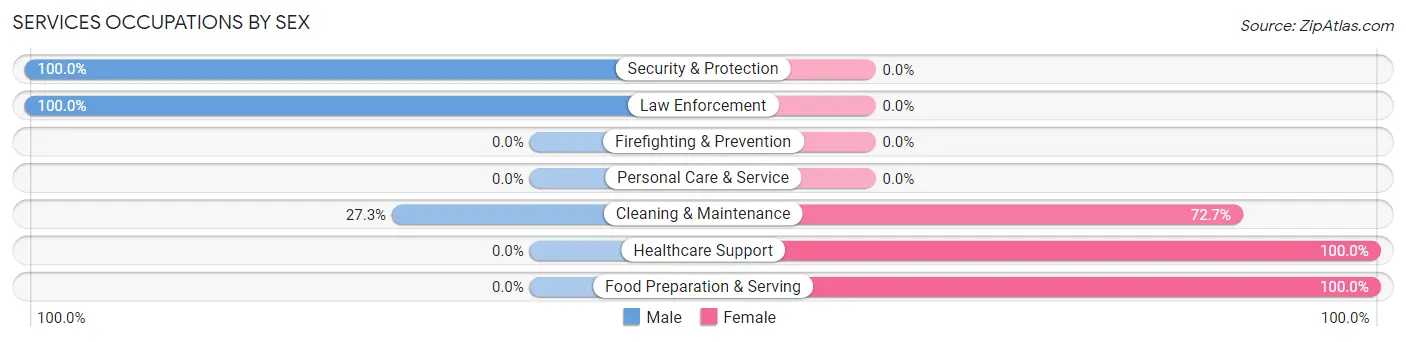
Services Occupations by Sex
Within the Services occupations in Buttonwillow, the most male-oriented occupations are Security & Protection (100.0%), Law Enforcement (100.0%), and Cleaning & Maintenance (27.3%), while the most female-oriented occupations are Healthcare Support (100.0%), Food Preparation & Serving (100.0%), and Cleaning & Maintenance (72.7%).
| Occupation | Male | Female |
| Healthcare Support | 0 (0.0%) | 10 (100.0%) |
| Security & Protection | 10 (100.0%) | 0 (0.0%) |
| Firefighting & Prevention | 0 (0.0%) | 0 (0.0%) |
| Law Enforcement | 10 (100.0%) | 0 (0.0%) |
| Food Preparation & Serving | 0 (0.0%) | 56 (100.0%) |
| Cleaning & Maintenance | 3 (27.3%) | 8 (72.7%) |
| Personal Care & Service | 0 (0.0%) | 0 (0.0%) |
| Total (Category) | 13 (14.9%) | 74 (85.1%) |
| Total (Overall) | 217 (61.8%) | 134 (38.2%) |
Sales and Office Occupations
The most common Sales and Office occupations in Buttonwillow are Sales & Related (23 | 6.6%), and Office & Administration (9 | 2.6%).
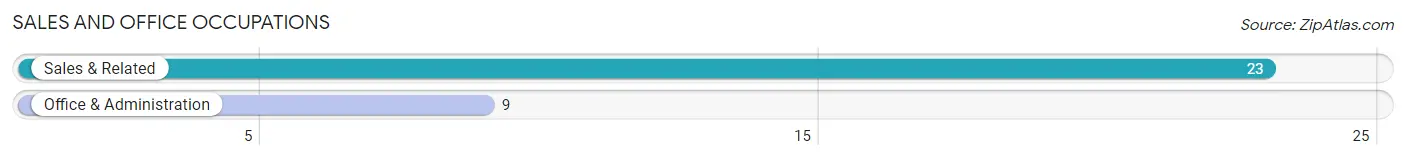
Sales and Office Occupations by Sex
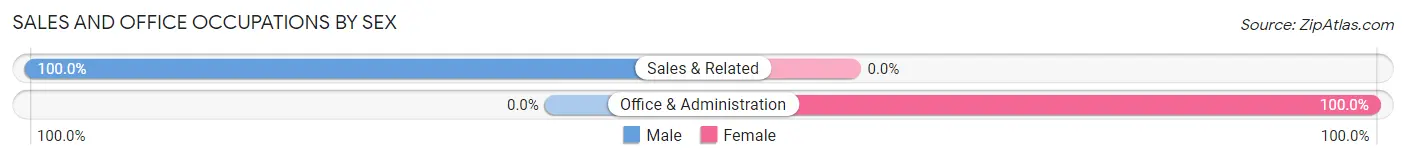
| Occupation | Male | Female |
| Sales & Related | 23 (100.0%) | 0 (0.0%) |
| Office & Administration | 0 (0.0%) | 9 (100.0%) |
| Total (Category) | 23 (71.9%) | 9 (28.1%) |
| Total (Overall) | 217 (61.8%) | 134 (38.2%) |
Natural Resources, Construction and Maintenance Occupations
The most common Natural Resources, Construction and Maintenance occupations in Buttonwillow are Farming, Fishing & Forestry (46 | 13.1%), Installation, Maintenance & Repair (40 | 11.4%), and Construction & Extraction (17 | 4.8%).
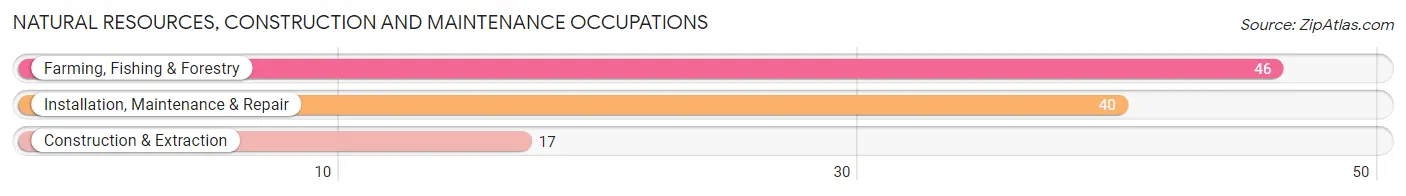
Natural Resources, Construction and Maintenance Occupations by Sex
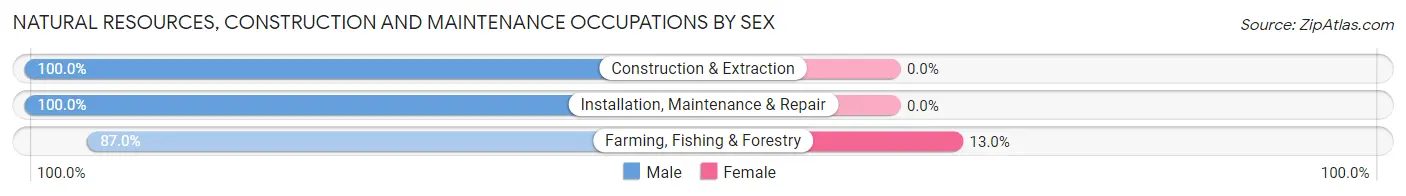
| Occupation | Male | Female |
| Farming, Fishing & Forestry | 40 (87.0%) | 6 (13.0%) |
| Construction & Extraction | 17 (100.0%) | 0 (0.0%) |
| Installation, Maintenance & Repair | 40 (100.0%) | 0 (0.0%) |
| Total (Category) | 97 (94.2%) | 6 (5.8%) |
| Total (Overall) | 217 (61.8%) | 134 (38.2%) |
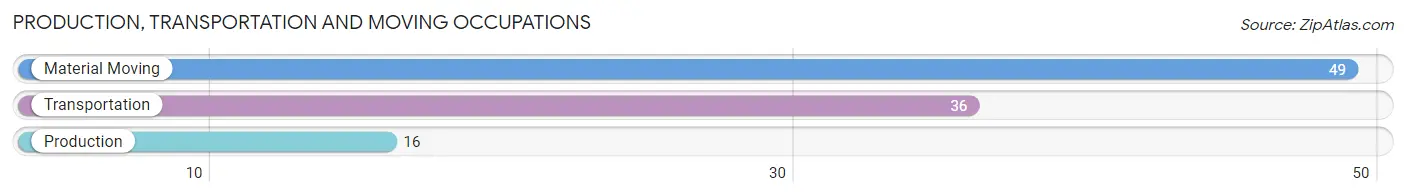
Production, Transportation and Moving Occupations
The most common Production, Transportation and Moving occupations in Buttonwillow are Material Moving (49 | 14.0%), Transportation (36 | 10.3%), and Production (16 | 4.6%).
Production, Transportation and Moving Occupations by Sex
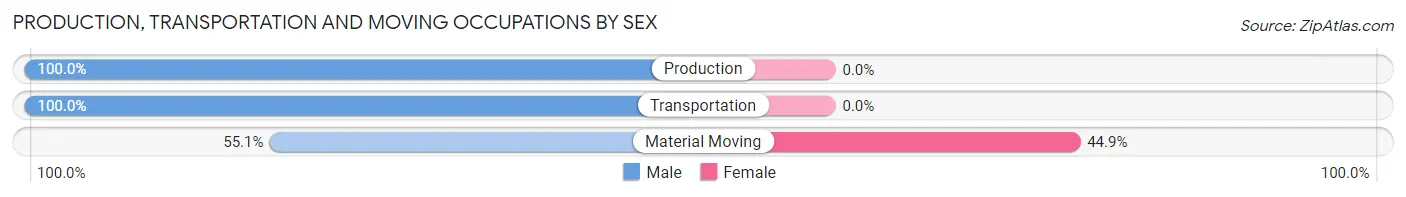
| Occupation | Male | Female |
| Production | 16 (100.0%) | 0 (0.0%) |
| Transportation | 36 (100.0%) | 0 (0.0%) |
| Material Moving | 27 (55.1%) | 22 (44.9%) |
| Total (Category) | 79 (78.2%) | 22 (21.8%) |
| Total (Overall) | 217 (61.8%) | 134 (38.2%) |
Employment Industries by Sex in Buttonwillow
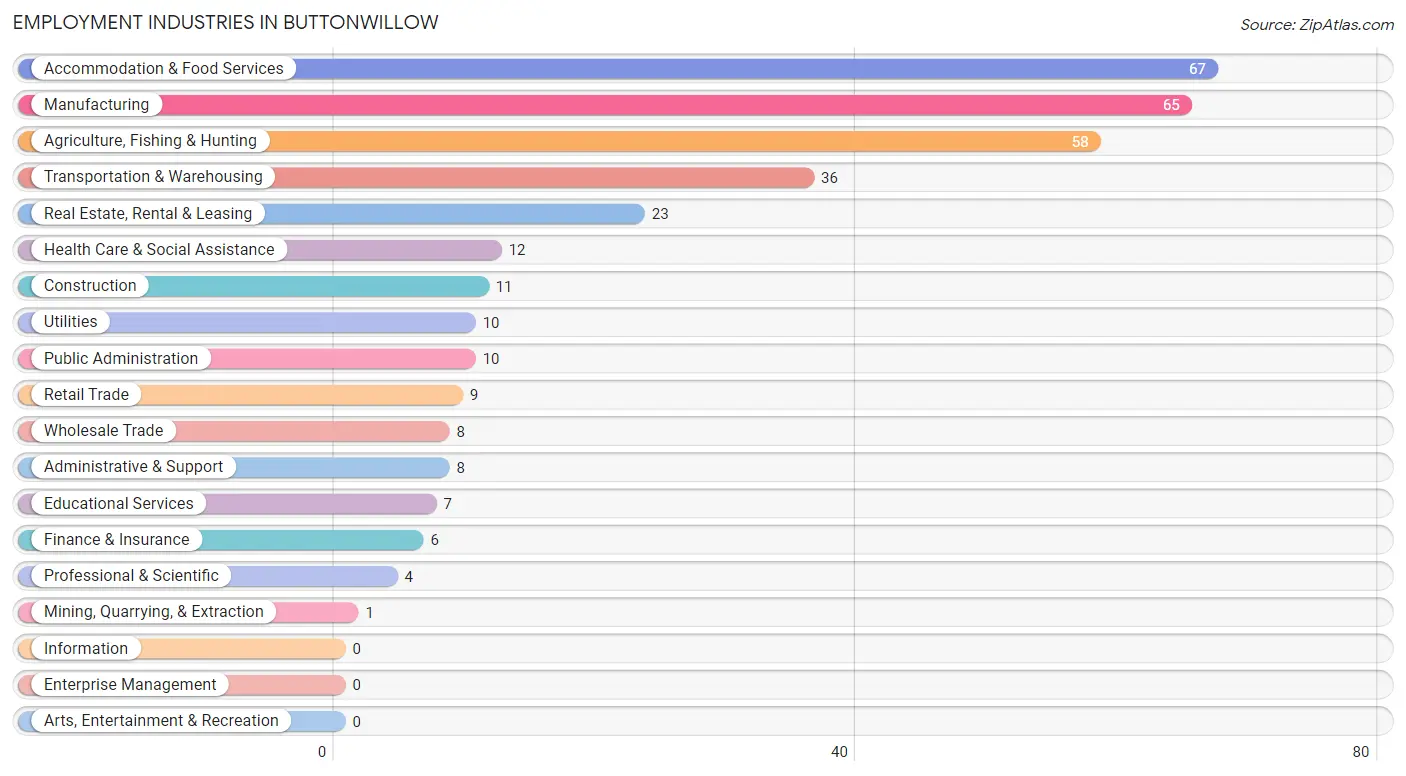
Employment Industries in Buttonwillow
The major employment industries in Buttonwillow include Accommodation & Food Services (67 | 19.1%), Manufacturing (65 | 18.5%), Agriculture, Fishing & Hunting (58 | 16.5%), Transportation & Warehousing (36 | 10.3%), and Real Estate, Rental & Leasing (23 | 6.6%).
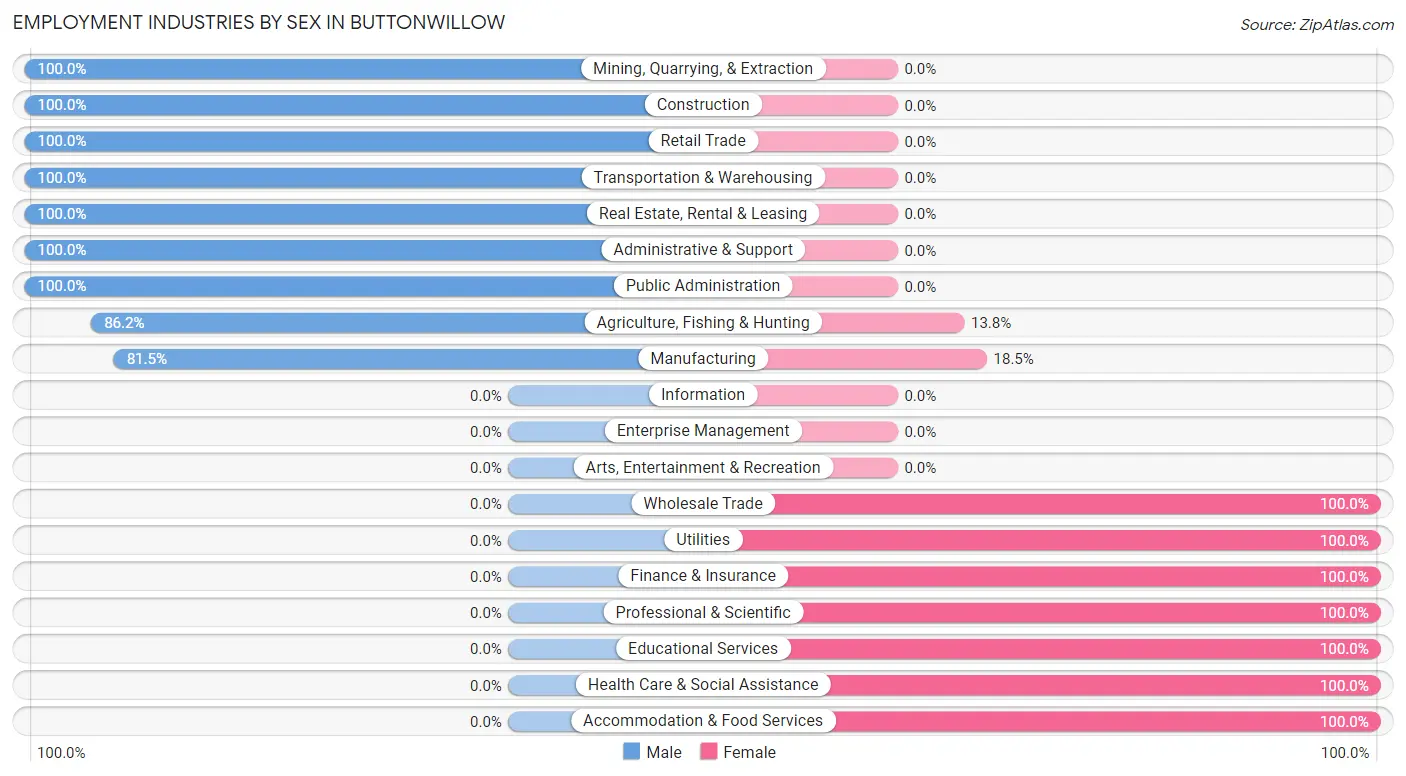
Employment Industries by Sex in Buttonwillow
The Buttonwillow industries that see more men than women are Mining, Quarrying, & Extraction (100.0%), Construction (100.0%), and Retail Trade (100.0%), whereas the industries that tend to have a higher number of women are Wholesale Trade (100.0%), Utilities (100.0%), and Finance & Insurance (100.0%).
| Industry | Male | Female |
| Agriculture, Fishing & Hunting | 50 (86.2%) | 8 (13.8%) |
| Mining, Quarrying, & Extraction | 1 (100.0%) | 0 (0.0%) |
| Construction | 11 (100.0%) | 0 (0.0%) |
| Manufacturing | 53 (81.5%) | 12 (18.5%) |
| Wholesale Trade | 0 (0.0%) | 8 (100.0%) |
| Retail Trade | 9 (100.0%) | 0 (0.0%) |
| Transportation & Warehousing | 36 (100.0%) | 0 (0.0%) |
| Utilities | 0 (0.0%) | 10 (100.0%) |
| Information | 0 (0.0%) | 0 (0.0%) |
| Finance & Insurance | 0 (0.0%) | 6 (100.0%) |
| Real Estate, Rental & Leasing | 23 (100.0%) | 0 (0.0%) |
| Professional & Scientific | 0 (0.0%) | 4 (100.0%) |
| Enterprise Management | 0 (0.0%) | 0 (0.0%) |
| Administrative & Support | 8 (100.0%) | 0 (0.0%) |
| Educational Services | 0 (0.0%) | 7 (100.0%) |
| Health Care & Social Assistance | 0 (0.0%) | 12 (100.0%) |
| Arts, Entertainment & Recreation | 0 (0.0%) | 0 (0.0%) |
| Accommodation & Food Services | 0 (0.0%) | 67 (100.0%) |
| Public Administration | 10 (100.0%) | 0 (0.0%) |
| Total | 217 (61.8%) | 134 (38.2%) |
Education in Buttonwillow
School Enrollment in Buttonwillow
The most common levels of schooling among the 398 students in Buttonwillow are elementary school (124 | 31.2%), high school (105 | 26.4%), and middle school (98 | 24.6%).
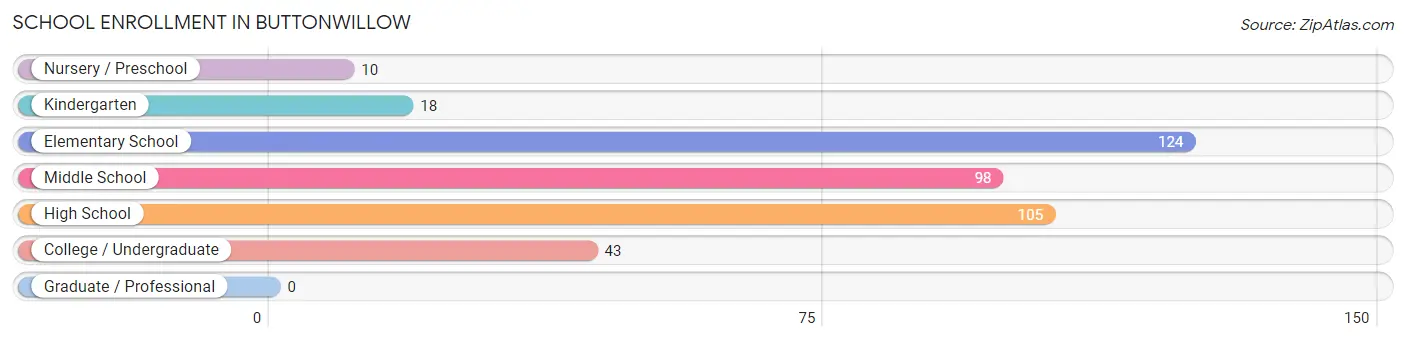
| School Level | # Students | % Students |
| Nursery / Preschool | 10 | 2.5% |
| Kindergarten | 18 | 4.5% |
| Elementary School | 124 | 31.2% |
| Middle School | 98 | 24.6% |
| High School | 105 | 26.4% |
| College / Undergraduate | 43 | 10.8% |
| Graduate / Professional | 0 | 0.0% |
| Total | 398 | 100.0% |
School Enrollment by Age by Funding Source in Buttonwillow
Out of a total of 398 students who are enrolled in schools in Buttonwillow, 8 (2.0%) attend a private institution, while the remaining 390 (98.0%) are enrolled in public schools. The age group of 20 to 24 year olds has the highest likelihood of being enrolled in private schools, with 8 (29.6% in the age bracket) enrolled. Conversely, the age group of 3 to 4 year olds has the lowest likelihood of being enrolled in a private school, with 10 (100.0% in the age bracket) attending a public institution.
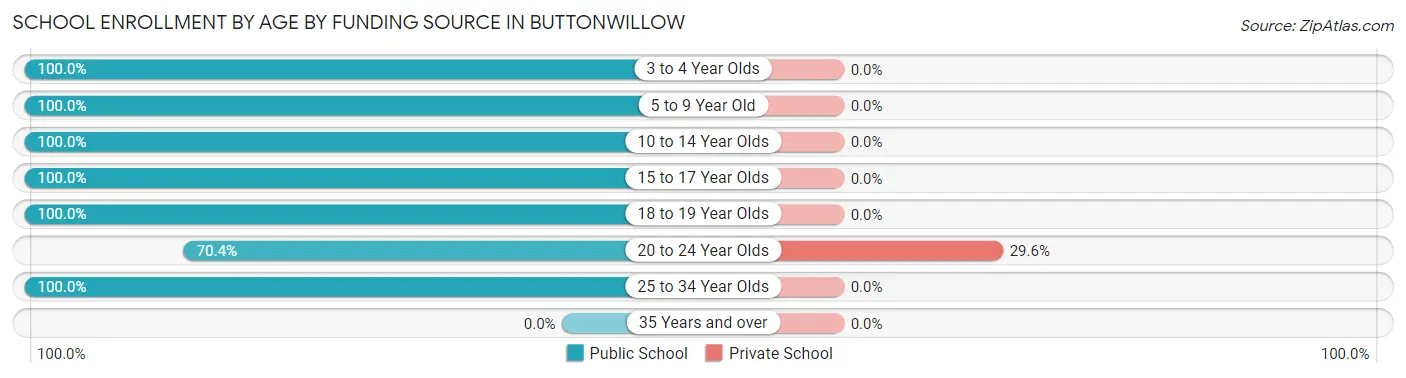
| Age Bracket | Public School | Private School |
| 3 to 4 Year Olds | 10 (100.0%) | 0 (0.0%) |
| 5 to 9 Year Old | 128 (100.0%) | 0 (0.0%) |
| 10 to 14 Year Olds | 134 (100.0%) | 0 (0.0%) |
| 15 to 17 Year Olds | 66 (100.0%) | 0 (0.0%) |
| 18 to 19 Year Olds | 29 (100.0%) | 0 (0.0%) |
| 20 to 24 Year Olds | 19 (70.4%) | 8 (29.6%) |
| 25 to 34 Year Olds | 4 (100.0%) | 0 (0.0%) |
| 35 Years and over | 0 (0.0%) | 0 (0.0%) |
| Total | 390 (98.0%) | 8 (2.0%) |
Educational Attainment by Field of Study in Buttonwillow
Business (10 | 45.5%), bio, nature & agricultural (7 | 31.8%), and engineering (5 | 22.7%) are the most common fields of study among 22 individuals in Buttonwillow who have obtained a bachelor's degree or higher.
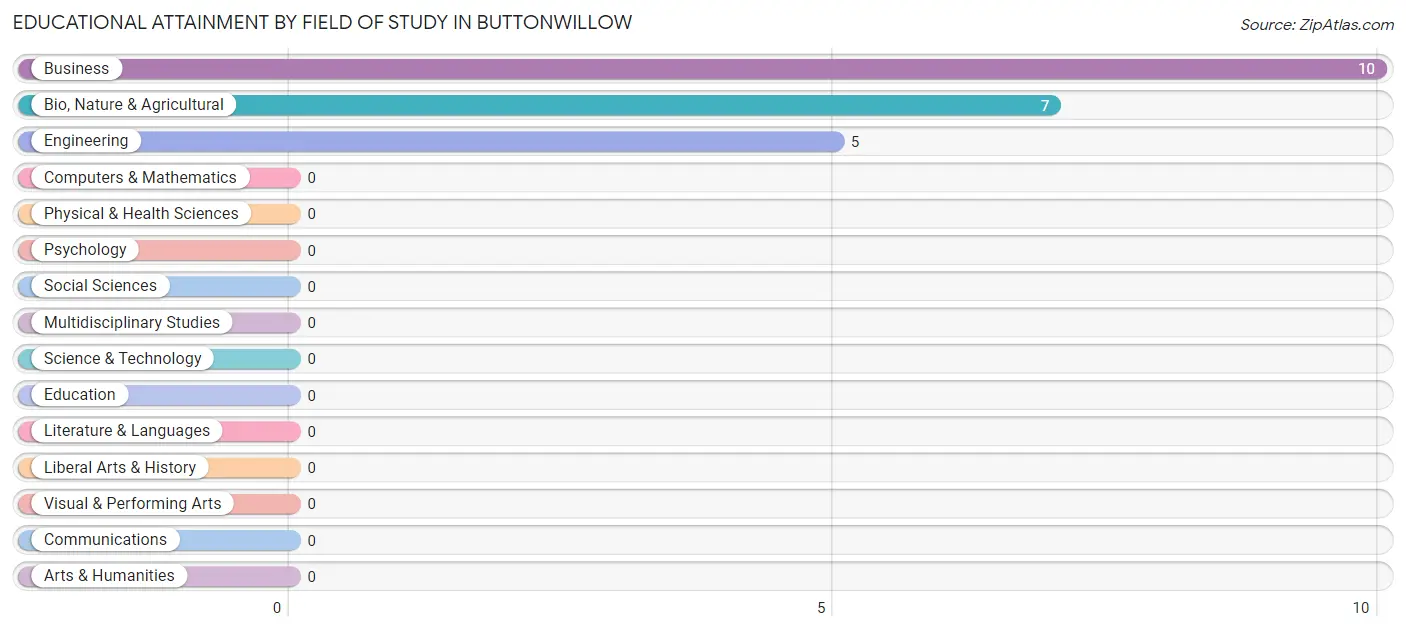
| Field of Study | # Graduates | % Graduates |
| Computers & Mathematics | 0 | 0.0% |
| Bio, Nature & Agricultural | 7 | 31.8% |
| Physical & Health Sciences | 0 | 0.0% |
| Psychology | 0 | 0.0% |
| Social Sciences | 0 | 0.0% |
| Engineering | 5 | 22.7% |
| Multidisciplinary Studies | 0 | 0.0% |
| Science & Technology | 0 | 0.0% |
| Business | 10 | 45.5% |
| Education | 0 | 0.0% |
| Literature & Languages | 0 | 0.0% |
| Liberal Arts & History | 0 | 0.0% |
| Visual & Performing Arts | 0 | 0.0% |
| Communications | 0 | 0.0% |
| Arts & Humanities | 0 | 0.0% |
| Total | 22 | 100.0% |
Transportation & Commute in Buttonwillow
Vehicle Availability by Sex in Buttonwillow
The most prevalent vehicle ownership categories in Buttonwillow are males with 2 vehicles (128, accounting for 59.0%) and females with 2 vehicles (81, making up 107.6%).
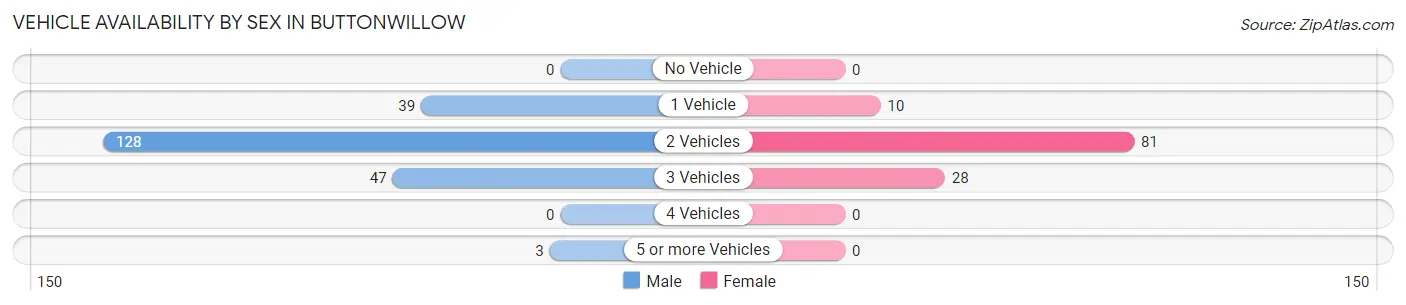
| Vehicles Available | Male | Female |
| No Vehicle | 0 (0.0%) | 0 (0.0%) |
| 1 Vehicle | 39 (18.0%) | 10 (8.4%) |
| 2 Vehicles | 128 (59.0%) | 81 (68.1%) |
| 3 Vehicles | 47 (21.7%) | 28 (23.5%) |
| 4 Vehicles | 0 (0.0%) | 0 (0.0%) |
| 5 or more Vehicles | 3 (1.4%) | 0 (0.0%) |
| Total | 217 (100.0%) | 119 (100.0%) |
Commute Time in Buttonwillow
The most frequently occuring commute durations in Buttonwillow are 20 to 24 minutes (51 commuters, 15.3%), 10 to 14 minutes (45 commuters, 13.5%), and 5 to 9 minutes (41 commuters, 12.3%).
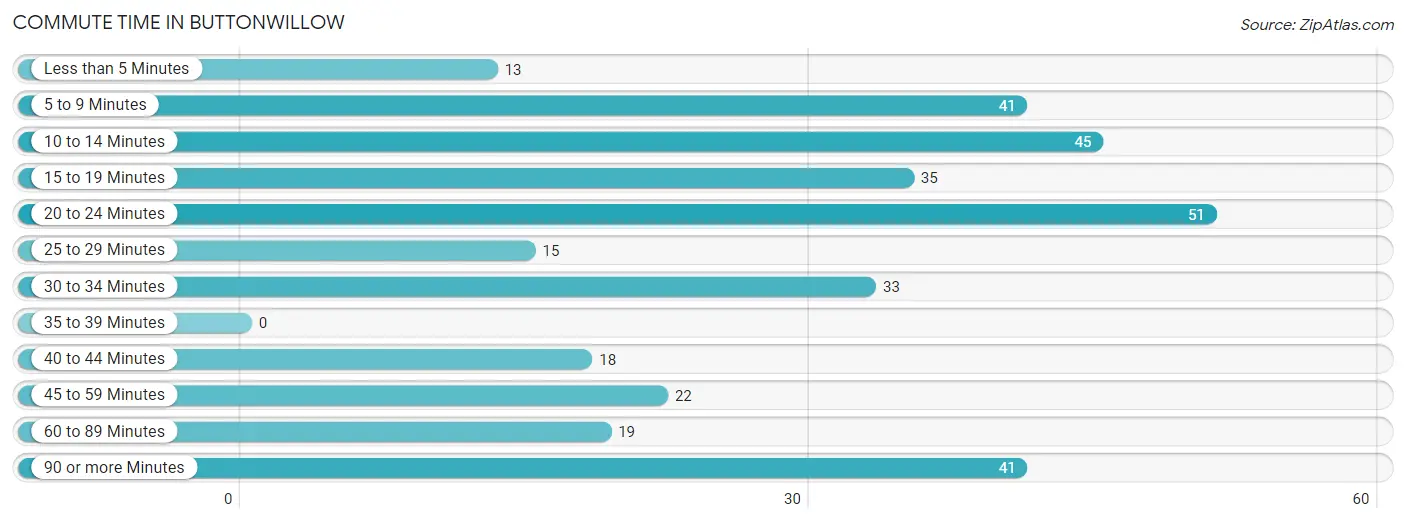
| Commute Time | # Commuters | % Commuters |
| Less than 5 Minutes | 13 | 3.9% |
| 5 to 9 Minutes | 41 | 12.3% |
| 10 to 14 Minutes | 45 | 13.5% |
| 15 to 19 Minutes | 35 | 10.5% |
| 20 to 24 Minutes | 51 | 15.3% |
| 25 to 29 Minutes | 15 | 4.5% |
| 30 to 34 Minutes | 33 | 9.9% |
| 35 to 39 Minutes | 0 | 0.0% |
| 40 to 44 Minutes | 18 | 5.4% |
| 45 to 59 Minutes | 22 | 6.6% |
| 60 to 89 Minutes | 19 | 5.7% |
| 90 or more Minutes | 41 | 12.3% |
Commute Time by Sex in Buttonwillow
The most common commute times in Buttonwillow are 10 to 14 minutes (35 commuters, 16.4%) for males and 15 to 19 minutes (25 commuters, 21.0%) for females.
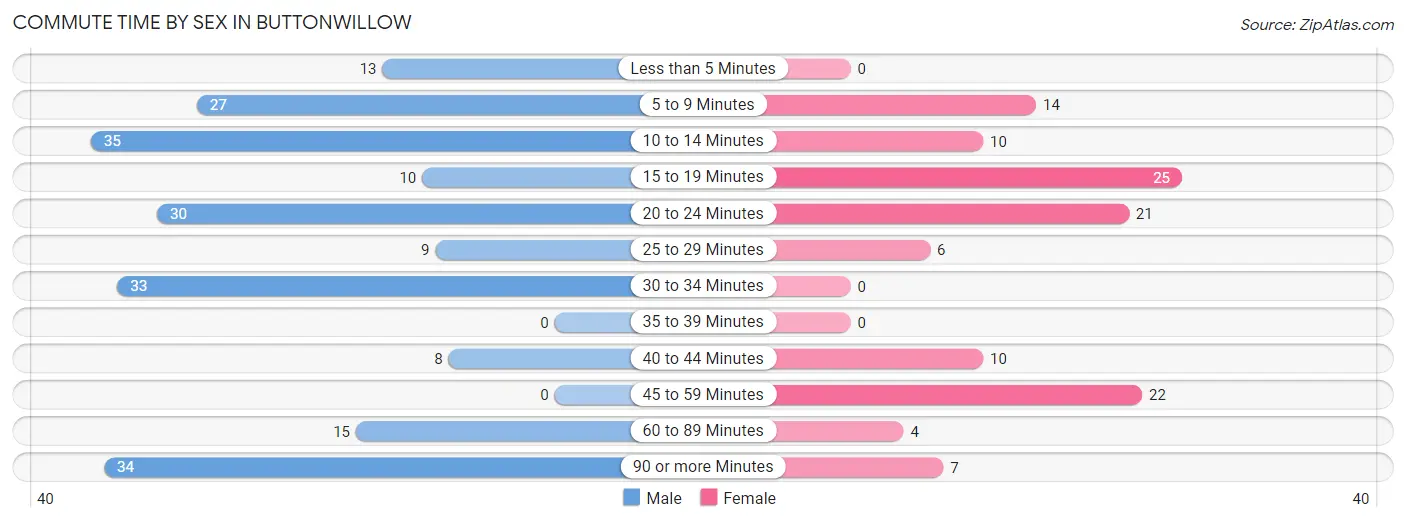
| Commute Time | Male | Female |
| Less than 5 Minutes | 13 (6.1%) | 0 (0.0%) |
| 5 to 9 Minutes | 27 (12.6%) | 14 (11.8%) |
| 10 to 14 Minutes | 35 (16.4%) | 10 (8.4%) |
| 15 to 19 Minutes | 10 (4.7%) | 25 (21.0%) |
| 20 to 24 Minutes | 30 (14.0%) | 21 (17.6%) |
| 25 to 29 Minutes | 9 (4.2%) | 6 (5.0%) |
| 30 to 34 Minutes | 33 (15.4%) | 0 (0.0%) |
| 35 to 39 Minutes | 0 (0.0%) | 0 (0.0%) |
| 40 to 44 Minutes | 8 (3.7%) | 10 (8.4%) |
| 45 to 59 Minutes | 0 (0.0%) | 22 (18.5%) |
| 60 to 89 Minutes | 15 (7.0%) | 4 (3.4%) |
| 90 or more Minutes | 34 (15.9%) | 7 (5.9%) |
Time of Departure to Work by Sex in Buttonwillow
The most frequent times of departure to work in Buttonwillow are 6:00 AM to 6:29 AM (82, 38.3%) for males and 6:00 AM to 6:29 AM (41, 34.4%) for females.
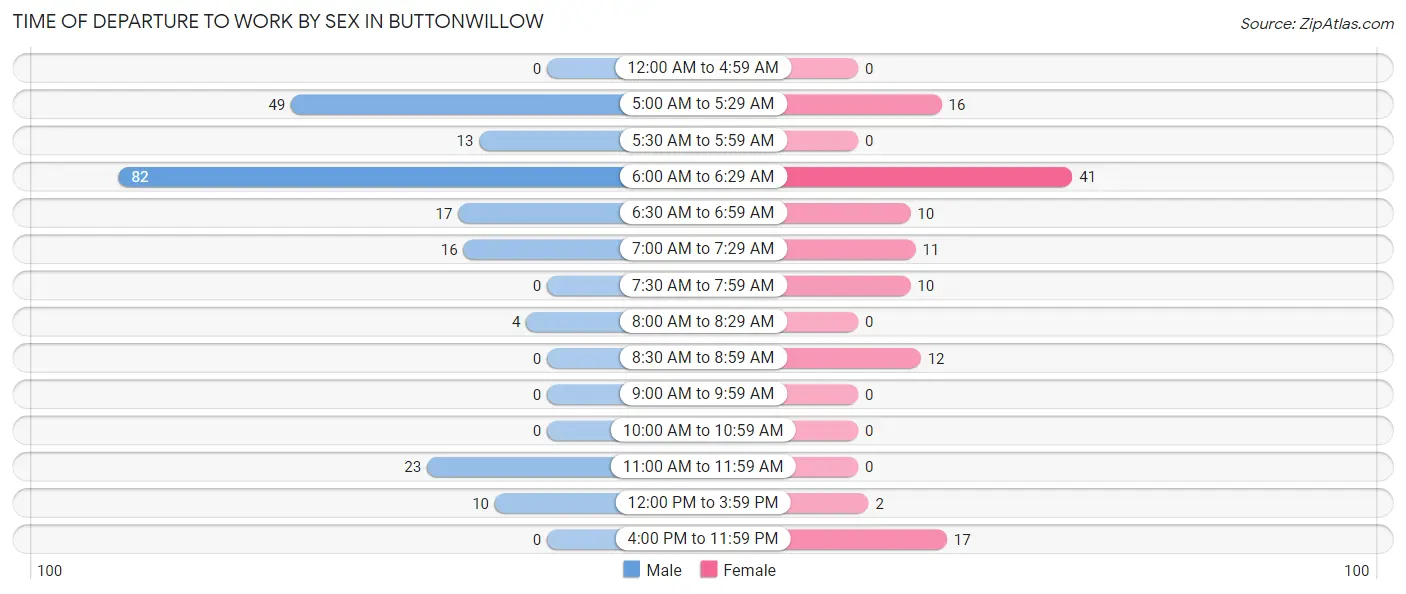
| Time of Departure | Male | Female |
| 12:00 AM to 4:59 AM | 0 (0.0%) | 0 (0.0%) |
| 5:00 AM to 5:29 AM | 49 (22.9%) | 16 (13.5%) |
| 5:30 AM to 5:59 AM | 13 (6.1%) | 0 (0.0%) |
| 6:00 AM to 6:29 AM | 82 (38.3%) | 41 (34.4%) |
| 6:30 AM to 6:59 AM | 17 (7.9%) | 10 (8.4%) |
| 7:00 AM to 7:29 AM | 16 (7.5%) | 11 (9.2%) |
| 7:30 AM to 7:59 AM | 0 (0.0%) | 10 (8.4%) |
| 8:00 AM to 8:29 AM | 4 (1.9%) | 0 (0.0%) |
| 8:30 AM to 8:59 AM | 0 (0.0%) | 12 (10.1%) |
| 9:00 AM to 9:59 AM | 0 (0.0%) | 0 (0.0%) |
| 10:00 AM to 10:59 AM | 0 (0.0%) | 0 (0.0%) |
| 11:00 AM to 11:59 AM | 23 (10.7%) | 0 (0.0%) |
| 12:00 PM to 3:59 PM | 10 (4.7%) | 2 (1.7%) |
| 4:00 PM to 11:59 PM | 0 (0.0%) | 17 (14.3%) |
| Total | 214 (100.0%) | 119 (100.0%) |
Housing Occupancy in Buttonwillow
Occupancy by Ownership in Buttonwillow
Of the total 342 dwellings in Buttonwillow, owner-occupied units account for 163 (47.7%), while renter-occupied units make up 179 (52.3%).
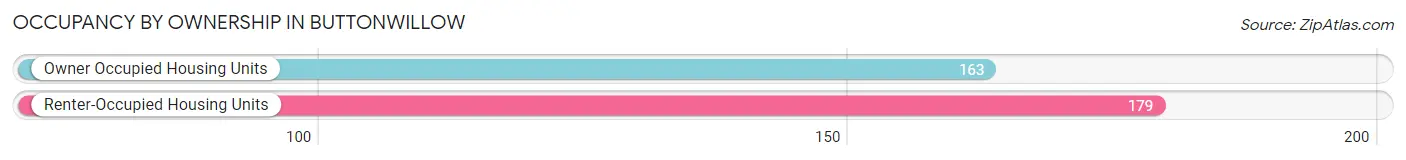
| Occupancy | # Housing Units | % Housing Units |
| Owner Occupied Housing Units | 163 | 47.7% |
| Renter-Occupied Housing Units | 179 | 52.3% |
| Total Occupied Housing Units | 342 | 100.0% |
Occupancy by Household Size in Buttonwillow
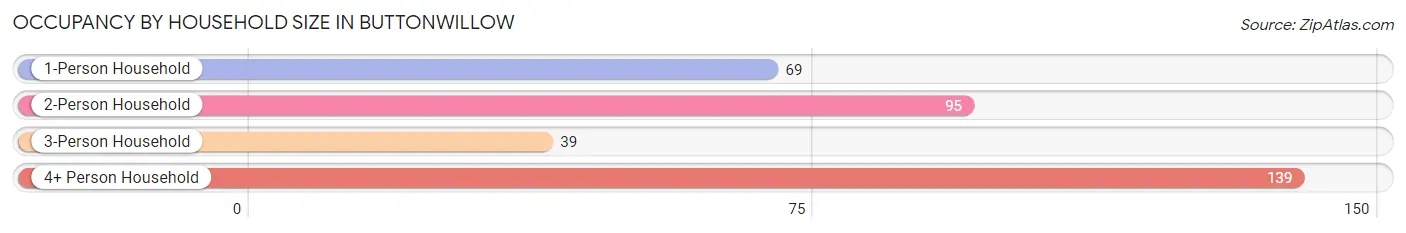
| Household Size | # Housing Units | % Housing Units |
| 1-Person Household | 69 | 20.2% |
| 2-Person Household | 95 | 27.8% |
| 3-Person Household | 39 | 11.4% |
| 4+ Person Household | 139 | 40.6% |
| Total Housing Units | 342 | 100.0% |
Occupancy by Ownership by Household Size in Buttonwillow
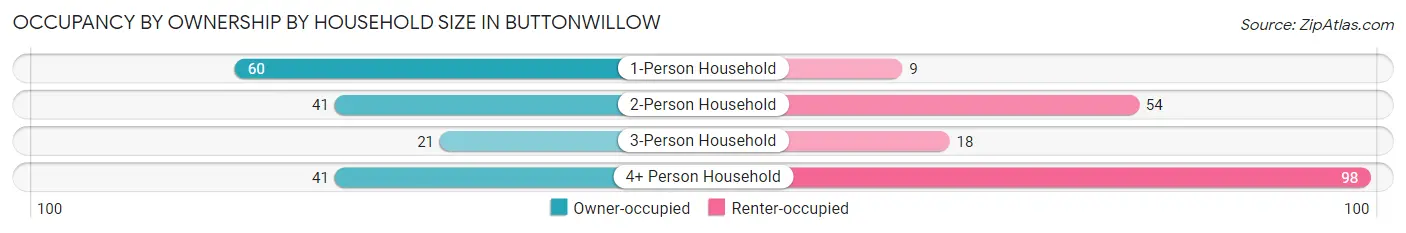
| Household Size | Owner-occupied | Renter-occupied |
| 1-Person Household | 60 (87.0%) | 9 (13.0%) |
| 2-Person Household | 41 (43.2%) | 54 (56.8%) |
| 3-Person Household | 21 (53.8%) | 18 (46.2%) |
| 4+ Person Household | 41 (29.5%) | 98 (70.5%) |
| Total Housing Units | 163 (47.7%) | 179 (52.3%) |
Occupancy by Educational Attainment in Buttonwillow
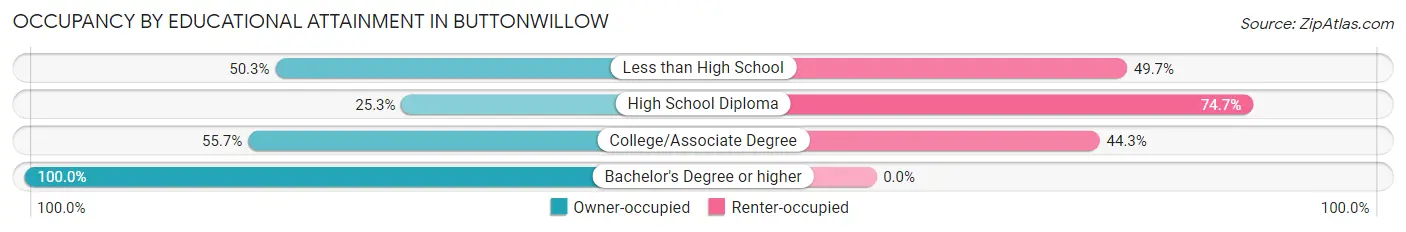
| Household Size | Owner-occupied | Renter-occupied |
| Less than High School | 83 (50.3%) | 82 (49.7%) |
| High School Diploma | 21 (25.3%) | 62 (74.7%) |
| College/Associate Degree | 44 (55.7%) | 35 (44.3%) |
| Bachelor's Degree or higher | 15 (100.0%) | 0 (0.0%) |
Occupancy by Age of Householder in Buttonwillow
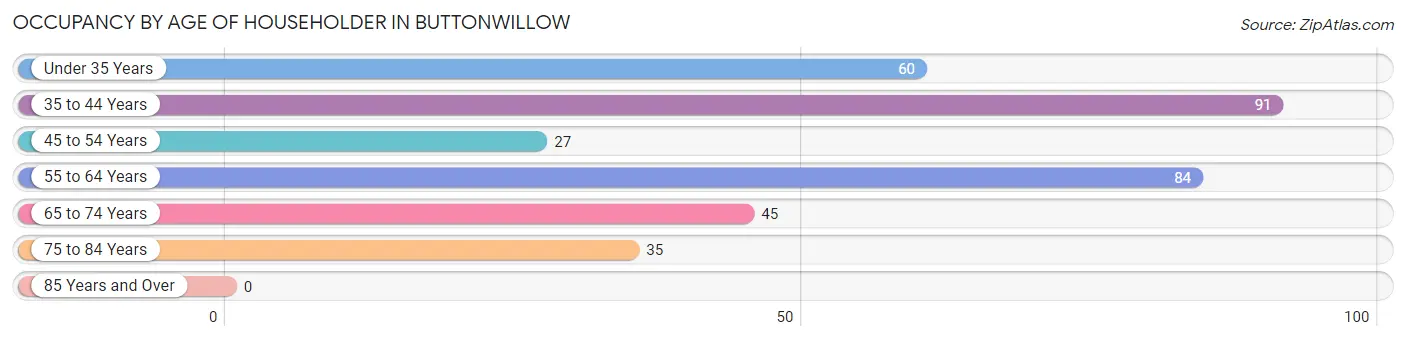
| Age Bracket | # Households | % Households |
| Under 35 Years | 60 | 17.5% |
| 35 to 44 Years | 91 | 26.6% |
| 45 to 54 Years | 27 | 7.9% |
| 55 to 64 Years | 84 | 24.6% |
| 65 to 74 Years | 45 | 13.2% |
| 75 to 84 Years | 35 | 10.2% |
| 85 Years and Over | 0 | 0.0% |
| Total | 342 | 100.0% |
Housing Finances in Buttonwillow
Median Income by Occupancy in Buttonwillow
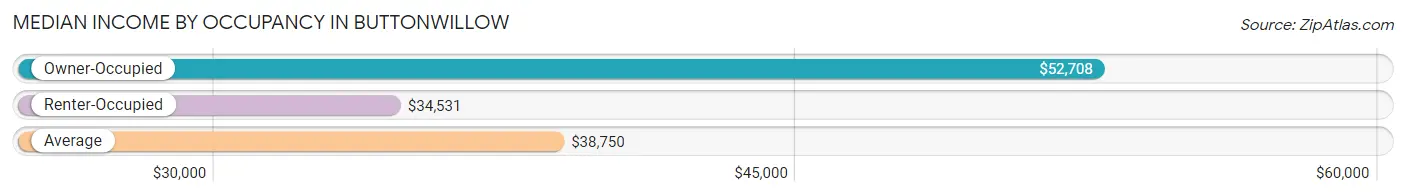
| Occupancy Type | # Households | Median Income |
| Owner-Occupied | 163 (47.7%) | $52,708 |
| Renter-Occupied | 179 (52.3%) | $34,531 |
| Average | 342 (100.0%) | $38,750 |
Occupancy by Householder Income Bracket in Buttonwillow
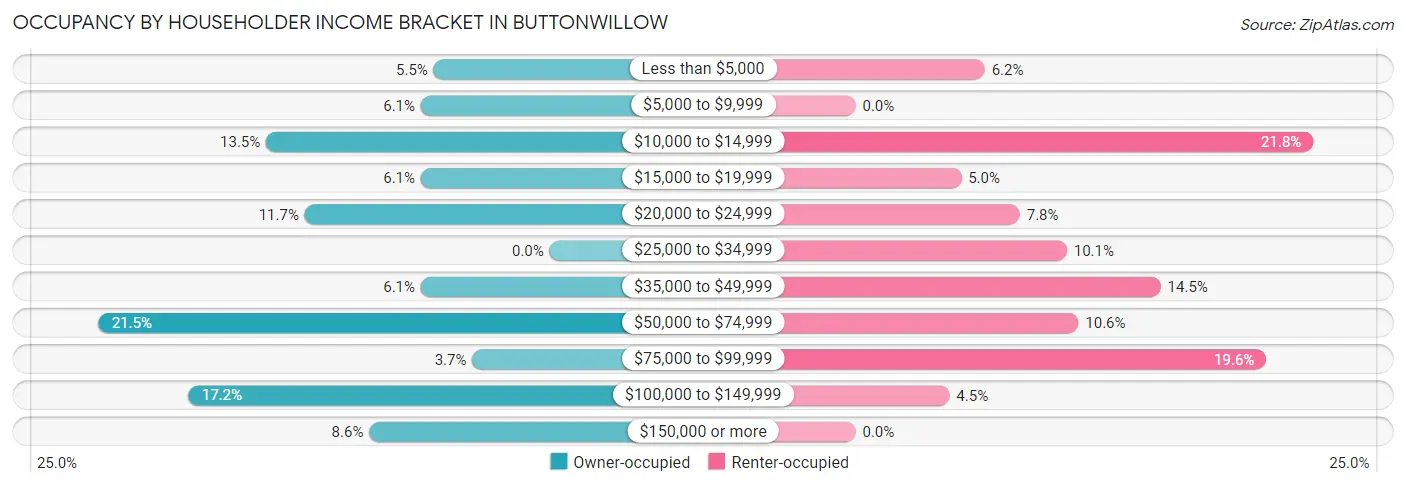
| Income Bracket | Owner-occupied | Renter-occupied |
| Less than $5,000 | 9 (5.5%) | 11 (6.1%) |
| $5,000 to $9,999 | 10 (6.1%) | 0 (0.0%) |
| $10,000 to $14,999 | 22 (13.5%) | 39 (21.8%) |
| $15,000 to $19,999 | 10 (6.1%) | 9 (5.0%) |
| $20,000 to $24,999 | 19 (11.7%) | 14 (7.8%) |
| $25,000 to $34,999 | 0 (0.0%) | 18 (10.1%) |
| $35,000 to $49,999 | 10 (6.1%) | 26 (14.5%) |
| $50,000 to $74,999 | 35 (21.5%) | 19 (10.6%) |
| $75,000 to $99,999 | 6 (3.7%) | 35 (19.6%) |
| $100,000 to $149,999 | 28 (17.2%) | 8 (4.5%) |
| $150,000 or more | 14 (8.6%) | 0 (0.0%) |
| Total | 163 (100.0%) | 179 (100.0%) |
Monthly Housing Cost Tiers in Buttonwillow
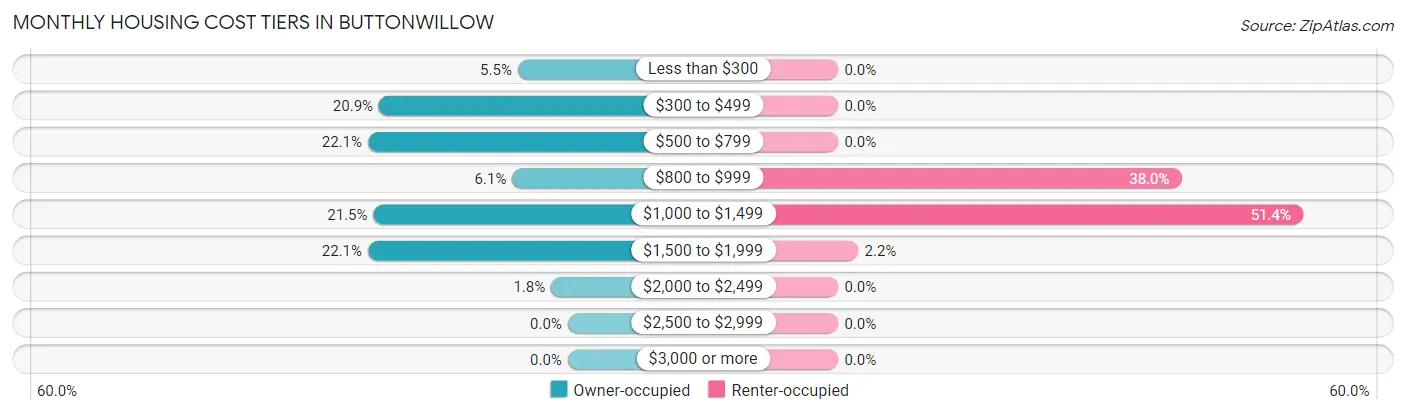
| Monthly Cost | Owner-occupied | Renter-occupied |
| Less than $300 | 9 (5.5%) | 0 (0.0%) |
| $300 to $499 | 34 (20.9%) | 0 (0.0%) |
| $500 to $799 | 36 (22.1%) | 0 (0.0%) |
| $800 to $999 | 10 (6.1%) | 68 (38.0%) |
| $1,000 to $1,499 | 35 (21.5%) | 92 (51.4%) |
| $1,500 to $1,999 | 36 (22.1%) | 4 (2.2%) |
| $2,000 to $2,499 | 3 (1.8%) | 0 (0.0%) |
| $2,500 to $2,999 | 0 (0.0%) | 0 (0.0%) |
| $3,000 or more | 0 (0.0%) | 0 (0.0%) |
| Total | 163 (100.0%) | 179 (100.0%) |
Physical Housing Characteristics in Buttonwillow
Housing Structures in Buttonwillow
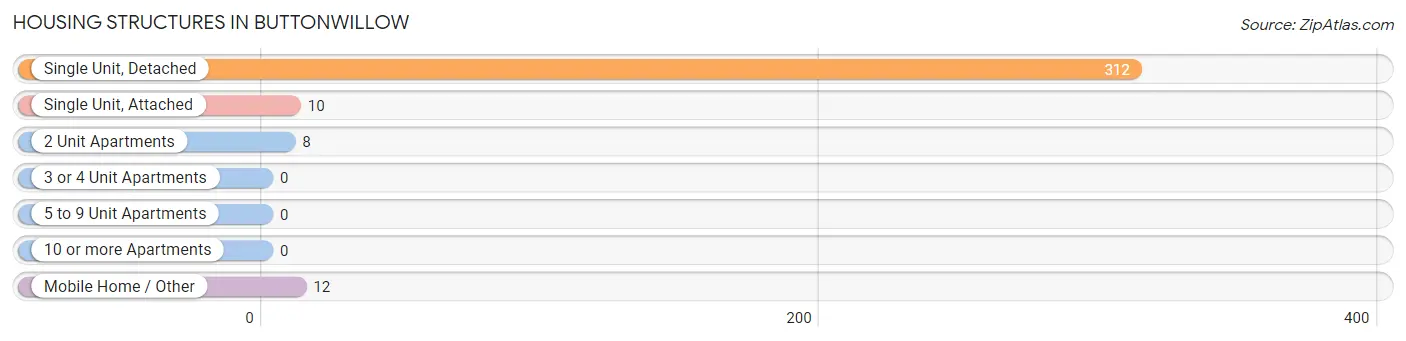
| Structure Type | # Housing Units | % Housing Units |
| Single Unit, Detached | 312 | 91.2% |
| Single Unit, Attached | 10 | 2.9% |
| 2 Unit Apartments | 8 | 2.3% |
| 3 or 4 Unit Apartments | 0 | 0.0% |
| 5 to 9 Unit Apartments | 0 | 0.0% |
| 10 or more Apartments | 0 | 0.0% |
| Mobile Home / Other | 12 | 3.5% |
| Total | 342 | 100.0% |
Housing Structures by Occupancy in Buttonwillow
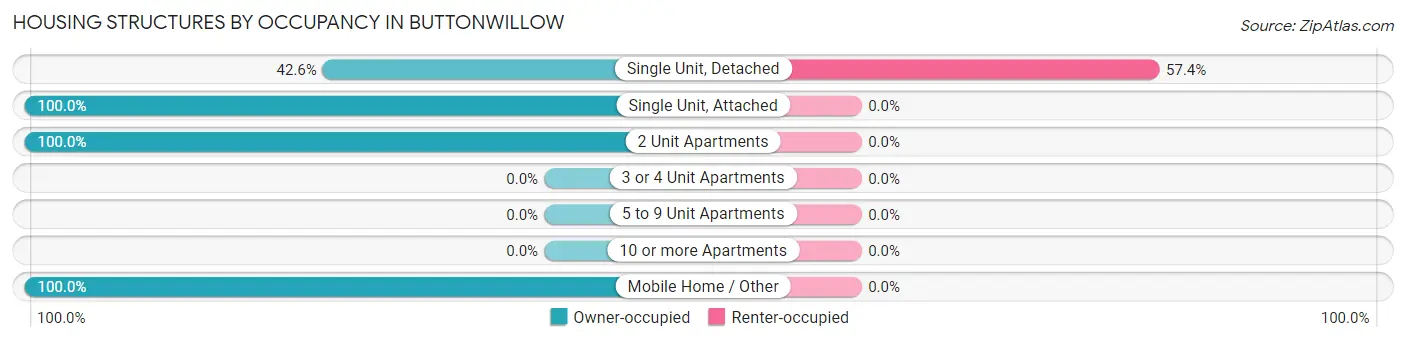
| Structure Type | Owner-occupied | Renter-occupied |
| Single Unit, Detached | 133 (42.6%) | 179 (57.4%) |
| Single Unit, Attached | 10 (100.0%) | 0 (0.0%) |
| 2 Unit Apartments | 8 (100.0%) | 0 (0.0%) |
| 3 or 4 Unit Apartments | 0 (0.0%) | 0 (0.0%) |
| 5 to 9 Unit Apartments | 0 (0.0%) | 0 (0.0%) |
| 10 or more Apartments | 0 (0.0%) | 0 (0.0%) |
| Mobile Home / Other | 12 (100.0%) | 0 (0.0%) |
| Total | 163 (47.7%) | 179 (52.3%) |
Housing Structures by Number of Rooms in Buttonwillow
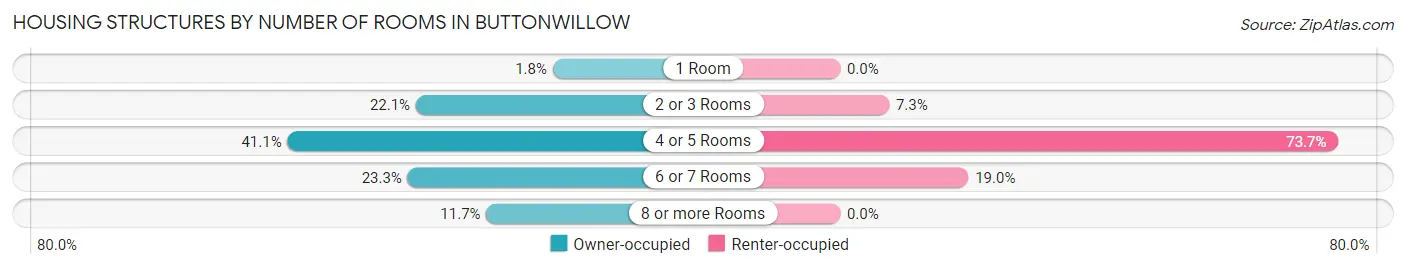
| Number of Rooms | Owner-occupied | Renter-occupied |
| 1 Room | 3 (1.8%) | 0 (0.0%) |
| 2 or 3 Rooms | 36 (22.1%) | 13 (7.3%) |
| 4 or 5 Rooms | 67 (41.1%) | 132 (73.7%) |
| 6 or 7 Rooms | 38 (23.3%) | 34 (19.0%) |
| 8 or more Rooms | 19 (11.7%) | 0 (0.0%) |
| Total | 163 (100.0%) | 179 (100.0%) |
Housing Structure by Heating Type in Buttonwillow
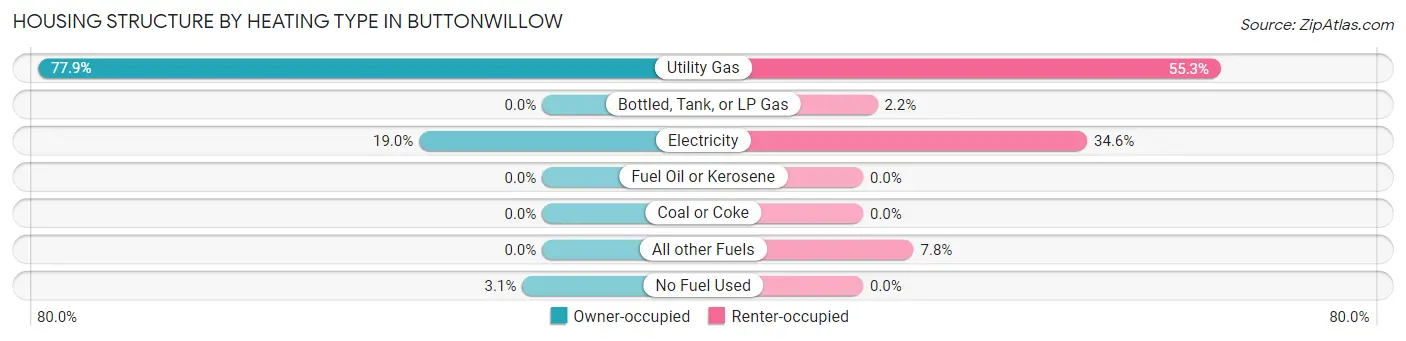
| Heating Type | Owner-occupied | Renter-occupied |
| Utility Gas | 127 (77.9%) | 99 (55.3%) |
| Bottled, Tank, or LP Gas | 0 (0.0%) | 4 (2.2%) |
| Electricity | 31 (19.0%) | 62 (34.6%) |
| Fuel Oil or Kerosene | 0 (0.0%) | 0 (0.0%) |
| Coal or Coke | 0 (0.0%) | 0 (0.0%) |
| All other Fuels | 0 (0.0%) | 14 (7.8%) |
| No Fuel Used | 5 (3.1%) | 0 (0.0%) |
| Total | 163 (100.0%) | 179 (100.0%) |
Household Vehicle Usage in Buttonwillow
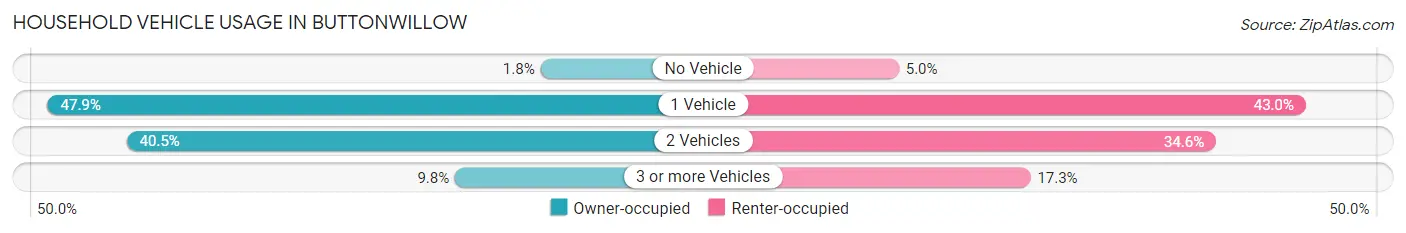
| Vehicles per Household | Owner-occupied | Renter-occupied |
| No Vehicle | 3 (1.8%) | 9 (5.0%) |
| 1 Vehicle | 78 (47.8%) | 77 (43.0%) |
| 2 Vehicles | 66 (40.5%) | 62 (34.6%) |
| 3 or more Vehicles | 16 (9.8%) | 31 (17.3%) |
| Total | 163 (100.0%) | 179 (100.0%) |
Real Estate & Mortgages in Buttonwillow
Real Estate and Mortgage Overview in Buttonwillow
| Characteristic | Without Mortgage | With Mortgage |
| Housing Units | 69 | 94 |
| Median Property Value | $225,600 | $119,700 |
| Median Household Income | $23,092 | $14 |
| Monthly Housing Costs | $443 | $0 |
| Real Estate Taxes | $1,610 | $14 |
Property Value by Mortgage Status in Buttonwillow
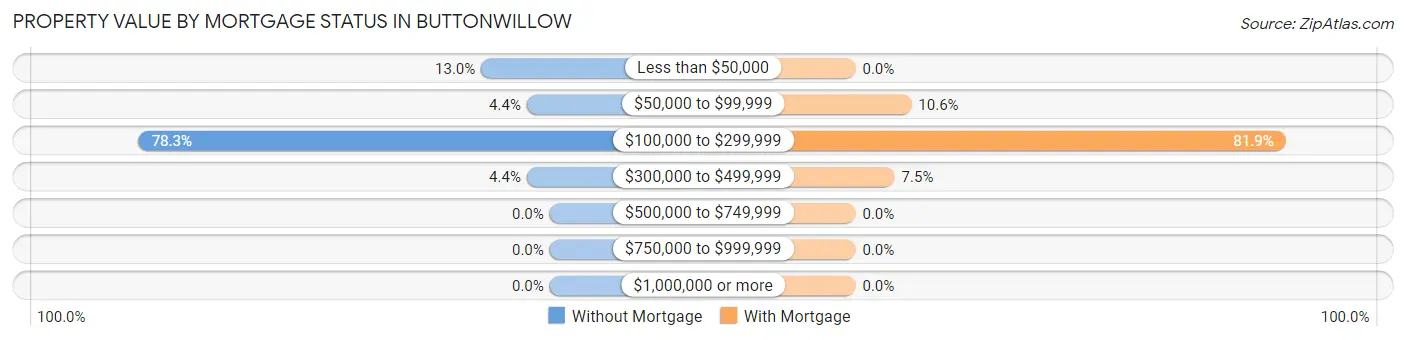
| Property Value | Without Mortgage | With Mortgage |
| Less than $50,000 | 9 (13.0%) | 0 (0.0%) |
| $50,000 to $99,999 | 3 (4.3%) | 10 (10.6%) |
| $100,000 to $299,999 | 54 (78.3%) | 77 (81.9%) |
| $300,000 to $499,999 | 3 (4.3%) | 7 (7.4%) |
| $500,000 to $749,999 | 0 (0.0%) | 0 (0.0%) |
| $750,000 to $999,999 | 0 (0.0%) | 0 (0.0%) |
| $1,000,000 or more | 0 (0.0%) | 0 (0.0%) |
| Total | 69 (100.0%) | 94 (100.0%) |
Household Income by Mortgage Status in Buttonwillow
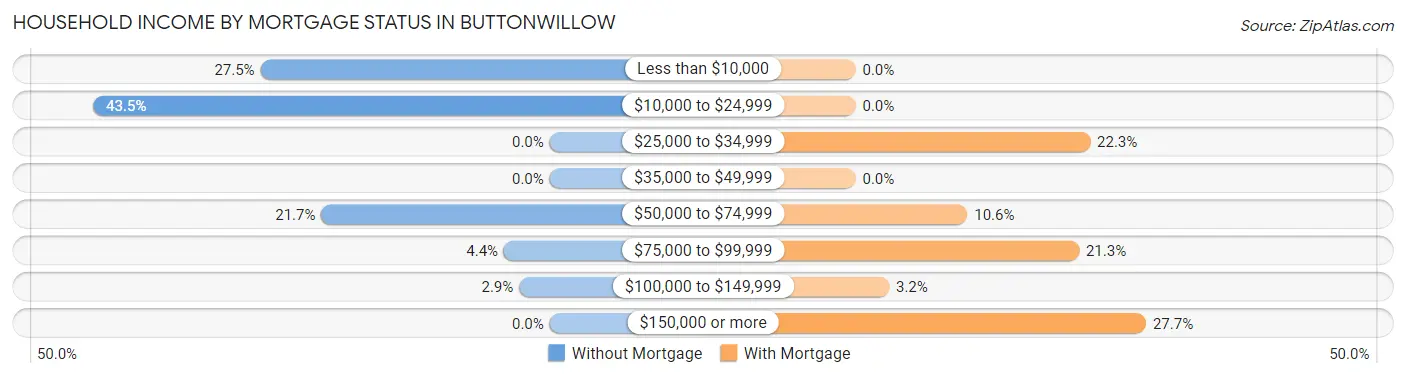
| Household Income | Without Mortgage | With Mortgage |
| Less than $10,000 | 19 (27.5%) | 0 (0.0%) |
| $10,000 to $24,999 | 30 (43.5%) | 0 (0.0%) |
| $25,000 to $34,999 | 0 (0.0%) | 21 (22.3%) |
| $35,000 to $49,999 | 0 (0.0%) | 0 (0.0%) |
| $50,000 to $74,999 | 15 (21.7%) | 10 (10.6%) |
| $75,000 to $99,999 | 3 (4.3%) | 20 (21.3%) |
| $100,000 to $149,999 | 2 (2.9%) | 3 (3.2%) |
| $150,000 or more | 0 (0.0%) | 26 (27.7%) |
| Total | 69 (100.0%) | 94 (100.0%) |
Property Value to Household Income Ratio in Buttonwillow
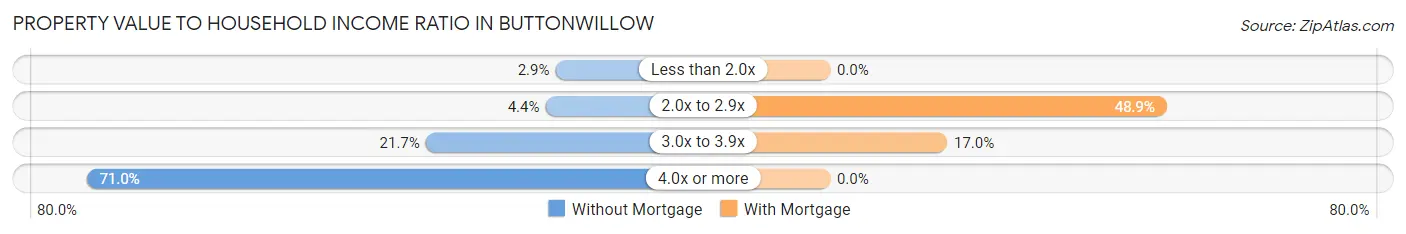
| Value-to-Income Ratio | Without Mortgage | With Mortgage |
| Less than 2.0x | 2 (2.9%) | 0 (0.0%) |
| 2.0x to 2.9x | 3 (4.3%) | 46 (48.9%) |
| 3.0x to 3.9x | 15 (21.7%) | 16 (17.0%) |
| 4.0x or more | 49 (71.0%) | 0 (0.0%) |
| Total | 69 (100.0%) | 94 (100.0%) |
Real Estate Taxes by Mortgage Status in Buttonwillow
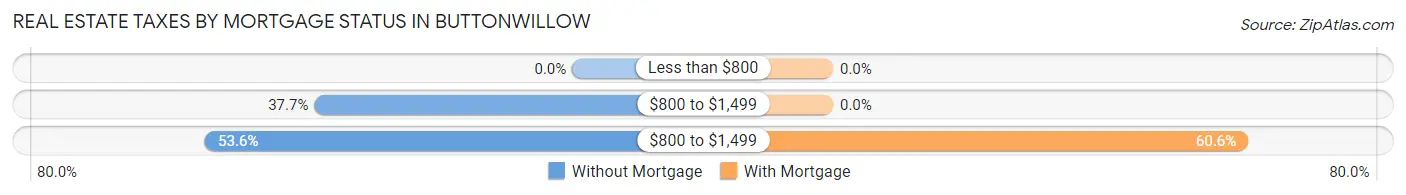
| Property Taxes | Without Mortgage | With Mortgage |
| Less than $800 | 0 (0.0%) | 0 (0.0%) |
| $800 to $1,499 | 26 (37.7%) | 0 (0.0%) |
| $800 to $1,499 | 37 (53.6%) | 57 (60.6%) |
| Total | 69 (100.0%) | 94 (100.0%) |
Health & Disability in Buttonwillow
Health Insurance Coverage by Age in Buttonwillow
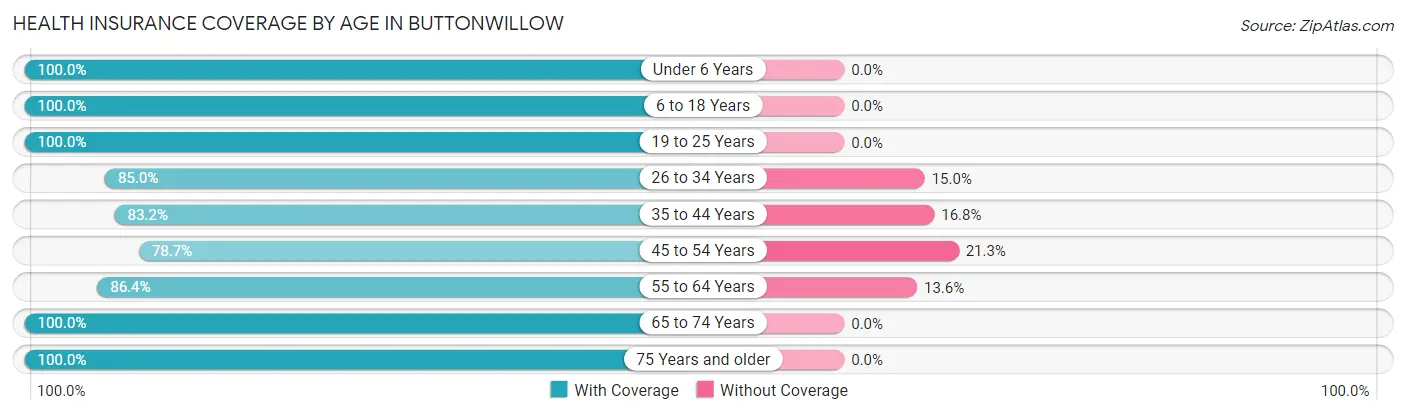
| Age Bracket | With Coverage | Without Coverage |
| Under 6 Years | 93 (100.0%) | 0 (0.0%) |
| 6 to 18 Years | 334 (100.0%) | 0 (0.0%) |
| 19 to 25 Years | 98 (100.0%) | 0 (0.0%) |
| 26 to 34 Years | 102 (85.0%) | 18 (15.0%) |
| 35 to 44 Years | 124 (83.2%) | 25 (16.8%) |
| 45 to 54 Years | 59 (78.7%) | 16 (21.3%) |
| 55 to 64 Years | 121 (86.4%) | 19 (13.6%) |
| 65 to 74 Years | 75 (100.0%) | 0 (0.0%) |
| 75 Years and older | 61 (100.0%) | 0 (0.0%) |
| Total | 1,067 (93.2%) | 78 (6.8%) |
Health Insurance Coverage by Citizenship Status in Buttonwillow
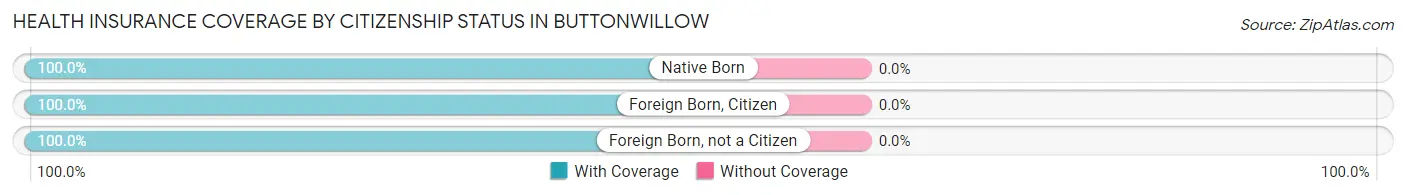
| Citizenship Status | With Coverage | Without Coverage |
| Native Born | 93 (100.0%) | 0 (0.0%) |
| Foreign Born, Citizen | 334 (100.0%) | 0 (0.0%) |
| Foreign Born, not a Citizen | 98 (100.0%) | 0 (0.0%) |
Health Insurance Coverage by Household Income in Buttonwillow
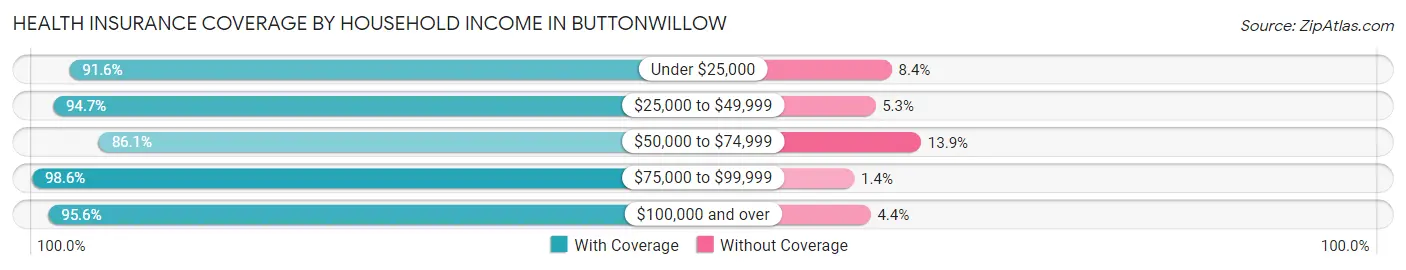
| Household Income | With Coverage | Without Coverage |
| Under $25,000 | 273 (91.6%) | 25 (8.4%) |
| $25,000 to $49,999 | 178 (94.7%) | 10 (5.3%) |
| $50,000 to $74,999 | 186 (86.1%) | 30 (13.9%) |
| $75,000 to $99,999 | 215 (98.6%) | 3 (1.4%) |
| $100,000 and over | 215 (95.6%) | 10 (4.4%) |
Public vs Private Health Insurance Coverage by Age in Buttonwillow
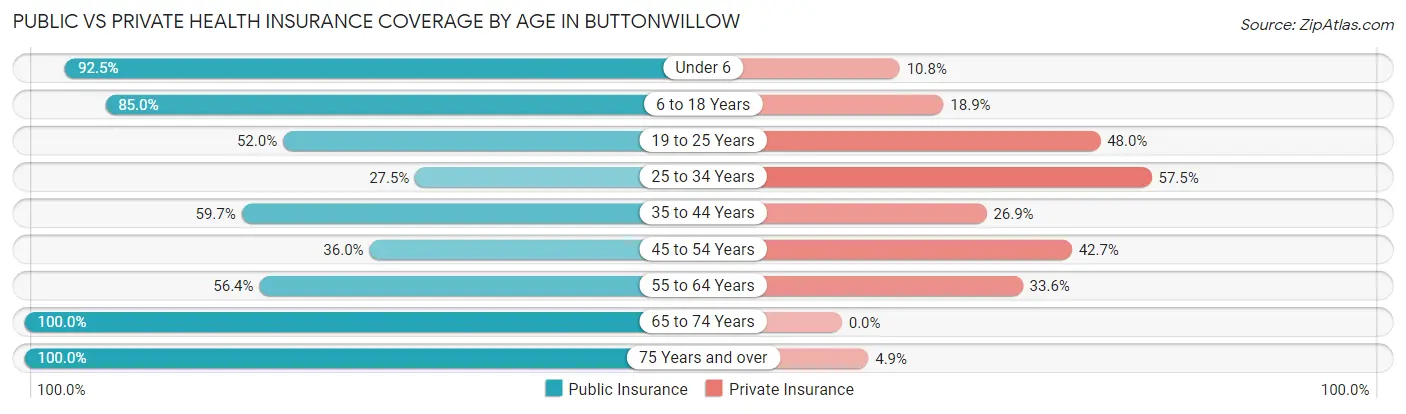
| Age Bracket | Public Insurance | Private Insurance |
| Under 6 | 86 (92.5%) | 10 (10.7%) |
| 6 to 18 Years | 284 (85.0%) | 63 (18.9%) |
| 19 to 25 Years | 51 (52.0%) | 47 (48.0%) |
| 25 to 34 Years | 33 (27.5%) | 69 (57.5%) |
| 35 to 44 Years | 89 (59.7%) | 40 (26.9%) |
| 45 to 54 Years | 27 (36.0%) | 32 (42.7%) |
| 55 to 64 Years | 79 (56.4%) | 47 (33.6%) |
| 65 to 74 Years | 75 (100.0%) | 0 (0.0%) |
| 75 Years and over | 61 (100.0%) | 3 (4.9%) |
| Total | 785 (68.6%) | 311 (27.2%) |
Disability Status by Sex by Age in Buttonwillow
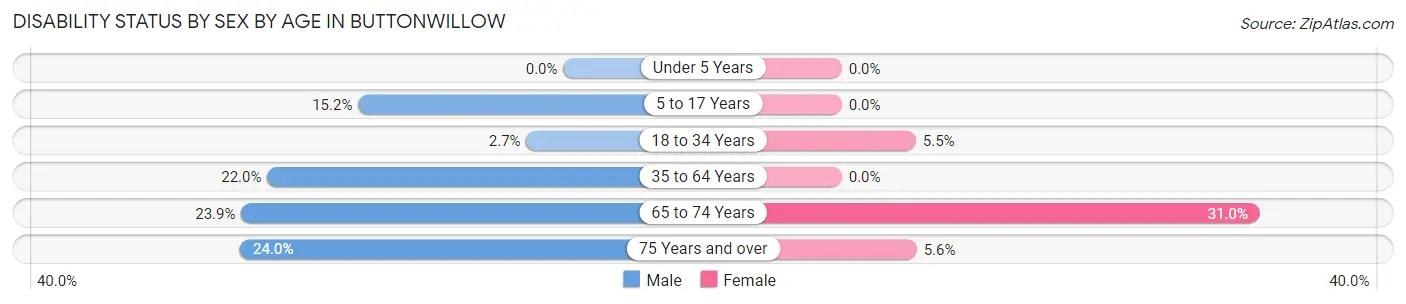
| Age Bracket | Male | Female |
| Under 5 Years | 0 (0.0%) | 0 (0.0%) |
| 5 to 17 Years | 23 (15.2%) | 0 (0.0%) |
| 18 to 34 Years | 4 (2.7%) | 6 (5.5%) |
| 35 to 64 Years | 40 (22.0%) | 0 (0.0%) |
| 65 to 74 Years | 11 (23.9%) | 9 (31.0%) |
| 75 Years and over | 6 (24.0%) | 2 (5.6%) |
Disability Class by Sex by Age in Buttonwillow
Disability Class: Hearing Difficulty
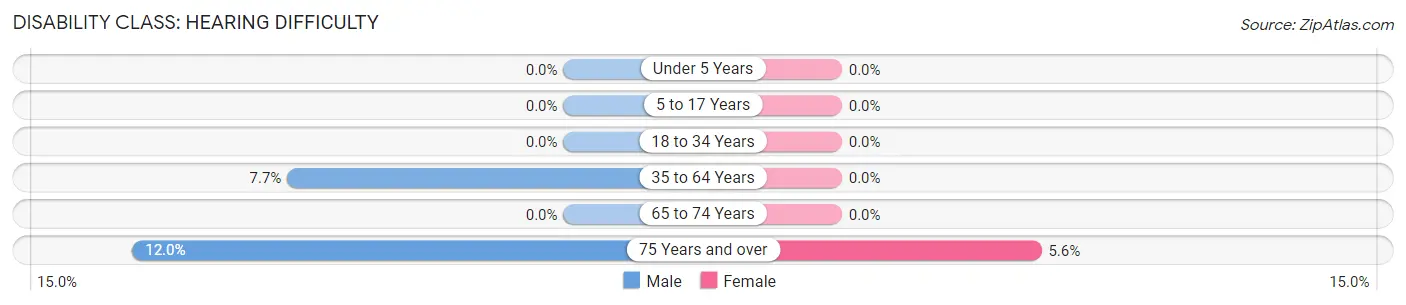
| Age Bracket | Male | Female |
| Under 5 Years | 0 (0.0%) | 0 (0.0%) |
| 5 to 17 Years | 0 (0.0%) | 0 (0.0%) |
| 18 to 34 Years | 0 (0.0%) | 0 (0.0%) |
| 35 to 64 Years | 14 (7.7%) | 0 (0.0%) |
| 65 to 74 Years | 0 (0.0%) | 0 (0.0%) |
| 75 Years and over | 3 (12.0%) | 2 (5.6%) |
Disability Class: Vision Difficulty
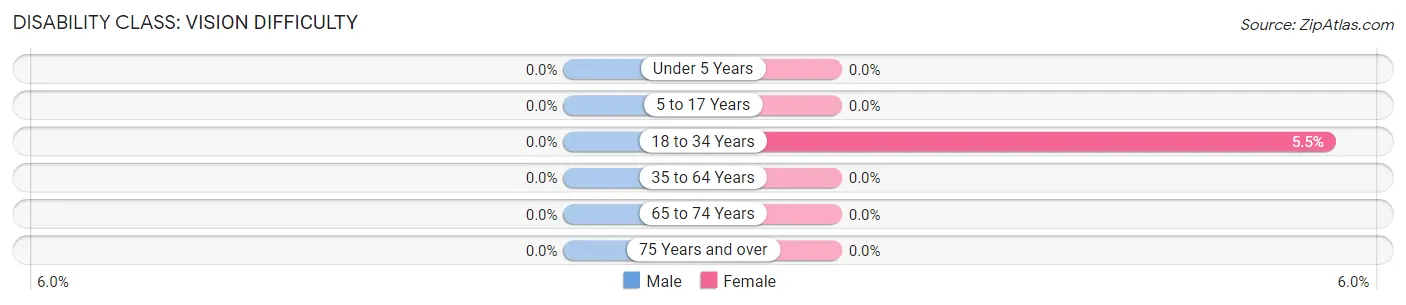
| Age Bracket | Male | Female |
| Under 5 Years | 0 (0.0%) | 0 (0.0%) |
| 5 to 17 Years | 0 (0.0%) | 0 (0.0%) |
| 18 to 34 Years | 0 (0.0%) | 6 (5.5%) |
| 35 to 64 Years | 0 (0.0%) | 0 (0.0%) |
| 65 to 74 Years | 0 (0.0%) | 0 (0.0%) |
| 75 Years and over | 0 (0.0%) | 0 (0.0%) |
Disability Class: Cognitive Difficulty
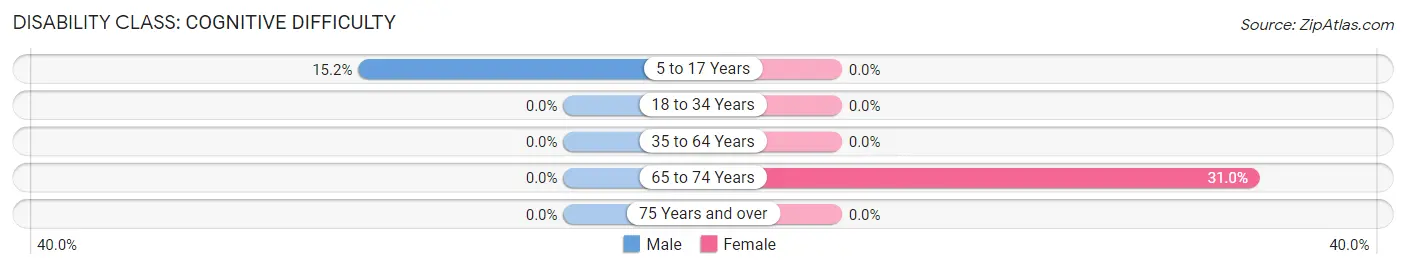
| Age Bracket | Male | Female |
| 5 to 17 Years | 23 (15.2%) | 0 (0.0%) |
| 18 to 34 Years | 0 (0.0%) | 0 (0.0%) |
| 35 to 64 Years | 0 (0.0%) | 0 (0.0%) |
| 65 to 74 Years | 0 (0.0%) | 9 (31.0%) |
| 75 Years and over | 0 (0.0%) | 0 (0.0%) |
Disability Class: Ambulatory Difficulty
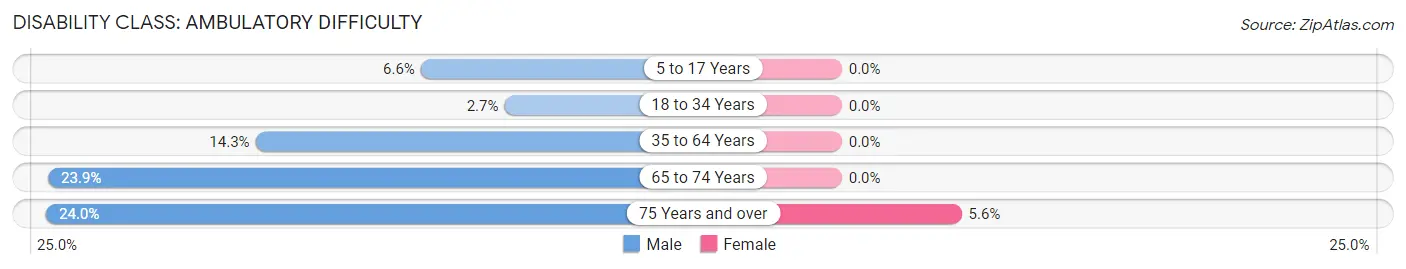
| Age Bracket | Male | Female |
| 5 to 17 Years | 10 (6.6%) | 0 (0.0%) |
| 18 to 34 Years | 4 (2.7%) | 0 (0.0%) |
| 35 to 64 Years | 26 (14.3%) | 0 (0.0%) |
| 65 to 74 Years | 11 (23.9%) | 0 (0.0%) |
| 75 Years and over | 6 (24.0%) | 2 (5.6%) |
Disability Class: Self-Care Difficulty
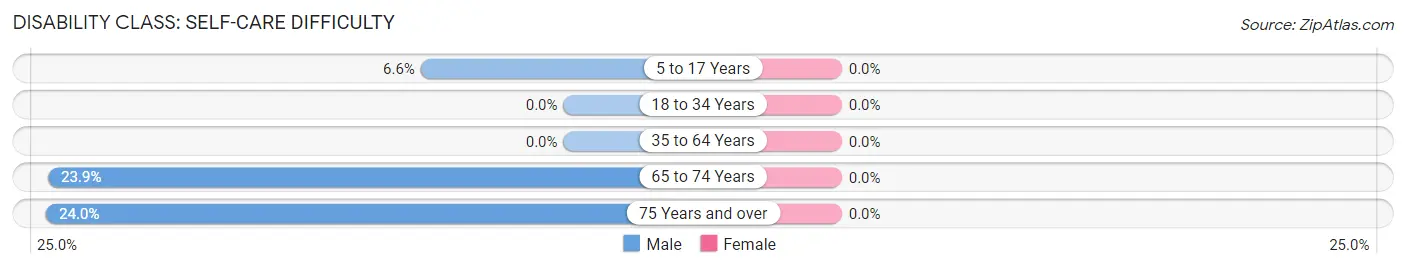
| Age Bracket | Male | Female |
| 5 to 17 Years | 10 (6.6%) | 0 (0.0%) |
| 18 to 34 Years | 0 (0.0%) | 0 (0.0%) |
| 35 to 64 Years | 0 (0.0%) | 0 (0.0%) |
| 65 to 74 Years | 11 (23.9%) | 0 (0.0%) |
| 75 Years and over | 6 (24.0%) | 0 (0.0%) |
Technology Access in Buttonwillow
Computing Device Access in Buttonwillow
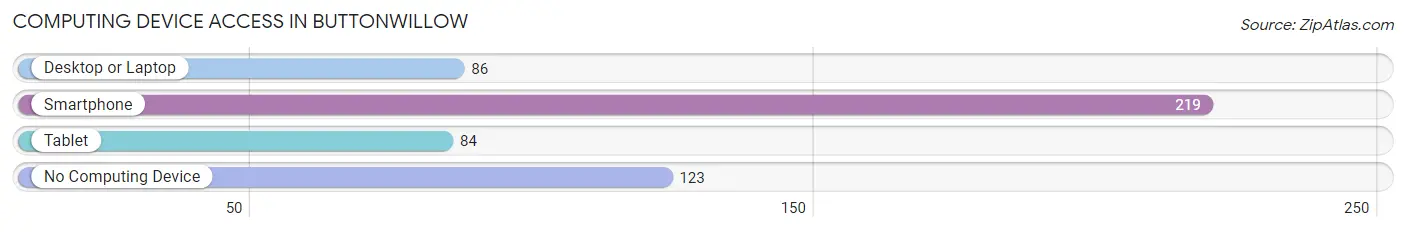
| Device Type | # Households | % Households |
| Desktop or Laptop | 86 | 25.2% |
| Smartphone | 219 | 64.0% |
| Tablet | 84 | 24.6% |
| No Computing Device | 123 | 36.0% |
| Total | 342 | 100.0% |
Internet Access in Buttonwillow
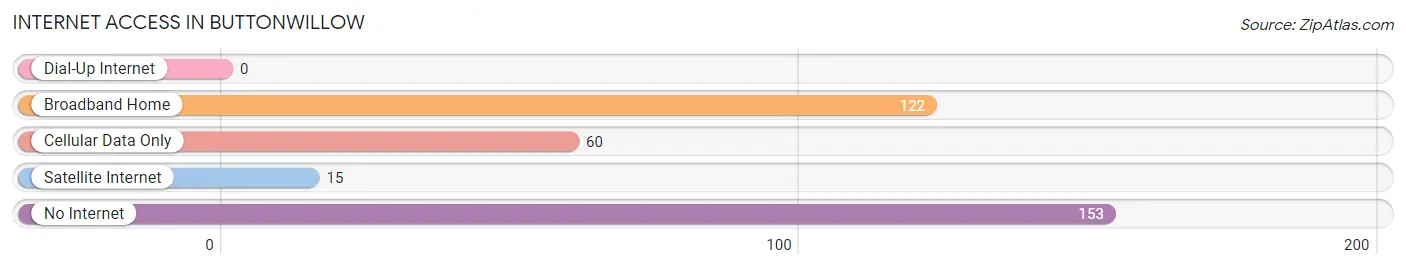
| Internet Type | # Households | % Households |
| Dial-Up Internet | 0 | 0.0% |
| Broadband Home | 122 | 35.7% |
| Cellular Data Only | 60 | 17.5% |
| Satellite Internet | 15 | 4.4% |
| No Internet | 153 | 44.7% |
| Total | 342 | 100.0% |
Buttonwillow Summary
Willow, California is a small unincorporated community located in Kern County, California. It is situated in the San Joaquin Valley, approximately 20 miles west of Bakersfield. The population of Willow was estimated to be 1,845 in 2019.
History
Willow was founded in 1876 by William and Mary Ann Willoughby, who were among the first settlers in the area. The Willoughby family had previously lived in the nearby town of Tehachapi, but moved to Willow in search of better farming opportunities. The town was originally known as Willoughby Station, but the name was changed to Willow in 1882.
The town grew slowly over the years, and by the early 1900s, it had become a thriving agricultural community. The town was home to a variety of crops, including cotton, alfalfa, and wheat. In addition, the town was home to a number of businesses, including a general store, a blacksmith shop, and a hotel.
In the early 1900s, the town was also home to a number of churches, including the First Baptist Church, the Methodist Episcopal Church, and the Church of the Nazarene. The town also had a school, which was established in 1891.
Geography
Willow is located in the San Joaquin Valley, approximately 20 miles west of Bakersfield. The town is situated at an elevation of approximately 1,000 feet above sea level. The town is surrounded by rolling hills and is located near the Kern River.
The climate in Willow is generally warm and dry, with temperatures ranging from the mid-50s in the winter to the mid-90s in the summer. The town receives an average of 8 inches of rain per year.
Economy
The economy of Willow is largely based on agriculture. The town is home to a variety of crops, including cotton, alfalfa, and wheat. In addition, the town is home to a number of businesses, including a general store, a blacksmith shop, and a hotel.
Demographics
As of 2019, the population of Willow was estimated to be 1,845. The town is predominantly white, with approximately 75% of the population identifying as white. The remaining 25% of the population is made up of a variety of other ethnicities, including Hispanic, African American, and Asian. The median household income in Willow is approximately $45,000.
Common Questions
What is Per Capita Income in Buttonwillow?
Per Capita income in Buttonwillow is $18,173.
What is the Median Family Income in Buttonwillow?
Median Family Income in Buttonwillow is $32,054.
What is the Median Household income in Buttonwillow?
Median Household Income in Buttonwillow is $38,750.
What is Income or Wage Gap in Buttonwillow?
Income or Wage Gap in Buttonwillow is 40.0%.
Women in Buttonwillow earn 60.0 cents for every dollar earned by a man.
What is Family Income Deficit in Buttonwillow?
Family Income Deficit in Buttonwillow is $9,683.
Families that are below poverty line in Buttonwillow earn $9,683 less on average than the poverty threshold level.
What is Inequality or Gini Index in Buttonwillow?
Inequality or Gini Index in Buttonwillow is 0.51.
What is the Total Population of Buttonwillow?
Total Population of Buttonwillow is 1,148.
What is the Total Male Population of Buttonwillow?
Total Male Population of Buttonwillow is 594.
What is the Total Female Population of Buttonwillow?
Total Female Population of Buttonwillow is 554.
What is the Ratio of Males per 100 Females in Buttonwillow?
There are 107.22 Males per 100 Females in Buttonwillow.
What is the Ratio of Females per 100 Males in Buttonwillow?
There are 93.27 Females per 100 Males in Buttonwillow.
What is the Median Population Age in Buttonwillow?
Median Population Age in Buttonwillow is 28.7 Years.
What is the Average Family Size in Buttonwillow
Average Family Size in Buttonwillow is 3.8 People.
What is the Average Household Size in Buttonwillow
Average Household Size in Buttonwillow is 3.4 People.
How Large is the Labor Force in Buttonwillow?
There are 385 People in the Labor Forcein in Buttonwillow.
What is the Percentage of People in the Labor Force in Buttonwillow?
48.4% of People are in the Labor Force in Buttonwillow.
What is the Unemployment Rate in Buttonwillow?
Unemployment Rate in Buttonwillow is 8.8%.