Cities with the Highest Percentage of Immigrants from China in California
RELATED REPORTS & OPTIONS
China
California
Compare Cities
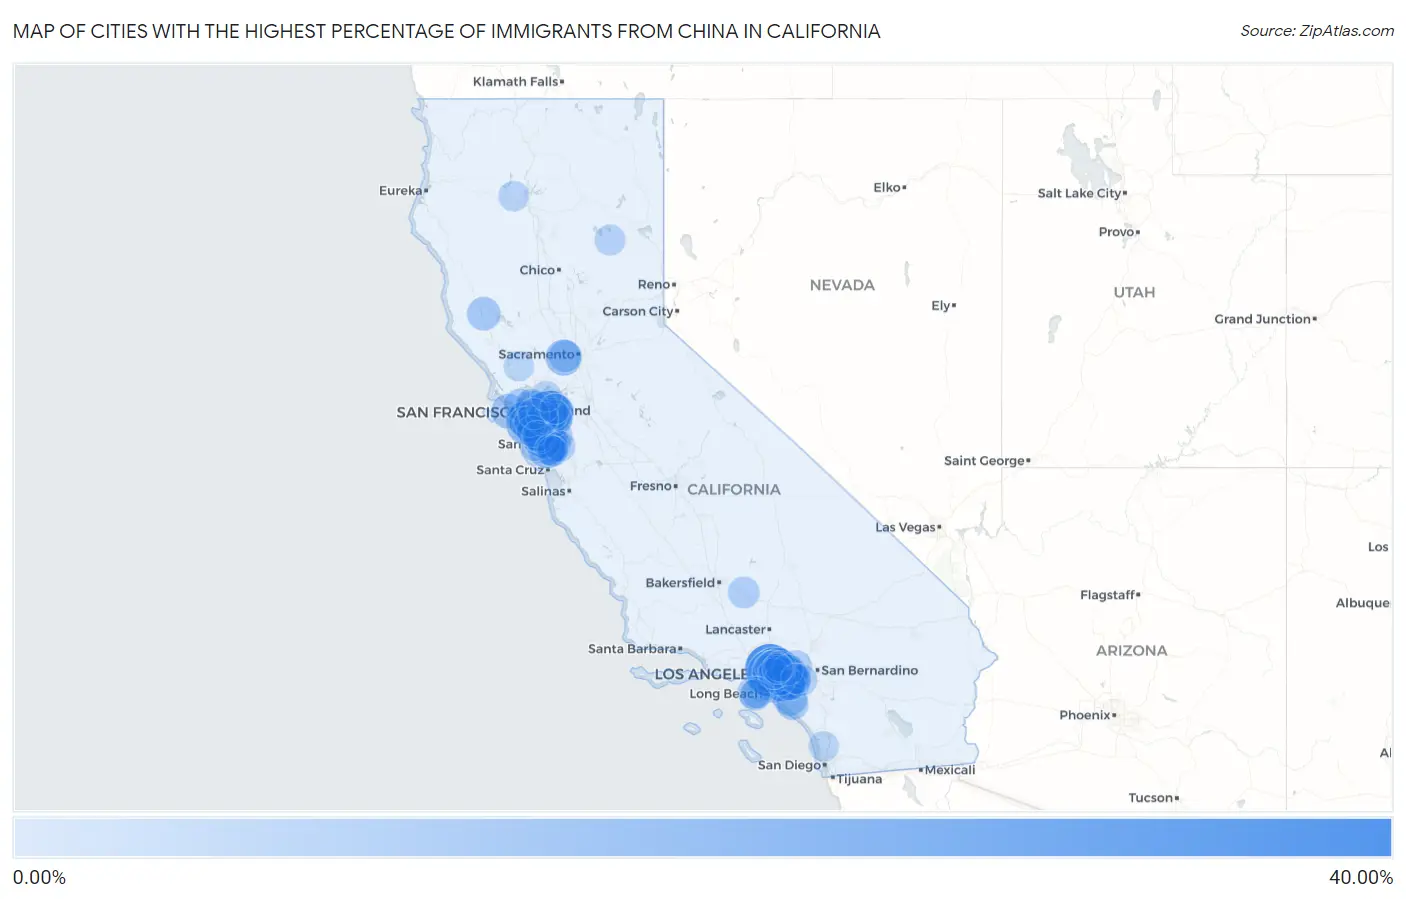
Map of Cities with the Highest Percentage of Immigrants from China in California
0.00%
40.00%
Cities with the Highest Percentage of Immigrants from China in California
| City | China | vs State | vs National | |
| 1. | San Marino | 36.35% | 2.45%(+33.9)#1 | 0.85%(+35.5)#4 |
| 2. | Norris Canyon | 30.82% | 2.45%(+28.4)#2 | 0.85%(+30.0)#7 |
| 3. | Monterey Park | 30.69% | 2.45%(+28.2)#3 | 0.85%(+29.8)#8 |
| 4. | Rowland Heights | 28.75% | 2.45%(+26.3)#4 | 0.85%(+27.9)#10 |
| 5. | Temple City | 27.63% | 2.45%(+25.2)#5 | 0.85%(+26.8)#11 |
| 6. | Walnut | 26.46% | 2.45%(+24.0)#6 | 0.85%(+25.6)#12 |
| 7. | San Gabriel | 26.31% | 2.45%(+23.9)#7 | 0.85%(+25.5)#13 |
| 8. | East San Gabriel | 26.04% | 2.45%(+23.6)#8 | 0.85%(+25.2)#14 |
| 9. | Arcadia | 25.99% | 2.45%(+23.5)#9 | 0.85%(+25.1)#15 |
| 10. | Alhambra | 22.31% | 2.45%(+19.9)#10 | 0.85%(+21.5)#17 |
| 11. | Diamond Bar | 22.00% | 2.45%(+19.5)#11 | 0.85%(+21.2)#18 |
| 12. | Rosemead | 19.80% | 2.45%(+17.3)#12 | 0.85%(+18.9)#21 |
| 13. | Millbrae | 19.44% | 2.45%(+17.0)#13 | 0.85%(+18.6)#22 |
| 14. | Cupertino | 18.95% | 2.45%(+16.5)#14 | 0.85%(+18.1)#23 |
| 15. | Saratoga | 18.83% | 2.45%(+16.4)#15 | 0.85%(+18.0)#25 |
| 16. | Hacienda Heights | 18.02% | 2.45%(+15.6)#16 | 0.85%(+17.2)#27 |
| 17. | South San Gabriel | 17.43% | 2.45%(+15.0)#17 | 0.85%(+16.6)#28 |
| 18. | Foster City | 15.96% | 2.45%(+13.5)#18 | 0.85%(+15.1)#29 |
| 19. | Bradbury | 15.38% | 2.45%(+12.9)#19 | 0.85%(+14.5)#30 |
| 20. | University Of California Davis | 14.27% | 2.45%(+11.8)#20 | 0.85%(+13.4)#35 |
| 21. | Chino Hills | 13.50% | 2.45%(+11.0)#21 | 0.85%(+12.6)#38 |
| 22. | Los Altos Hills | 13.26% | 2.45%(+10.8)#22 | 0.85%(+12.4)#39 |
| 23. | Brisbane | 12.78% | 2.45%(+10.3)#23 | 0.85%(+11.9)#42 |
| 24. | Sunnyvale | 12.78% | 2.45%(+10.3)#24 | 0.85%(+11.9)#43 |
| 25. | San Francisco | 12.38% | 2.45%(+9.92)#25 | 0.85%(+11.5)#45 |
| 26. | Camino Tassajara | 12.01% | 2.45%(+9.55)#26 | 0.85%(+11.2)#47 |
| 27. | North El Monte | 11.98% | 2.45%(+9.52)#27 | 0.85%(+11.1)#48 |
| 28. | Broadmoor | 11.74% | 2.45%(+9.29)#28 | 0.85%(+10.9)#52 |
| 29. | Palo Alto | 11.41% | 2.45%(+8.95)#29 | 0.85%(+10.6)#55 |
| 30. | Fremont | 11.32% | 2.45%(+8.86)#30 | 0.85%(+10.5)#56 |
| 31. | Irvine | 10.96% | 2.45%(+8.50)#31 | 0.85%(+10.1)#60 |
| 32. | Hillsborough | 10.93% | 2.45%(+8.48)#32 | 0.85%(+10.1)#61 |
| 33. | East Pasadena | 10.80% | 2.45%(+8.34)#33 | 0.85%(+9.94)#62 |
| 34. | Daly City | 10.72% | 2.45%(+8.27)#34 | 0.85%(+9.87)#63 |
| 35. | San Leandro | 10.70% | 2.45%(+8.25)#35 | 0.85%(+9.85)#64 |
| 36. | Fruitdale | 10.66% | 2.45%(+8.21)#36 | 0.85%(+9.81)#65 |
| 37. | Mayflower Village | 10.37% | 2.45%(+7.91)#37 | 0.85%(+9.51)#67 |
| 38. | Talmage | 10.09% | 2.45%(+7.63)#38 | 0.85%(+9.23)#72 |
| 39. | Mountain View | 9.91% | 2.45%(+7.46)#39 | 0.85%(+9.06)#74 |
| 40. | Newark | 9.87% | 2.45%(+7.42)#40 | 0.85%(+9.02)#75 |
| 41. | Santa Clara | 9.63% | 2.45%(+7.17)#41 | 0.85%(+8.77)#77 |
| 42. | El Monte | 9.52% | 2.45%(+7.06)#42 | 0.85%(+8.66)#78 |
| 43. | Los Altos | 9.35% | 2.45%(+6.90)#43 | 0.85%(+8.50)#80 |
| 44. | Castro Valley | 9.20% | 2.45%(+6.74)#44 | 0.85%(+8.34)#83 |
| 45. | University Of California-Santa Barbara | 9.03% | 2.45%(+6.57)#45 | 0.85%(+8.17)#86 |
| 46. | Milpitas | 8.98% | 2.45%(+6.52)#46 | 0.85%(+8.12)#88 |
| 47. | Emeryville | 8.92% | 2.45%(+6.46)#47 | 0.85%(+8.06)#89 |
| 48. | South Pasadena | 8.62% | 2.45%(+6.17)#48 | 0.85%(+7.77)#93 |
| 49. | Union City | 8.52% | 2.45%(+6.07)#49 | 0.85%(+7.67)#95 |
| 50. | Cerritos | 8.52% | 2.45%(+6.06)#50 | 0.85%(+7.67)#96 |
| 51. | San Pasqual | 8.48% | 2.45%(+6.02)#51 | 0.85%(+7.63)#98 |
| 52. | Loyola | 8.46% | 2.45%(+6.01)#52 | 0.85%(+7.61)#99 |
| 53. | Palos Verdes Estates | 8.37% | 2.45%(+5.91)#53 | 0.85%(+7.51)#102 |
| 54. | Laguna Woods | 8.25% | 2.45%(+5.80)#54 | 0.85%(+7.40)#105 |
| 55. | Marin City | 8.19% | 2.45%(+5.73)#55 | 0.85%(+7.34)#106 |
| 56. | Sierra Madre | 8.18% | 2.45%(+5.72)#56 | 0.85%(+7.32)#107 |
| 57. | West Covina | 8.12% | 2.45%(+5.67)#57 | 0.85%(+7.27)#110 |
| 58. | Pleasanton | 8.08% | 2.45%(+5.62)#58 | 0.85%(+7.22)#111 |
| 59. | Albany | 8.04% | 2.45%(+5.58)#59 | 0.85%(+7.18)#112 |
| 60. | Davis | 7.70% | 2.45%(+5.24)#60 | 0.85%(+6.84)#122 |
| 61. | San Mateo | 7.56% | 2.45%(+5.10)#61 | 0.85%(+6.70)#127 |
| 62. | La Honda | 7.52% | 2.45%(+5.07)#62 | 0.85%(+6.67)#129 |
| 63. | Atherton | 7.44% | 2.45%(+4.98)#63 | 0.85%(+6.59)#131 |
| 64. | Dublin | 7.27% | 2.45%(+4.82)#64 | 0.85%(+6.42)#135 |
| 65. | San Bruno | 7.19% | 2.45%(+4.73)#65 | 0.85%(+6.33)#139 |
| 66. | Keene | 7.18% | 2.45%(+4.72)#66 | 0.85%(+6.32)#140 |
| 67. | San Antonio Heights | 7.16% | 2.45%(+4.71)#67 | 0.85%(+6.31)#141 |
| 68. | Eastvale | 7.15% | 2.45%(+4.70)#68 | 0.85%(+6.30)#142 |
| 69. | Burlingame | 7.15% | 2.45%(+4.69)#69 | 0.85%(+6.29)#143 |
| 70. | San Ramon | 7.07% | 2.45%(+4.62)#70 | 0.85%(+6.22)#147 |
| 71. | Campbell | 7.03% | 2.45%(+4.58)#71 | 0.85%(+6.18)#149 |
| 72. | Stanford | 6.97% | 2.45%(+4.52)#72 | 0.85%(+6.12)#151 |
| 73. | Baldwin Park | 6.79% | 2.45%(+4.33)#73 | 0.85%(+5.93)#157 |
| 74. | San Lorenzo | 6.71% | 2.45%(+4.25)#74 | 0.85%(+5.85)#160 |
| 75. | Ashland | 6.70% | 2.45%(+4.25)#75 | 0.85%(+5.85)#161 |
| 76. | Rolling Hills Estates | 6.67% | 2.45%(+4.22)#76 | 0.85%(+5.82)#162 |
| 77. | South San Francisco | 6.60% | 2.45%(+4.15)#77 | 0.85%(+5.75)#165 |
| 78. | Moraga | 6.52% | 2.45%(+4.06)#78 | 0.85%(+5.66)#172 |
| 79. | Belmont | 6.35% | 2.45%(+3.90)#79 | 0.85%(+5.50)#177 |
| 80. | Rancho Palos Verdes | 6.34% | 2.45%(+3.88)#80 | 0.85%(+5.48)#179 |
| 81. | Alameda | 6.15% | 2.45%(+3.69)#81 | 0.85%(+5.30)#188 |
| 82. | Greenville | 6.10% | 2.45%(+3.64)#82 | 0.85%(+5.24)#192 |
| 83. | West Menlo Park | 5.94% | 2.45%(+3.48)#83 | 0.85%(+5.08)#198 |
| 84. | Yorba Linda | 5.92% | 2.45%(+3.46)#84 | 0.85%(+5.06)#200 |
| 85. | San Jose | 5.76% | 2.45%(+3.30)#85 | 0.85%(+4.90)#212 |
| 86. | La Habra Heights | 5.73% | 2.45%(+3.28)#86 | 0.85%(+4.88)#213 |
| 87. | San Dimas | 5.71% | 2.45%(+3.26)#87 | 0.85%(+4.86)#214 |
| 88. | Monte Sereno | 5.69% | 2.45%(+3.24)#88 | 0.85%(+4.84)#216 |
| 89. | South El Monte | 5.58% | 2.45%(+3.12)#89 | 0.85%(+4.72)#220 |
| 90. | Pacheco | 5.48% | 2.45%(+3.02)#90 | 0.85%(+4.62)#225 |
| 91. | Los Gatos | 5.36% | 2.45%(+2.90)#91 | 0.85%(+4.50)#233 |
| 92. | Duarte | 5.31% | 2.45%(+2.85)#92 | 0.85%(+4.45)#235 |
| 93. | French Gulch | 5.30% | 2.45%(+2.85)#93 | 0.85%(+4.45)#236 |
| 94. | Sonoma State University | 5.21% | 2.45%(+2.76)#94 | 0.85%(+4.36)#244 |
| 95. | Blackhawk | 5.06% | 2.45%(+2.61)#95 | 0.85%(+4.21)#252 |
| 96. | Highlands | 4.95% | 2.45%(+2.49)#96 | 0.85%(+4.09)#259 |
| 97. | Kenwood | 4.93% | 2.45%(+2.47)#97 | 0.85%(+4.07)#261 |
| 98. | Fairbanks Ranch | 4.88% | 2.45%(+2.42)#98 | 0.85%(+4.02)#263 |
| 99. | Chino | 4.87% | 2.45%(+2.42)#99 | 0.85%(+4.02)#264 |
| 100. | South Monrovia Island | 4.84% | 2.45%(+2.39)#100 | 0.85%(+3.99)#267 |
Common Questions
What are the Top 10 Cities with the Highest Percentage of Immigrants from China in California?
Top 10 Cities with the Highest Percentage of Immigrants from China in California are:
#1
36.35%
#2
30.82%
#3
30.69%
#4
28.75%
#5
27.63%
#6
26.46%
#7
26.31%
#8
26.04%
#9
25.99%
#10
22.31%
What city has the Highest Percentage of Immigrants from China in California?
San Marino has the Highest Percentage of Immigrants from China in California with 36.35%.
What is the Percentage of Immigrants from China in the State of California?
Percentage of Immigrants from China in California is 2.45%.
What is the Percentage of Immigrants from China in the United States?
Percentage of Immigrants from China in the United States is 0.85%.