Cities with the Highest Percentage of Immigrants from Indonesia in California
RELATED REPORTS & OPTIONS
Indonesia
California
Compare Cities
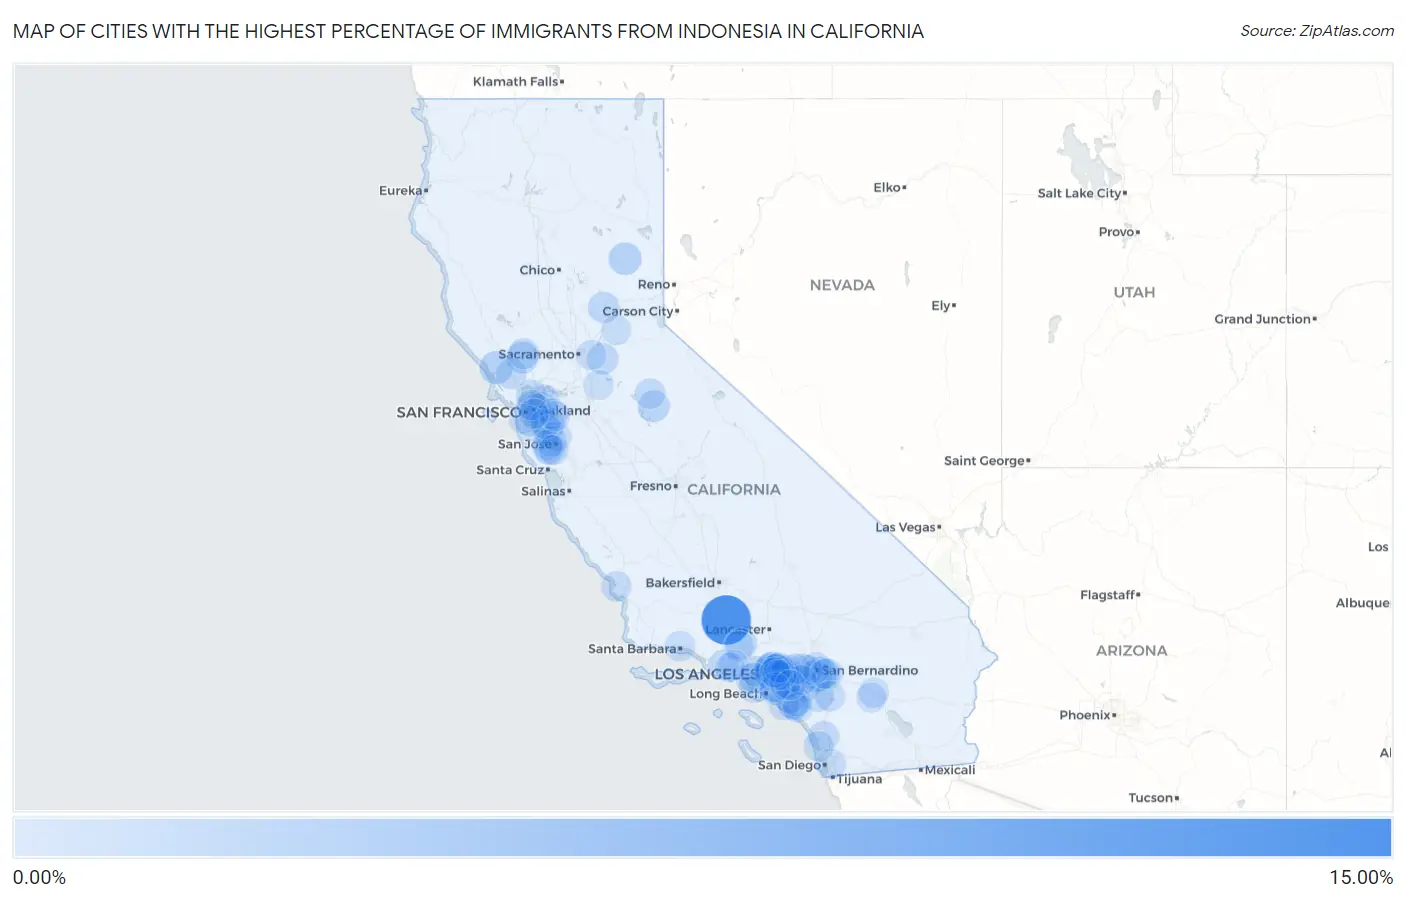
Map of Cities with the Highest Percentage of Immigrants from Indonesia in California
0.00%
15.00%
Cities with the Highest Percentage of Immigrants from Indonesia in California
| City | Indonesia | vs State | vs National | |
| 1. | Lebec | 10.51% | 0.099%(+10.4)#-1 | 0.030%(+10.5)#0 |
| 2. | Loma Linda | 2.18% | 0.099%(+2.08)#73 | 0.030%(+2.15)#360 |
| 3. | Occidental | 1.70% | 0.099%(+1.60)#74 | 0.030%(+1.67)#361 |
| 4. | Cromberg | 1.50% | 0.099%(+1.40)#75 | 0.030%(+1.47)#362 |
| 5. | Highgrove | 1.24% | 0.099%(+1.15)#76 | 0.030%(+1.21)#363 |
| 6. | East San Gabriel | 1.21% | 0.099%(+1.11)#77 | 0.030%(+1.18)#364 |
| 7. | Rowland Heights | 1.12% | 0.099%(+1.03)#78 | 0.030%(+1.09)#365 |
| 8. | Pine Mountain Lake | 1.09% | 0.099%(+0.987)#79 | 0.030%(+1.06)#366 |
| 9. | Deer Park | 1.08% | 0.099%(+0.979)#80 | 0.030%(+1.05)#367 |
| 10. | East Pasadena | 1.06% | 0.099%(+0.960)#81 | 0.030%(+1.03)#368 |
| 11. | South San Gabriel | 0.96% | 0.099%(+0.864)#82 | 0.030%(+0.933)#373 |
| 12. | Temple City | 0.93% | 0.099%(+0.832)#83 | 0.030%(+0.902)#374 |
| 13. | Rancho Murieta | 0.91% | 0.099%(+0.808)#84 | 0.030%(+0.878)#375 |
| 14. | Grass Valley | 0.87% | 0.099%(+0.767)#85 | 0.030%(+0.836)#376 |
| 15. | Meadowbrook | 0.82% | 0.099%(+0.722)#86 | 0.030%(+0.791)#377 |
| 16. | Emeryville | 0.82% | 0.099%(+0.718)#87 | 0.030%(+0.788)#378 |
| 17. | Castaic | 0.76% | 0.099%(+0.657)#88 | 0.030%(+0.726)#379 |
| 18. | Reliez Valley | 0.69% | 0.099%(+0.590)#89 | 0.030%(+0.660)#380 |
| 19. | Union City | 0.67% | 0.099%(+0.574)#90 | 0.030%(+0.643)#393 |
| 20. | San Gabriel | 0.67% | 0.099%(+0.569)#91 | 0.030%(+0.638)#394 |
| 21. | Penngrove | 0.64% | 0.099%(+0.542)#92 | 0.030%(+0.611)#395 |
| 22. | Arcadia | 0.63% | 0.099%(+0.529)#128 | 0.030%(+0.598)#591 |
| 23. | San Pasqual | 0.62% | 0.099%(+0.521)#129 | 0.030%(+0.590)#592 |
| 24. | Diamond Bar | 0.60% | 0.099%(+0.504)#317 | 0.030%(+0.573)#1,416 |
| 25. | Alhambra | 0.60% | 0.099%(+0.503)#318 | 0.030%(+0.573)#1,417 |
| 26. | North El Monte | 0.60% | 0.099%(+0.503)#319 | 0.030%(+0.572)#1,418 |
| 27. | Home Gardens | 0.59% | 0.099%(+0.495)#320 | 0.030%(+0.564)#1,419 |
| 28. | Angwin | 0.59% | 0.099%(+0.487)#321 | 0.030%(+0.556)#1,420 |
| 29. | Monterey Park | 0.58% | 0.099%(+0.485)#322 | 0.030%(+0.554)#1,421 |
| 30. | San Marcos | 0.58% | 0.099%(+0.485)#323 | 0.030%(+0.554)#1,422 |
| 31. | Hacienda Heights | 0.57% | 0.099%(+0.467)#324 | 0.030%(+0.536)#1,423 |
| 32. | Casa Conejo | 0.55% | 0.099%(+0.454)#325 | 0.030%(+0.523)#1,424 |
| 33. | Chino | 0.54% | 0.099%(+0.440)#326 | 0.030%(+0.509)#1,425 |
| 34. | Hermosa Beach | 0.53% | 0.099%(+0.433)#327 | 0.030%(+0.502)#1,426 |
| 35. | Chino Hills | 0.52% | 0.099%(+0.420)#328 | 0.030%(+0.489)#1,427 |
| 36. | Twain Harte | 0.51% | 0.099%(+0.411)#329 | 0.030%(+0.481)#1,428 |
| 37. | Pinole | 0.49% | 0.099%(+0.392)#330 | 0.030%(+0.461)#1,429 |
| 38. | Mentone | 0.48% | 0.099%(+0.385)#331 | 0.030%(+0.454)#1,430 |
| 39. | Moraga | 0.47% | 0.099%(+0.375)#332 | 0.030%(+0.444)#1,431 |
| 40. | Laguna Woods | 0.47% | 0.099%(+0.371)#333 | 0.030%(+0.440)#1,432 |
| 41. | Cerritos | 0.46% | 0.099%(+0.360)#334 | 0.030%(+0.429)#1,433 |
| 42. | Marina Del Rey | 0.46% | 0.099%(+0.358)#335 | 0.030%(+0.427)#1,434 |
| 43. | Foster City | 0.45% | 0.099%(+0.352)#336 | 0.030%(+0.422)#1,435 |
| 44. | San Marino | 0.43% | 0.099%(+0.335)#337 | 0.030%(+0.404)#1,436 |
| 45. | Rancho Cucamonga | 0.42% | 0.099%(+0.323)#338 | 0.030%(+0.392)#1,437 |
| 46. | Piedmont | 0.41% | 0.099%(+0.313)#339 | 0.030%(+0.382)#1,438 |
| 47. | Rancho Mission Viejo | 0.41% | 0.099%(+0.312)#340 | 0.030%(+0.381)#1,439 |
| 48. | Mission Canyon | 0.40% | 0.099%(+0.301)#341 | 0.030%(+0.370)#1,440 |
| 49. | Walnut | 0.39% | 0.099%(+0.287)#342 | 0.030%(+0.356)#1,441 |
| 50. | Los Osos | 0.38% | 0.099%(+0.281)#343 | 0.030%(+0.350)#1,442 |
| 51. | San Ramon | 0.38% | 0.099%(+0.276)#344 | 0.030%(+0.345)#1,443 |
| 52. | Laguna Hills | 0.37% | 0.099%(+0.270)#345 | 0.030%(+0.339)#1,444 |
| 53. | Brea | 0.36% | 0.099%(+0.264)#346 | 0.030%(+0.333)#1,445 |
| 54. | Newark | 0.36% | 0.099%(+0.261)#347 | 0.030%(+0.330)#1,446 |
| 55. | South San Francisco | 0.36% | 0.099%(+0.260)#348 | 0.030%(+0.330)#1,447 |
| 56. | Santa Clara | 0.36% | 0.099%(+0.258)#349 | 0.030%(+0.328)#1,448 |
| 57. | San Bernardino | 0.35% | 0.099%(+0.248)#350 | 0.030%(+0.317)#1,449 |
| 58. | Fontana | 0.35% | 0.099%(+0.246)#351 | 0.030%(+0.315)#1,450 |
| 59. | Saratoga | 0.34% | 0.099%(+0.239)#352 | 0.030%(+0.308)#1,451 |
| 60. | Newport Beach | 0.34% | 0.099%(+0.238)#353 | 0.030%(+0.307)#1,452 |
| 61. | Val Verde | 0.33% | 0.099%(+0.235)#354 | 0.030%(+0.304)#1,453 |
| 62. | Milpitas | 0.33% | 0.099%(+0.229)#355 | 0.030%(+0.299)#1,454 |
| 63. | Solana Beach | 0.32% | 0.099%(+0.225)#356 | 0.030%(+0.294)#1,455 |
| 64. | Covina | 0.32% | 0.099%(+0.224)#357 | 0.030%(+0.293)#1,456 |
| 65. | Rancho Cordova | 0.32% | 0.099%(+0.223)#358 | 0.030%(+0.292)#1,457 |
| 66. | Irvine | 0.32% | 0.099%(+0.221)#359 | 0.030%(+0.290)#1,458 |
| 67. | Winchester | 0.31% | 0.099%(+0.209)#360 | 0.030%(+0.278)#1,459 |
| 68. | Beverly Hills | 0.29% | 0.099%(+0.188)#361 | 0.030%(+0.257)#1,460 |
| 69. | Lake Forest | 0.29% | 0.099%(+0.187)#362 | 0.030%(+0.256)#1,461 |
| 70. | San Dimas | 0.28% | 0.099%(+0.182)#363 | 0.030%(+0.251)#1,462 |
| 71. | Desert Palms | 0.28% | 0.099%(+0.181)#364 | 0.030%(+0.251)#1,463 |
| 72. | Cupertino | 0.28% | 0.099%(+0.180)#365 | 0.030%(+0.249)#1,464 |
| 73. | Cypress | 0.27% | 0.099%(+0.169)#366 | 0.030%(+0.238)#1,465 |
| 74. | Monte Sereno | 0.26% | 0.099%(+0.162)#367 | 0.030%(+0.231)#1,466 |
| 75. | Daly City | 0.26% | 0.099%(+0.161)#368 | 0.030%(+0.230)#1,467 |
| 76. | Albany | 0.26% | 0.099%(+0.160)#369 | 0.030%(+0.230)#1,468 |
| 77. | Placentia | 0.26% | 0.099%(+0.159)#370 | 0.030%(+0.229)#1,469 |
| 78. | Oak Park | 0.26% | 0.099%(+0.158)#371 | 0.030%(+0.227)#1,470 |
| 79. | Upland | 0.26% | 0.099%(+0.157)#372 | 0.030%(+0.226)#1,471 |
| 80. | Hayward | 0.26% | 0.099%(+0.156)#373 | 0.030%(+0.225)#1,472 |
| 81. | Mayflower Village | 0.25% | 0.099%(+0.150)#374 | 0.030%(+0.219)#1,473 |
| 82. | Eastvale | 0.25% | 0.099%(+0.149)#375 | 0.030%(+0.218)#1,474 |
| 83. | Lemon Grove | 0.25% | 0.099%(+0.148)#376 | 0.030%(+0.217)#1,475 |
| 84. | Valinda | 0.25% | 0.099%(+0.147)#377 | 0.030%(+0.216)#1,476 |
| 85. | Culver City | 0.24% | 0.099%(+0.143)#378 | 0.030%(+0.213)#1,477 |
| 86. | Redlands | 0.24% | 0.099%(+0.142)#379 | 0.030%(+0.212)#1,478 |
| 87. | Avocado Heights | 0.24% | 0.099%(+0.138)#380 | 0.030%(+0.207)#1,479 |
| 88. | Georgetown | 0.24% | 0.099%(+0.136)#381 | 0.030%(+0.206)#1,480 |
| 89. | Ladera Ranch | 0.23% | 0.099%(+0.135)#382 | 0.030%(+0.204)#1,481 |
| 90. | Lake Shastina | 0.23% | 0.099%(+0.133)#383 | 0.030%(+0.203)#1,482 |
| 91. | Monrovia | 0.23% | 0.099%(+0.132)#384 | 0.030%(+0.201)#1,483 |
| 92. | Dublin | 0.23% | 0.099%(+0.130)#385 | 0.030%(+0.199)#1,484 |
| 93. | Alameda | 0.23% | 0.099%(+0.129)#386 | 0.030%(+0.198)#1,485 |
| 94. | Indian Wells | 0.23% | 0.099%(+0.128)#387 | 0.030%(+0.198)#1,486 |
| 95. | Westlake Village | 0.23% | 0.099%(+0.127)#388 | 0.030%(+0.196)#1,487 |
| 96. | La Palma | 0.23% | 0.099%(+0.126)#389 | 0.030%(+0.195)#1,488 |
| 97. | El Monte | 0.23% | 0.099%(+0.126)#390 | 0.030%(+0.195)#1,489 |
| 98. | Cambrian Park | 0.23% | 0.099%(+0.126)#391 | 0.030%(+0.195)#1,490 |
| 99. | Yorba Linda | 0.22% | 0.099%(+0.120)#392 | 0.030%(+0.189)#1,491 |
| 100. | Lockeford | 0.22% | 0.099%(+0.119)#393 | 0.030%(+0.188)#1,492 |
Common Questions
What are the Top 10 Cities with the Highest Percentage of Immigrants from Indonesia in California?
Top 10 Cities with the Highest Percentage of Immigrants from Indonesia in California are:
#1
10.51%
#2
2.18%
#3
1.70%
#4
1.50%
#5
1.24%
#6
1.21%
#7
1.12%
#8
1.09%
#9
1.08%
#10
1.06%
What city has the Highest Percentage of Immigrants from Indonesia in California?
Lebec has the Highest Percentage of Immigrants from Indonesia in California with 10.51%.
What is the Percentage of Immigrants from Indonesia in the State of California?
Percentage of Immigrants from Indonesia in California is 0.099%.
What is the Percentage of Immigrants from Indonesia in the United States?
Percentage of Immigrants from Indonesia in the United States is 0.030%.