Cities with the Highest Percentage of Population Employed in Installation, Maintenance & Repair in Nevada
RELATED REPORTS & OPTIONS
Installation, Maintenance & Repair
Nevada
Compare Cities
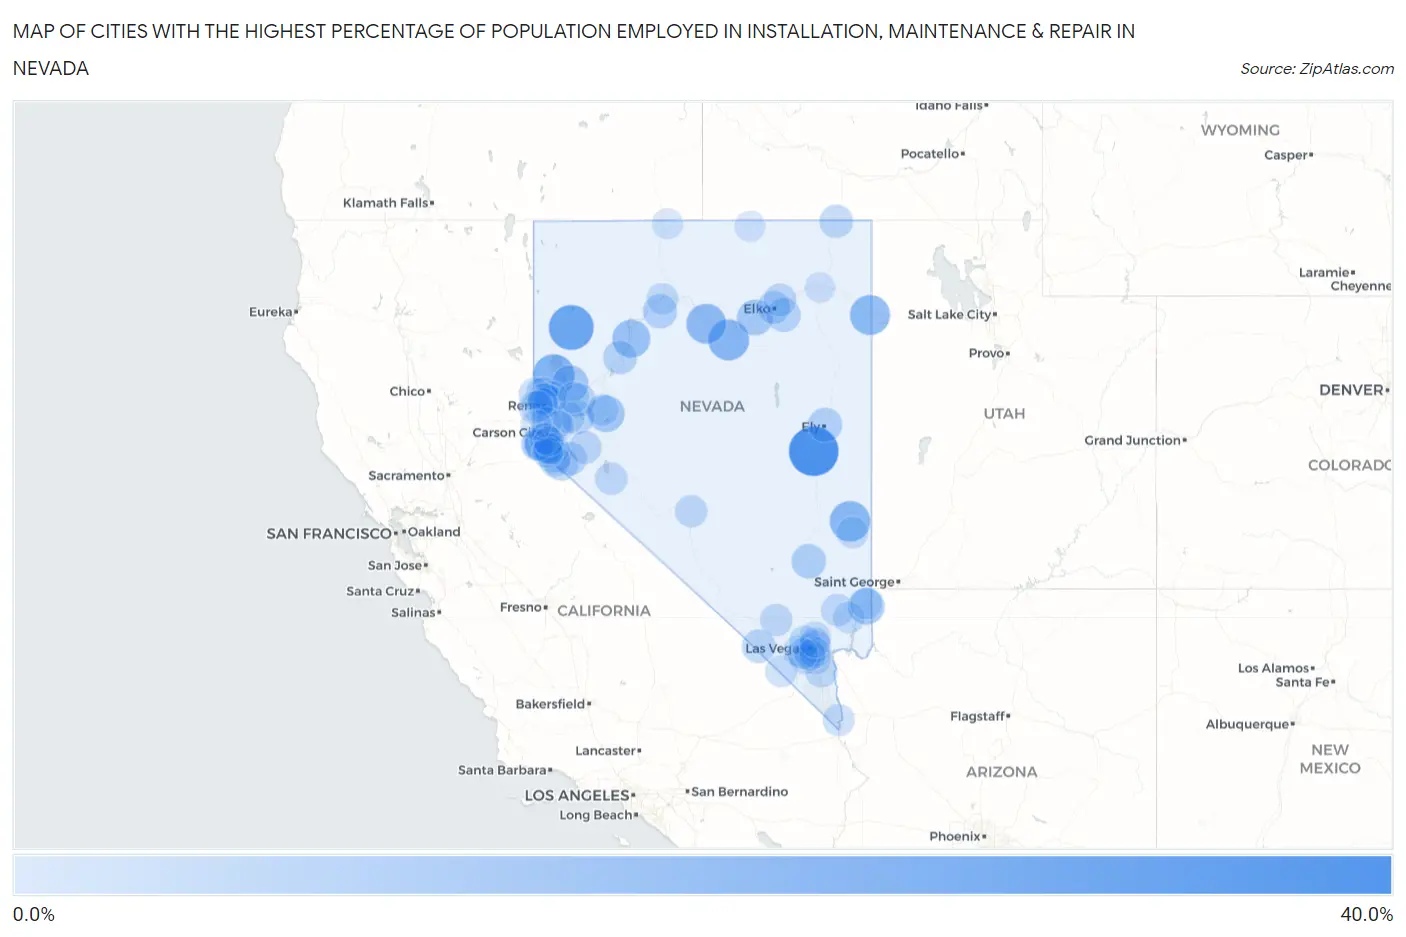
Map of Cities with the Highest Percentage of Population Employed in Installation, Maintenance & Repair in Nevada
0.0%
40.0%
Cities with the Highest Percentage of Population Employed in Installation, Maintenance & Repair in Nevada
| City | % Employed | vs State | vs National | |
| 1. | Preston | 39.5% | 3.2%(+36.3)#1 | 3.1%(+36.4)#147 |
| 2. | Empire | 29.6% | 3.2%(+26.4)#2 | 3.1%(+26.6)#290 |
| 3. | Sutcliffe | 22.9% | 3.2%(+19.6)#3 | 3.1%(+19.8)#510 |
| 4. | Crescent Valley | 21.3% | 3.2%(+18.1)#4 | 3.1%(+18.2)#587 |
| 5. | Pioche | 20.8% | 3.2%(+17.6)#5 | 3.1%(+17.8)#612 |
| 6. | West Wendover | 19.7% | 3.2%(+16.5)#6 | 3.1%(+16.6)#692 |
| 7. | Battle Mountain | 19.2% | 3.2%(+16.0)#7 | 3.1%(+16.1)#723 |
| 8. | Genoa | 16.0% | 3.2%(+12.8)#8 | 3.1%(+12.9)#1,018 |
| 9. | Humboldt River Ranch | 15.4% | 3.2%(+12.2)#9 | 3.1%(+12.3)#1,080 |
| 10. | Fallon Station | 13.0% | 3.2%(+9.83)#10 | 3.1%(+9.98)#1,550 |
| 11. | Nixon | 13.0% | 3.2%(+9.77)#11 | 3.1%(+9.92)#1,573 |
| 12. | Bunkerville | 12.8% | 3.2%(+9.54)#12 | 3.1%(+9.69)#1,640 |
| 13. | Carlin | 11.4% | 3.2%(+8.18)#13 | 3.1%(+8.32)#2,021 |
| 14. | Virginia City | 10.7% | 3.2%(+7.51)#14 | 3.1%(+7.66)#2,241 |
| 15. | Carter Springs | 9.7% | 3.2%(+6.46)#15 | 3.1%(+6.61)#2,742 |
| 16. | Alamo | 9.0% | 3.2%(+5.79)#16 | 3.1%(+5.94)#3,118 |
| 17. | Ely | 8.5% | 3.2%(+5.24)#17 | 3.1%(+5.39)#3,541 |
| 18. | Grass Valley | 8.2% | 3.2%(+5.02)#18 | 3.1%(+5.17)#3,728 |
| 19. | Spring Creek | 7.5% | 3.2%(+4.29)#19 | 3.1%(+4.44)#4,417 |
| 20. | Fernley | 7.1% | 3.2%(+3.92)#20 | 3.1%(+4.07)#4,846 |
| 21. | Topaz Ranch Estates | 6.9% | 3.2%(+3.70)#21 | 3.1%(+3.84)#5,087 |
| 22. | Pahrump | 6.9% | 3.2%(+3.68)#22 | 3.1%(+3.83)#5,100 |
| 23. | Lovelock | 6.8% | 3.2%(+3.63)#23 | 3.1%(+3.78)#5,175 |
| 24. | Silver Springs | 6.7% | 3.2%(+3.48)#24 | 3.1%(+3.63)#5,398 |
| 25. | Smith Valley | 6.5% | 3.2%(+3.29)#25 | 3.1%(+3.44)#5,694 |
| 26. | Jackpot | 6.2% | 3.2%(+2.99)#26 | 3.1%(+3.14)#6,129 |
| 27. | Elko | 6.0% | 3.2%(+2.81)#27 | 3.1%(+2.96)#6,420 |
| 28. | Lemmon Valley | 5.7% | 3.2%(+2.47)#28 | 3.1%(+2.62)#7,019 |
| 29. | Spanish Springs | 5.6% | 3.2%(+2.40)#29 | 3.1%(+2.54)#7,170 |
| 30. | Yerington | 5.6% | 3.2%(+2.35)#30 | 3.1%(+2.50)#7,259 |
| 31. | Osino | 5.4% | 3.2%(+2.20)#31 | 3.1%(+2.35)#7,564 |
| 32. | Verdi | 5.0% | 3.2%(+1.77)#32 | 3.1%(+1.91)#8,503 |
| 33. | Sun Valley | 4.8% | 3.2%(+1.61)#33 | 3.1%(+1.76)#8,891 |
| 34. | Moapa Town | 4.8% | 3.2%(+1.56)#34 | 3.1%(+1.71)#9,003 |
| 35. | Hawthorne | 4.7% | 3.2%(+1.44)#35 | 3.1%(+1.59)#9,319 |
| 36. | Tonopah | 4.6% | 3.2%(+1.38)#36 | 3.1%(+1.53)#9,468 |
| 37. | Winchester | 4.6% | 3.2%(+1.35)#37 | 3.1%(+1.49)#9,567 |
| 38. | Zephyr Cove | 4.5% | 3.2%(+1.26)#38 | 3.1%(+1.40)#9,831 |
| 39. | Cold Springs | 4.4% | 3.2%(+1.22)#39 | 3.1%(+1.37)#9,928 |
| 40. | Boulder City | 4.4% | 3.2%(+1.19)#40 | 3.1%(+1.34)#10,015 |
| 41. | Indian Springs | 4.3% | 3.2%(+1.10)#41 | 3.1%(+1.25)#10,266 |
| 42. | Sunrise Manor | 4.1% | 3.2%(+0.920)#42 | 3.1%(+1.07)#10,784 |
| 43. | Fish Springs | 3.8% | 3.2%(+0.558)#43 | 3.1%(+0.706)#11,925 |
| 44. | Sparks | 3.8% | 3.2%(+0.548)#44 | 3.1%(+0.696)#11,965 |
| 45. | Winnemucca | 3.7% | 3.2%(+0.437)#45 | 3.1%(+0.585)#12,355 |
| 46. | Fallon | 3.6% | 3.2%(+0.394)#46 | 3.1%(+0.542)#12,493 |
| 47. | Sandy Valley | 3.5% | 3.2%(+0.304)#47 | 3.1%(+0.452)#12,792 |
| 48. | Laughlin | 3.5% | 3.2%(+0.303)#48 | 3.1%(+0.451)#12,799 |
| 49. | North Las Vegas | 3.5% | 3.2%(+0.298)#49 | 3.1%(+0.446)#12,815 |
| 50. | Panaca | 3.5% | 3.2%(+0.283)#50 | 3.1%(+0.431)#12,863 |
| 51. | Moapa Valley | 3.4% | 3.2%(+0.157)#51 | 3.1%(+0.305)#13,336 |
| 52. | Summerlin South | 3.3% | 3.2%(+0.044)#52 | 3.1%(+0.192)#13,765 |
| 53. | Golden Valley | 3.1% | 3.2%(-0.070)#53 | 3.1%(+0.078)#14,188 |
| 54. | Henderson | 3.1% | 3.2%(-0.159)#54 | 3.1%(-0.011)#14,513 |
| 55. | Stagecoach | 3.0% | 3.2%(-0.204)#55 | 3.1%(-0.056)#14,690 |
| 56. | Mesquite | 3.0% | 3.2%(-0.240)#56 | 3.1%(-0.092)#14,838 |
| 57. | Las Vegas | 3.0% | 3.2%(-0.247)#57 | 3.1%(-0.098)#14,874 |
| 58. | East Valley | 2.8% | 3.2%(-0.417)#58 | 3.1%(-0.269)#15,526 |
| 59. | Minden | 2.7% | 3.2%(-0.519)#59 | 3.1%(-0.370)#15,939 |
| 60. | Enterprise | 2.7% | 3.2%(-0.542)#60 | 3.1%(-0.394)#16,028 |
| 61. | Double Spring | 2.7% | 3.2%(-0.549)#61 | 3.1%(-0.401)#16,058 |
| 62. | Whitney | 2.6% | 3.2%(-0.588)#62 | 3.1%(-0.439)#16,224 |
| 63. | Reno | 2.5% | 3.2%(-0.684)#63 | 3.1%(-0.535)#16,645 |
| 64. | Paradise | 2.4% | 3.2%(-0.808)#64 | 3.1%(-0.659)#17,158 |
| 65. | Round Hill Village | 2.4% | 3.2%(-0.818)#65 | 3.1%(-0.669)#17,205 |
| 66. | Wadsworth | 2.4% | 3.2%(-0.842)#66 | 3.1%(-0.694)#17,327 |
| 67. | Kingsbury | 2.3% | 3.2%(-0.885)#67 | 3.1%(-0.737)#17,503 |
| 68. | Washoe Valley | 2.2% | 3.2%(-1.01)#68 | 3.1%(-0.857)#17,991 |
| 69. | Mogul | 2.2% | 3.2%(-1.05)#69 | 3.1%(-0.898)#18,134 |
| 70. | Spring Valley | 2.2% | 3.2%(-1.06)#70 | 3.1%(-0.908)#18,175 |
| 71. | Indian Hills | 2.0% | 3.2%(-1.17)#71 | 3.1%(-1.03)#18,624 |
| 72. | Gardnerville | 2.0% | 3.2%(-1.23)#72 | 3.1%(-1.08)#18,825 |
| 73. | Carson | 1.9% | 3.2%(-1.29)#73 | 3.1%(-1.14)#19,064 |
| 74. | Dayton | 1.9% | 3.2%(-1.35)#74 | 3.1%(-1.20)#19,277 |
| 75. | Fort Mcdermitt | 1.8% | 3.2%(-1.43)#75 | 3.1%(-1.28)#19,625 |
| 76. | Gardnerville Ranchos | 1.4% | 3.2%(-1.81)#76 | 3.1%(-1.67)#20,995 |
| 77. | Owyhee | 1.3% | 3.2%(-1.94)#77 | 3.1%(-1.80)#21,396 |
| 78. | Incline Village | 1.1% | 3.2%(-2.14)#78 | 3.1%(-1.99)#22,006 |
| 79. | Wells | 0.91% | 3.2%(-2.30)#79 | 3.1%(-2.16)#22,481 |
| 80. | Nellis Afb | 0.86% | 3.2%(-2.35)#80 | 3.1%(-2.20)#22,622 |
| 81. | Johnson Lane | 0.48% | 3.2%(-2.74)#81 | 3.1%(-2.59)#23,506 |
1
2Common Questions
What are the Top 10 Cities with the Highest Percentage of Population Employed in Installation, Maintenance & Repair in Nevada?
Top 10 Cities with the Highest Percentage of Population Employed in Installation, Maintenance & Repair in Nevada are:
#1
39.5%
#2
29.6%
#3
22.9%
#4
21.3%
#5
20.8%
#6
19.7%
#7
19.2%
#8
16.0%
#9
15.4%
#10
13.0%
What city has the Highest Percentage of Population Employed in Installation, Maintenance & Repair in Nevada?
Preston has the Highest Percentage of Population Employed in Installation, Maintenance & Repair in Nevada with 39.5%.
What is the Percentage of Population Employed in Installation, Maintenance & Repair in the State of Nevada?
Percentage of Population Employed in Installation, Maintenance & Repair in Nevada is 3.2%.
What is the Percentage of Population Employed in Installation, Maintenance & Repair in the United States?
Percentage of Population Employed in Installation, Maintenance & Repair in the United States is 3.1%.