Zip Codes with the Highest Percentage of Population Employed in Installation, Maintenance & Repair in Newport Beach, CA
RELATED REPORTS & OPTIONS
Installation, Maintenance & Repair
Newport Beach
Compare Zip Codes
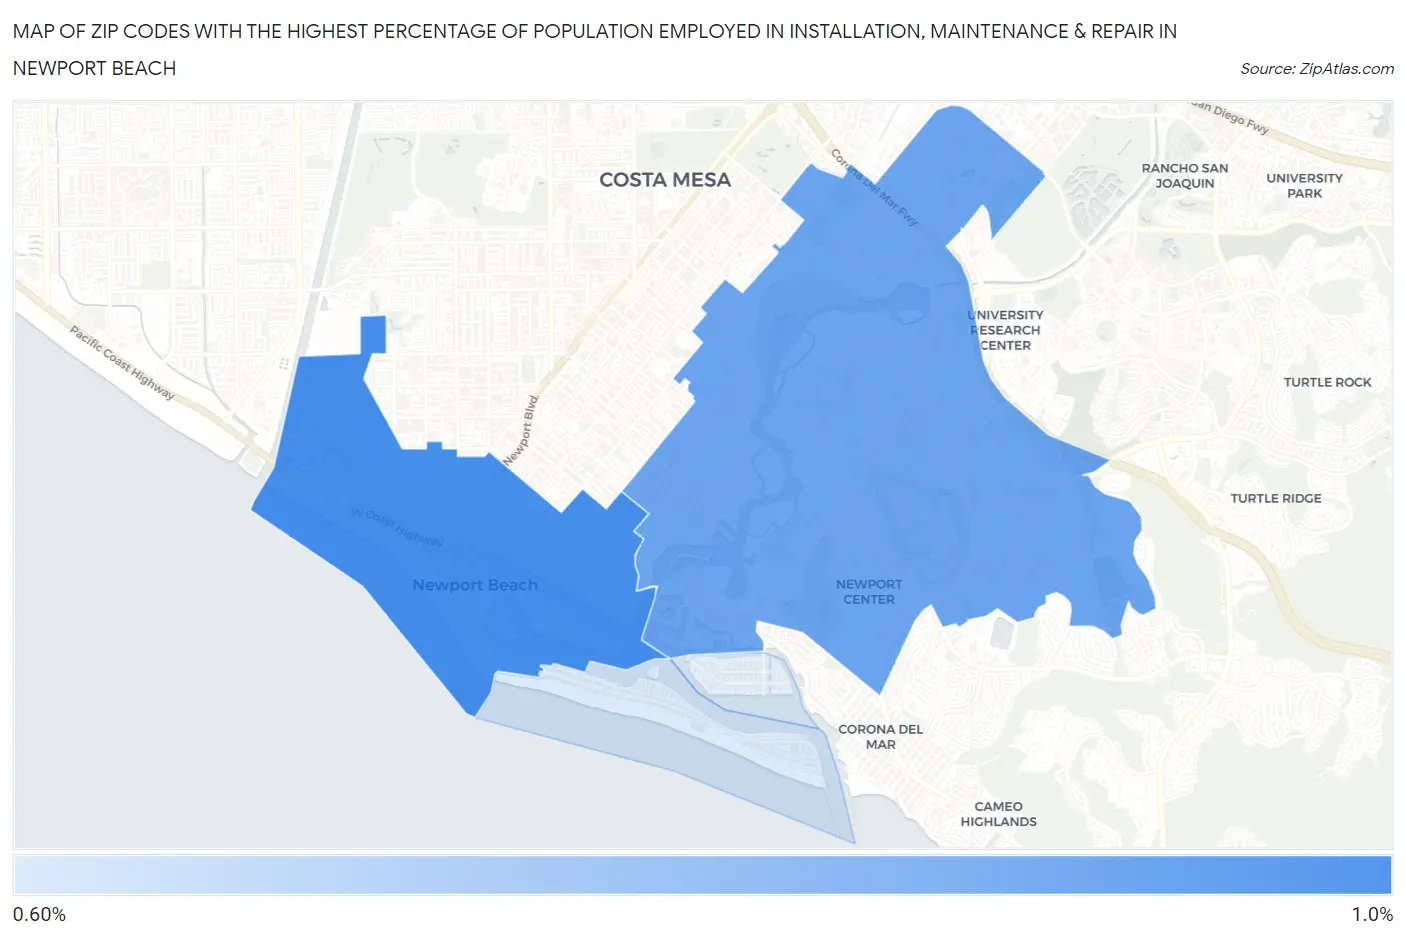
Map of Zip Codes with the Highest Percentage of Population Employed in Installation, Maintenance & Repair in Newport Beach
0.69%
0.94%
Zip Codes with the Highest Percentage of Population Employed in Installation, Maintenance & Repair in Newport Beach, CA
| Zip Code | % Employed | vs State | vs National | |
| 1. | 92663 | 0.94% | 2.6%(-1.62)#1,264 | 3.1%(-2.13)#26,087 |
| 2. | 92660 | 0.88% | 2.6%(-1.68)#1,282 | 3.1%(-2.19)#26,266 |
| 3. | 92661 | 0.69% | 2.6%(-1.87)#1,332 | 3.1%(-2.38)#26,812 |
1
Common Questions
What are the Top 3 Zip Codes with the Highest Percentage of Population Employed in Installation, Maintenance & Repair in Newport Beach, CA?
Top 3 Zip Codes with the Highest Percentage of Population Employed in Installation, Maintenance & Repair in Newport Beach, CA are:
What zip code has the Highest Percentage of Population Employed in Installation, Maintenance & Repair in Newport Beach, CA?
92663 has the Highest Percentage of Population Employed in Installation, Maintenance & Repair in Newport Beach, CA with 0.94%.
What is the Percentage of Population Employed in Installation, Maintenance & Repair in Newport Beach, CA?
Percentage of Population Employed in Installation, Maintenance & Repair in Newport Beach is 0.75%.
What is the Percentage of Population Employed in Installation, Maintenance & Repair in California?
Percentage of Population Employed in Installation, Maintenance & Repair in California is 2.6%.
What is the Percentage of Population Employed in Installation, Maintenance & Repair in the United States?
Percentage of Population Employed in Installation, Maintenance & Repair in the United States is 3.1%.