Cities with the Most Immigrants from Malaysia in California
RELATED REPORTS & OPTIONS
Malaysia
California
Compare Cities
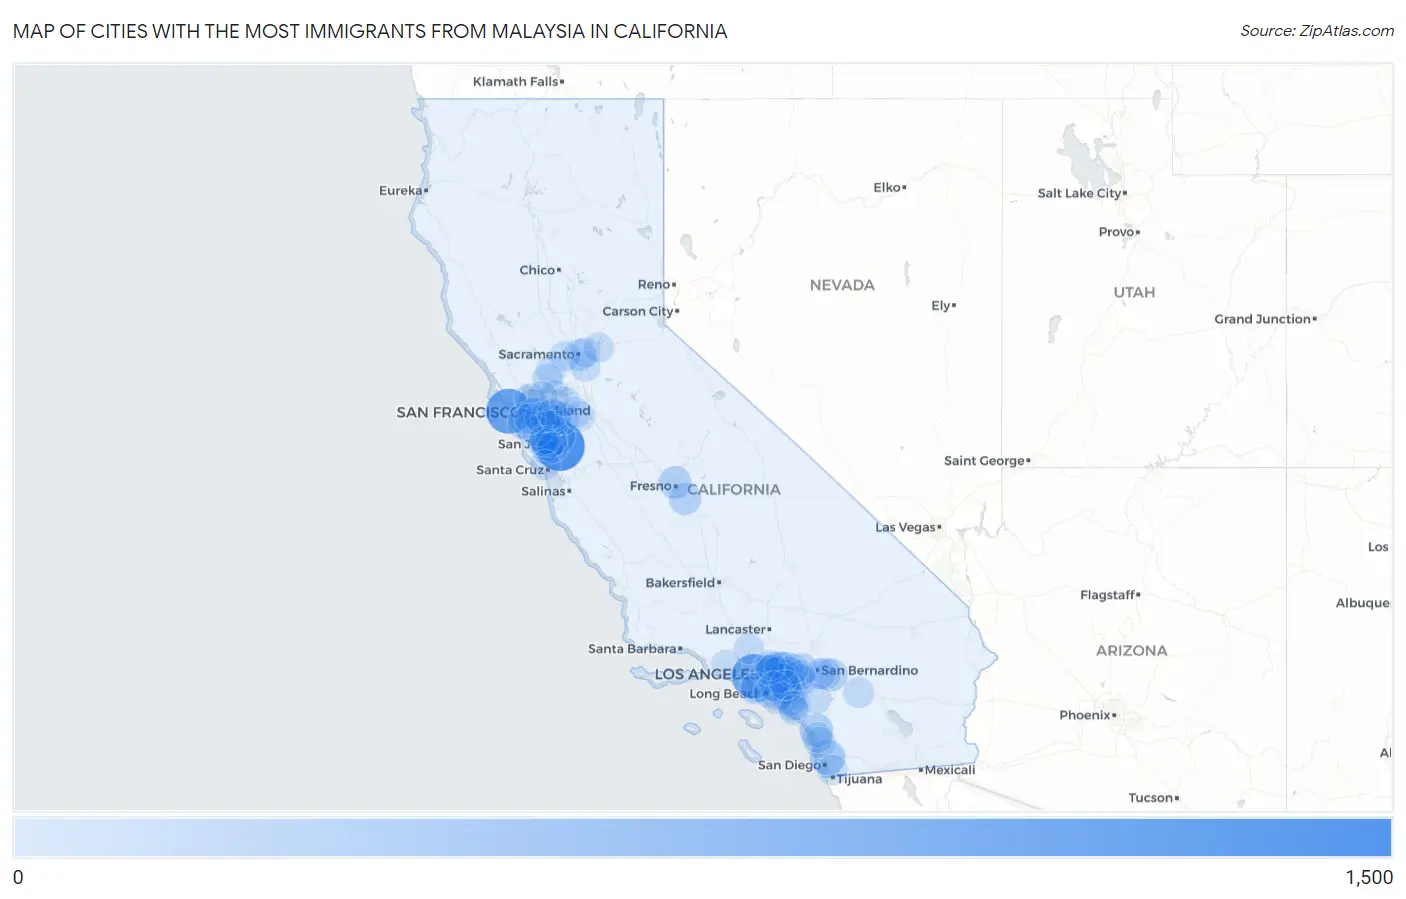
Map of Cities with the Most Immigrants from Malaysia in California
0
1,500
Cities with the Most Immigrants from Malaysia in California
| City | Malaysia | vs State | vs National | |
| 1. | San Jose | 1,408 | 17,929(7.85%)#1 | 82,574(1.71%)#3 |
| 2. | San Francisco | 1,096 | 17,929(6.11%)#2 | 82,574(1.33%)#4 |
| 3. | Los Angeles | 1,025 | 17,929(5.72%)#3 | 82,574(1.24%)#6 |
| 4. | Sunnyvale | 558 | 17,929(3.11%)#4 | 82,574(0.68%)#13 |
| 5. | Milpitas | 557 | 17,929(3.11%)#5 | 82,574(0.67%)#14 |
| 6. | Fremont | 493 | 17,929(2.75%)#6 | 82,574(0.60%)#18 |
| 7. | San Diego | 398 | 17,929(2.22%)#7 | 82,574(0.48%)#22 |
| 8. | Alhambra | 379 | 17,929(2.11%)#8 | 82,574(0.46%)#24 |
| 9. | Oceanside | 283 | 17,929(1.58%)#9 | 82,574(0.34%)#32 |
| 10. | Irvine | 272 | 17,929(1.52%)#10 | 82,574(0.33%)#33 |
| 11. | Oakland | 244 | 17,929(1.36%)#11 | 82,574(0.30%)#38 |
| 12. | Fresno | 232 | 17,929(1.29%)#12 | 82,574(0.28%)#44 |
| 13. | Yucaipa | 220 | 17,929(1.23%)#13 | 82,574(0.27%)#46 |
| 14. | Arcadia | 219 | 17,929(1.22%)#14 | 82,574(0.27%)#47 |
| 15. | Diamond Bar | 219 | 17,929(1.22%)#15 | 82,574(0.27%)#48 |
| 16. | Chino | 202 | 17,929(1.13%)#16 | 82,574(0.24%)#54 |
| 17. | Selma | 201 | 17,929(1.12%)#17 | 82,574(0.24%)#55 |
| 18. | Livermore | 190 | 17,929(1.06%)#18 | 82,574(0.23%)#61 |
| 19. | Hayward | 181 | 17,929(1.01%)#19 | 82,574(0.22%)#66 |
| 20. | Berkeley | 180 | 17,929(1.00%)#20 | 82,574(0.22%)#67 |
| 21. | Sacramento | 169 | 17,929(0.94%)#21 | 82,574(0.20%)#70 |
| 22. | Dublin | 154 | 17,929(0.86%)#22 | 82,574(0.19%)#76 |
| 23. | Redlands | 151 | 17,929(0.84%)#23 | 82,574(0.18%)#79 |
| 24. | Saratoga | 150 | 17,929(0.84%)#24 | 82,574(0.18%)#81 |
| 25. | Alameda | 148 | 17,929(0.83%)#25 | 82,574(0.18%)#82 |
| 26. | Cupertino | 145 | 17,929(0.81%)#26 | 82,574(0.18%)#86 |
| 27. | Temple City | 144 | 17,929(0.80%)#27 | 82,574(0.17%)#87 |
| 28. | West Covina | 137 | 17,929(0.76%)#28 | 82,574(0.17%)#94 |
| 29. | Monterey Park | 134 | 17,929(0.75%)#29 | 82,574(0.16%)#97 |
| 30. | San Mateo | 128 | 17,929(0.71%)#30 | 82,574(0.16%)#103 |
| 31. | Palo Alto | 126 | 17,929(0.70%)#31 | 82,574(0.15%)#104 |
| 32. | Rancho Cucamonga | 123 | 17,929(0.69%)#32 | 82,574(0.15%)#108 |
| 33. | Chino Hills | 123 | 17,929(0.69%)#33 | 82,574(0.15%)#109 |
| 34. | Brea | 119 | 17,929(0.66%)#34 | 82,574(0.14%)#111 |
| 35. | San Gabriel | 118 | 17,929(0.66%)#35 | 82,574(0.14%)#112 |
| 36. | Daly City | 114 | 17,929(0.64%)#36 | 82,574(0.14%)#116 |
| 37. | Glendora | 114 | 17,929(0.64%)#37 | 82,574(0.14%)#117 |
| 38. | Torrance | 112 | 17,929(0.62%)#38 | 82,574(0.14%)#118 |
| 39. | Eastvale | 112 | 17,929(0.62%)#39 | 82,574(0.14%)#119 |
| 40. | Pomona | 109 | 17,929(0.61%)#40 | 82,574(0.13%)#122 |
| 41. | Union City | 109 | 17,929(0.61%)#41 | 82,574(0.13%)#123 |
| 42. | Santa Clara | 108 | 17,929(0.60%)#42 | 82,574(0.13%)#124 |
| 43. | Richmond | 103 | 17,929(0.57%)#43 | 82,574(0.12%)#129 |
| 44. | Mountain View | 102 | 17,929(0.57%)#44 | 82,574(0.12%)#131 |
| 45. | Encinitas | 102 | 17,929(0.57%)#45 | 82,574(0.12%)#132 |
| 46. | Castro Valley | 101 | 17,929(0.56%)#46 | 82,574(0.12%)#134 |
| 47. | Palm Springs | 97 | 17,929(0.54%)#47 | 82,574(0.12%)#140 |
| 48. | Orange | 92 | 17,929(0.51%)#48 | 82,574(0.11%)#147 |
| 49. | Loma Linda | 91 | 17,929(0.51%)#49 | 82,574(0.11%)#150 |
| 50. | Yorba Linda | 89 | 17,929(0.50%)#50 | 82,574(0.11%)#152 |
| 51. | Mountain House | 89 | 17,929(0.50%)#51 | 82,574(0.11%)#153 |
| 52. | Redwood City | 88 | 17,929(0.49%)#52 | 82,574(0.11%)#154 |
| 53. | Tustin | 87 | 17,929(0.49%)#53 | 82,574(0.11%)#158 |
| 54. | East San Gabriel | 87 | 17,929(0.49%)#54 | 82,574(0.11%)#160 |
| 55. | Anaheim | 81 | 17,929(0.45%)#55 | 82,574(0.10%)#169 |
| 56. | Vacaville | 81 | 17,929(0.45%)#56 | 82,574(0.10%)#171 |
| 57. | Hacienda Heights | 80 | 17,929(0.45%)#57 | 82,574(0.10%)#175 |
| 58. | Elk Grove | 79 | 17,929(0.44%)#58 | 82,574(0.10%)#176 |
| 59. | Azusa | 75 | 17,929(0.42%)#59 | 82,574(0.09%)#183 |
| 60. | Santa Clarita | 73 | 17,929(0.41%)#60 | 82,574(0.09%)#186 |
| 61. | Walnut | 73 | 17,929(0.41%)#61 | 82,574(0.09%)#191 |
| 62. | Carlsbad | 71 | 17,929(0.40%)#62 | 82,574(0.09%)#195 |
| 63. | El Monte | 70 | 17,929(0.39%)#63 | 82,574(0.08%)#200 |
| 64. | Davis | 70 | 17,929(0.39%)#64 | 82,574(0.08%)#202 |
| 65. | Pacifica | 68 | 17,929(0.38%)#65 | 82,574(0.08%)#205 |
| 66. | San Leandro | 67 | 17,929(0.37%)#66 | 82,574(0.08%)#207 |
| 67. | Redondo Beach | 66 | 17,929(0.37%)#67 | 82,574(0.08%)#211 |
| 68. | Fairfield | 65 | 17,929(0.36%)#68 | 82,574(0.08%)#217 |
| 69. | Brisbane | 65 | 17,929(0.36%)#69 | 82,574(0.08%)#220 |
| 70. | Lake Elsinore | 64 | 17,929(0.36%)#70 | 82,574(0.08%)#223 |
| 71. | Los Altos | 64 | 17,929(0.36%)#71 | 82,574(0.08%)#224 |
| 72. | Ontario | 63 | 17,929(0.35%)#72 | 82,574(0.08%)#226 |
| 73. | Buena Park | 63 | 17,929(0.35%)#73 | 82,574(0.08%)#227 |
| 74. | Chula Vista | 62 | 17,929(0.35%)#74 | 82,574(0.08%)#232 |
| 75. | Westminster | 62 | 17,929(0.35%)#75 | 82,574(0.08%)#233 |
| 76. | Baldwin Park | 61 | 17,929(0.34%)#76 | 82,574(0.07%)#238 |
| 77. | Long Beach | 59 | 17,929(0.33%)#77 | 82,574(0.07%)#249 |
| 78. | Pleasanton | 59 | 17,929(0.33%)#78 | 82,574(0.07%)#250 |
| 79. | Rowland Heights | 57 | 17,929(0.32%)#79 | 82,574(0.07%)#259 |
| 80. | San Ramon | 55 | 17,929(0.31%)#80 | 82,574(0.07%)#267 |
| 81. | Campbell | 55 | 17,929(0.31%)#81 | 82,574(0.07%)#268 |
| 82. | Arden Arcade | 53 | 17,929(0.30%)#82 | 82,574(0.06%)#273 |
| 83. | Mission Viejo | 53 | 17,929(0.30%)#83 | 82,574(0.06%)#274 |
| 84. | Pittsburg | 53 | 17,929(0.30%)#84 | 82,574(0.06%)#276 |
| 85. | Martinez | 53 | 17,929(0.30%)#85 | 82,574(0.06%)#278 |
| 86. | Duarte | 52 | 17,929(0.29%)#86 | 82,574(0.06%)#286 |
| 87. | Huntington Beach | 50 | 17,929(0.28%)#87 | 82,574(0.06%)#288 |
| 88. | Aliso Viejo | 49 | 17,929(0.27%)#88 | 82,574(0.06%)#298 |
| 89. | Tracy | 48 | 17,929(0.27%)#89 | 82,574(0.06%)#305 |
| 90. | Folsom | 48 | 17,929(0.27%)#90 | 82,574(0.06%)#306 |
| 91. | Camp Pendleton Mainside | 47 | 17,929(0.26%)#91 | 82,574(0.06%)#313 |
| 92. | Laguna Niguel | 46 | 17,929(0.26%)#92 | 82,574(0.06%)#318 |
| 93. | Claremont | 46 | 17,929(0.26%)#93 | 82,574(0.06%)#319 |
| 94. | Thousand Oaks | 45 | 17,929(0.25%)#94 | 82,574(0.05%)#321 |
| 95. | South Pasadena | 42 | 17,929(0.23%)#95 | 82,574(0.05%)#338 |
| 96. | Pasadena | 41 | 17,929(0.23%)#96 | 82,574(0.05%)#340 |
| 97. | Brentwood | 41 | 17,929(0.23%)#97 | 82,574(0.05%)#343 |
| 98. | Cerritos | 41 | 17,929(0.23%)#98 | 82,574(0.05%)#345 |
| 99. | Felton | 41 | 17,929(0.23%)#99 | 82,574(0.05%)#347 |
| 100. | Placentia | 38 | 17,929(0.21%)#100 | 82,574(0.05%)#375 |
Common Questions
What are the Top 10 Cities with the Most Immigrants from Malaysia in California?
Top 10 Cities with the Most Immigrants from Malaysia in California are:
#1
1,408
#2
1,096
#3
1,025
#4
558
#5
557
#6
493
#7
398
#8
379
#9
283
#10
272
What city has the Most Immigrants from Malaysia in California?
San Jose has the Most Immigrants from Malaysia in California with 1,408.
What is the Total Immigrants from Malaysia in the State of California?
Total Immigrants from Malaysia in California is 17,929.
What is the Total Immigrants from Malaysia in the United States?
Total Immigrants from Malaysia in the United States is 82,574.