Cities with the Lowest Poverty Level Among Families in California
RELATED REPORTS & OPTIONS
Lowest Family Poverty
California
Compare Cities
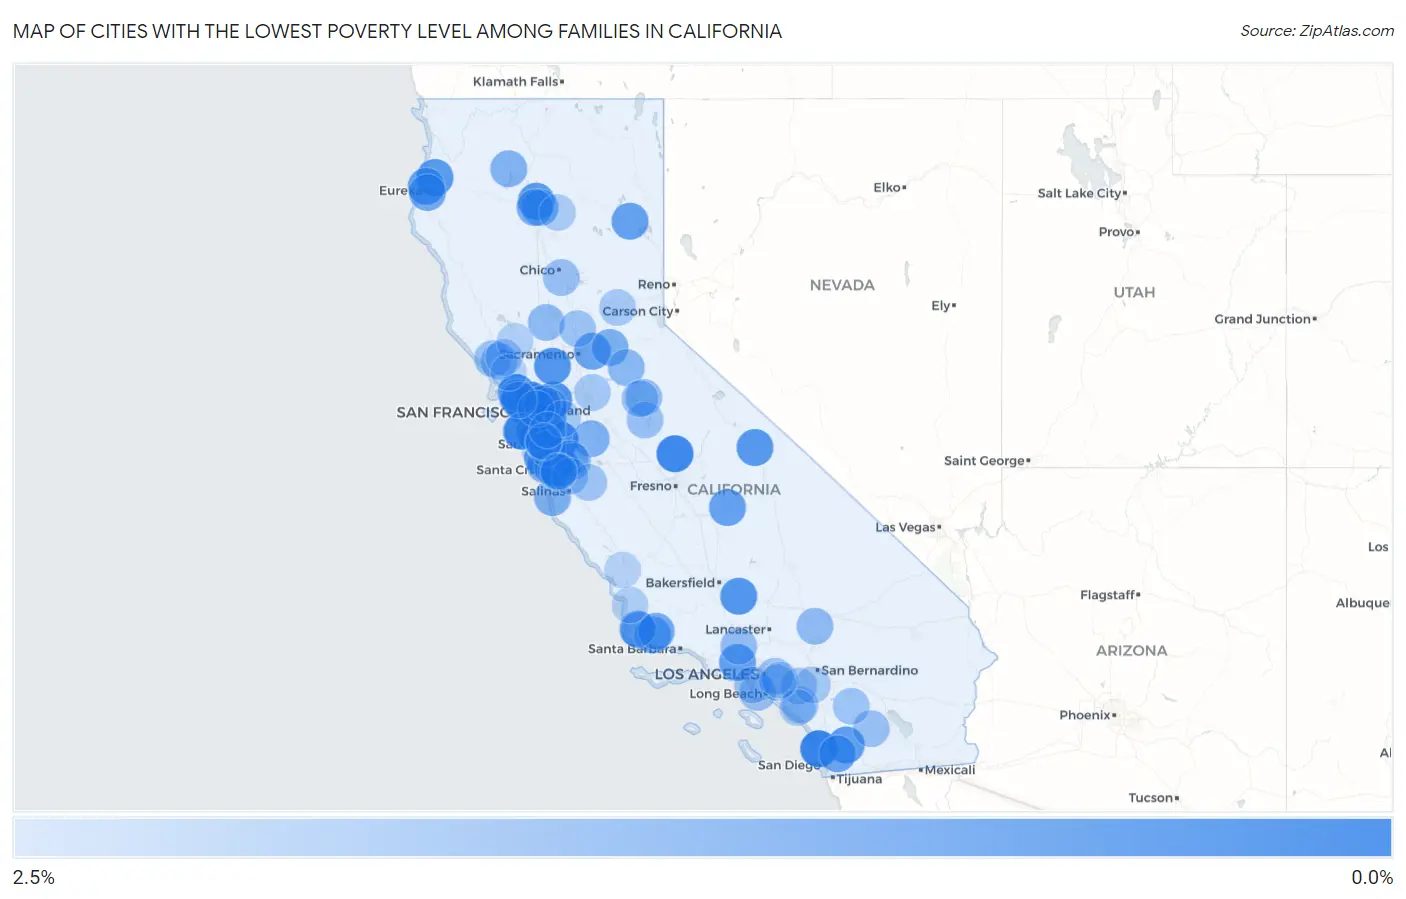
Map of Cities with the Lowest Poverty Level Among Families in California
2.5%
0.0%
Cities with the Lowest Poverty Level Among Families in California
| City | Family Poverty | vs State | vs National | |
| 1. | Tiburon | 0.42% | 8.5%(-8.12)#1 | 8.8%(-8.36)#52 |
| 2. | Del Mar | 0.43% | 8.5%(-8.10)#2 | 8.8%(-8.35)#55 |
| 3. | Scotts Valley | 0.45% | 8.5%(-8.08)#3 | 8.8%(-8.33)#63 |
| 4. | East Foothills | 0.50% | 8.5%(-8.03)#4 | 8.8%(-8.28)#82 |
| 5. | Corralitos | 0.51% | 8.5%(-8.03)#5 | 8.8%(-8.27)#93 |
| 6. | Yosemite Lakes | 0.52% | 8.5%(-8.02)#6 | 8.8%(-8.27)#100 |
| 7. | Lucas Valley Marinwood | 0.55% | 8.5%(-7.99)#7 | 8.8%(-8.24)#113 |
| 8. | Kensington | 0.56% | 8.5%(-7.97)#8 | 8.8%(-8.22)#128 |
| 9. | Fairview | 0.57% | 8.5%(-7.97)#9 | 8.8%(-8.21)#134 |
| 10. | Atherton | 0.67% | 8.5%(-7.86)#10 | 8.8%(-8.11)#204 |
| 11. | Clayton | 0.76% | 8.5%(-7.77)#11 | 8.8%(-8.02)#281 |
| 12. | El Granada | 0.76% | 8.5%(-7.77)#12 | 8.8%(-8.02)#284 |
| 13. | Monte Sereno | 0.77% | 8.5%(-7.77)#13 | 8.8%(-8.02)#287 |
| 14. | Boulder Creek | 0.78% | 8.5%(-7.76)#14 | 8.8%(-8.01)#298 |
| 15. | Bear Valley Springs | 0.81% | 8.5%(-7.73)#15 | 8.8%(-7.97)#323 |
| 16. | Orinda | 0.82% | 8.5%(-7.72)#16 | 8.8%(-7.97)#333 |
| 17. | Hartley | 0.83% | 8.5%(-7.71)#17 | 8.8%(-7.95)#349 |
| 18. | Wilkerson | 0.89% | 8.5%(-7.64)#18 | 8.8%(-7.89)#418 |
| 19. | Fieldbrook | 0.90% | 8.5%(-7.64)#19 | 8.8%(-7.88)#423 |
| 20. | Bella Vista | 0.90% | 8.5%(-7.63)#20 | 8.8%(-7.88)#429 |
| 21. | East Richmond Heights | 0.92% | 8.5%(-7.62)#21 | 8.8%(-7.87)#446 |
| 22. | San Diego Country Estates | 0.94% | 8.5%(-7.59)#22 | 8.8%(-7.84)#469 |
| 23. | Manila | 1.0% | 8.5%(-7.50)#23 | 8.8%(-7.75)#569 |
| 24. | Johnstonville | 1.1% | 8.5%(-7.47)#24 | 8.8%(-7.72)#609 |
| 25. | West Menlo Park | 1.1% | 8.5%(-7.47)#25 | 8.8%(-7.72)#611 |
| 26. | Bell Canyon | 1.1% | 8.5%(-7.47)#26 | 8.8%(-7.72)#614 |
| 27. | Three Rivers | 1.1% | 8.5%(-7.46)#27 | 8.8%(-7.70)#629 |
| 28. | Gold River | 1.1% | 8.5%(-7.42)#28 | 8.8%(-7.67)#658 |
| 29. | Eucalyptus Hills | 1.1% | 8.5%(-7.39)#29 | 8.8%(-7.64)#685 |
| 30. | Los Altos Hills | 1.1% | 8.5%(-7.39)#30 | 8.8%(-7.64)#688 |
| 31. | Mission Hills | 1.2% | 8.5%(-7.35)#31 | 8.8%(-7.60)#739 |
| 32. | Bayview Cdp Contra Costa County | 1.2% | 8.5%(-7.29)#32 | 8.8%(-7.54)#815 |
| 33. | Lake Shastina | 1.2% | 8.5%(-7.29)#33 | 8.8%(-7.54)#825 |
| 34. | Seacliff | 1.3% | 8.5%(-7.28)#34 | 8.8%(-7.53)#838 |
| 35. | Buellton | 1.3% | 8.5%(-7.26)#35 | 8.8%(-7.51)#852 |
| 36. | Los Olivos | 1.3% | 8.5%(-7.26)#36 | 8.8%(-7.51)#857 |
| 37. | Cutten | 1.3% | 8.5%(-7.26)#37 | 8.8%(-7.51)#860 |
| 38. | San Miguel Cdp Contra Costa County | 1.3% | 8.5%(-7.23)#38 | 8.8%(-7.48)#886 |
| 39. | Millville | 1.4% | 8.5%(-7.13)#39 | 8.8%(-7.38)#1,007 |
| 40. | Palo Cedro | 1.4% | 8.5%(-7.13)#40 | 8.8%(-7.38)#1,009 |
| 41. | Del Monte Forest | 1.4% | 8.5%(-7.11)#41 | 8.8%(-7.35)#1,042 |
| 42. | Shingle Springs | 1.4% | 8.5%(-7.09)#42 | 8.8%(-7.34)#1,066 |
| 43. | Diablo Grande | 1.5% | 8.5%(-7.08)#43 | 8.8%(-7.33)#1,084 |
| 44. | Felton | 1.5% | 8.5%(-7.05)#44 | 8.8%(-7.30)#1,127 |
| 45. | Coffee Creek | 1.5% | 8.5%(-7.04)#45 | 8.8%(-7.29)#1,136 |
| 46. | San Anselmo | 1.5% | 8.5%(-7.04)#46 | 8.8%(-7.28)#1,143 |
| 47. | El Sobrante Cdp Riverside County | 1.5% | 8.5%(-7.01)#47 | 8.8%(-7.26)#1,180 |
| 48. | Alamo | 1.5% | 8.5%(-7.01)#48 | 8.8%(-7.26)#1,186 |
| 49. | San Carlos | 1.5% | 8.5%(-6.99)#49 | 8.8%(-7.24)#1,214 |
| 50. | San Martin | 1.6% | 8.5%(-6.98)#50 | 8.8%(-7.23)#1,226 |
| 51. | Moss Beach | 1.6% | 8.5%(-6.94)#51 | 8.8%(-7.19)#1,286 |
| 52. | Pine Grove | 1.6% | 8.5%(-6.92)#52 | 8.8%(-7.16)#1,317 |
| 53. | Arbuckle | 1.7% | 8.5%(-6.85)#53 | 8.8%(-7.10)#1,402 |
| 54. | East Sonora | 1.7% | 8.5%(-6.84)#54 | 8.8%(-7.09)#1,414 |
| 55. | Silver Lakes | 1.7% | 8.5%(-6.82)#55 | 8.8%(-7.07)#1,458 |
| 56. | Val Verde | 1.8% | 8.5%(-6.77)#56 | 8.8%(-7.02)#1,531 |
| 57. | La Canada Flintridge | 1.8% | 8.5%(-6.73)#57 | 8.8%(-6.97)#1,601 |
| 58. | Soquel | 1.8% | 8.5%(-6.72)#58 | 8.8%(-6.97)#1,605 |
| 59. | Lake Don Pedro | 1.8% | 8.5%(-6.72)#59 | 8.8%(-6.97)#1,606 |
| 60. | Rancho Mission Viejo | 1.8% | 8.5%(-6.72)#60 | 8.8%(-6.96)#1,607 |
| 61. | Rolling Hills Estates | 1.8% | 8.5%(-6.71)#61 | 8.8%(-6.96)#1,616 |
| 62. | Borrego Springs | 1.8% | 8.5%(-6.71)#62 | 8.8%(-6.95)#1,626 |
| 63. | Saratoga | 1.8% | 8.5%(-6.70)#63 | 8.8%(-6.95)#1,629 |
| 64. | Lafayette | 1.8% | 8.5%(-6.70)#64 | 8.8%(-6.95)#1,630 |
| 65. | Durham | 1.8% | 8.5%(-6.70)#65 | 8.8%(-6.94)#1,642 |
| 66. | Jamestown | 1.8% | 8.5%(-6.69)#66 | 8.8%(-6.93)#1,653 |
| 67. | Coto De Caza | 1.9% | 8.5%(-6.68)#67 | 8.8%(-6.93)#1,661 |
| 68. | Guerneville | 1.9% | 8.5%(-6.66)#68 | 8.8%(-6.91)#1,689 |
| 69. | Forestville | 1.9% | 8.5%(-6.66)#69 | 8.8%(-6.91)#1,695 |
| 70. | Anza | 1.9% | 8.5%(-6.65)#70 | 8.8%(-6.89)#1,714 |
| 71. | Trowbridge | 1.9% | 8.5%(-6.65)#71 | 8.8%(-6.89)#1,725 |
| 72. | Windsor | 1.9% | 8.5%(-6.63)#72 | 8.8%(-6.88)#1,745 |
| 73. | Morgan Hill | 1.9% | 8.5%(-6.62)#73 | 8.8%(-6.87)#1,758 |
| 74. | Manhattan Beach | 1.9% | 8.5%(-6.62)#74 | 8.8%(-6.86)#1,768 |
| 75. | Rose Hills | 1.9% | 8.5%(-6.61)#75 | 8.8%(-6.86)#1,772 |
| 76. | Tres Pinos | 1.9% | 8.5%(-6.60)#76 | 8.8%(-6.85)#1,797 |
| 77. | Rio Del Mar | 1.9% | 8.5%(-6.60)#77 | 8.8%(-6.84)#1,806 |
| 78. | Vandenberg Village | 1.9% | 8.5%(-6.59)#78 | 8.8%(-6.83)#1,818 |
| 79. | Aromas | 2.0% | 8.5%(-6.56)#79 | 8.8%(-6.81)#1,856 |
| 80. | Coronita | 2.0% | 8.5%(-6.52)#80 | 8.8%(-6.77)#1,899 |
| 81. | Morada | 2.0% | 8.5%(-6.52)#81 | 8.8%(-6.77)#1,901 |
| 82. | Loyola | 2.0% | 8.5%(-6.51)#82 | 8.8%(-6.76)#1,914 |
| 83. | Woodcrest | 2.0% | 8.5%(-6.50)#83 | 8.8%(-6.75)#1,930 |
| 84. | Modjeska | 2.0% | 8.5%(-6.50)#84 | 8.8%(-6.75)#1,934 |
| 85. | Livermore | 2.0% | 8.5%(-6.49)#85 | 8.8%(-6.73)#1,957 |
| 86. | Alta | 2.1% | 8.5%(-6.48)#86 | 8.8%(-6.73)#1,965 |
| 87. | East Whittier | 2.1% | 8.5%(-6.48)#87 | 8.8%(-6.73)#1,967 |
| 88. | Piedmont | 2.1% | 8.5%(-6.46)#88 | 8.8%(-6.71)#1,989 |
| 89. | Shingletown | 2.1% | 8.5%(-6.44)#89 | 8.8%(-6.69)#2,021 |
| 90. | Ladera Ranch | 2.1% | 8.5%(-6.40)#90 | 8.8%(-6.65)#2,082 |
| 91. | Kentfield | 2.1% | 8.5%(-6.40)#91 | 8.8%(-6.64)#2,084 |
| 92. | La Selva Beach | 2.2% | 8.5%(-6.36)#92 | 8.8%(-6.61)#2,134 |
| 93. | La Habra Heights | 2.2% | 8.5%(-6.36)#93 | 8.8%(-6.61)#2,136 |
| 94. | Callender | 2.2% | 8.5%(-6.35)#94 | 8.8%(-6.60)#2,158 |
| 95. | Middletown | 2.2% | 8.5%(-6.34)#95 | 8.8%(-6.58)#2,171 |
| 96. | Los Altos | 2.2% | 8.5%(-6.34)#96 | 8.8%(-6.58)#2,176 |
| 97. | Aptos Hills Larkin Valley | 2.2% | 8.5%(-6.31)#97 | 8.8%(-6.56)#2,231 |
| 98. | Newark | 2.2% | 8.5%(-6.30)#98 | 8.8%(-6.55)#2,235 |
| 99. | Templeton | 2.2% | 8.5%(-6.29)#99 | 8.8%(-6.54)#2,257 |
| 100. | Cotati | 2.3% | 8.5%(-6.28)#100 | 8.8%(-6.52)#2,282 |
Common Questions
What are the Top 10 Cities with the Lowest Poverty Level Among Families in California?
Top 10 Cities with the Lowest Poverty Level Among Families in California are:
#1
0.42%
#2
0.43%
#3
0.45%
#4
0.50%
#5
0.51%
#6
0.52%
#7
0.55%
#8
0.56%
#9
0.57%
#10
0.67%
What city has the Lowest Poverty Level Among Families in California?
Tiburon has the Lowest Poverty Level Among Families in California with 0.42%.
What is the Poverty Level Among Families in the State of California?
Poverty Level Among Families in California is 8.5%.
What is the Poverty Level Among Families in the United States?
Poverty Level Among Families in the United States is 8.8%.