Cities with the Highest Percentage of Population Employed in Installation, Maintenance & Repair in Oklahoma
RELATED REPORTS & OPTIONS
Installation, Maintenance & Repair
Oklahoma
Compare Cities
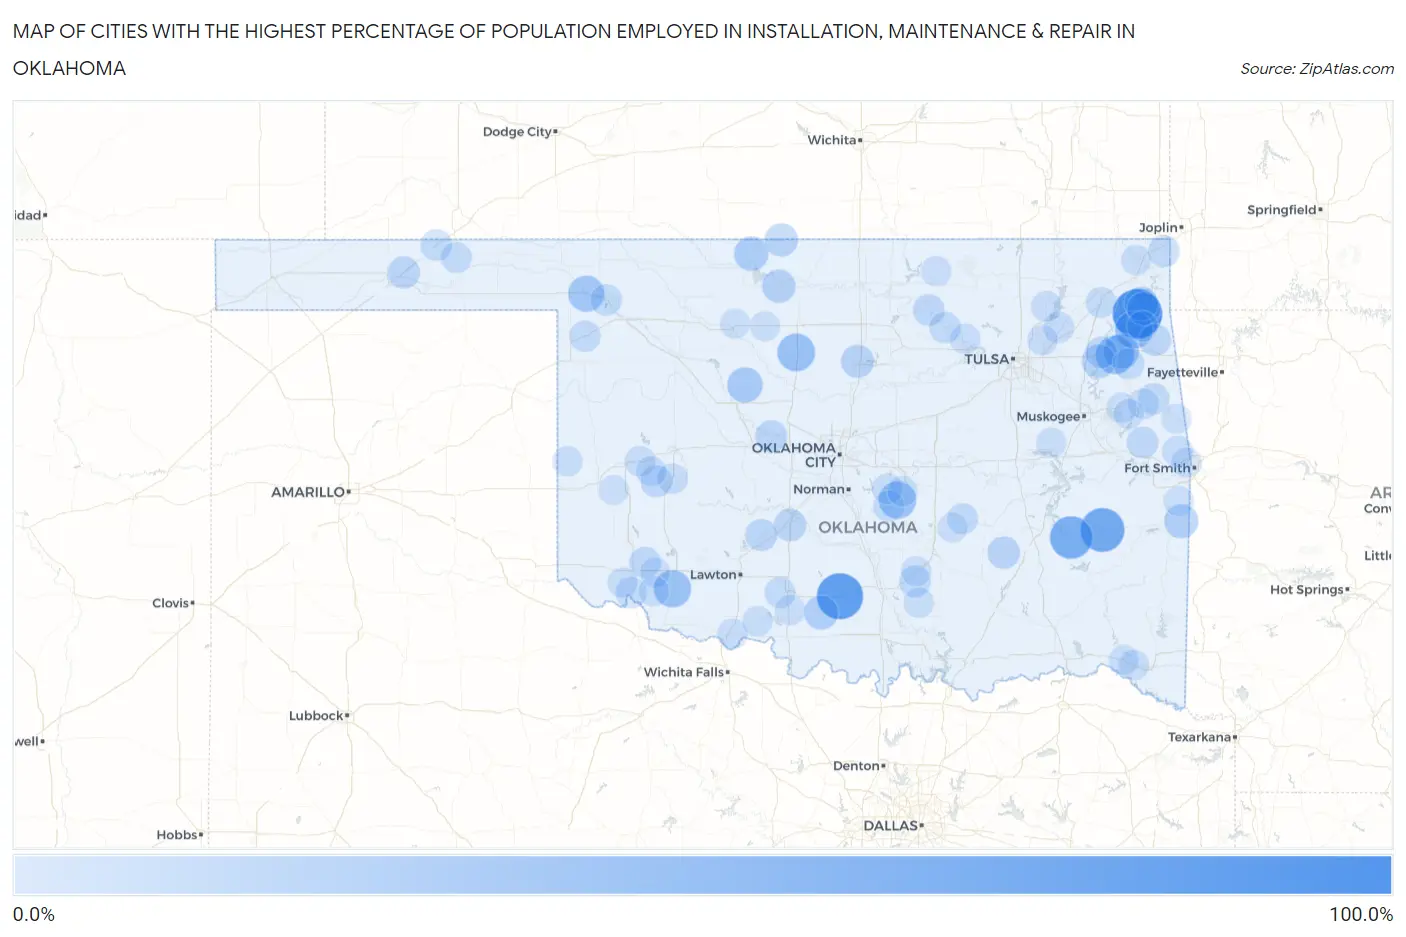
Map of Cities with the Highest Percentage of Population Employed in Installation, Maintenance & Repair in Oklahoma
0.0%
100.0%
Cities with the Highest Percentage of Population Employed in Installation, Maintenance & Repair in Oklahoma
| City | % Employed | vs State | vs National | |
| 1. | Drowning Creek | 100.0% | 4.2%(+95.8)#1 | 3.1%(+96.9)#5 |
| 2. | Homestead | 100.0% | 4.2%(+95.8)#2 | 3.1%(+96.9)#13 |
| 3. | Ratliff City | 84.3% | 4.2%(+80.1)#3 | 3.1%(+81.2)#21 |
| 4. | Panola | 72.7% | 4.2%(+68.6)#4 | 3.1%(+69.7)#28 |
| 5. | Gowen | 66.7% | 4.2%(+62.5)#5 | 3.1%(+63.6)#33 |
| 6. | Snake Creek | 46.9% | 4.2%(+42.8)#6 | 3.1%(+43.9)#96 |
| 7. | Bison | 44.4% | 4.2%(+40.3)#7 | 3.1%(+41.4)#109 |
| 8. | Macomb | 42.9% | 4.2%(+38.7)#8 | 3.1%(+39.8)#123 |
| 9. | Old Eucha | 42.9% | 4.2%(+38.7)#9 | 3.1%(+39.8)#124 |
| 10. | Watova | 42.3% | 4.2%(+38.1)#10 | 3.1%(+39.2)#127 |
| 11. | Manitou | 42.2% | 4.2%(+38.0)#11 | 3.1%(+39.1)#128 |
| 12. | May | 37.5% | 4.2%(+33.3)#12 | 3.1%(+34.4)#177 |
| 13. | Lawtonka Acres | 36.8% | 4.2%(+32.7)#13 | 3.1%(+33.8)#180 |
| 14. | Bryant | 35.7% | 4.2%(+31.5)#14 | 3.1%(+32.6)#186 |
| 15. | Rose | 33.3% | 4.2%(+29.2)#15 | 3.1%(+30.3)#218 |
| 16. | Hitchcock | 33.3% | 4.2%(+29.2)#16 | 3.1%(+30.3)#231 |
| 17. | Byron | 28.6% | 4.2%(+24.4)#17 | 3.1%(+25.5)#321 |
| 18. | Monroe | 27.3% | 4.2%(+23.1)#18 | 3.1%(+24.2)#349 |
| 19. | Loco | 27.3% | 4.2%(+23.1)#19 | 3.1%(+24.2)#351 |
| 20. | Murphy | 25.5% | 4.2%(+21.4)#20 | 3.1%(+22.5)#390 |
| 21. | Dennis | 25.3% | 4.2%(+21.1)#21 | 3.1%(+22.2)#399 |
| 22. | Nash | 24.4% | 4.2%(+20.2)#22 | 3.1%(+21.3)#446 |
| 23. | Little Rock | 23.8% | 4.2%(+19.6)#23 | 3.1%(+20.7)#467 |
| 24. | Bug Tussle | 23.6% | 4.2%(+19.4)#24 | 3.1%(+20.5)#476 |
| 25. | Manchester | 23.3% | 4.2%(+19.1)#25 | 3.1%(+20.2)#485 |
| 26. | Orlando | 23.1% | 4.2%(+18.9)#26 | 3.1%(+20.0)#494 |
| 27. | Zena | 22.5% | 4.2%(+18.3)#27 | 3.1%(+19.4)#522 |
| 28. | Ashland | 21.1% | 4.2%(+16.9)#28 | 3.1%(+18.0)#601 |
| 29. | Ninnekah | 20.4% | 4.2%(+16.2)#29 | 3.1%(+17.4)#639 |
| 30. | Optima | 20.3% | 4.2%(+16.2)#30 | 3.1%(+17.3)#649 |
| 31. | Lake Ellsworth Addition | 20.3% | 4.2%(+16.1)#31 | 3.1%(+17.2)#659 |
| 32. | Fittstown | 20.0% | 4.2%(+15.8)#32 | 3.1%(+16.9)#682 |
| 33. | Cyril | 18.6% | 4.2%(+14.4)#33 | 3.1%(+15.5)#760 |
| 34. | Calumet | 18.5% | 4.2%(+14.3)#34 | 3.1%(+15.5)#766 |
| 35. | Cloud Creek | 18.5% | 4.2%(+14.3)#35 | 3.1%(+15.5)#769 |
| 36. | Dill City | 17.7% | 4.2%(+13.6)#36 | 3.1%(+14.7)#844 |
| 37. | Sams Corner | 17.0% | 4.2%(+12.9)#37 | 3.1%(+14.0)#901 |
| 38. | Baron | 17.0% | 4.2%(+12.8)#38 | 3.1%(+13.9)#904 |
| 39. | Ralston | 16.8% | 4.2%(+12.6)#39 | 3.1%(+13.7)#924 |
| 40. | Hickory | 16.7% | 4.2%(+12.5)#40 | 3.1%(+13.6)#938 |
| 41. | Peoria | 16.7% | 4.2%(+12.5)#41 | 3.1%(+13.6)#943 |
| 42. | Dwight Mission | 16.7% | 4.2%(+12.5)#42 | 3.1%(+13.6)#951 |
| 43. | Friendship | 16.7% | 4.2%(+12.5)#44 | 3.1%(+13.6)#955 |
| 44. | Avard | 16.7% | 4.2%(+12.5)#45 | 3.1%(+13.6)#956 |
| 45. | Fort Supply | 16.2% | 4.2%(+12.0)#46 | 3.1%(+13.1)#994 |
| 46. | Blackburn | 16.1% | 4.2%(+12.0)#47 | 3.1%(+13.1)#1,010 |
| 47. | Tyrone | 15.8% | 4.2%(+11.7)#48 | 3.1%(+12.8)#1,036 |
| 48. | Wauhillau | 15.4% | 4.2%(+11.2)#49 | 3.1%(+12.3)#1,077 |
| 49. | Teresita | 15.4% | 4.2%(+11.2)#50 | 3.1%(+12.3)#1,086 |
| 50. | Hough | 15.4% | 4.2%(+11.2)#51 | 3.1%(+12.3)#1,093 |
| 51. | Crescent Springs | 15.2% | 4.2%(+11.0)#52 | 3.1%(+12.1)#1,116 |
| 52. | Gage | 15.1% | 4.2%(+11.0)#53 | 3.1%(+12.1)#1,133 |
| 53. | Elmer | 15.0% | 4.2%(+10.8)#54 | 3.1%(+11.9)#1,163 |
| 54. | Tribbey | 14.7% | 4.2%(+10.6)#55 | 3.1%(+11.7)#1,199 |
| 55. | Mallard Bay | 14.3% | 4.2%(+10.1)#56 | 3.1%(+11.2)#1,265 |
| 56. | Enterprise | 14.3% | 4.2%(+10.1)#57 | 3.1%(+11.2)#1,275 |
| 57. | Empire City | 14.1% | 4.2%(+9.95)#58 | 3.1%(+11.1)#1,307 |
| 58. | Turpin | 13.9% | 4.2%(+9.70)#59 | 3.1%(+10.8)#1,369 |
| 59. | Adams | 13.8% | 4.2%(+9.66)#60 | 3.1%(+10.8)#1,374 |
| 60. | Spaulding | 13.7% | 4.2%(+9.56)#61 | 3.1%(+10.7)#1,391 |
| 61. | Big Cabin | 13.6% | 4.2%(+9.41)#62 | 3.1%(+10.5)#1,418 |
| 62. | Pink | 13.4% | 4.2%(+9.21)#63 | 3.1%(+10.3)#1,471 |
| 63. | Sequoyah | 13.1% | 4.2%(+8.90)#64 | 3.1%(+10.0)#1,547 |
| 64. | Long | 12.8% | 4.2%(+8.65)#65 | 3.1%(+9.75)#1,620 |
| 65. | Caney | 12.2% | 4.2%(+8.07)#66 | 3.1%(+9.17)#1,770 |
| 66. | Middleberg | 12.1% | 4.2%(+7.95)#67 | 3.1%(+9.05)#1,793 |
| 67. | New Cordell | 12.1% | 4.2%(+7.95)#68 | 3.1%(+9.05)#1,795 |
| 68. | Canute | 12.1% | 4.2%(+7.90)#69 | 3.1%(+9.00)#1,804 |
| 69. | New Eucha | 12.0% | 4.2%(+7.87)#70 | 3.1%(+8.97)#1,814 |
| 70. | Fox | 12.0% | 4.2%(+7.83)#71 | 3.1%(+8.93)#1,834 |
| 71. | Talala | 11.9% | 4.2%(+7.77)#72 | 3.1%(+8.87)#1,846 |
| 72. | Headrick | 11.8% | 4.2%(+7.60)#73 | 3.1%(+8.70)#1,898 |
| 73. | Comanche | 11.7% | 4.2%(+7.52)#74 | 3.1%(+8.62)#1,921 |
| 74. | Hanson | 11.5% | 4.2%(+7.37)#75 | 3.1%(+8.47)#1,968 |
| 75. | Osage | 11.4% | 4.2%(+7.26)#76 | 3.1%(+8.36)#2,013 |
| 76. | Randlett | 11.2% | 4.2%(+7.00)#77 | 3.1%(+8.11)#2,083 |
| 77. | Shidler | 11.1% | 4.2%(+6.94)#78 | 3.1%(+8.04)#2,099 |
| 78. | Garvin | 11.1% | 4.2%(+6.94)#79 | 3.1%(+8.04)#2,108 |
| 79. | Valley Park | 11.1% | 4.2%(+6.94)#80 | 3.1%(+8.04)#2,124 |
| 80. | Mill Creek | 10.9% | 4.2%(+6.72)#81 | 3.1%(+7.82)#2,178 |
| 81. | Dotyville | 10.8% | 4.2%(+6.60)#82 | 3.1%(+7.70)#2,225 |
| 82. | Olustee | 10.7% | 4.2%(+6.58)#83 | 3.1%(+7.68)#2,229 |
| 83. | Tipton | 10.7% | 4.2%(+6.57)#84 | 3.1%(+7.67)#2,234 |
| 84. | Temple | 10.7% | 4.2%(+6.50)#85 | 3.1%(+7.60)#2,260 |
| 85. | Sweetwater | 10.6% | 4.2%(+6.44)#86 | 3.1%(+7.54)#2,286 |
| 86. | Burns Flat | 10.6% | 4.2%(+6.42)#87 | 3.1%(+7.52)#2,297 |
| 87. | Moffett | 10.5% | 4.2%(+6.36)#88 | 3.1%(+7.46)#2,325 |
| 88. | Brooksville | 10.5% | 4.2%(+6.36)#89 | 3.1%(+7.46)#2,327 |
| 89. | Cameron | 10.5% | 4.2%(+6.31)#90 | 3.1%(+7.42)#2,341 |
| 90. | Roff | 10.4% | 4.2%(+6.27)#91 | 3.1%(+7.37)#2,355 |
| 91. | Zeb | 10.3% | 4.2%(+6.11)#92 | 3.1%(+7.21)#2,430 |
| 92. | Cleo Springs | 10.3% | 4.2%(+6.09)#93 | 3.1%(+7.19)#2,439 |
| 93. | Bell | 10.2% | 4.2%(+6.03)#94 | 3.1%(+7.14)#2,467 |
| 94. | Millerton | 10.1% | 4.2%(+5.94)#95 | 3.1%(+7.04)#2,505 |
| 95. | Pettit | 10.0% | 4.2%(+5.88)#96 | 3.1%(+6.98)#2,526 |
| 96. | Council Hill | 10.0% | 4.2%(+5.83)#97 | 3.1%(+6.93)#2,563 |
| 97. | Sasakwa | 10.0% | 4.2%(+5.83)#98 | 3.1%(+6.93)#2,564 |
| 98. | Cookson | 9.9% | 4.2%(+5.75)#99 | 3.1%(+6.86)#2,599 |
| 99. | Meno | 9.8% | 4.2%(+5.62)#100 | 3.1%(+6.72)#2,682 |
| 100. | Carter | 9.8% | 4.2%(+5.59)#101 | 3.1%(+6.69)#2,696 |
Common Questions
What are the Top 10 Cities with the Highest Percentage of Population Employed in Installation, Maintenance & Repair in Oklahoma?
Top 10 Cities with the Highest Percentage of Population Employed in Installation, Maintenance & Repair in Oklahoma are:
#1
100.0%
#2
84.3%
#3
72.7%
#4
66.7%
#5
46.9%
#6
44.4%
#7
42.9%
#8
42.9%
#9
42.2%
#10
37.5%
What city has the Highest Percentage of Population Employed in Installation, Maintenance & Repair in Oklahoma?
Drowning Creek has the Highest Percentage of Population Employed in Installation, Maintenance & Repair in Oklahoma with 100.0%.
What is the Percentage of Population Employed in Installation, Maintenance & Repair in the State of Oklahoma?
Percentage of Population Employed in Installation, Maintenance & Repair in Oklahoma is 4.2%.
What is the Percentage of Population Employed in Installation, Maintenance & Repair in the United States?
Percentage of Population Employed in Installation, Maintenance & Repair in the United States is 3.1%.