Cities with the Highest Percentage of Population Employed in Installation, Maintenance & Repair in Mississippi
RELATED REPORTS & OPTIONS
Installation, Maintenance & Repair
Mississippi
Compare Cities
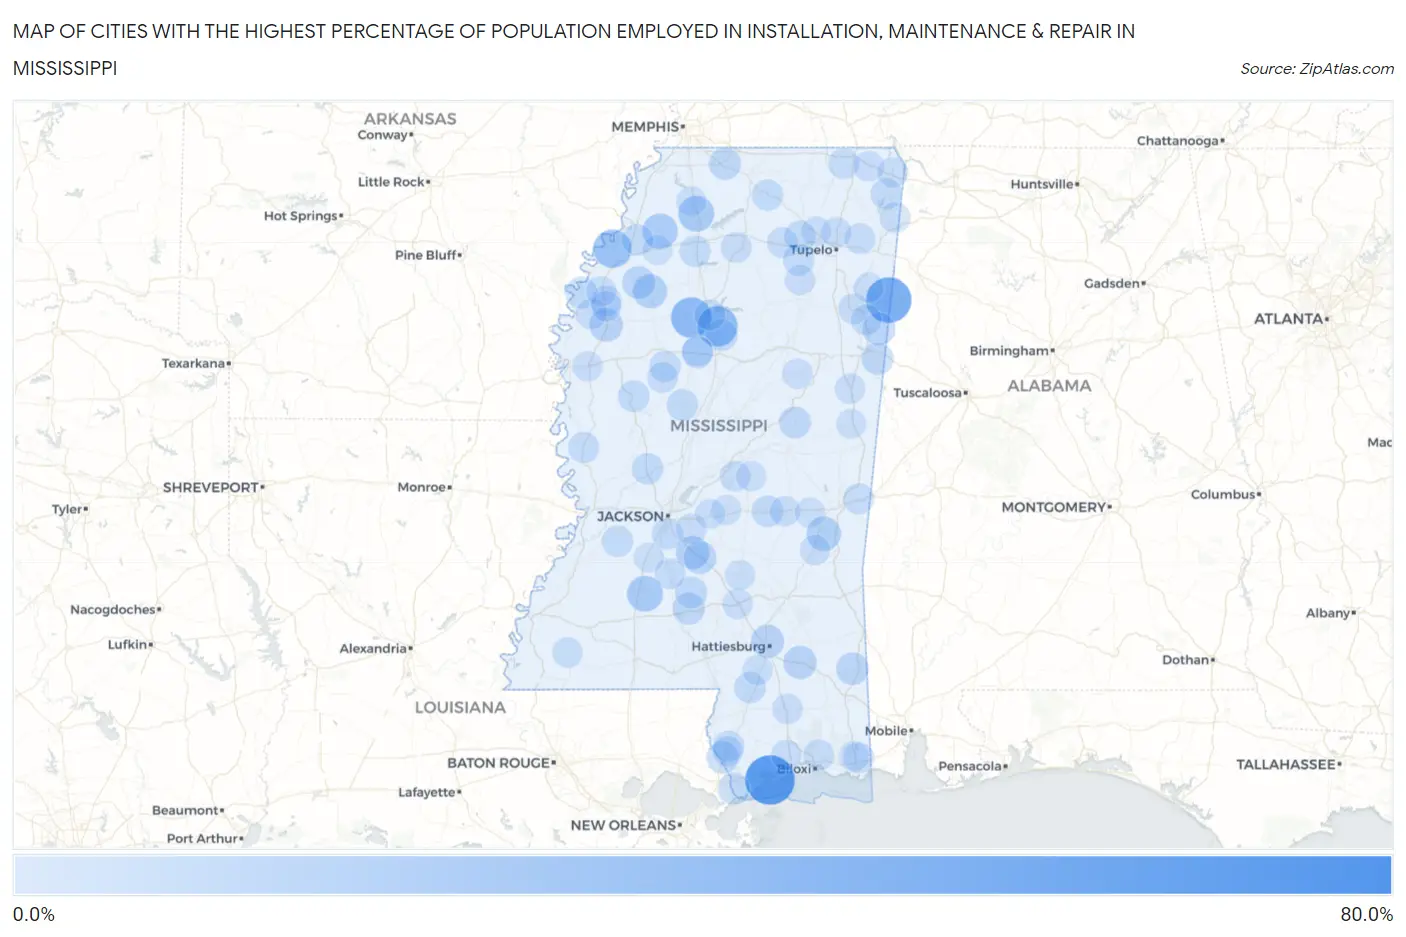
Map of Cities with the Highest Percentage of Population Employed in Installation, Maintenance & Repair in Mississippi
0.0%
80.0%
Cities with the Highest Percentage of Population Employed in Installation, Maintenance & Repair in Mississippi
| City | % Employed | vs State | vs National | |
| 1. | Randolph | 70.6% | 4.3%(+66.3)#1 | 3.1%(+67.5)#30 |
| 2. | Henderson Point | 62.5% | 4.3%(+58.2)#2 | 3.1%(+59.4)#37 |
| 3. | Tula | 55.8% | 4.3%(+51.5)#3 | 3.1%(+52.7)#55 |
| 4. | Gattman | 50.0% | 4.3%(+45.7)#4 | 3.1%(+46.9)#73 |
| 5. | Holcomb | 35.5% | 4.3%(+31.2)#5 | 3.1%(+32.4)#189 |
| 6. | Elliott | 34.5% | 4.3%(+30.3)#6 | 3.1%(+31.5)#208 |
| 7. | Agricola | 33.5% | 4.3%(+29.2)#7 | 3.1%(+30.4)#217 |
| 8. | New Site | 32.8% | 4.3%(+28.6)#8 | 3.1%(+29.8)#237 |
| 9. | Farrell | 29.1% | 4.3%(+24.8)#9 | 3.1%(+26.0)#303 |
| 10. | Como | 22.0% | 4.3%(+17.7)#10 | 3.1%(+18.9)#543 |
| 11. | Beauregard | 22.0% | 4.3%(+17.7)#11 | 3.1%(+18.9)#544 |
| 12. | Falcon | 20.4% | 4.3%(+16.1)#12 | 3.1%(+17.3)#641 |
| 13. | Enterprise | 17.9% | 4.3%(+13.7)#13 | 3.1%(+14.9)#825 |
| 14. | Webb | 17.1% | 4.3%(+12.9)#14 | 3.1%(+14.1)#887 |
| 15. | Braxton | 15.1% | 4.3%(+10.8)#15 | 3.1%(+12.0)#1,147 |
| 16. | Boyle | 14.8% | 4.3%(+10.5)#16 | 3.1%(+11.7)#1,191 |
| 17. | New Augusta | 14.6% | 4.3%(+10.3)#17 | 3.1%(+11.6)#1,215 |
| 18. | Rena Lara | 14.4% | 4.3%(+10.2)#18 | 3.1%(+11.4)#1,242 |
| 19. | Glendale | 14.4% | 4.3%(+10.1)#19 | 3.1%(+11.3)#1,246 |
| 20. | Tutwiler | 13.5% | 4.3%(+9.20)#20 | 3.1%(+10.4)#1,444 |
| 21. | Caledonia | 13.3% | 4.3%(+9.00)#21 | 3.1%(+10.2)#1,501 |
| 22. | D Lo | 13.1% | 4.3%(+8.82)#22 | 3.1%(+10.0)#1,541 |
| 23. | Victoria | 12.7% | 4.3%(+8.45)#23 | 3.1%(+9.66)#1,645 |
| 24. | Leakesville | 12.6% | 4.3%(+8.28)#24 | 3.1%(+9.48)#1,684 |
| 25. | Nicholson | 11.5% | 4.3%(+7.21)#25 | 3.1%(+8.41)#1,988 |
| 26. | Byhalia | 11.4% | 4.3%(+7.15)#26 | 3.1%(+8.36)#2,005 |
| 27. | Duck Hill | 11.2% | 4.3%(+6.94)#27 | 3.1%(+8.14)#2,074 |
| 28. | Noxapater | 11.2% | 4.3%(+6.89)#28 | 3.1%(+8.10)#2,084 |
| 29. | Pearlington | 11.1% | 4.3%(+6.86)#29 | 3.1%(+8.07)#2,091 |
| 30. | New Hope | 11.0% | 4.3%(+6.71)#30 | 3.1%(+7.91)#2,151 |
| 31. | Silver Creek | 10.9% | 4.3%(+6.59)#31 | 3.1%(+7.80)#2,187 |
| 32. | Arkabutla | 10.7% | 4.3%(+6.39)#32 | 3.1%(+7.60)#2,262 |
| 33. | Carrollton | 10.6% | 4.3%(+6.35)#33 | 3.1%(+7.56)#2,274 |
| 34. | New Hebron | 10.5% | 4.3%(+6.22)#34 | 3.1%(+7.43)#2,335 |
| 35. | Gunnison | 10.5% | 4.3%(+6.19)#35 | 3.1%(+7.40)#2,349 |
| 36. | Belzoni | 10.0% | 4.3%(+5.69)#36 | 3.1%(+6.90)#2,581 |
| 37. | Lake | 10.0% | 4.3%(+5.68)#37 | 3.1%(+6.89)#2,584 |
| 38. | Lumberton | 9.9% | 4.3%(+5.67)#38 | 3.1%(+6.88)#2,588 |
| 39. | Bentonia | 9.7% | 4.3%(+5.46)#39 | 3.1%(+6.67)#2,710 |
| 40. | Lexington | 9.7% | 4.3%(+5.41)#40 | 3.1%(+6.62)#2,737 |
| 41. | Courtland | 9.5% | 4.3%(+5.18)#41 | 3.1%(+6.39)#2,861 |
| 42. | Algoma | 9.2% | 4.3%(+4.96)#42 | 3.1%(+6.17)#2,982 |
| 43. | Utica | 9.0% | 4.3%(+4.76)#43 | 3.1%(+5.97)#3,099 |
| 44. | Potts Camp | 9.0% | 4.3%(+4.73)#44 | 3.1%(+5.94)#3,116 |
| 45. | Ecru | 9.0% | 4.3%(+4.72)#45 | 3.1%(+5.92)#3,125 |
| 46. | Jonestown | 8.9% | 4.3%(+4.67)#46 | 3.1%(+5.88)#3,158 |
| 47. | Hide A Way Lake | 8.8% | 4.3%(+4.55)#47 | 3.1%(+5.76)#3,233 |
| 48. | Cleary | 8.8% | 4.3%(+4.51)#48 | 3.1%(+5.72)#3,266 |
| 49. | Paris | 8.7% | 4.3%(+4.42)#49 | 3.1%(+5.63)#3,344 |
| 50. | Cary | 8.6% | 4.3%(+4.33)#50 | 3.1%(+5.53)#3,417 |
| 51. | Paden | 8.6% | 4.3%(+4.30)#51 | 3.1%(+5.50)#3,448 |
| 52. | Sidon | 8.5% | 4.3%(+4.23)#52 | 3.1%(+5.44)#3,492 |
| 53. | Mantachie | 8.3% | 4.3%(+4.02)#53 | 3.1%(+5.23)#3,682 |
| 54. | Grenada | 8.2% | 4.3%(+3.88)#54 | 3.1%(+5.09)#3,798 |
| 55. | Helena | 8.2% | 4.3%(+3.88)#55 | 3.1%(+5.09)#3,799 |
| 56. | Taylor | 8.1% | 4.3%(+3.79)#56 | 3.1%(+5.00)#3,880 |
| 57. | Kossuth | 8.1% | 4.3%(+3.79)#57 | 3.1%(+5.00)#3,884 |
| 58. | Thaxton | 8.0% | 4.3%(+3.68)#58 | 3.1%(+4.88)#3,974 |
| 59. | Mound Bayou | 7.9% | 4.3%(+3.60)#59 | 3.1%(+4.81)#4,038 |
| 60. | Pace | 7.7% | 4.3%(+3.42)#60 | 3.1%(+4.62)#4,210 |
| 61. | Cruger | 7.6% | 4.3%(+3.32)#61 | 3.1%(+4.53)#4,326 |
| 62. | Georgetown | 7.5% | 4.3%(+3.22)#62 | 3.1%(+4.43)#4,431 |
| 63. | Latimer | 7.4% | 4.3%(+3.15)#63 | 3.1%(+4.35)#4,503 |
| 64. | Aberdeen | 7.4% | 4.3%(+3.09)#64 | 3.1%(+4.30)#4,554 |
| 65. | New Hamilton | 7.4% | 4.3%(+3.09)#65 | 3.1%(+4.29)#4,562 |
| 66. | Golden | 7.3% | 4.3%(+3.06)#66 | 3.1%(+4.27)#4,592 |
| 67. | Toomsuba | 7.3% | 4.3%(+3.05)#67 | 3.1%(+4.26)#4,609 |
| 68. | Picayune | 7.3% | 4.3%(+2.98)#68 | 3.1%(+4.19)#4,702 |
| 69. | Saltillo | 7.1% | 4.3%(+2.82)#69 | 3.1%(+4.03)#4,894 |
| 70. | Lena | 7.0% | 4.3%(+2.74)#70 | 3.1%(+3.95)#4,987 |
| 71. | Wiggins | 6.9% | 4.3%(+2.62)#71 | 3.1%(+3.83)#5,101 |
| 72. | Glen | 6.9% | 4.3%(+2.60)#72 | 3.1%(+3.81)#5,137 |
| 73. | North Carrollton | 6.9% | 4.3%(+2.59)#73 | 3.1%(+3.80)#5,140 |
| 74. | Sturgis | 6.8% | 4.3%(+2.57)#74 | 3.1%(+3.78)#5,181 |
| 75. | Collins | 6.8% | 4.3%(+2.55)#75 | 3.1%(+3.76)#5,220 |
| 76. | Robinhood | 6.8% | 4.3%(+2.52)#76 | 3.1%(+3.73)#5,264 |
| 77. | Crosby | 6.8% | 4.3%(+2.50)#77 | 3.1%(+3.71)#5,294 |
| 78. | Merigold | 6.7% | 4.3%(+2.43)#78 | 3.1%(+3.64)#5,381 |
| 79. | Lyman | 6.7% | 4.3%(+2.41)#79 | 3.1%(+3.61)#5,411 |
| 80. | Pachuta | 6.6% | 4.3%(+2.28)#80 | 3.1%(+3.49)#5,609 |
| 81. | Newton | 6.5% | 4.3%(+2.24)#81 | 3.1%(+3.45)#5,671 |
| 82. | New Houlka | 6.4% | 4.3%(+2.15)#82 | 3.1%(+3.35)#5,804 |
| 83. | Shelby | 6.3% | 4.3%(+2.01)#83 | 3.1%(+3.22)#5,992 |
| 84. | Brooksville | 6.3% | 4.3%(+2.01)#84 | 3.1%(+3.22)#5,999 |
| 85. | Leland | 6.3% | 4.3%(+2.00)#85 | 3.1%(+3.21)#6,005 |
| 86. | Iuka | 6.2% | 4.3%(+1.97)#86 | 3.1%(+3.18)#6,091 |
| 87. | Blue Springs | 6.2% | 4.3%(+1.94)#87 | 3.1%(+3.14)#6,123 |
| 88. | Walnut Grove | 6.2% | 4.3%(+1.90)#88 | 3.1%(+3.11)#6,187 |
| 89. | Purvis | 6.1% | 4.3%(+1.83)#89 | 3.1%(+3.03)#6,296 |
| 90. | Escatawpa | 6.1% | 4.3%(+1.82)#90 | 3.1%(+3.02)#6,310 |
| 91. | Crystal Springs | 6.1% | 4.3%(+1.78)#91 | 3.1%(+2.99)#6,383 |
| 92. | Eudora | 5.9% | 4.3%(+1.66)#92 | 3.1%(+2.87)#6,556 |
| 93. | Marks | 5.9% | 4.3%(+1.65)#93 | 3.1%(+2.86)#6,576 |
| 94. | Morton | 5.9% | 4.3%(+1.62)#94 | 3.1%(+2.83)#6,623 |
| 95. | Shuqualak | 5.9% | 4.3%(+1.61)#95 | 3.1%(+2.81)#6,658 |
| 96. | Chunky | 5.9% | 4.3%(+1.61)#96 | 3.1%(+2.81)#6,662 |
| 97. | Pelahatchie | 5.9% | 4.3%(+1.60)#97 | 3.1%(+2.81)#6,692 |
| 98. | Mize | 5.8% | 4.3%(+1.55)#98 | 3.1%(+2.76)#6,762 |
| 99. | Senatobia | 5.8% | 4.3%(+1.48)#99 | 3.1%(+2.69)#6,899 |
| 100. | Hatley | 5.7% | 4.3%(+1.42)#100 | 3.1%(+2.62)#7,015 |
Common Questions
What are the Top 10 Cities with the Highest Percentage of Population Employed in Installation, Maintenance & Repair in Mississippi?
Top 10 Cities with the Highest Percentage of Population Employed in Installation, Maintenance & Repair in Mississippi are:
#1
62.5%
#2
50.0%
#3
35.5%
#4
34.5%
#5
29.1%
#6
22.0%
#7
22.0%
#8
20.4%
#9
17.9%
#10
17.1%
What city has the Highest Percentage of Population Employed in Installation, Maintenance & Repair in Mississippi?
Henderson Point has the Highest Percentage of Population Employed in Installation, Maintenance & Repair in Mississippi with 62.5%.
What is the Percentage of Population Employed in Installation, Maintenance & Repair in the State of Mississippi?
Percentage of Population Employed in Installation, Maintenance & Repair in Mississippi is 4.3%.
What is the Percentage of Population Employed in Installation, Maintenance & Repair in the United States?
Percentage of Population Employed in Installation, Maintenance & Repair in the United States is 3.1%.