Cities with the Highest Percentage of Population Employed in Installation, Maintenance & Repair in South Carolina
RELATED REPORTS & OPTIONS
Installation, Maintenance & Repair
South Carolina
Compare Cities
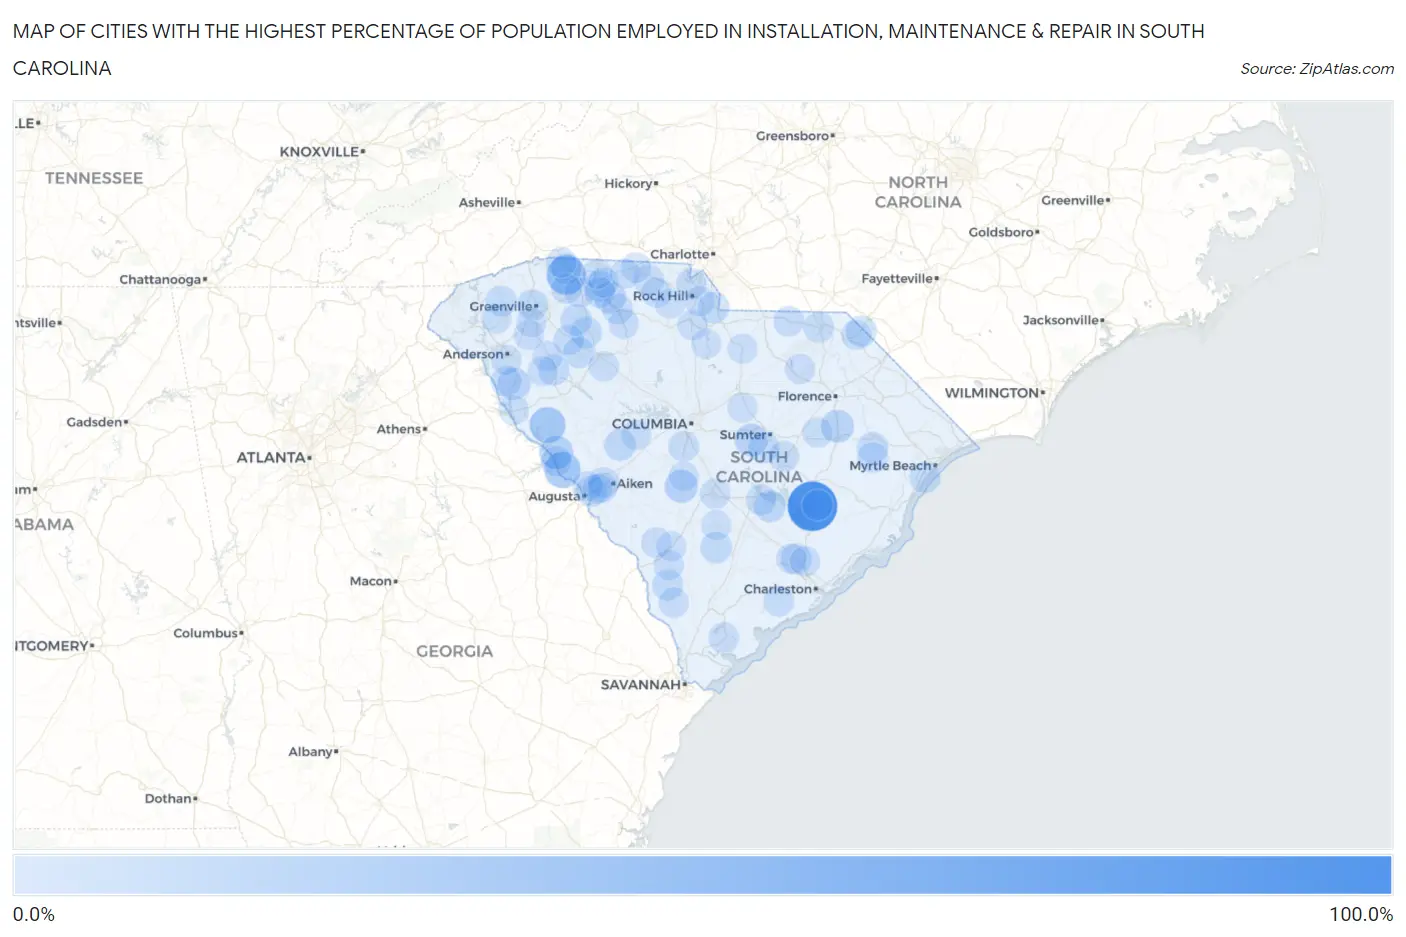
Map of Cities with the Highest Percentage of Population Employed in Installation, Maintenance & Repair in South Carolina
0.0%
100.0%
Cities with the Highest Percentage of Population Employed in Installation, Maintenance & Repair in South Carolina
| City | % Employed | vs State | vs National | |
| 1. | Russellville | 100.0% | 3.8%(+96.2)#1 | 3.1%(+96.9)#1 |
| 2. | Rains | 67.1% | 3.8%(+63.3)#2 | 3.1%(+64.0)#31 |
| 3. | Gramling | 49.2% | 3.8%(+45.4)#3 | 3.1%(+46.1)#83 |
| 4. | Tradesville | 37.5% | 3.8%(+33.7)#4 | 3.1%(+34.4)#175 |
| 5. | Clarks Hill | 35.0% | 3.8%(+31.2)#5 | 3.1%(+31.9)#201 |
| 6. | Troy | 33.3% | 3.8%(+29.5)#6 | 3.1%(+30.3)#220 |
| 7. | Parksville | 23.1% | 3.8%(+19.3)#7 | 3.1%(+20.0)#495 |
| 8. | Neeses | 20.7% | 3.8%(+16.9)#8 | 3.1%(+17.6)#623 |
| 9. | Coward | 19.2% | 3.8%(+15.4)#9 | 3.1%(+16.2)#721 |
| 10. | Wedgefield | 19.1% | 3.8%(+15.3)#10 | 3.1%(+16.0)#728 |
| 11. | Olympia | 18.1% | 3.8%(+14.3)#11 | 3.1%(+15.0)#810 |
| 12. | Lake Secession | 17.9% | 3.8%(+14.1)#12 | 3.1%(+14.9)#827 |
| 13. | South Union | 15.8% | 3.8%(+12.0)#13 | 3.1%(+12.7)#1,039 |
| 14. | Central Pacolet | 15.4% | 3.8%(+11.6)#14 | 3.1%(+12.3)#1,083 |
| 15. | Unity | 14.8% | 3.8%(+11.0)#15 | 3.1%(+11.8)#1,183 |
| 16. | Eutawville | 14.2% | 3.8%(+10.4)#16 | 3.1%(+11.1)#1,294 |
| 17. | Ridge Spring | 13.9% | 3.8%(+10.1)#17 | 3.1%(+10.9)#1,347 |
| 18. | Fairview Crossroads | 13.5% | 3.8%(+9.69)#18 | 3.1%(+10.4)#1,437 |
| 19. | Conestee | 13.3% | 3.8%(+9.53)#19 | 3.1%(+10.3)#1,479 |
| 20. | Ashwood | 13.3% | 3.8%(+9.53)#20 | 3.1%(+10.3)#1,490 |
| 21. | Smoaks | 13.0% | 3.8%(+9.16)#21 | 3.1%(+9.90)#1,581 |
| 22. | Enoree | 12.6% | 3.8%(+8.76)#22 | 3.1%(+9.50)#1,677 |
| 23. | Woodruff | 12.0% | 3.8%(+8.20)#23 | 3.1%(+8.94)#1,826 |
| 24. | Privateer | 11.8% | 3.8%(+7.99)#24 | 3.1%(+8.73)#1,886 |
| 25. | Van Wyck | 11.8% | 3.8%(+7.96)#25 | 3.1%(+8.70)#1,890 |
| 26. | Surfside Beach | 11.7% | 3.8%(+7.89)#26 | 3.1%(+8.62)#1,920 |
| 27. | Mccoll | 11.6% | 3.8%(+7.78)#27 | 3.1%(+8.51)#1,945 |
| 28. | Johnsonville | 11.6% | 3.8%(+7.77)#28 | 3.1%(+8.51)#1,949 |
| 29. | Dale | 11.5% | 3.8%(+7.67)#29 | 3.1%(+8.41)#1,991 |
| 30. | Dacusville | 11.4% | 3.8%(+7.62)#30 | 3.1%(+8.36)#2,008 |
| 31. | Floydale | 11.4% | 3.8%(+7.56)#31 | 3.1%(+8.30)#2,032 |
| 32. | Clearwater | 11.3% | 3.8%(+7.49)#32 | 3.1%(+8.22)#2,052 |
| 33. | Laurens | 11.2% | 3.8%(+7.39)#33 | 3.1%(+8.13)#2,078 |
| 34. | Converse | 11.1% | 3.8%(+7.31)#34 | 3.1%(+8.04)#2,105 |
| 35. | City View | 10.8% | 3.8%(+7.04)#35 | 3.1%(+7.78)#2,196 |
| 36. | Ware Shoals | 10.8% | 3.8%(+7.04)#36 | 3.1%(+7.78)#2,197 |
| 37. | Dunbar | 10.7% | 3.8%(+6.93)#37 | 3.1%(+7.67)#2,237 |
| 38. | Luray | 10.6% | 3.8%(+6.77)#38 | 3.1%(+7.51)#2,299 |
| 39. | Pickens | 10.3% | 3.8%(+6.50)#39 | 3.1%(+7.24)#2,416 |
| 40. | Dovesville | 10.2% | 3.8%(+6.44)#40 | 3.1%(+7.18)#2,449 |
| 41. | Campobello | 10.1% | 3.8%(+6.31)#41 | 3.1%(+7.05)#2,502 |
| 42. | Smyrna | 10.0% | 3.8%(+6.20)#42 | 3.1%(+6.93)#2,571 |
| 43. | Jonesville | 9.9% | 3.8%(+6.05)#43 | 3.1%(+6.79)#2,637 |
| 44. | Glendale | 9.8% | 3.8%(+6.01)#44 | 3.1%(+6.75)#2,663 |
| 45. | Vance | 9.8% | 3.8%(+6.00)#45 | 3.1%(+6.74)#2,670 |
| 46. | India Hook | 9.7% | 3.8%(+5.94)#46 | 3.1%(+6.67)#2,706 |
| 47. | Graniteville | 9.7% | 3.8%(+5.93)#47 | 3.1%(+6.67)#2,709 |
| 48. | Cheraw | 9.7% | 3.8%(+5.85)#48 | 3.1%(+6.59)#2,763 |
| 49. | Meggett | 9.5% | 3.8%(+5.65)#49 | 3.1%(+6.39)#2,863 |
| 50. | St Stephen | 9.4% | 3.8%(+5.63)#50 | 3.1%(+6.37)#2,873 |
| 51. | Iva | 9.4% | 3.8%(+5.63)#51 | 3.1%(+6.37)#2,874 |
| 52. | Alcolu | 9.4% | 3.8%(+5.63)#52 | 3.1%(+6.37)#2,876 |
| 53. | Ladson | 9.4% | 3.8%(+5.62)#53 | 3.1%(+6.36)#2,883 |
| 54. | Ruby | 9.0% | 3.8%(+5.15)#54 | 3.1%(+5.89)#3,150 |
| 55. | Gaston | 8.9% | 3.8%(+5.14)#55 | 3.1%(+5.87)#3,161 |
| 56. | Gray Court | 8.8% | 3.8%(+5.04)#56 | 3.1%(+5.78)#3,220 |
| 57. | Burton | 8.7% | 3.8%(+4.90)#57 | 3.1%(+5.64)#3,336 |
| 58. | Olanta | 8.7% | 3.8%(+4.85)#58 | 3.1%(+5.59)#3,382 |
| 59. | Kline | 8.6% | 3.8%(+4.77)#59 | 3.1%(+5.50)#3,446 |
| 60. | Modoc | 8.5% | 3.8%(+4.66)#60 | 3.1%(+5.40)#3,530 |
| 61. | Hemingway | 8.4% | 3.8%(+4.64)#61 | 3.1%(+5.37)#3,550 |
| 62. | Fairforest | 8.4% | 3.8%(+4.57)#62 | 3.1%(+5.31)#3,599 |
| 63. | Princeton | 8.3% | 3.8%(+4.53)#63 | 3.1%(+5.27)#3,649 |
| 64. | Lyman | 8.3% | 3.8%(+4.51)#64 | 3.1%(+5.25)#3,662 |
| 65. | Furman | 8.3% | 3.8%(+4.49)#65 | 3.1%(+5.23)#3,681 |
| 66. | Pelzer | 8.1% | 3.8%(+4.30)#66 | 3.1%(+5.04)#3,839 |
| 67. | Belvedere | 8.1% | 3.8%(+4.29)#67 | 3.1%(+5.02)#3,864 |
| 68. | Richburg | 8.0% | 3.8%(+4.22)#68 | 3.1%(+4.96)#3,913 |
| 69. | Union | 8.0% | 3.8%(+4.18)#69 | 3.1%(+4.92)#3,950 |
| 70. | North Hartsville | 7.9% | 3.8%(+4.07)#70 | 3.1%(+4.81)#4,043 |
| 71. | Wilkinson Heights | 7.8% | 3.8%(+4.01)#71 | 3.1%(+4.75)#4,090 |
| 72. | Cowpens | 7.8% | 3.8%(+4.00)#72 | 3.1%(+4.74)#4,102 |
| 73. | Lincolnville | 7.7% | 3.8%(+3.85)#73 | 3.1%(+4.59)#4,252 |
| 74. | Joanna | 7.7% | 3.8%(+3.85)#74 | 3.1%(+4.59)#4,254 |
| 75. | Fairfax | 7.6% | 3.8%(+3.80)#75 | 3.1%(+4.54)#4,316 |
| 76. | Chickasaw Point | 7.6% | 3.8%(+3.76)#76 | 3.1%(+4.50)#4,358 |
| 77. | Camp Croft | 7.5% | 3.8%(+3.74)#77 | 3.1%(+4.48)#4,381 |
| 78. | Landrum | 7.5% | 3.8%(+3.72)#78 | 3.1%(+4.45)#4,404 |
| 79. | Batesburg Leesville | 7.5% | 3.8%(+3.67)#79 | 3.1%(+4.40)#4,465 |
| 80. | Goose Creek | 7.4% | 3.8%(+3.61)#80 | 3.1%(+4.34)#4,510 |
| 81. | Gloverville | 7.4% | 3.8%(+3.58)#81 | 3.1%(+4.32)#4,532 |
| 82. | Lesslie | 7.3% | 3.8%(+3.52)#82 | 3.1%(+4.26)#4,615 |
| 83. | Blacksburg | 7.3% | 3.8%(+3.50)#83 | 3.1%(+4.24)#4,640 |
| 84. | Sharon | 7.3% | 3.8%(+3.49)#84 | 3.1%(+4.22)#4,652 |
| 85. | Homeland Park | 7.3% | 3.8%(+3.48)#85 | 3.1%(+4.21)#4,663 |
| 86. | Tatum | 7.1% | 3.8%(+3.34)#86 | 3.1%(+4.08)#4,836 |
| 87. | North | 7.1% | 3.8%(+3.30)#87 | 3.1%(+4.03)#4,889 |
| 88. | Calhoun Falls | 7.1% | 3.8%(+3.29)#88 | 3.1%(+4.03)#4,895 |
| 89. | Ulmer | 7.0% | 3.8%(+3.21)#89 | 3.1%(+3.95)#4,989 |
| 90. | Branchville | 6.9% | 3.8%(+3.14)#90 | 3.1%(+3.87)#5,059 |
| 91. | Mcconnells | 6.9% | 3.8%(+3.11)#91 | 3.1%(+3.85)#5,081 |
| 92. | Boykin | 6.9% | 3.8%(+3.06)#92 | 3.1%(+3.80)#5,159 |
| 93. | Mayo | 6.9% | 3.8%(+3.05)#93 | 3.1%(+3.79)#5,164 |
| 94. | Norris | 6.7% | 3.8%(+2.88)#94 | 3.1%(+3.62)#5,403 |
| 95. | Great Falls | 6.6% | 3.8%(+2.81)#95 | 3.1%(+3.55)#5,525 |
| 96. | Donalds | 6.6% | 3.8%(+2.76)#96 | 3.1%(+3.50)#5,594 |
| 97. | Burnettown | 6.6% | 3.8%(+2.75)#97 | 3.1%(+3.49)#5,614 |
| 98. | East Gaffney | 6.5% | 3.8%(+2.68)#98 | 3.1%(+3.42)#5,714 |
| 99. | Golden Grove | 6.5% | 3.8%(+2.66)#99 | 3.1%(+3.39)#5,749 |
| 100. | Kershaw | 6.4% | 3.8%(+2.59)#100 | 3.1%(+3.33)#5,831 |
Common Questions
What are the Top 10 Cities with the Highest Percentage of Population Employed in Installation, Maintenance & Repair in South Carolina?
Top 10 Cities with the Highest Percentage of Population Employed in Installation, Maintenance & Repair in South Carolina are:
#1
100.0%
#2
49.2%
#3
35.0%
#4
33.3%
#5
23.1%
#6
20.7%
#7
19.2%
#8
19.1%
#9
17.9%
#10
15.4%
What city has the Highest Percentage of Population Employed in Installation, Maintenance & Repair in South Carolina?
Russellville has the Highest Percentage of Population Employed in Installation, Maintenance & Repair in South Carolina with 100.0%.
What is the Percentage of Population Employed in Installation, Maintenance & Repair in the State of South Carolina?
Percentage of Population Employed in Installation, Maintenance & Repair in South Carolina is 3.8%.
What is the Percentage of Population Employed in Installation, Maintenance & Repair in the United States?
Percentage of Population Employed in Installation, Maintenance & Repair in the United States is 3.1%.