Stonyford, CA Map & Demographics
Stonyford Map
Stonyford Overview
$34,052
PER CAPITA INCOME
0.48
INEQUALITY / GINI INDEX
82
TOTAL POPULATION
57
MALE POPULATION
25
FEMALE POPULATION
228.00
MALES / 100 FEMALES
43.86
FEMALES / 100 MALES
54.7
MEDIAN AGE
2.1
AVG FAMILY SIZE
1.8
AVG HOUSEHOLD SIZE
16
LABOR FORCE [ PEOPLE ]
20.8%
PERCENT IN LABOR FORCE
25.0%
UNEMPLOYMENT RATE
Stonyford Zip Codes
Stonyford Area Codes
Income in Stonyford
Income Overview in Stonyford
| Characteristic | Number | Measure |
| Per Capita Income | 82 | $34,052 |
| Median Family Income | 30 | $0 |
| Mean Family Income | 30 | $81,330 |
| Median Household Income | 44 | $0 |
| Mean Household Income | 44 | $60,864 |
| Income Deficit | 30 | $0 |
| Wage / Income Gap (%) | 82 | 0.00% |
| Wage / Income Gap ($) | 82 | 100.00¢ per $1 |
| Gini / Inequality Index | 82 | 0.48 |
Earnings by Sex in Stonyford
| Sex | Number | Average Earnings |
| Male | 15 (100.0%) | $0 |
| Female | 0 (0.0%) | $0 |
| Total | 15 (100.0%) | $0 |
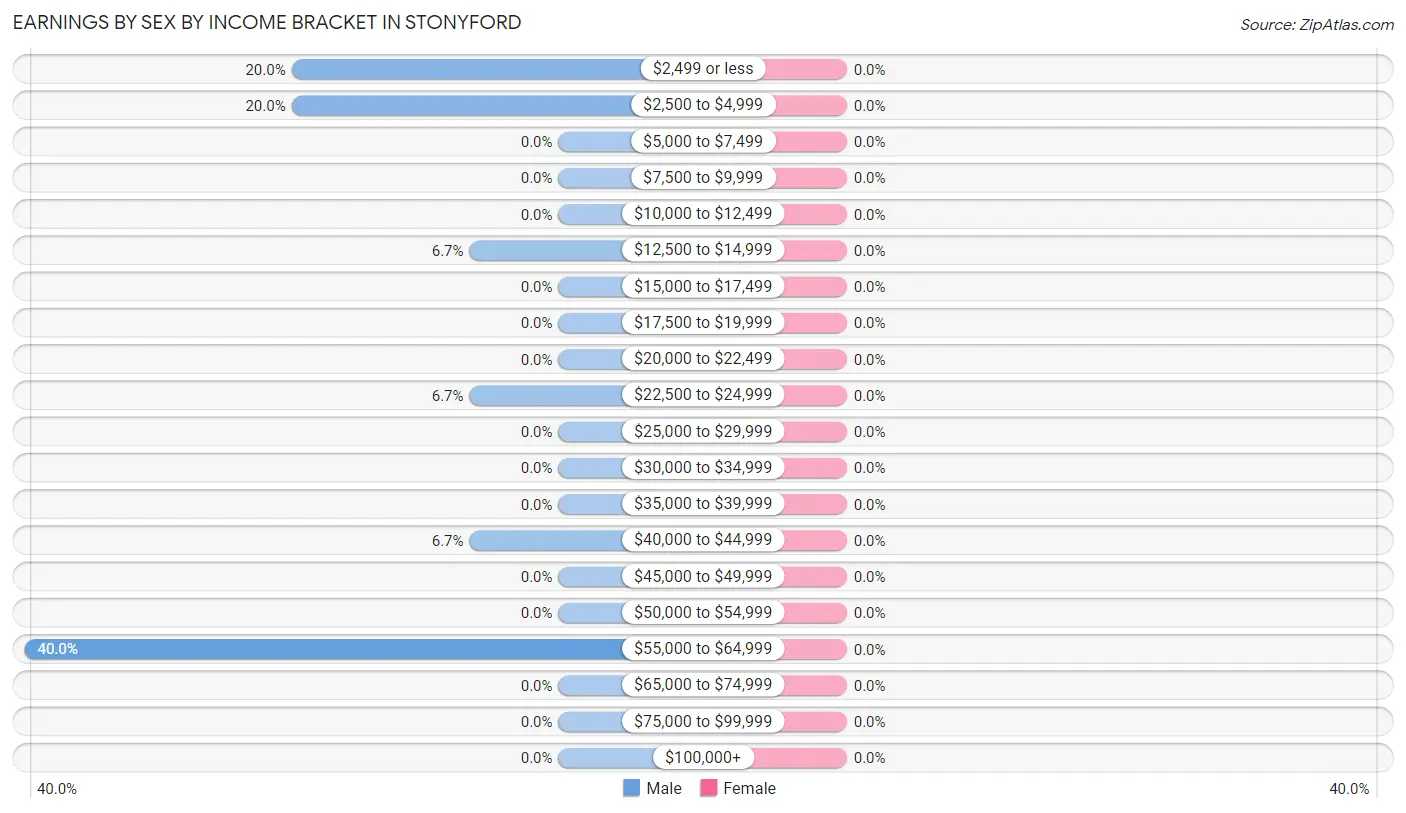
Earnings by Sex by Income Bracket in Stonyford
| Income | Male | Female |
| $2,499 or less | 3 (20.0%) | 0 (0.0%) |
| $2,500 to $4,999 | 3 (20.0%) | 0 (0.0%) |
| $5,000 to $7,499 | 0 (0.0%) | 0 (0.0%) |
| $7,500 to $9,999 | 0 (0.0%) | 0 (0.0%) |
| $10,000 to $12,499 | 0 (0.0%) | 0 (0.0%) |
| $12,500 to $14,999 | 1 (6.7%) | 0 (0.0%) |
| $15,000 to $17,499 | 0 (0.0%) | 0 (0.0%) |
| $17,500 to $19,999 | 0 (0.0%) | 0 (0.0%) |
| $20,000 to $22,499 | 0 (0.0%) | 0 (0.0%) |
| $22,500 to $24,999 | 1 (6.7%) | 0 (0.0%) |
| $25,000 to $29,999 | 0 (0.0%) | 0 (0.0%) |
| $30,000 to $34,999 | 0 (0.0%) | 0 (0.0%) |
| $35,000 to $39,999 | 0 (0.0%) | 0 (0.0%) |
| $40,000 to $44,999 | 1 (6.7%) | 0 (0.0%) |
| $45,000 to $49,999 | 0 (0.0%) | 0 (0.0%) |
| $50,000 to $54,999 | 0 (0.0%) | 0 (0.0%) |
| $55,000 to $64,999 | 6 (40.0%) | 0 (0.0%) |
| $65,000 to $74,999 | 0 (0.0%) | 0 (0.0%) |
| $75,000 to $99,999 | 0 (0.0%) | 0 (0.0%) |
| $100,000+ | 0 (0.0%) | 0 (0.0%) |
| Total | 15 (100.0%) | 0 (0.0%) |
Earnings by Sex by Educational Attainment in Stonyford
| Educational Attainment | Male Income | Female Income |
| Less than High School | - | - |
| High School Diploma | - | - |
| College or Associate's Degree | - | - |
| Bachelor's Degree | - | - |
| Graduate Degree | - | - |
| Total | - | - |
Family Income in Stonyford
Family Income Brackets in Stonyford
According to the Stonyford family income data, there are 13 families falling into the $100,000 to $149,999 income range, which is the most common income bracket and makes up 43.3% of all families.
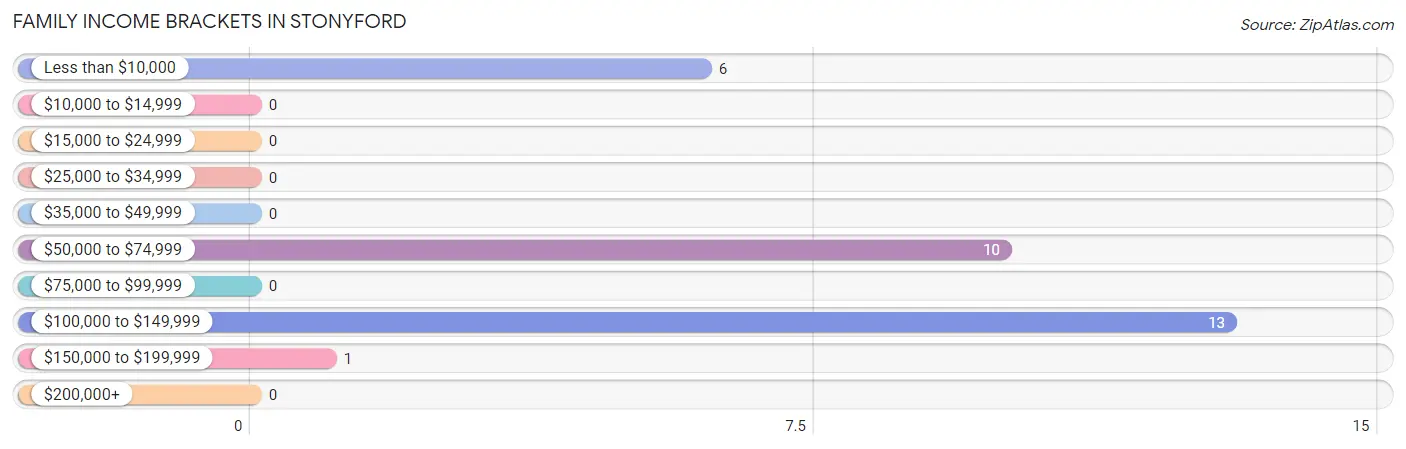
| Income Bracket | # Families | % Families |
| Less than $10,000 | 6 | 20.0% |
| $10,000 to $14,999 | 0 | 0.0% |
| $15,000 to $24,999 | 0 | 0.0% |
| $25,000 to $34,999 | 0 | 0.0% |
| $35,000 to $49,999 | 0 | 0.0% |
| $50,000 to $74,999 | 10 | 33.3% |
| $75,000 to $99,999 | 0 | 0.0% |
| $100,000 to $149,999 | 13 | 43.3% |
| $150,000 to $199,999 | 1 | 3.3% |
| $200,000+ | 0 | 0.0% |
Family Income by Famaliy Size in Stonyford
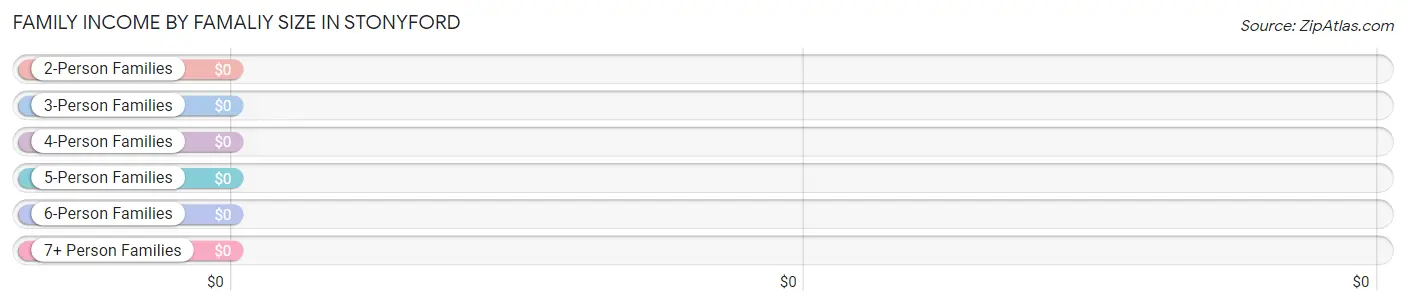
| Income Bracket | # Families | Median Income |
| 2-Person Families | 25 (83.3%) | $0 |
| 3-Person Families | 1 (3.3%) | $0 |
| 4-Person Families | 4 (13.3%) | $0 |
| 5-Person Families | 0 (0.0%) | $0 |
| 6-Person Families | 0 (0.0%) | $0 |
| 7+ Person Families | 0 (0.0%) | $0 |
| Total | 30 (100.0%) | $0 |
Family Income by Number of Earners in Stonyford
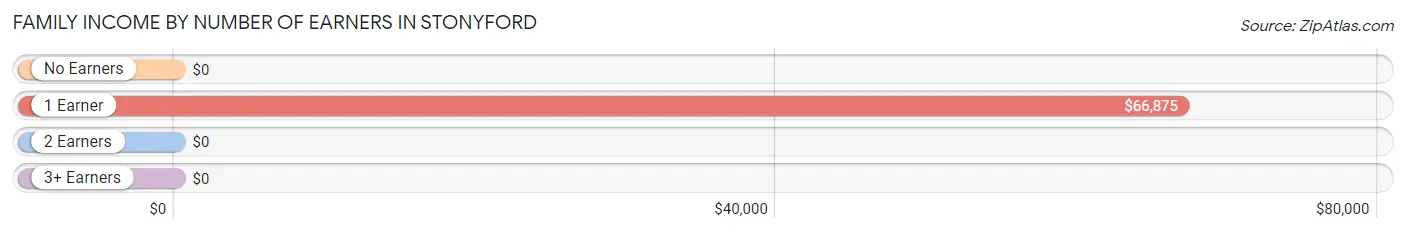
| Number of Earners | # Families | Median Income |
| No Earners | 20 (66.7%) | $0 |
| 1 Earner | 10 (33.3%) | $66,875 |
| 2 Earners | 0 (0.0%) | $0 |
| 3+ Earners | 0 (0.0%) | $0 |
| Total | 30 (100.0%) | $0 |
Household Income in Stonyford
Household Income Brackets in Stonyford
With 13 households falling in the category, the $100,000 to $149,999 income range is the most frequent in Stonyford, accounting for 29.5% of all households.
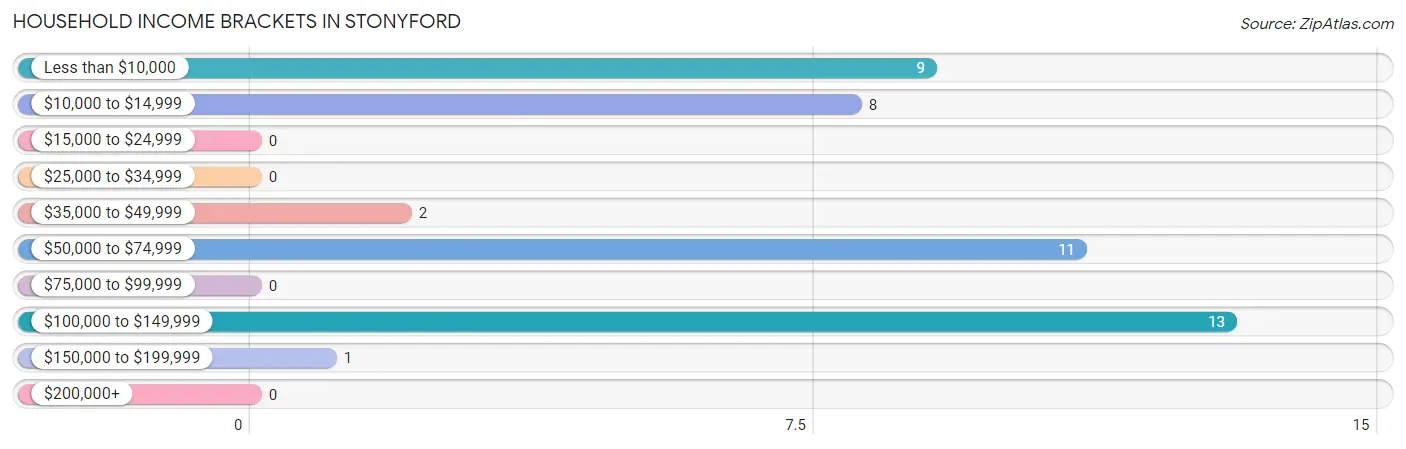
| Income Bracket | # Households | % Households |
| Less than $10,000 | 9 | 20.5% |
| $10,000 to $14,999 | 8 | 18.2% |
| $15,000 to $24,999 | 0 | 0.0% |
| $25,000 to $34,999 | 0 | 0.0% |
| $35,000 to $49,999 | 2 | 4.5% |
| $50,000 to $74,999 | 11 | 25.0% |
| $75,000 to $99,999 | 0 | 0.0% |
| $100,000 to $149,999 | 13 | 29.5% |
| $150,000 to $199,999 | 1 | 2.3% |
| $200,000+ | 0 | 0.0% |
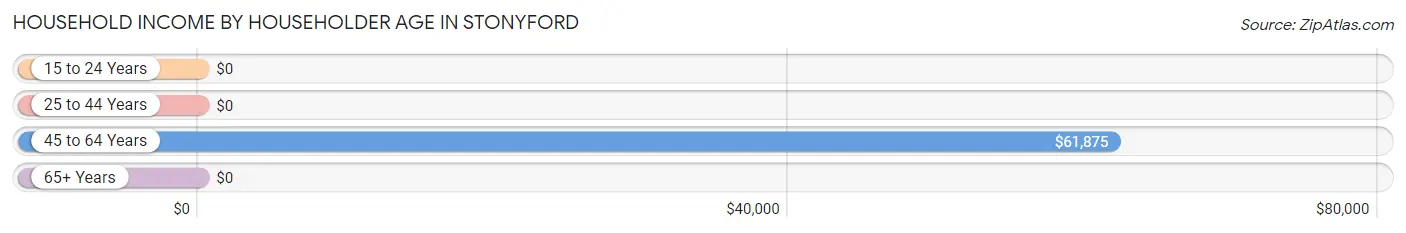
Household Income by Householder Age in Stonyford
The median household income in Stonyford is $0, with the highest median household income of $61,875 found in the 45 to 64 years age bracket for the primary householder. A total of 15 households (34.1%) fall into this category.
| Income Bracket | # Households | Median Income |
| 15 to 24 Years | 0 (0.0%) | $0 |
| 25 to 44 Years | 5 (11.4%) | $0 |
| 45 to 64 Years | 15 (34.1%) | $61,875 |
| 65+ Years | 24 (54.5%) | $0 |
| Total | 44 (100.0%) | $0 |
Poverty in Stonyford
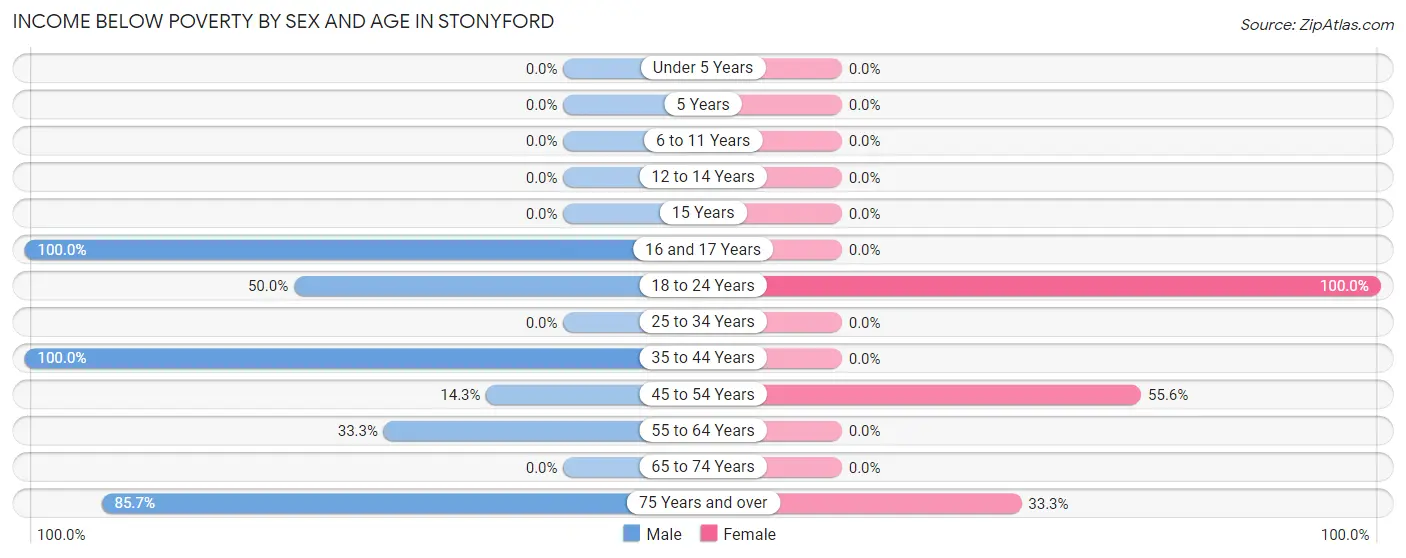
Income Below Poverty by Sex and Age in Stonyford
With 36.8% poverty level for males and 28.0% for females among the residents of Stonyford, 16 and 17 year old males and 18 to 24 year old females are the most vulnerable to poverty, with 6 males (100.0%) and 1 females (100.0%) in their respective age groups living below the poverty level.
| Age Bracket | Male | Female |
| Under 5 Years | 0 (0.0%) | 0 (0.0%) |
| 5 Years | 0 (0.0%) | 0 (0.0%) |
| 6 to 11 Years | 0 (0.0%) | 0 (0.0%) |
| 12 to 14 Years | 0 (0.0%) | 0 (0.0%) |
| 15 Years | 0 (0.0%) | 0 (0.0%) |
| 16 and 17 Years | 6 (100.0%) | 0 (0.0%) |
| 18 to 24 Years | 1 (50.0%) | 1 (100.0%) |
| 25 to 34 Years | 0 (0.0%) | 0 (0.0%) |
| 35 to 44 Years | 5 (100.0%) | 0 (0.0%) |
| 45 to 54 Years | 2 (14.3%) | 5 (55.6%) |
| 55 to 64 Years | 1 (33.3%) | 0 (0.0%) |
| 65 to 74 Years | 0 (0.0%) | 0 (0.0%) |
| 75 Years and over | 6 (85.7%) | 1 (33.3%) |
| Total | 21 (36.8%) | 7 (28.0%) |
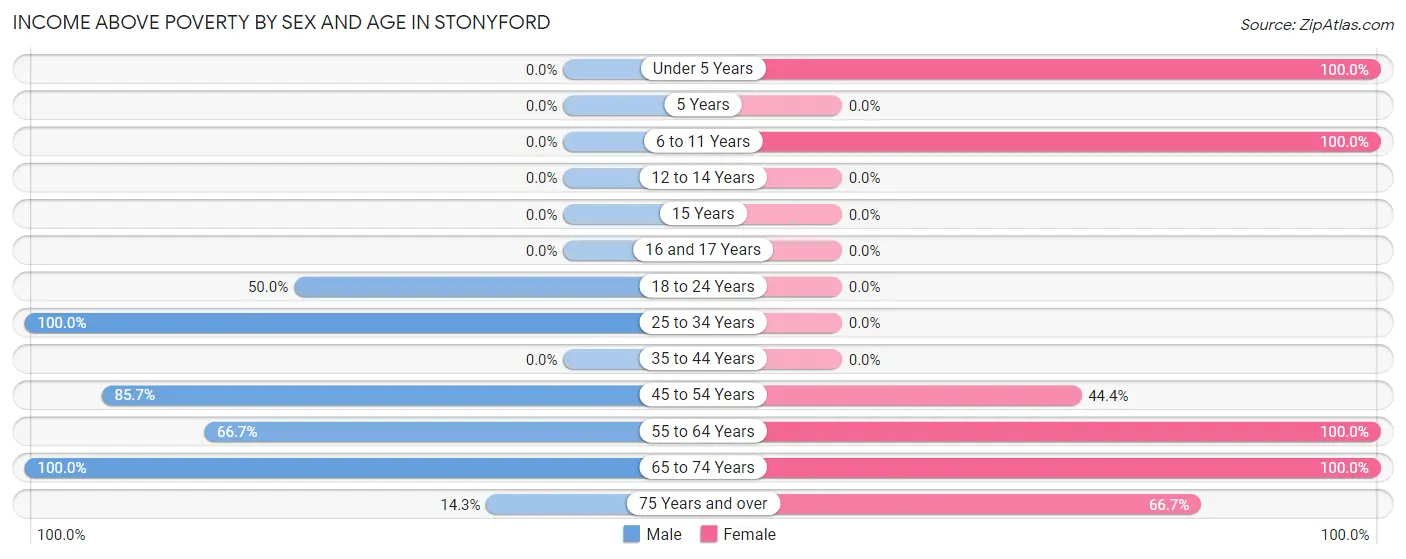
Income Above Poverty by Sex and Age in Stonyford
According to the poverty statistics in Stonyford, males aged 25 to 34 years and females aged under 5 years are the age groups that are most secure financially, with 100.0% of males and 100.0% of females in these age groups living above the poverty line.
| Age Bracket | Male | Female |
| Under 5 Years | 0 (0.0%) | 2 (100.0%) |
| 5 Years | 0 (0.0%) | 0 (0.0%) |
| 6 to 11 Years | 0 (0.0%) | 3 (100.0%) |
| 12 to 14 Years | 0 (0.0%) | 0 (0.0%) |
| 15 Years | 0 (0.0%) | 0 (0.0%) |
| 16 and 17 Years | 0 (0.0%) | 0 (0.0%) |
| 18 to 24 Years | 1 (50.0%) | 0 (0.0%) |
| 25 to 34 Years | 1 (100.0%) | 0 (0.0%) |
| 35 to 44 Years | 0 (0.0%) | 0 (0.0%) |
| 45 to 54 Years | 12 (85.7%) | 4 (44.4%) |
| 55 to 64 Years | 2 (66.7%) | 5 (100.0%) |
| 65 to 74 Years | 19 (100.0%) | 2 (100.0%) |
| 75 Years and over | 1 (14.3%) | 2 (66.7%) |
| Total | 36 (63.2%) | 18 (72.0%) |
Income Below Poverty Among Married-Couple Families in Stonyford
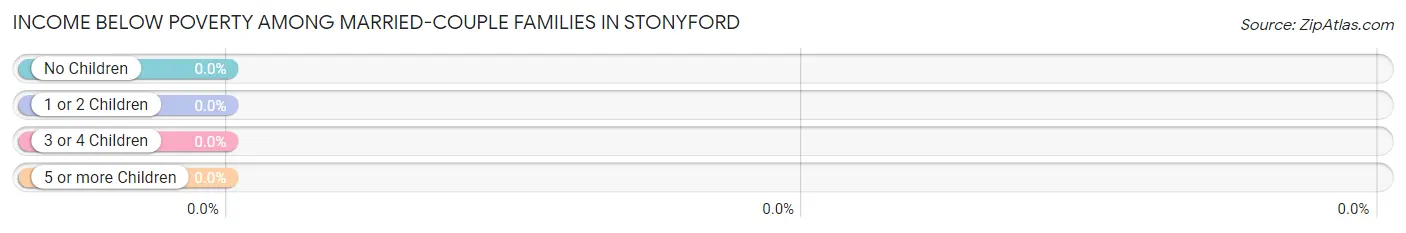
| Children | Above Poverty | Below Poverty |
| No Children | 10 (100.0%) | 0 (0.0%) |
| 1 or 2 Children | 4 (100.0%) | 0 (0.0%) |
| 3 or 4 Children | 0 (0.0%) | 0 (0.0%) |
| 5 or more Children | 0 (0.0%) | 0 (0.0%) |
| Total | 14 (100.0%) | 0 (0.0%) |
Income Below Poverty Among Single-Parent Households in Stonyford
According to the poverty data in Stonyford, 33.3% or 5 single-father households and 100.0% or 1 single-mother households are living below the poverty line. Among single-father households, those with 1 or 2 children have the highest poverty rate, with 5 households (100.0%) experiencing poverty. Likewise, among single-mother households, those with no children have the highest poverty rate, with 1 households (100.0%) falling below the poverty line.
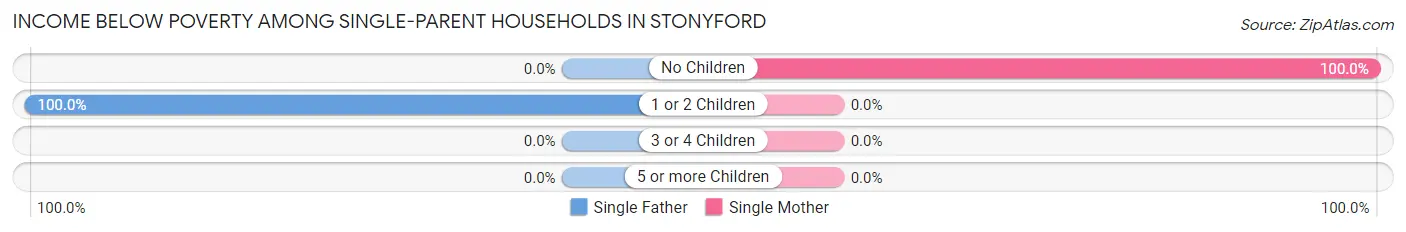
| Children | Single Father | Single Mother |
| No Children | 0 (0.0%) | 1 (100.0%) |
| 1 or 2 Children | 5 (100.0%) | 0 (0.0%) |
| 3 or 4 Children | 0 (0.0%) | 0 (0.0%) |
| 5 or more Children | 0 (0.0%) | 0 (0.0%) |
| Total | 5 (33.3%) | 1 (100.0%) |
Income Below Poverty Among Married-Couple vs Single-Parent Households in Stonyford
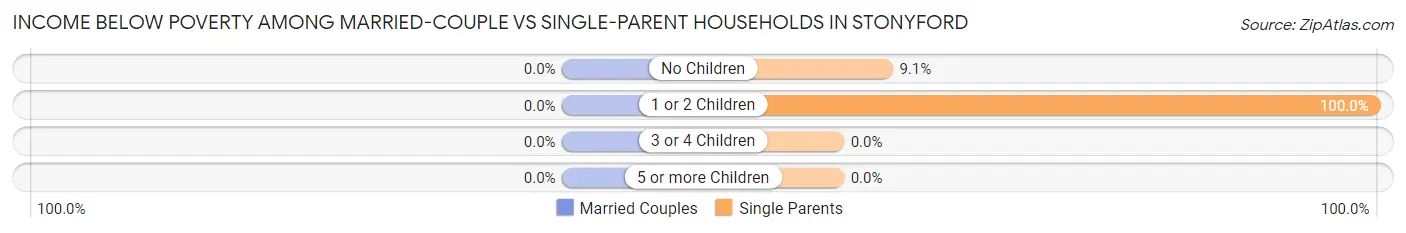
| Children | Married-Couple Families | Single-Parent Households |
| No Children | 0 (0.0%) | 1 (9.1%) |
| 1 or 2 Children | 0 (0.0%) | 5 (100.0%) |
| 3 or 4 Children | 0 (0.0%) | 0 (0.0%) |
| 5 or more Children | 0 (0.0%) | 0 (0.0%) |
| Total | 0 (0.0%) | 6 (37.5%) |
Race in Stonyford
The most populous races in Stonyford are White / Caucasian (67 | 81.7%), Two or more Races (10 | 12.2%), and Hispanic or Latino (9 | 11.0%).
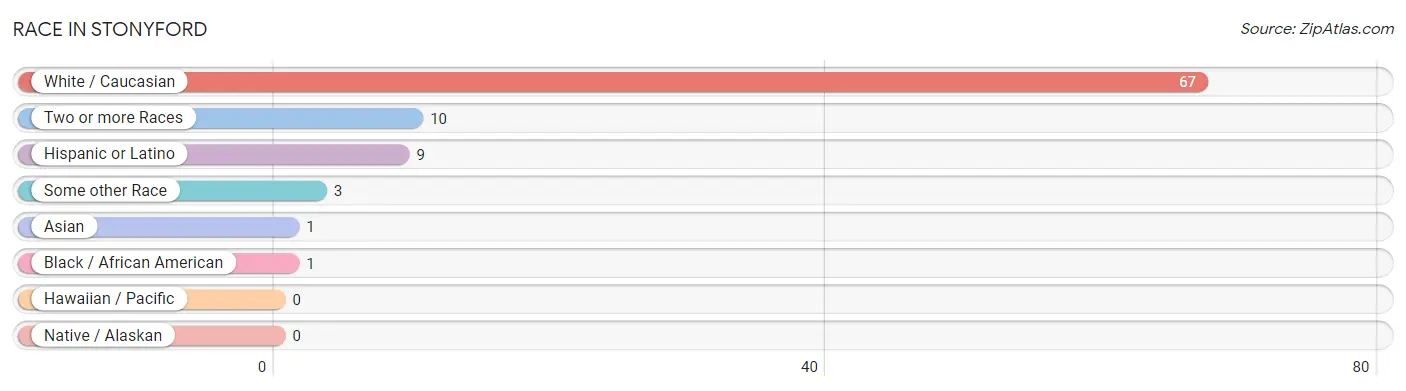
| Race | # Population | % Population |
| Asian | 1 | 1.2% |
| Black / African American | 1 | 1.2% |
| Hawaiian / Pacific | 0 | 0.0% |
| Hispanic or Latino | 9 | 11.0% |
| Native / Alaskan | 0 | 0.0% |
| White / Caucasian | 67 | 81.7% |
| Two or more Races | 10 | 12.2% |
| Some other Race | 3 | 3.7% |
| Total | 82 | 100.0% |
Ancestry in Stonyford
The most populous ancestries reported in Stonyford are German (20 | 24.4%), English (16 | 19.5%), Scotch-Irish (12 | 14.6%), Mexican (9 | 11.0%), and Dutch (6 | 7.3%), together accounting for 76.8% of all Stonyford residents.
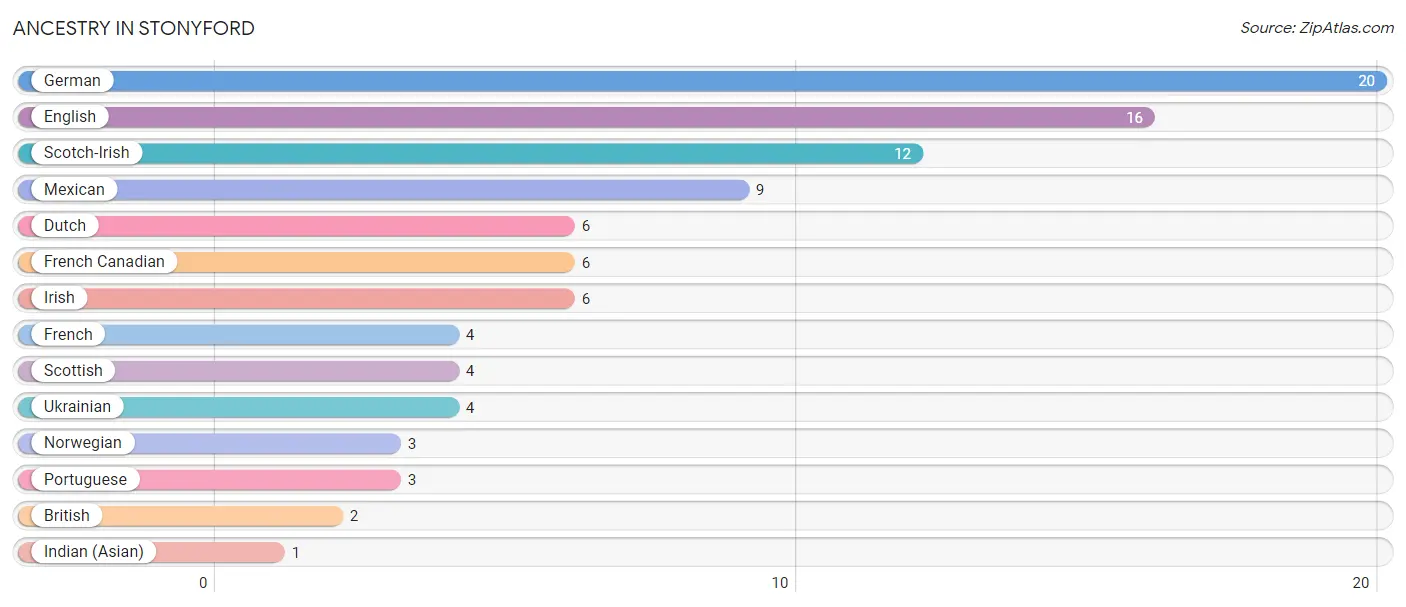
| Ancestry | # Population | % Population |
| British | 2 | 2.4% |
| Dutch | 6 | 7.3% |
| English | 16 | 19.5% |
| French | 4 | 4.9% |
| French Canadian | 6 | 7.3% |
| German | 20 | 24.4% |
| Indian (Asian) | 1 | 1.2% |
| Irish | 6 | 7.3% |
| Mexican | 9 | 11.0% |
| Norwegian | 3 | 3.7% |
| Portuguese | 3 | 3.7% |
| Scotch-Irish | 12 | 14.6% |
| Scottish | 4 | 4.9% |
| Ukrainian | 4 | 4.9% | View All 14 Rows |
Immigrants in Stonyford
The most numerous immigrant groups reported in Stonyford came from Asia (1 | 1.2%), Central America (1 | 1.2%), China (1 | 1.2%), Eastern Asia (1 | 1.2%), and Latin America (1 | 1.2%), together accounting for 6.1% of all Stonyford residents.
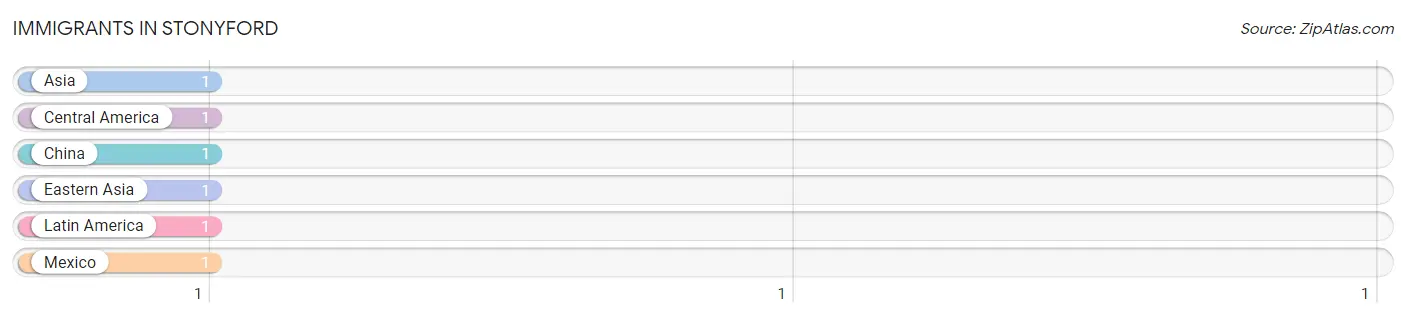
| Immigration Origin | # Population | % Population |
| Asia | 1 | 1.2% |
| Central America | 1 | 1.2% |
| China | 1 | 1.2% |
| Eastern Asia | 1 | 1.2% |
| Latin America | 1 | 1.2% |
| Mexico | 1 | 1.2% | View All 6 Rows |
Sex and Age in Stonyford
Sex and Age in Stonyford
The most populous age groups in Stonyford are 70 to 74 Years (14 | 24.6%) for men and 50 to 54 Years (5 | 20.0%) for women.
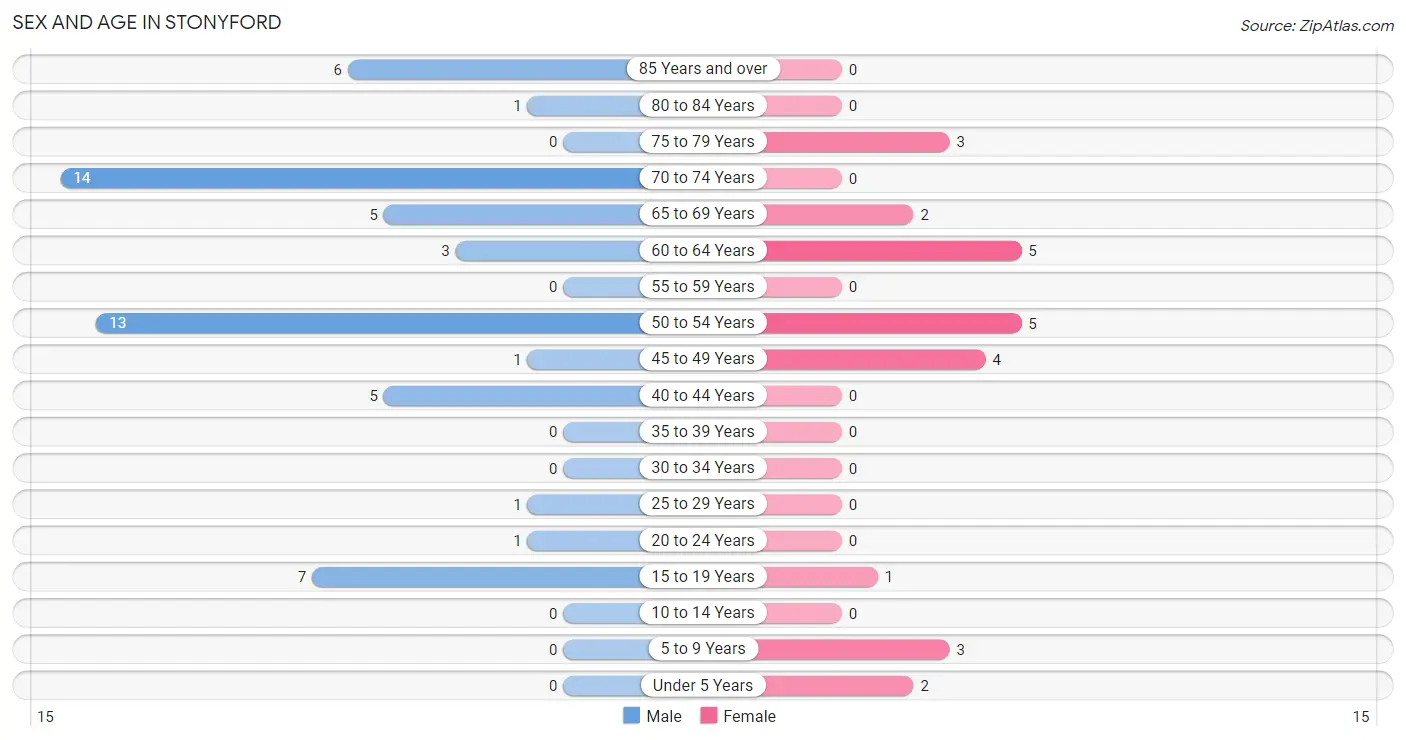
| Age Bracket | Male | Female |
| Under 5 Years | 0 (0.0%) | 2 (8.0%) |
| 5 to 9 Years | 0 (0.0%) | 3 (12.0%) |
| 10 to 14 Years | 0 (0.0%) | 0 (0.0%) |
| 15 to 19 Years | 7 (12.3%) | 1 (4.0%) |
| 20 to 24 Years | 1 (1.8%) | 0 (0.0%) |
| 25 to 29 Years | 1 (1.8%) | 0 (0.0%) |
| 30 to 34 Years | 0 (0.0%) | 0 (0.0%) |
| 35 to 39 Years | 0 (0.0%) | 0 (0.0%) |
| 40 to 44 Years | 5 (8.8%) | 0 (0.0%) |
| 45 to 49 Years | 1 (1.8%) | 4 (16.0%) |
| 50 to 54 Years | 13 (22.8%) | 5 (20.0%) |
| 55 to 59 Years | 0 (0.0%) | 0 (0.0%) |
| 60 to 64 Years | 3 (5.3%) | 5 (20.0%) |
| 65 to 69 Years | 5 (8.8%) | 2 (8.0%) |
| 70 to 74 Years | 14 (24.6%) | 0 (0.0%) |
| 75 to 79 Years | 0 (0.0%) | 3 (12.0%) |
| 80 to 84 Years | 1 (1.8%) | 0 (0.0%) |
| 85 Years and over | 6 (10.5%) | 0 (0.0%) |
| Total | 57 (100.0%) | 25 (100.0%) |
Families and Households in Stonyford
Median Family Size in Stonyford
The median family size in Stonyford is 2.10 persons per family, with single female/mother families (1 | 3.3%) accounting for the largest median family size of 3 persons per family. On the other hand, single male/father families (15 | 50.0%) represent the smallest median family size with 1.80 persons per family.
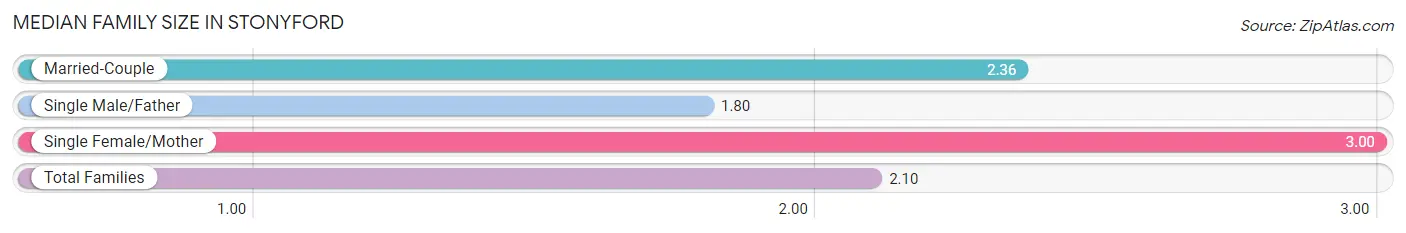
| Family Type | # Families | Family Size |
| Married-Couple | 14 (46.7%) | 2.36 |
| Single Male/Father | 15 (50.0%) | 1.80 |
| Single Female/Mother | 1 (3.3%) | 3.00 |
| Total Families | 30 (100.0%) | 2.10 |
Median Household Size in Stonyford
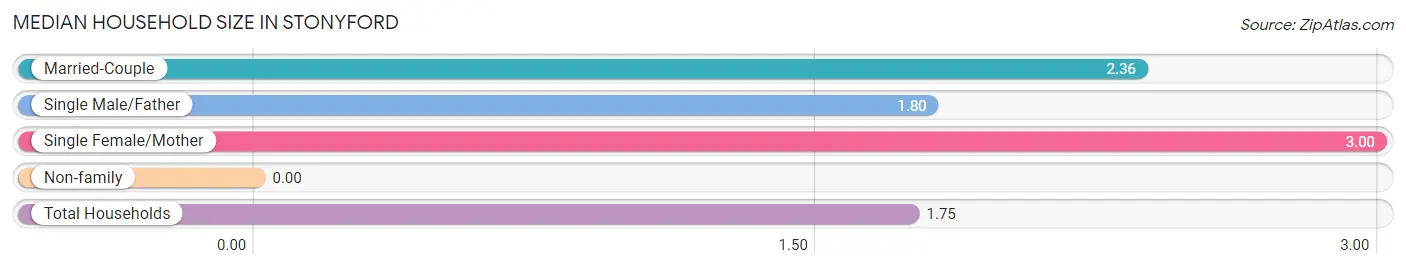
| Household Type | # Households | Household Size |
| Married-Couple | 14 (31.8%) | 2.36 |
| Single Male/Father | 15 (34.1%) | 1.80 |
| Single Female/Mother | 1 (2.3%) | 3.00 |
| Non-family | 14 (31.8%) | - |
| Total Households | 44 (100.0%) | 1.75 |
Household Size by Marriage Status in Stonyford
Out of a total of 44 households in Stonyford, 30 (68.2%) are family households, while 14 (31.8%) are nonfamily households. The most numerous type of family households are 2-person households, comprising 25, and the most common type of nonfamily households are 1-person households, comprising 14.
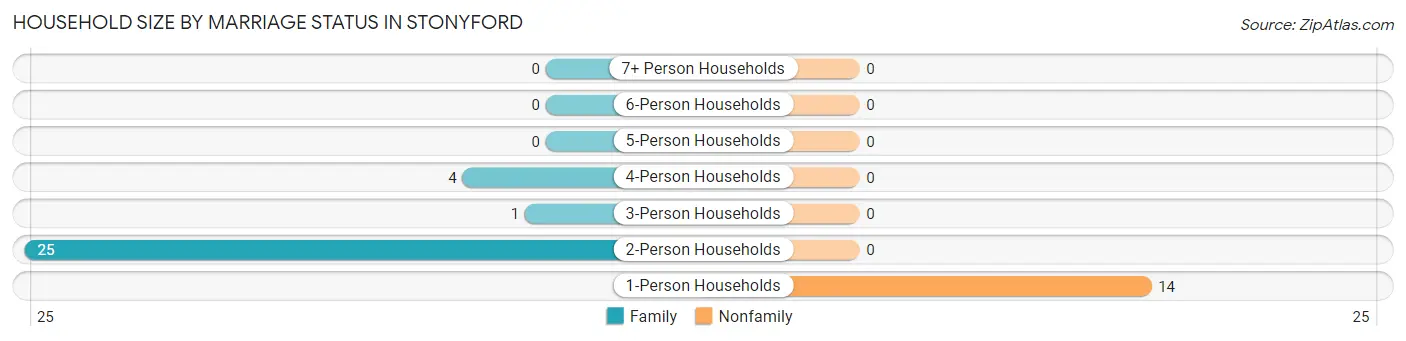
| Household Size | Family Households | Nonfamily Households |
| 1-Person Households | - | 14 (31.8%) |
| 2-Person Households | 25 (56.8%) | 0 (0.0%) |
| 3-Person Households | 1 (2.3%) | 0 (0.0%) |
| 4-Person Households | 4 (9.1%) | 0 (0.0%) |
| 5-Person Households | 0 (0.0%) | 0 (0.0%) |
| 6-Person Households | 0 (0.0%) | 0 (0.0%) |
| 7+ Person Households | 0 (0.0%) | 0 (0.0%) |
| Total | 30 (68.2%) | 14 (31.8%) |
Female Fertility in Stonyford
Fertility by Age in Stonyford
| Age Bracket | Women with Births | Births / 1,000 Women |
| 15 to 19 years | 0 (0.0%) | 0.0 |
| 20 to 34 years | 0 (0.0%) | 0.0 |
| 35 to 50 years | 0 (0.0%) | 0.0 |
| Total | 0 (0.0%) | 0.0 |
Fertility by Age by Marriage Status in Stonyford
| Age Bracket | Married | Unmarried |
| 15 to 19 years | 0 (0.0%) | 0 (0.0%) |
| 20 to 34 years | 0 (0.0%) | 0 (0.0%) |
| 35 to 50 years | 0 (0.0%) | 0 (0.0%) |
| Total | 0 (0.0%) | 0 (0.0%) |
Fertility by Education in Stonyford
| Educational Attainment | Women with Births | Births / 1,000 Women |
| Less than High School | 0 (0.0%) | 0.0 |
| High School Diploma | 0 (0.0%) | 0.0 |
| College or Associate's Degree | 0 (0.0%) | 0.0 |
| Bachelor's Degree | 0 (0.0%) | 0.0 |
| Graduate Degree | 0 (0.0%) | 0.0 |
| Total | 0 (0.0%) | 0.0 |
Fertility by Education by Marriage Status in Stonyford
| Educational Attainment | Married | Unmarried |
| Less than High School | 0 (0.0%) | 0 (0.0%) |
| High School Diploma | 0 (0.0%) | 0 (0.0%) |
| College or Associate's Degree | 0 (0.0%) | 0 (0.0%) |
| Bachelor's Degree | 0 (0.0%) | 0 (0.0%) |
| Graduate Degree | 0 (0.0%) | 0 (0.0%) |
| Total | 0 (0.0%) | 0 (0.0%) |
Employment Characteristics in Stonyford
Employment by Class of Employer in Stonyford
Among the 12 employed individuals in Stonyford, private company employees (8 | 66.7%), self-employed (not incorporated) (2 | 16.7%), and not-for-profit organizations (1 | 8.3%) make up the most common classes of employment.
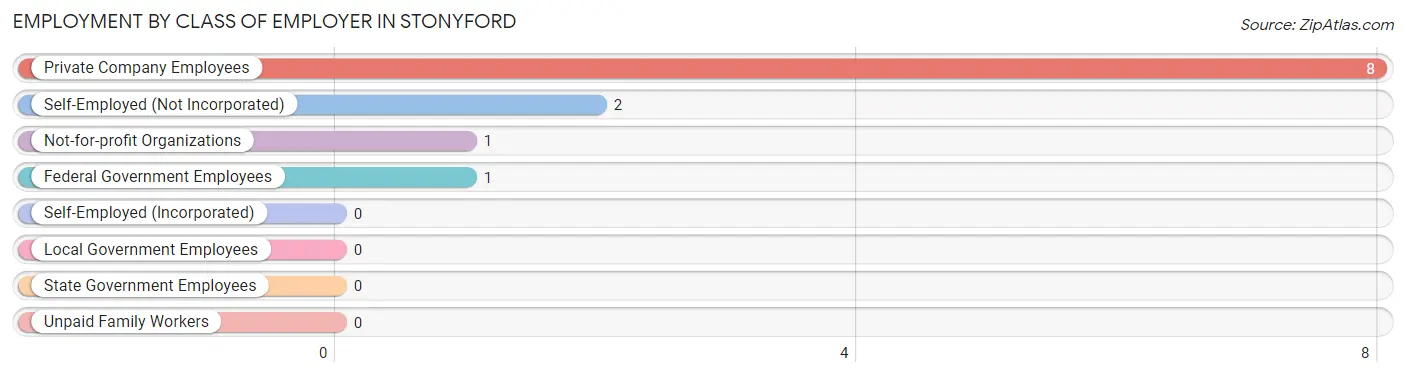
| Employer Class | # Employees | % Employees |
| Private Company Employees | 8 | 66.7% |
| Self-Employed (Incorporated) | 0 | 0.0% |
| Self-Employed (Not Incorporated) | 2 | 16.7% |
| Not-for-profit Organizations | 1 | 8.3% |
| Local Government Employees | 0 | 0.0% |
| State Government Employees | 0 | 0.0% |
| Federal Government Employees | 1 | 8.3% |
| Unpaid Family Workers | 0 | 0.0% |
| Total | 12 | 100.0% |
Employment Status by Age in Stonyford
According to the labor force statistics for Stonyford, out of the total population over 16 years of age (77), 20.8% or 16 individuals are in the labor force, with 25.0% or 4 of them unemployed. The age group with the highest labor force participation rate is 20 to 24 years, with 100.0% or 1 individuals in the labor force. Within the labor force, the 45 to 54 years age range has the highest percentage of unemployed individuals, with 40.0% or 4 of them being unemployed.
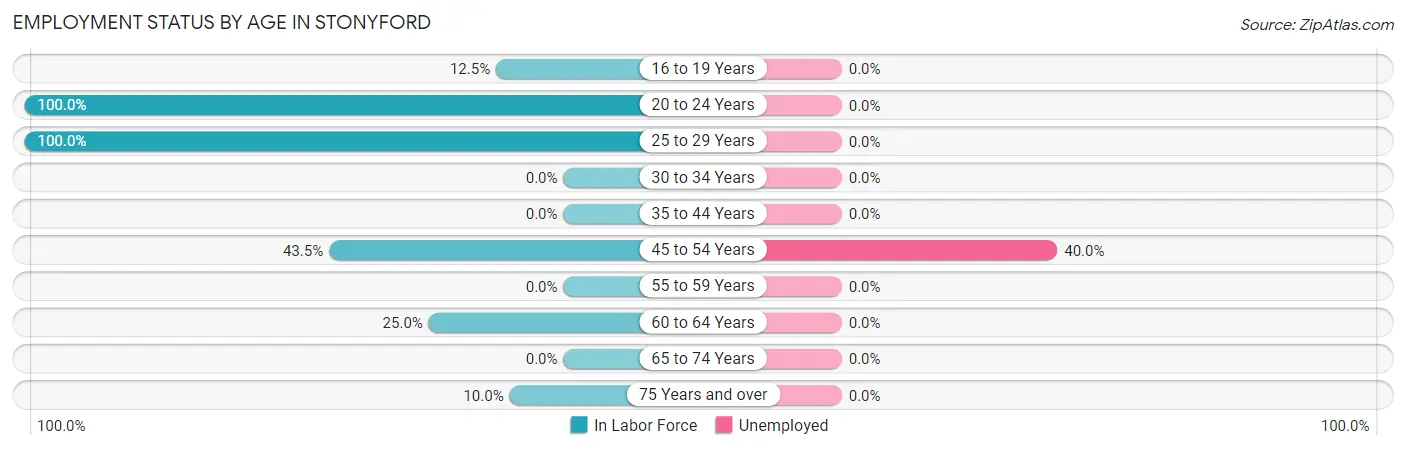
| Age Bracket | In Labor Force | Unemployed |
| 16 to 19 Years | 1 (12.5%) | 0 (0.0%) |
| 20 to 24 Years | 1 (100.0%) | 0 (0.0%) |
| 25 to 29 Years | 1 (100.0%) | 0 (0.0%) |
| 30 to 34 Years | 0 (0.0%) | 0 (0.0%) |
| 35 to 44 Years | 0 (0.0%) | 0 (0.0%) |
| 45 to 54 Years | 10 (43.5%) | 4 (40.0%) |
| 55 to 59 Years | 0 (0.0%) | 0 (0.0%) |
| 60 to 64 Years | 2 (25.0%) | 0 (0.0%) |
| 65 to 74 Years | 0 (0.0%) | 0 (0.0%) |
| 75 Years and over | 1 (10.0%) | 0 (0.0%) |
| Total | 16 (20.8%) | 4 (25.0%) |
Employment Status by Educational Attainment in Stonyford
According to labor force statistics for Stonyford, 35.1% of individuals (13) out of the total population between 25 and 64 years of age (37) are in the labor force, with 30.8% or 4 of them being unemployed. The group with the highest labor force participation rate are those with the educational attainment of college / associate degree, with 50.0% or 10 individuals in the labor force. Within the labor force, individuals with college / associate degree education have the highest percentage of unemployment, with 40.0% or 4 of them being unemployed.
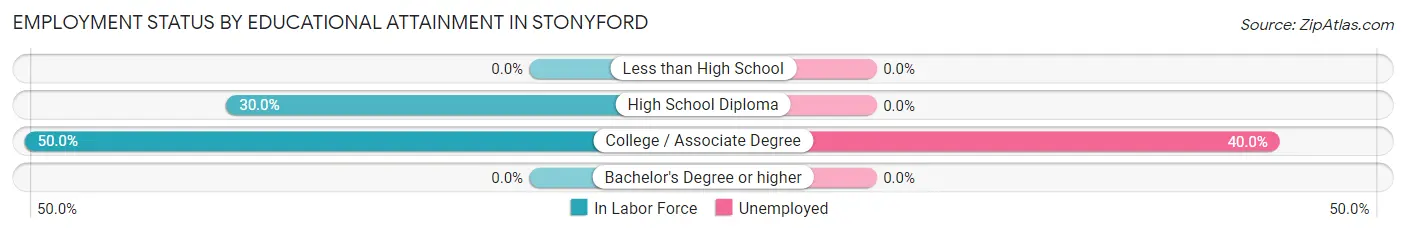
| Educational Attainment | In Labor Force | Unemployed |
| Less than High School | 0 (0.0%) | 0 (0.0%) |
| High School Diploma | 3 (30.0%) | 0 (0.0%) |
| College / Associate Degree | 10 (50.0%) | 8 (40.0%) |
| Bachelor's Degree or higher | 0 (0.0%) | 0 (0.0%) |
| Total | 13 (35.1%) | 11 (30.8%) |
Employment Occupations by Sex in Stonyford
Management, Business, Science and Arts Occupations
Management, Business, Science and Arts Occupations by Sex
| Occupation | Male | Female |
| Management | 0 (0.0%) | 0 (0.0%) |
| Business & Financial | 0 (0.0%) | 0 (0.0%) |
| Computers, Engineering & Science | 0 (0.0%) | 0 (0.0%) |
| Computers & Mathematics | 0 (0.0%) | 0 (0.0%) |
| Architecture & Engineering | 0 (0.0%) | 0 (0.0%) |
| Life, Physical & Social Science | 0 (0.0%) | 0 (0.0%) |
| Community & Social Service | 0 (0.0%) | 0 (0.0%) |
| Education, Arts & Media | 0 (0.0%) | 0 (0.0%) |
| Legal Services & Support | 0 (0.0%) | 0 (0.0%) |
| Education Instruction & Library | 0 (0.0%) | 0 (0.0%) |
| Arts, Media & Entertainment | 0 (0.0%) | 0 (0.0%) |
| Health Diagnosing & Treating | 0 (0.0%) | 0 (0.0%) |
| Health Technologists | 0 (0.0%) | 0 (0.0%) |
| Total (Category) | 0 (0.0%) | 0 (0.0%) |
| Total (Overall) | 12 (100.0%) | 0 (0.0%) |
Services Occupations
The most common Services occupations in Stonyford are Security & Protection (1 | 8.3%), Firefighting & Prevention (1 | 8.3%), and Food Preparation & Serving (1 | 8.3%).
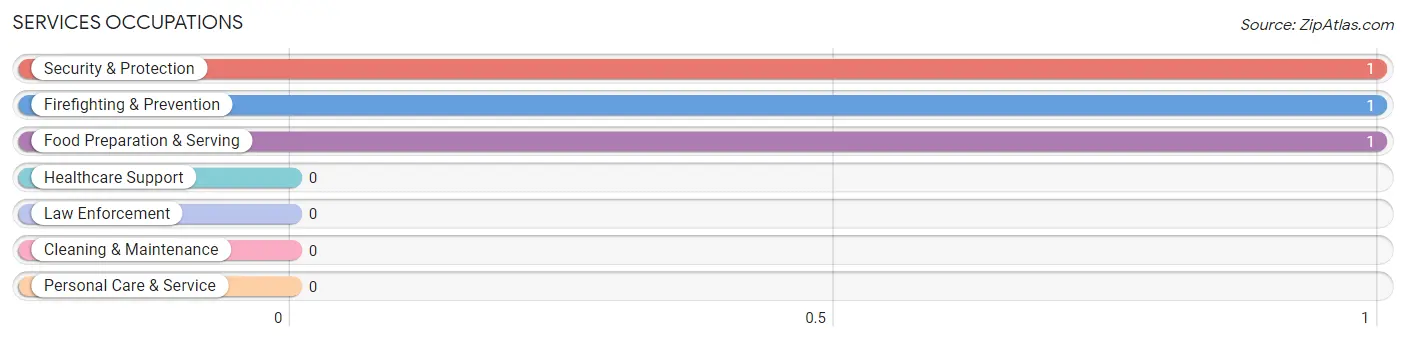
Services Occupations by Sex
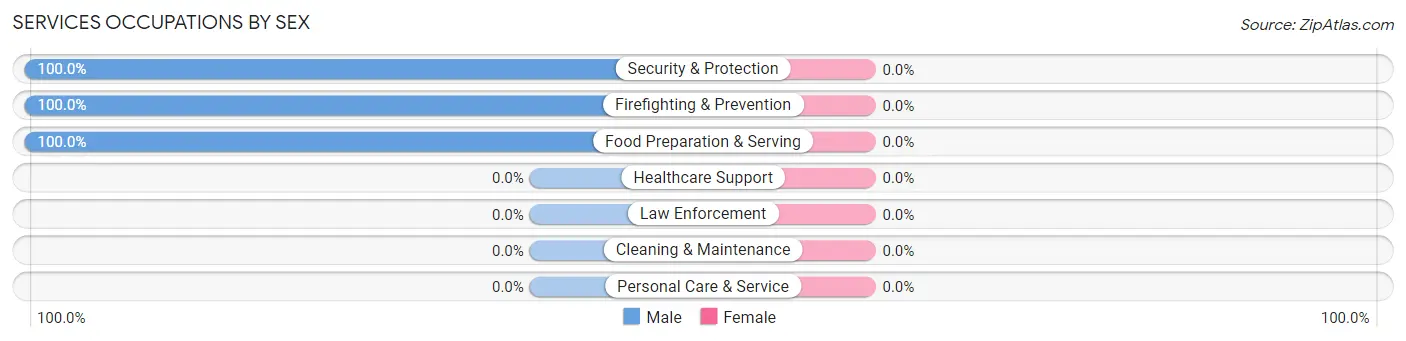
| Occupation | Male | Female |
| Healthcare Support | 0 (0.0%) | 0 (0.0%) |
| Security & Protection | 1 (100.0%) | 0 (0.0%) |
| Firefighting & Prevention | 1 (100.0%) | 0 (0.0%) |
| Law Enforcement | 0 (0.0%) | 0 (0.0%) |
| Food Preparation & Serving | 1 (100.0%) | 0 (0.0%) |
| Cleaning & Maintenance | 0 (0.0%) | 0 (0.0%) |
| Personal Care & Service | 0 (0.0%) | 0 (0.0%) |
| Total (Category) | 2 (100.0%) | 0 (0.0%) |
| Total (Overall) | 12 (100.0%) | 0 (0.0%) |
Sales and Office Occupations
Sales and Office Occupations by Sex
| Occupation | Male | Female |
| Sales & Related | 0 (0.0%) | 0 (0.0%) |
| Office & Administration | 0 (0.0%) | 0 (0.0%) |
| Total (Category) | 0 (0.0%) | 0 (0.0%) |
| Total (Overall) | 12 (100.0%) | 0 (0.0%) |
Natural Resources, Construction and Maintenance Occupations
The most common Natural Resources, Construction and Maintenance occupations in Stonyford are Installation, Maintenance & Repair (2 | 16.7%), and Farming, Fishing & Forestry (1 | 8.3%).
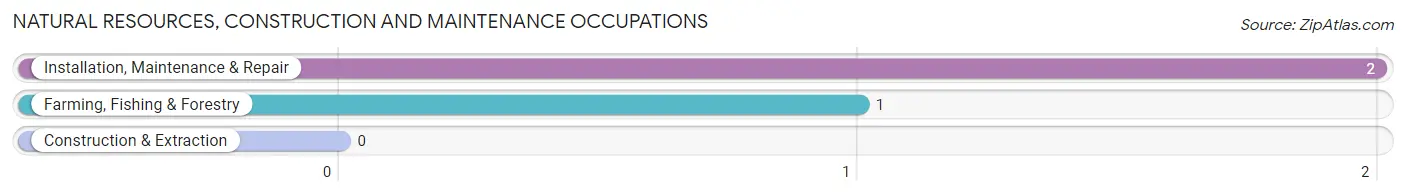
Natural Resources, Construction and Maintenance Occupations by Sex
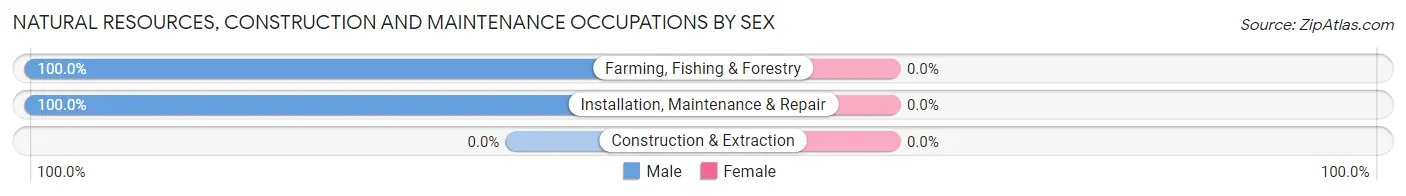
| Occupation | Male | Female |
| Farming, Fishing & Forestry | 1 (100.0%) | 0 (0.0%) |
| Construction & Extraction | 0 (0.0%) | 0 (0.0%) |
| Installation, Maintenance & Repair | 2 (100.0%) | 0 (0.0%) |
| Total (Category) | 3 (100.0%) | 0 (0.0%) |
| Total (Overall) | 12 (100.0%) | 0 (0.0%) |
Production, Transportation and Moving Occupations
The most common Production, Transportation and Moving occupations in Stonyford are Material Moving (5 | 41.7%), Production (1 | 8.3%), and Transportation (1 | 8.3%).
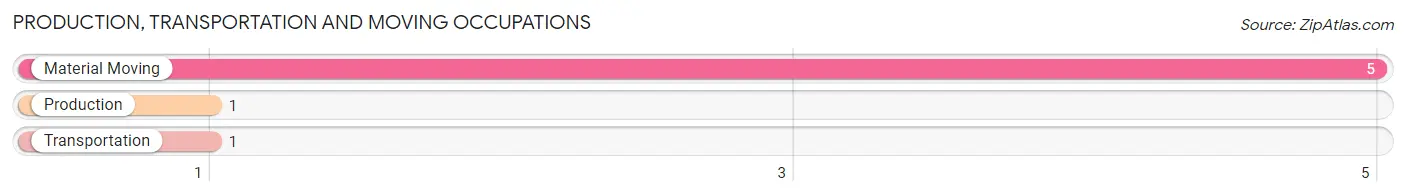
Production, Transportation and Moving Occupations by Sex
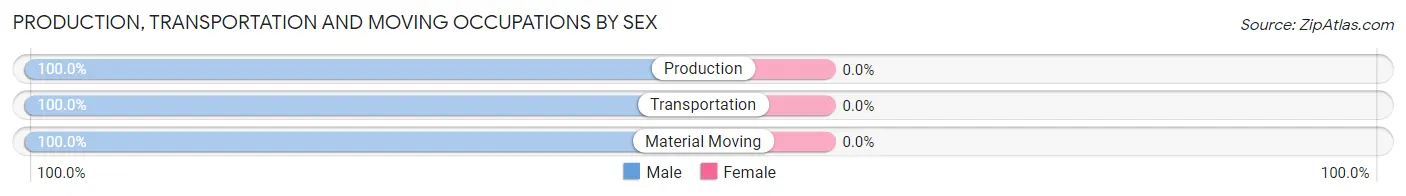
| Occupation | Male | Female |
| Production | 1 (100.0%) | 0 (0.0%) |
| Transportation | 1 (100.0%) | 0 (0.0%) |
| Material Moving | 5 (100.0%) | 0 (0.0%) |
| Total (Category) | 7 (100.0%) | 0 (0.0%) |
| Total (Overall) | 12 (100.0%) | 0 (0.0%) |
Employment Industries by Sex in Stonyford
Employment Industries in Stonyford
The major employment industries in Stonyford include Transportation & Warehousing (6 | 50.0%), Construction (2 | 16.7%), Real Estate, Rental & Leasing (1 | 8.3%), Administrative & Support (1 | 8.3%), and Educational Services (1 | 8.3%).

Employment Industries by Sex in Stonyford
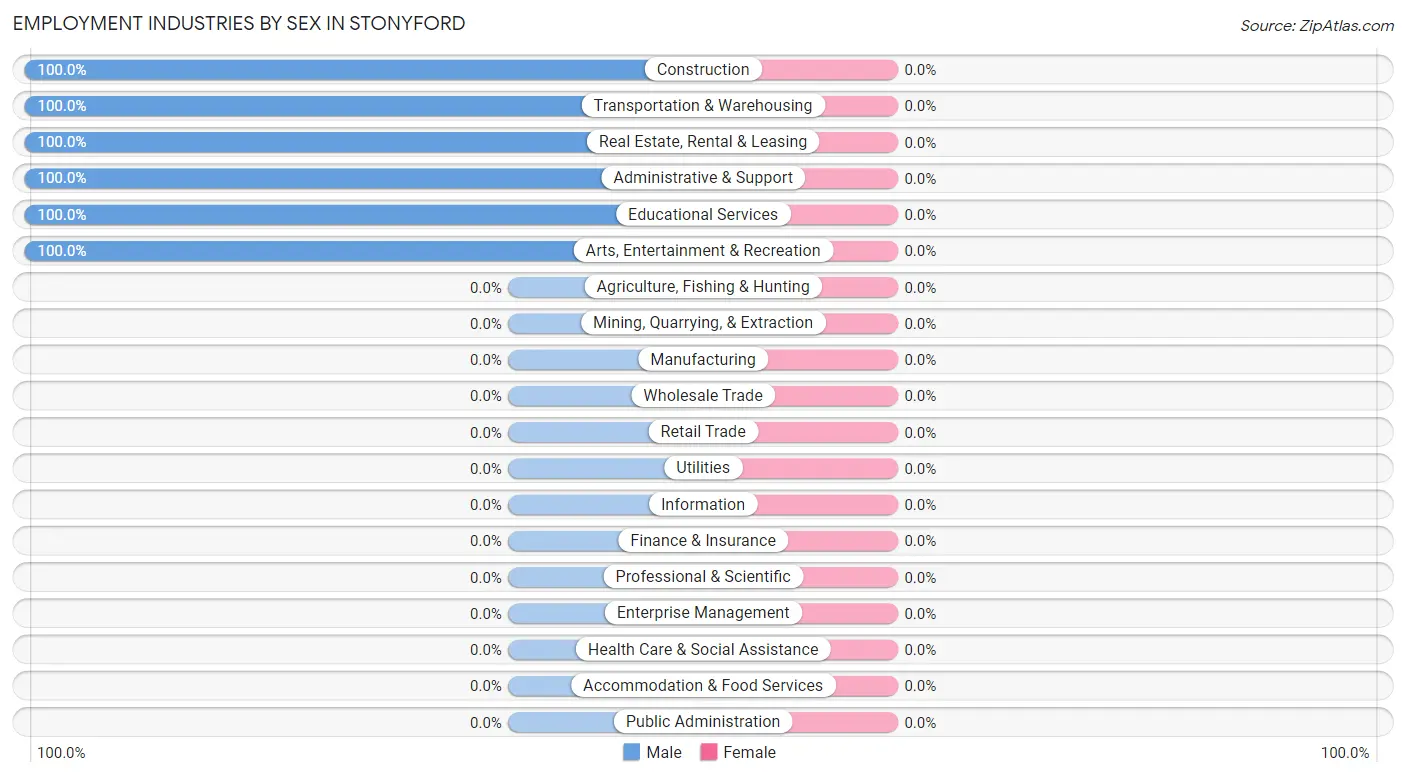
| Industry | Male | Female |
| Agriculture, Fishing & Hunting | 0 (0.0%) | 0 (0.0%) |
| Mining, Quarrying, & Extraction | 0 (0.0%) | 0 (0.0%) |
| Construction | 2 (100.0%) | 0 (0.0%) |
| Manufacturing | 0 (0.0%) | 0 (0.0%) |
| Wholesale Trade | 0 (0.0%) | 0 (0.0%) |
| Retail Trade | 0 (0.0%) | 0 (0.0%) |
| Transportation & Warehousing | 6 (100.0%) | 0 (0.0%) |
| Utilities | 0 (0.0%) | 0 (0.0%) |
| Information | 0 (0.0%) | 0 (0.0%) |
| Finance & Insurance | 0 (0.0%) | 0 (0.0%) |
| Real Estate, Rental & Leasing | 1 (100.0%) | 0 (0.0%) |
| Professional & Scientific | 0 (0.0%) | 0 (0.0%) |
| Enterprise Management | 0 (0.0%) | 0 (0.0%) |
| Administrative & Support | 1 (100.0%) | 0 (0.0%) |
| Educational Services | 1 (100.0%) | 0 (0.0%) |
| Health Care & Social Assistance | 0 (0.0%) | 0 (0.0%) |
| Arts, Entertainment & Recreation | 1 (100.0%) | 0 (0.0%) |
| Accommodation & Food Services | 0 (0.0%) | 0 (0.0%) |
| Public Administration | 0 (0.0%) | 0 (0.0%) |
| Total | 12 (100.0%) | 0 (0.0%) |
Education in Stonyford
School Enrollment in Stonyford
The most common levels of schooling among the 12 students in Stonyford are high school (7 | 58.3%), kindergarten (3 | 25.0%), and college / undergraduate (2 | 16.7%).
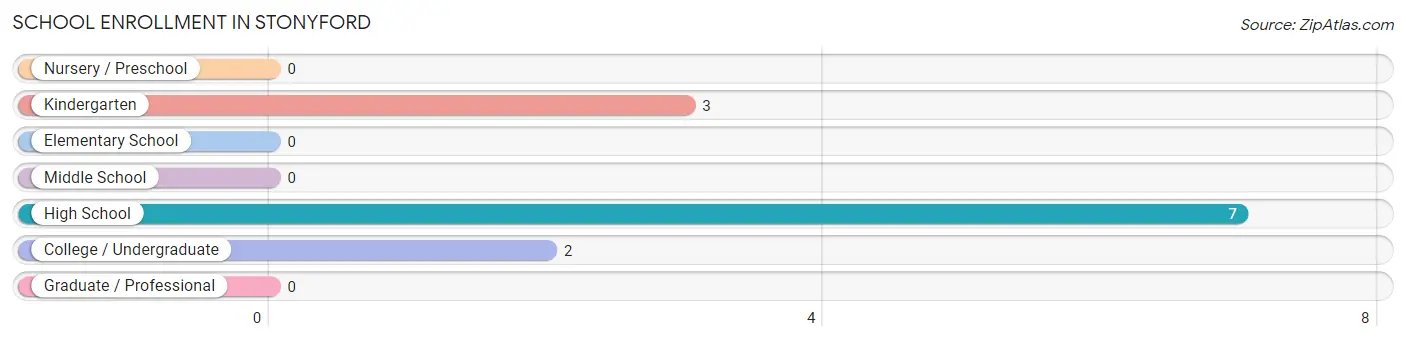
| School Level | # Students | % Students |
| Nursery / Preschool | 0 | 0.0% |
| Kindergarten | 3 | 25.0% |
| Elementary School | 0 | 0.0% |
| Middle School | 0 | 0.0% |
| High School | 7 | 58.3% |
| College / Undergraduate | 2 | 16.7% |
| Graduate / Professional | 0 | 0.0% |
| Total | 12 | 100.0% |
School Enrollment by Age by Funding Source in Stonyford
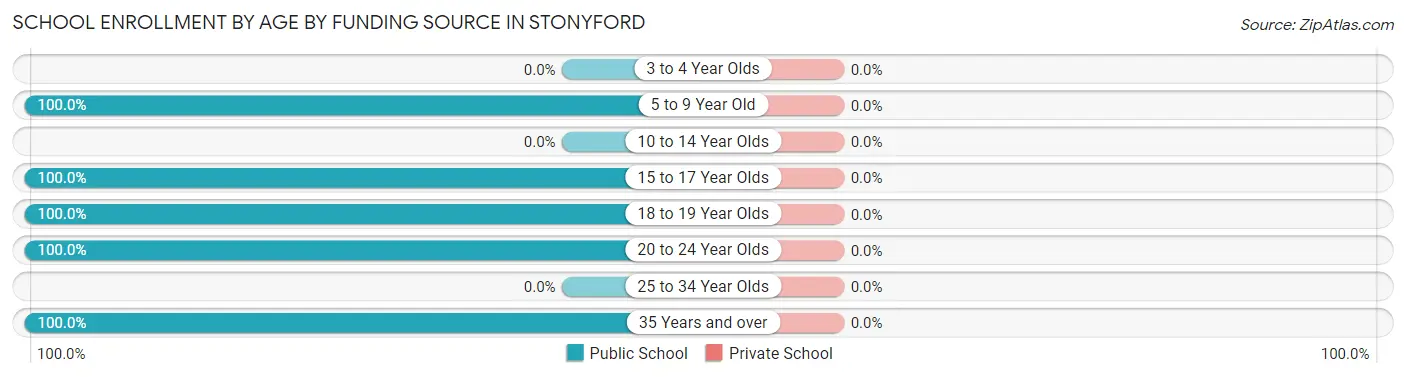
| Age Bracket | Public School | Private School |
| 3 to 4 Year Olds | 0 (0.0%) | 0 (0.0%) |
| 5 to 9 Year Old | 3 (100.0%) | 0 (0.0%) |
| 10 to 14 Year Olds | 0 (0.0%) | 0 (0.0%) |
| 15 to 17 Year Olds | 6 (100.0%) | 0 (0.0%) |
| 18 to 19 Year Olds | 1 (100.0%) | 0 (0.0%) |
| 20 to 24 Year Olds | 1 (100.0%) | 0 (0.0%) |
| 25 to 34 Year Olds | 0 (0.0%) | 0 (0.0%) |
| 35 Years and over | 1 (100.0%) | 0 (0.0%) |
| Total | 12 (100.0%) | 0 (0.0%) |
Educational Attainment by Field of Study in Stonyford
Engineering (10 | 58.8%), liberal arts & history (6 | 35.3%), and business (1 | 5.9%) are the most common fields of study among 17 individuals in Stonyford who have obtained a bachelor's degree or higher.
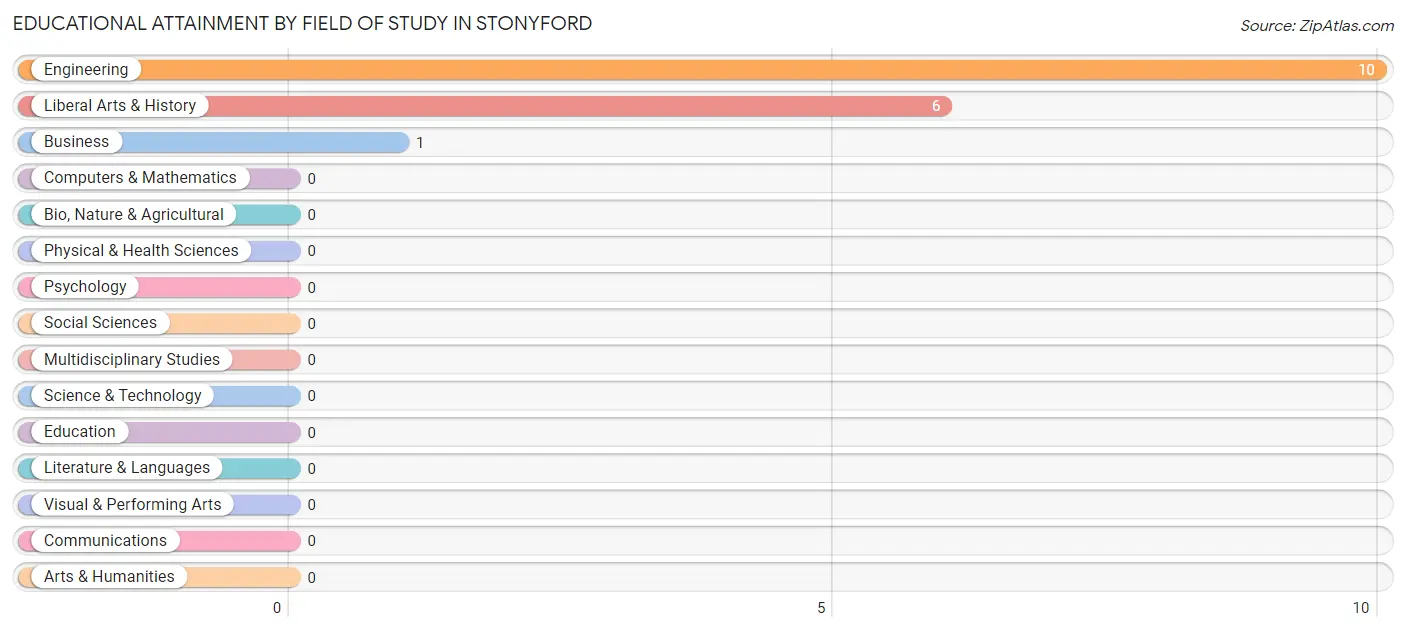
| Field of Study | # Graduates | % Graduates |
| Computers & Mathematics | 0 | 0.0% |
| Bio, Nature & Agricultural | 0 | 0.0% |
| Physical & Health Sciences | 0 | 0.0% |
| Psychology | 0 | 0.0% |
| Social Sciences | 0 | 0.0% |
| Engineering | 10 | 58.8% |
| Multidisciplinary Studies | 0 | 0.0% |
| Science & Technology | 0 | 0.0% |
| Business | 1 | 5.9% |
| Education | 0 | 0.0% |
| Literature & Languages | 0 | 0.0% |
| Liberal Arts & History | 6 | 35.3% |
| Visual & Performing Arts | 0 | 0.0% |
| Communications | 0 | 0.0% |
| Arts & Humanities | 0 | 0.0% |
| Total | 17 | 100.0% |
Transportation & Commute in Stonyford
Vehicle Availability by Sex in Stonyford
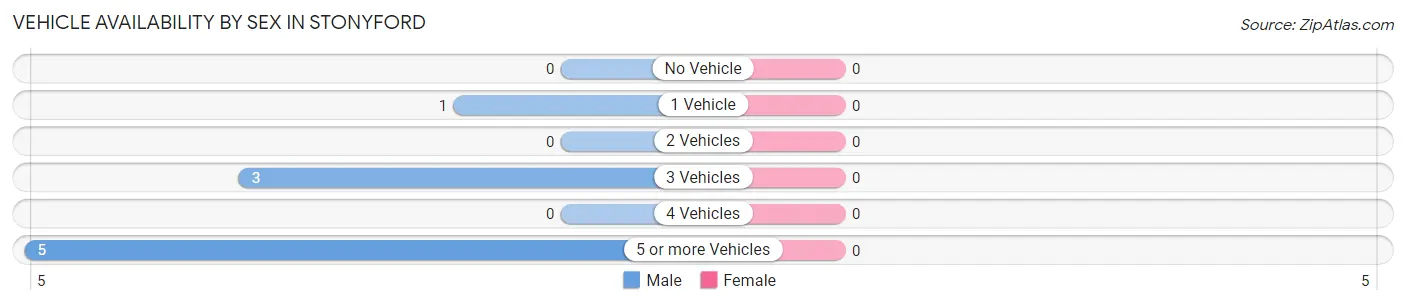
| Vehicles Available | Male | Female |
| No Vehicle | 0 (0.0%) | 0 (0.0%) |
| 1 Vehicle | 1 (11.1%) | 0 (0.0%) |
| 2 Vehicles | 0 (0.0%) | 0 (0.0%) |
| 3 Vehicles | 3 (33.3%) | 0 (0.0%) |
| 4 Vehicles | 0 (0.0%) | 0 (0.0%) |
| 5 or more Vehicles | 5 (55.6%) | 0 (0.0%) |
| Total | 9 (100.0%) | 0 (0.0%) |
Commute Time in Stonyford
The most frequently occuring commute durations in Stonyford are 90 or more minutes (5 commuters, 45.5%), 10 to 14 minutes (2 commuters, 18.2%), and 45 to 59 minutes (2 commuters, 18.2%).
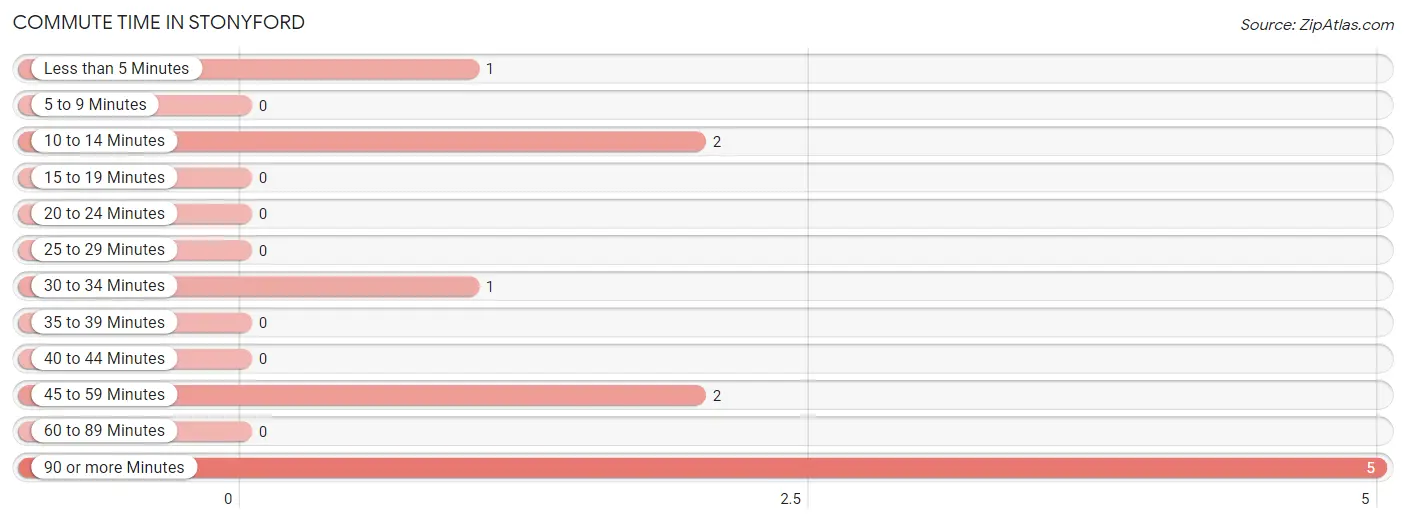
| Commute Time | # Commuters | % Commuters |
| Less than 5 Minutes | 1 | 9.1% |
| 5 to 9 Minutes | 0 | 0.0% |
| 10 to 14 Minutes | 2 | 18.2% |
| 15 to 19 Minutes | 0 | 0.0% |
| 20 to 24 Minutes | 0 | 0.0% |
| 25 to 29 Minutes | 0 | 0.0% |
| 30 to 34 Minutes | 1 | 9.1% |
| 35 to 39 Minutes | 0 | 0.0% |
| 40 to 44 Minutes | 0 | 0.0% |
| 45 to 59 Minutes | 2 | 18.2% |
| 60 to 89 Minutes | 0 | 0.0% |
| 90 or more Minutes | 5 | 45.5% |
Commute Time by Sex in Stonyford
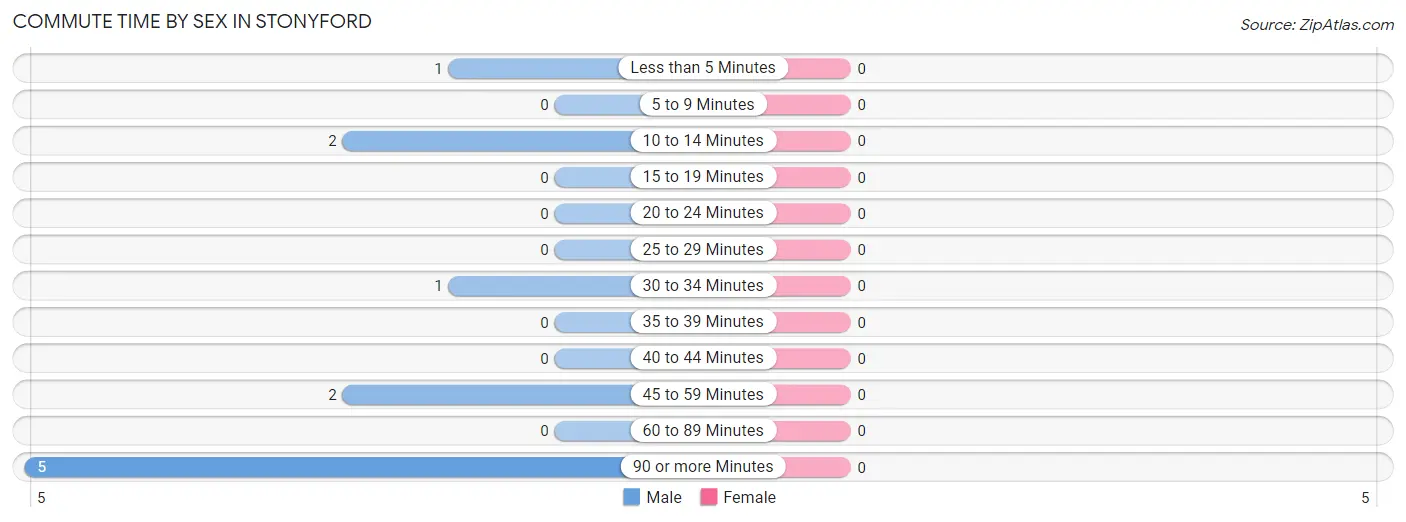
| Commute Time | Male | Female |
| Less than 5 Minutes | 1 (9.1%) | 0 (0.0%) |
| 5 to 9 Minutes | 0 (0.0%) | 0 (0.0%) |
| 10 to 14 Minutes | 2 (18.2%) | 0 (0.0%) |
| 15 to 19 Minutes | 0 (0.0%) | 0 (0.0%) |
| 20 to 24 Minutes | 0 (0.0%) | 0 (0.0%) |
| 25 to 29 Minutes | 0 (0.0%) | 0 (0.0%) |
| 30 to 34 Minutes | 1 (9.1%) | 0 (0.0%) |
| 35 to 39 Minutes | 0 (0.0%) | 0 (0.0%) |
| 40 to 44 Minutes | 0 (0.0%) | 0 (0.0%) |
| 45 to 59 Minutes | 2 (18.2%) | 0 (0.0%) |
| 60 to 89 Minutes | 0 (0.0%) | 0 (0.0%) |
| 90 or more Minutes | 5 (45.5%) | 0 (0.0%) |
Time of Departure to Work by Sex in Stonyford
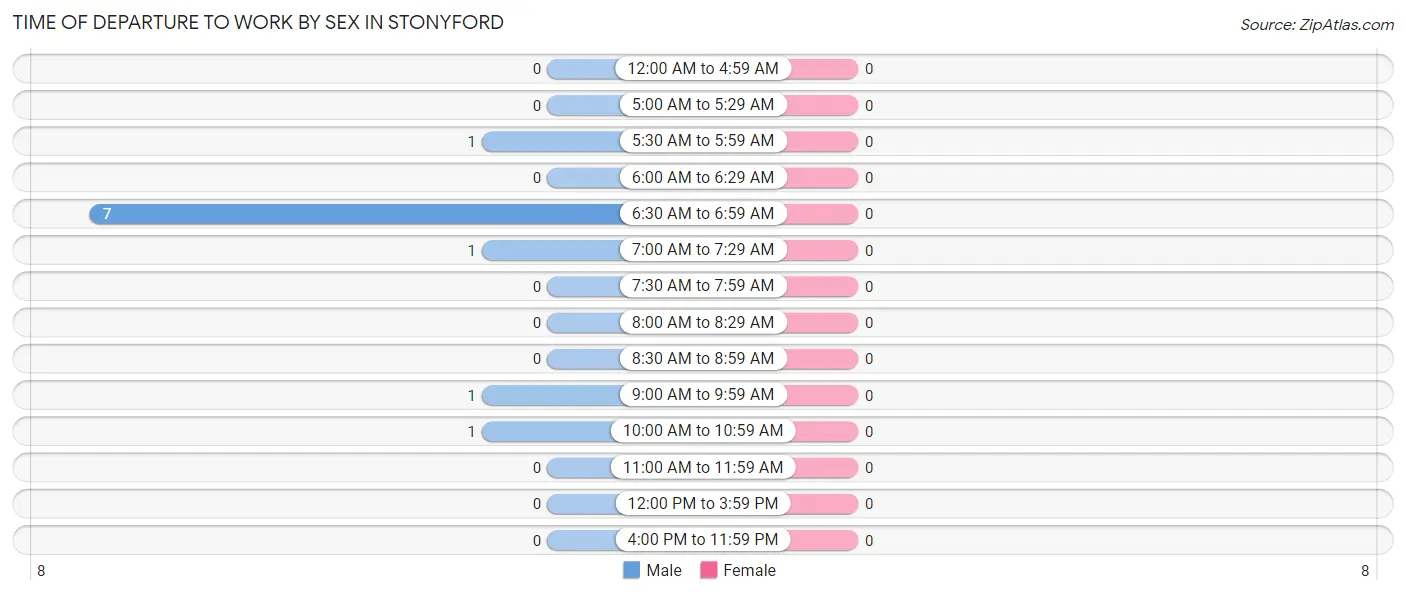
| Time of Departure | Male | Female |
| 12:00 AM to 4:59 AM | 0 (0.0%) | 0 (0.0%) |
| 5:00 AM to 5:29 AM | 0 (0.0%) | 0 (0.0%) |
| 5:30 AM to 5:59 AM | 1 (9.1%) | 0 (0.0%) |
| 6:00 AM to 6:29 AM | 0 (0.0%) | 0 (0.0%) |
| 6:30 AM to 6:59 AM | 7 (63.6%) | 0 (0.0%) |
| 7:00 AM to 7:29 AM | 1 (9.1%) | 0 (0.0%) |
| 7:30 AM to 7:59 AM | 0 (0.0%) | 0 (0.0%) |
| 8:00 AM to 8:29 AM | 0 (0.0%) | 0 (0.0%) |
| 8:30 AM to 8:59 AM | 0 (0.0%) | 0 (0.0%) |
| 9:00 AM to 9:59 AM | 1 (9.1%) | 0 (0.0%) |
| 10:00 AM to 10:59 AM | 1 (9.1%) | 0 (0.0%) |
| 11:00 AM to 11:59 AM | 0 (0.0%) | 0 (0.0%) |
| 12:00 PM to 3:59 PM | 0 (0.0%) | 0 (0.0%) |
| 4:00 PM to 11:59 PM | 0 (0.0%) | 0 (0.0%) |
| Total | 11 (100.0%) | 0 (0.0%) |
Housing Occupancy in Stonyford
Occupancy by Ownership in Stonyford
Of the total 44 dwellings in Stonyford, owner-occupied units account for 39 (88.6%), while renter-occupied units make up 5 (11.4%).
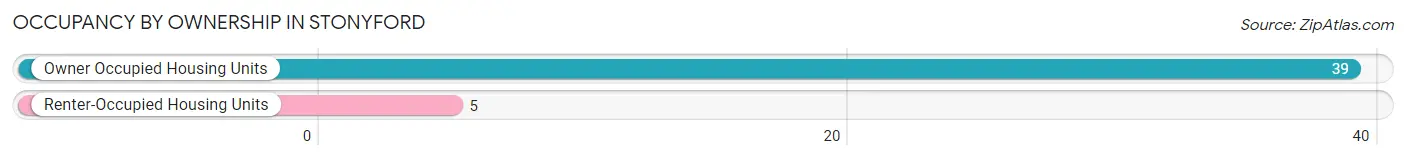
| Occupancy | # Housing Units | % Housing Units |
| Owner Occupied Housing Units | 39 | 88.6% |
| Renter-Occupied Housing Units | 5 | 11.4% |
| Total Occupied Housing Units | 44 | 100.0% |
Occupancy by Household Size in Stonyford
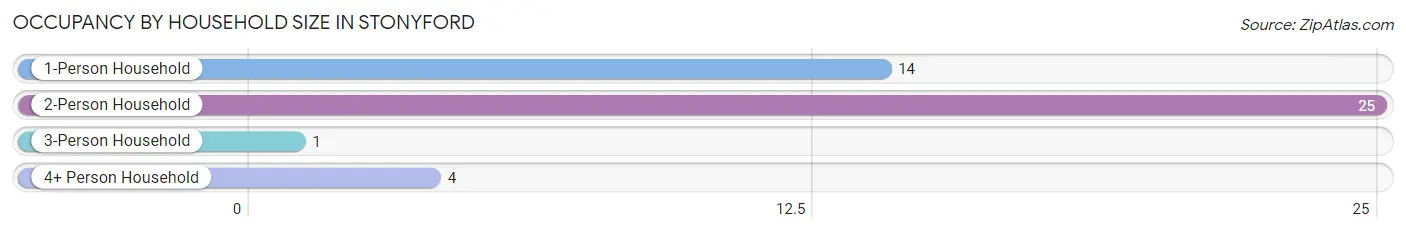
| Household Size | # Housing Units | % Housing Units |
| 1-Person Household | 14 | 31.8% |
| 2-Person Household | 25 | 56.8% |
| 3-Person Household | 1 | 2.3% |
| 4+ Person Household | 4 | 9.1% |
| Total Housing Units | 44 | 100.0% |
Occupancy by Ownership by Household Size in Stonyford
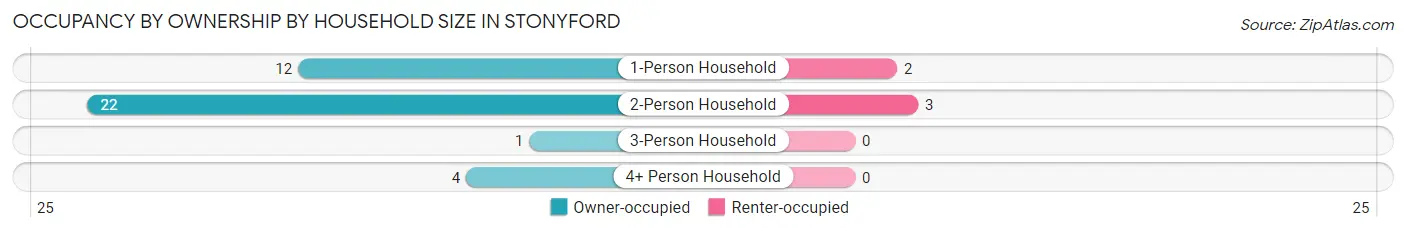
| Household Size | Owner-occupied | Renter-occupied |
| 1-Person Household | 12 (85.7%) | 2 (14.3%) |
| 2-Person Household | 22 (88.0%) | 3 (12.0%) |
| 3-Person Household | 1 (100.0%) | 0 (0.0%) |
| 4+ Person Household | 4 (100.0%) | 0 (0.0%) |
| Total Housing Units | 39 (88.6%) | 5 (11.4%) |
Occupancy by Educational Attainment in Stonyford
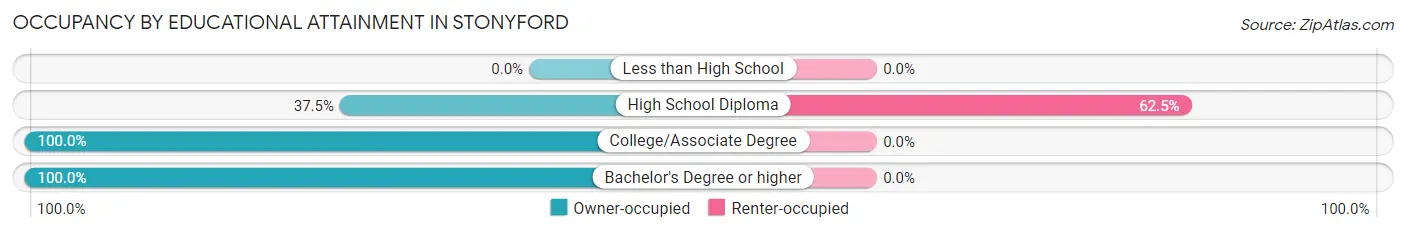
| Household Size | Owner-occupied | Renter-occupied |
| Less than High School | 0 (0.0%) | 0 (0.0%) |
| High School Diploma | 3 (37.5%) | 5 (62.5%) |
| College/Associate Degree | 20 (100.0%) | 0 (0.0%) |
| Bachelor's Degree or higher | 16 (100.0%) | 0 (0.0%) |
Occupancy by Age of Householder in Stonyford
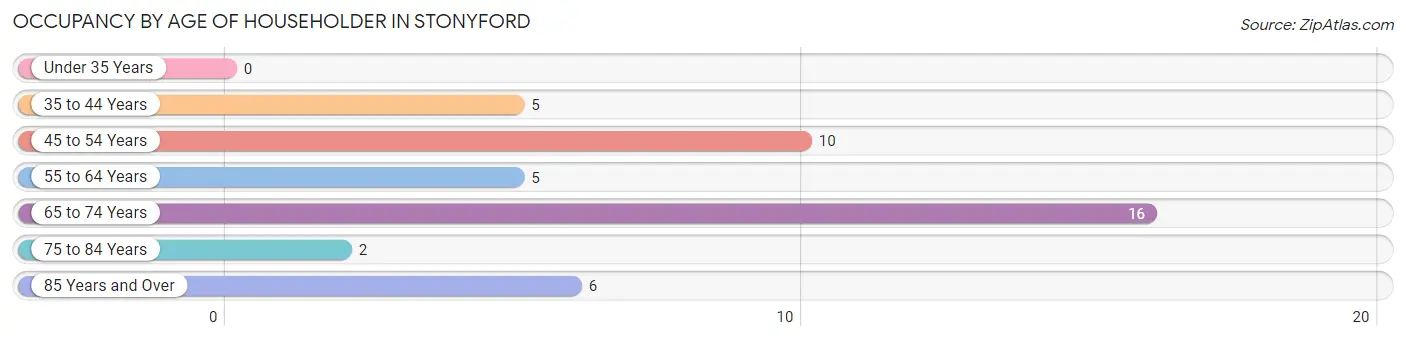
| Age Bracket | # Households | % Households |
| Under 35 Years | 0 | 0.0% |
| 35 to 44 Years | 5 | 11.4% |
| 45 to 54 Years | 10 | 22.7% |
| 55 to 64 Years | 5 | 11.4% |
| 65 to 74 Years | 16 | 36.4% |
| 75 to 84 Years | 2 | 4.5% |
| 85 Years and Over | 6 | 13.6% |
| Total | 44 | 100.0% |
Housing Finances in Stonyford
Median Income by Occupancy in Stonyford
| Occupancy Type | # Households | Median Income |
| Owner-Occupied | 39 (88.6%) | $0 |
| Renter-Occupied | 5 (11.4%) | $0 |
| Average | 44 (100.0%) | $0 |
Occupancy by Householder Income Bracket in Stonyford
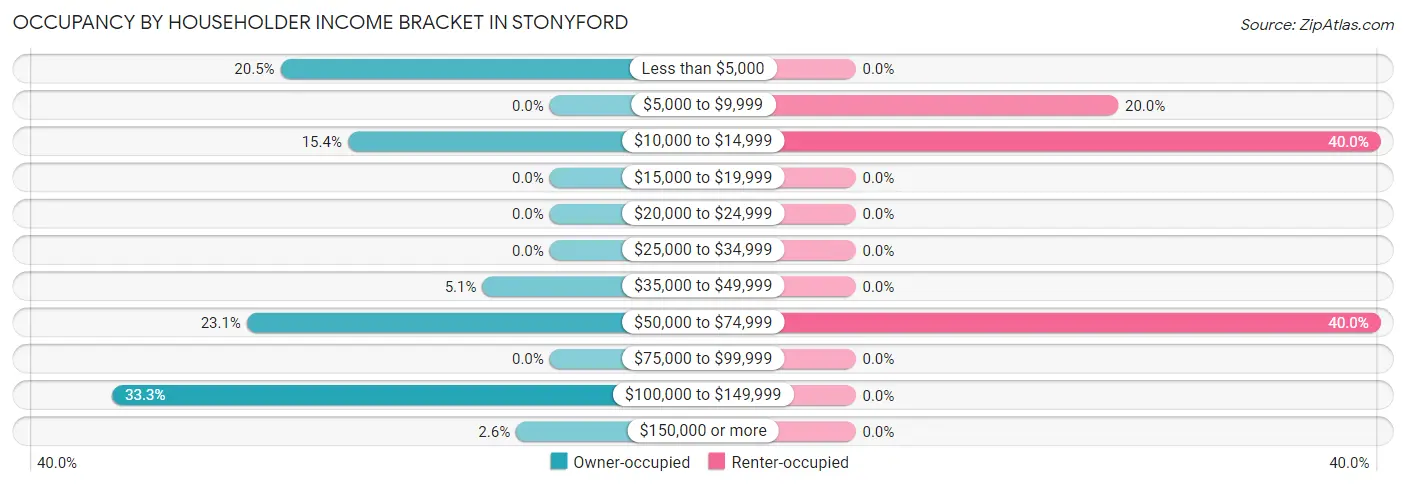
| Income Bracket | Owner-occupied | Renter-occupied |
| Less than $5,000 | 8 (20.5%) | 0 (0.0%) |
| $5,000 to $9,999 | 0 (0.0%) | 1 (20.0%) |
| $10,000 to $14,999 | 6 (15.4%) | 2 (40.0%) |
| $15,000 to $19,999 | 0 (0.0%) | 0 (0.0%) |
| $20,000 to $24,999 | 0 (0.0%) | 0 (0.0%) |
| $25,000 to $34,999 | 0 (0.0%) | 0 (0.0%) |
| $35,000 to $49,999 | 2 (5.1%) | 0 (0.0%) |
| $50,000 to $74,999 | 9 (23.1%) | 2 (40.0%) |
| $75,000 to $99,999 | 0 (0.0%) | 0 (0.0%) |
| $100,000 to $149,999 | 13 (33.3%) | 0 (0.0%) |
| $150,000 or more | 1 (2.6%) | 0 (0.0%) |
| Total | 39 (100.0%) | 5 (100.0%) |
Monthly Housing Cost Tiers in Stonyford
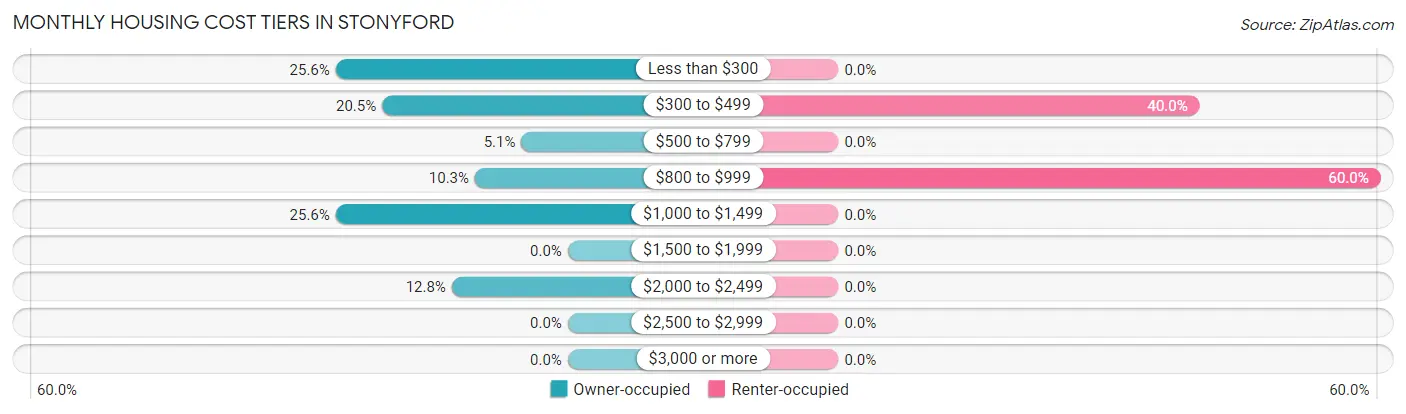
| Monthly Cost | Owner-occupied | Renter-occupied |
| Less than $300 | 10 (25.6%) | 0 (0.0%) |
| $300 to $499 | 8 (20.5%) | 2 (40.0%) |
| $500 to $799 | 2 (5.1%) | 0 (0.0%) |
| $800 to $999 | 4 (10.3%) | 3 (60.0%) |
| $1,000 to $1,499 | 10 (25.6%) | 0 (0.0%) |
| $1,500 to $1,999 | 0 (0.0%) | 0 (0.0%) |
| $2,000 to $2,499 | 5 (12.8%) | 0 (0.0%) |
| $2,500 to $2,999 | 0 (0.0%) | 0 (0.0%) |
| $3,000 or more | 0 (0.0%) | 0 (0.0%) |
| Total | 39 (100.0%) | 5 (100.0%) |
Physical Housing Characteristics in Stonyford
Housing Structures in Stonyford
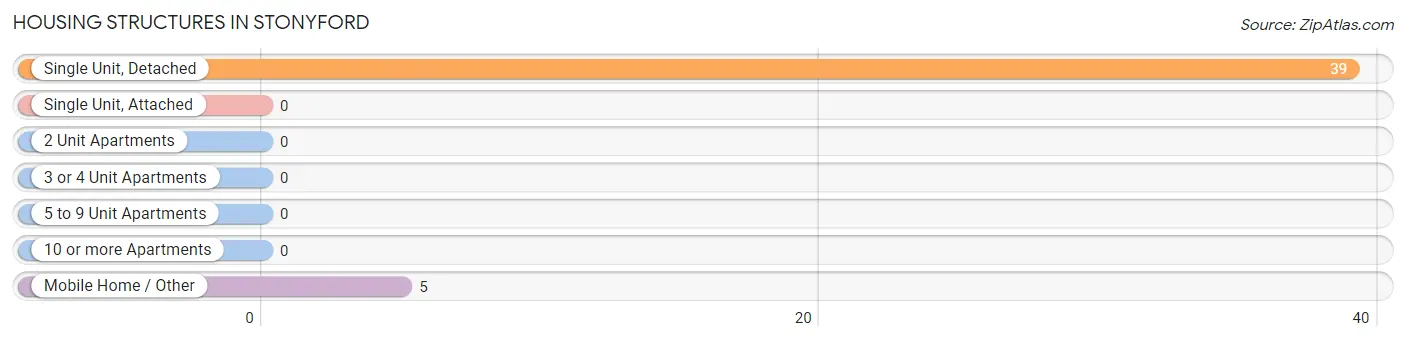
| Structure Type | # Housing Units | % Housing Units |
| Single Unit, Detached | 39 | 88.6% |
| Single Unit, Attached | 0 | 0.0% |
| 2 Unit Apartments | 0 | 0.0% |
| 3 or 4 Unit Apartments | 0 | 0.0% |
| 5 to 9 Unit Apartments | 0 | 0.0% |
| 10 or more Apartments | 0 | 0.0% |
| Mobile Home / Other | 5 | 11.4% |
| Total | 44 | 100.0% |
Housing Structures by Occupancy in Stonyford
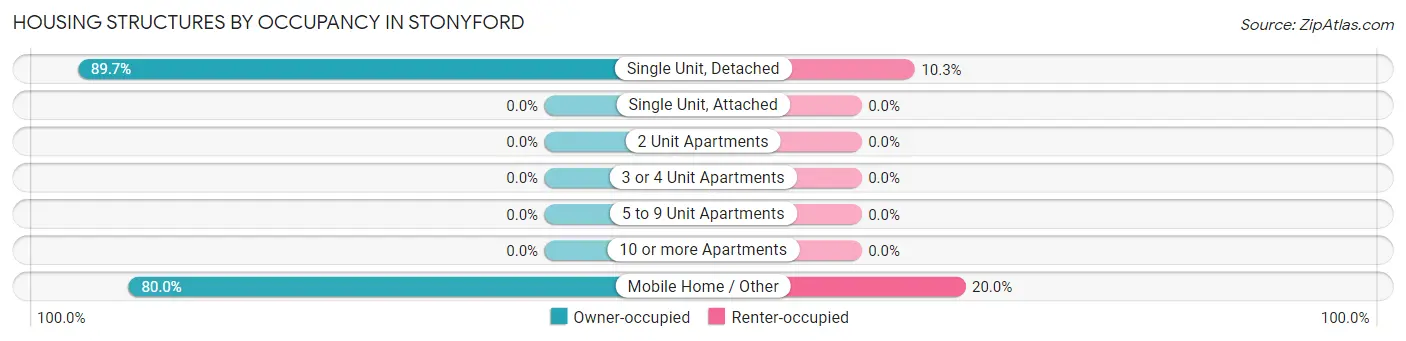
| Structure Type | Owner-occupied | Renter-occupied |
| Single Unit, Detached | 35 (89.7%) | 4 (10.3%) |
| Single Unit, Attached | 0 (0.0%) | 0 (0.0%) |
| 2 Unit Apartments | 0 (0.0%) | 0 (0.0%) |
| 3 or 4 Unit Apartments | 0 (0.0%) | 0 (0.0%) |
| 5 to 9 Unit Apartments | 0 (0.0%) | 0 (0.0%) |
| 10 or more Apartments | 0 (0.0%) | 0 (0.0%) |
| Mobile Home / Other | 4 (80.0%) | 1 (20.0%) |
| Total | 39 (88.6%) | 5 (11.4%) |
Housing Structures by Number of Rooms in Stonyford
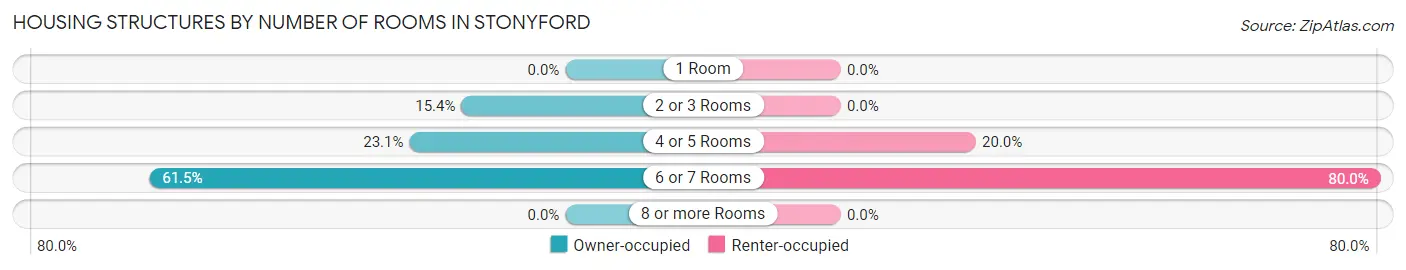
| Number of Rooms | Owner-occupied | Renter-occupied |
| 1 Room | 0 (0.0%) | 0 (0.0%) |
| 2 or 3 Rooms | 6 (15.4%) | 0 (0.0%) |
| 4 or 5 Rooms | 9 (23.1%) | 1 (20.0%) |
| 6 or 7 Rooms | 24 (61.5%) | 4 (80.0%) |
| 8 or more Rooms | 0 (0.0%) | 0 (0.0%) |
| Total | 39 (100.0%) | 5 (100.0%) |
Housing Structure by Heating Type in Stonyford
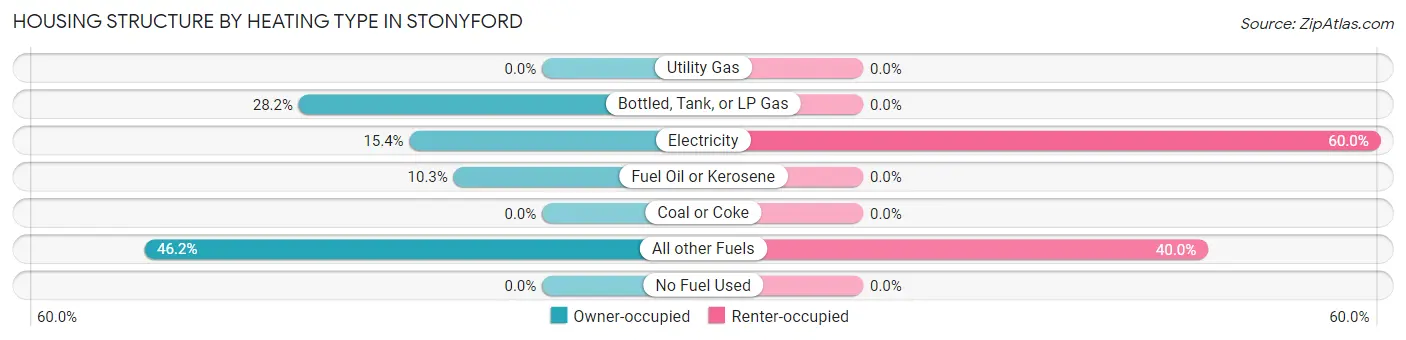
| Heating Type | Owner-occupied | Renter-occupied |
| Utility Gas | 0 (0.0%) | 0 (0.0%) |
| Bottled, Tank, or LP Gas | 11 (28.2%) | 0 (0.0%) |
| Electricity | 6 (15.4%) | 3 (60.0%) |
| Fuel Oil or Kerosene | 4 (10.3%) | 0 (0.0%) |
| Coal or Coke | 0 (0.0%) | 0 (0.0%) |
| All other Fuels | 18 (46.2%) | 2 (40.0%) |
| No Fuel Used | 0 (0.0%) | 0 (0.0%) |
| Total | 39 (100.0%) | 5 (100.0%) |
Household Vehicle Usage in Stonyford
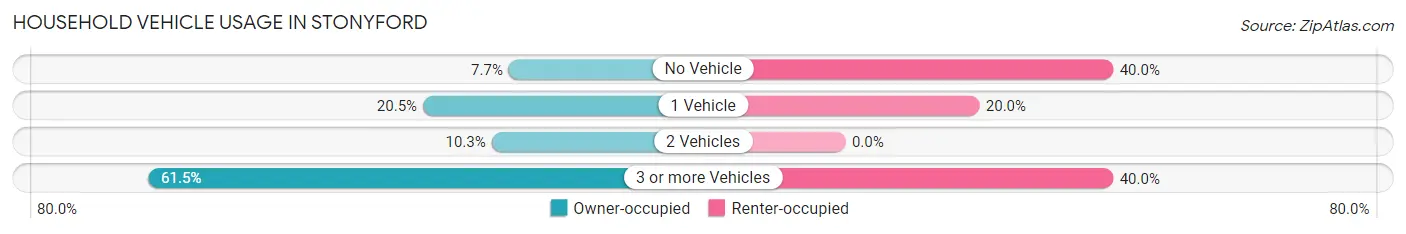
| Vehicles per Household | Owner-occupied | Renter-occupied |
| No Vehicle | 3 (7.7%) | 2 (40.0%) |
| 1 Vehicle | 8 (20.5%) | 1 (20.0%) |
| 2 Vehicles | 4 (10.3%) | 0 (0.0%) |
| 3 or more Vehicles | 24 (61.5%) | 2 (40.0%) |
| Total | 39 (100.0%) | 5 (100.0%) |
Real Estate & Mortgages in Stonyford
Real Estate and Mortgage Overview in Stonyford
| Characteristic | Without Mortgage | With Mortgage |
| Housing Units | 18 | 21 |
| Median Property Value | $81,700 | $208,300 |
| Median Household Income | - | - |
| Monthly Housing Costs | $243 | $0 |
| Real Estate Taxes | $743 | $0 |
Property Value by Mortgage Status in Stonyford
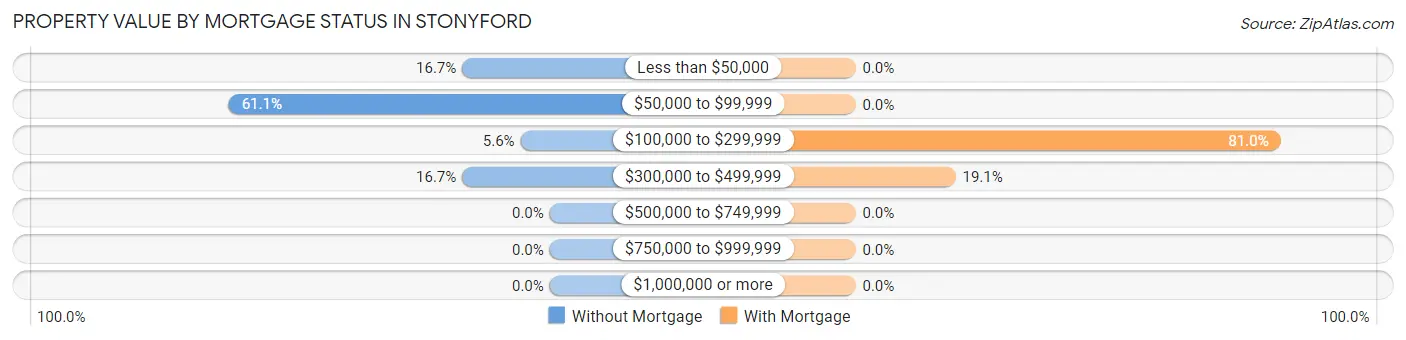
| Property Value | Without Mortgage | With Mortgage |
| Less than $50,000 | 3 (16.7%) | 0 (0.0%) |
| $50,000 to $99,999 | 11 (61.1%) | 0 (0.0%) |
| $100,000 to $299,999 | 1 (5.6%) | 17 (80.9%) |
| $300,000 to $499,999 | 3 (16.7%) | 4 (19.1%) |
| $500,000 to $749,999 | 0 (0.0%) | 0 (0.0%) |
| $750,000 to $999,999 | 0 (0.0%) | 0 (0.0%) |
| $1,000,000 or more | 0 (0.0%) | 0 (0.0%) |
| Total | 18 (100.0%) | 21 (100.0%) |
Household Income by Mortgage Status in Stonyford
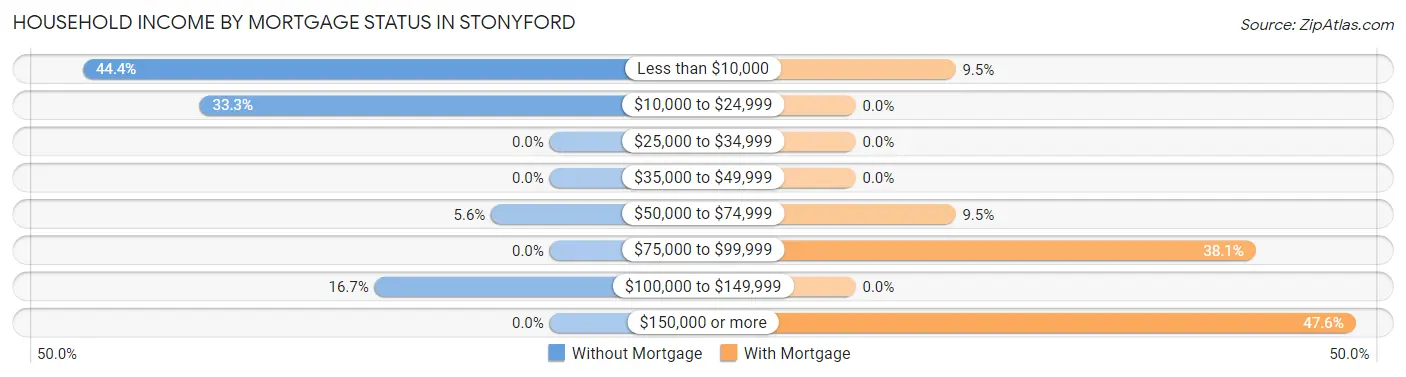
| Household Income | Without Mortgage | With Mortgage |
| Less than $10,000 | 8 (44.4%) | 2 (9.5%) |
| $10,000 to $24,999 | 6 (33.3%) | 0 (0.0%) |
| $25,000 to $34,999 | 0 (0.0%) | 0 (0.0%) |
| $35,000 to $49,999 | 0 (0.0%) | 0 (0.0%) |
| $50,000 to $74,999 | 1 (5.6%) | 2 (9.5%) |
| $75,000 to $99,999 | 0 (0.0%) | 8 (38.1%) |
| $100,000 to $149,999 | 3 (16.7%) | 0 (0.0%) |
| $150,000 or more | 0 (0.0%) | 10 (47.6%) |
| Total | 18 (100.0%) | 21 (100.0%) |
Property Value to Household Income Ratio in Stonyford
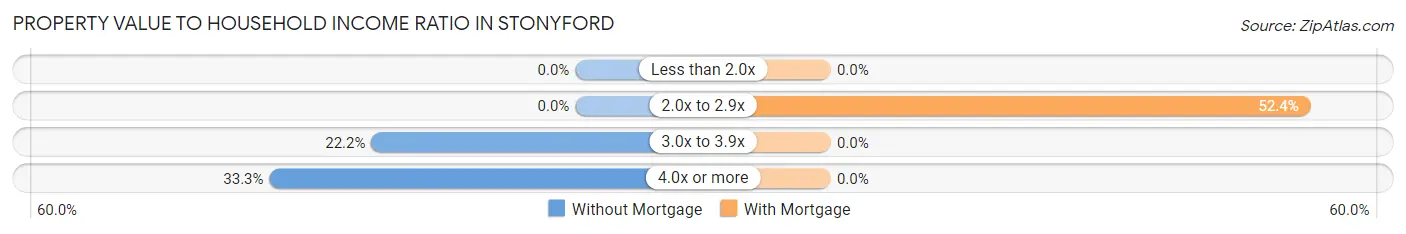
| Value-to-Income Ratio | Without Mortgage | With Mortgage |
| Less than 2.0x | 0 (0.0%) | 0 (0.0%) |
| 2.0x to 2.9x | 0 (0.0%) | 11 (52.4%) |
| 3.0x to 3.9x | 4 (22.2%) | 0 (0.0%) |
| 4.0x or more | 6 (33.3%) | 0 (0.0%) |
| Total | 18 (100.0%) | 21 (100.0%) |
Real Estate Taxes by Mortgage Status in Stonyford
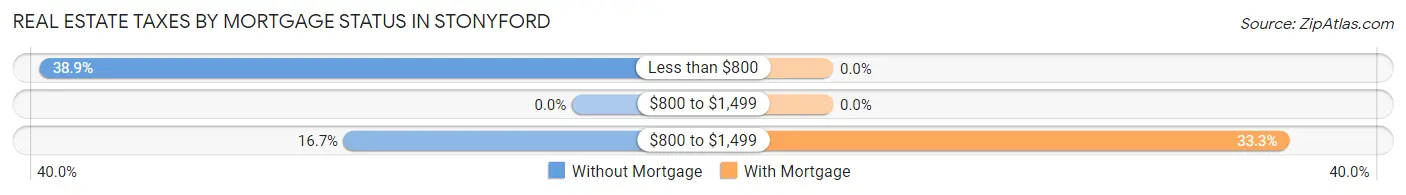
| Property Taxes | Without Mortgage | With Mortgage |
| Less than $800 | 7 (38.9%) | 0 (0.0%) |
| $800 to $1,499 | 0 (0.0%) | 0 (0.0%) |
| $800 to $1,499 | 3 (16.7%) | 7 (33.3%) |
| Total | 18 (100.0%) | 21 (100.0%) |
Health & Disability in Stonyford
Health Insurance Coverage by Age in Stonyford
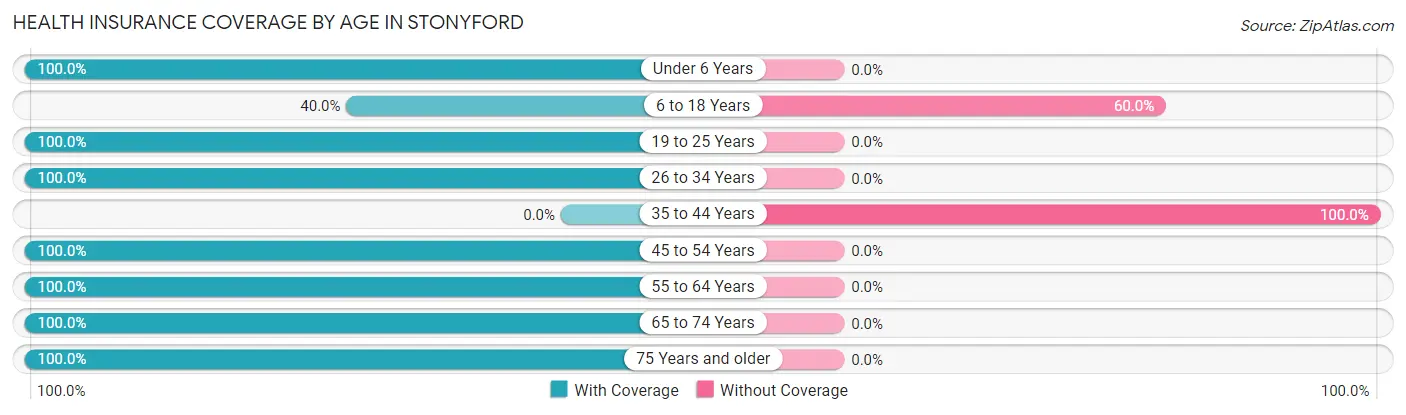
| Age Bracket | With Coverage | Without Coverage |
| Under 6 Years | 2 (100.0%) | 0 (0.0%) |
| 6 to 18 Years | 4 (40.0%) | 6 (60.0%) |
| 19 to 25 Years | 2 (100.0%) | 0 (0.0%) |
| 26 to 34 Years | 1 (100.0%) | 0 (0.0%) |
| 35 to 44 Years | 0 (0.0%) | 5 (100.0%) |
| 45 to 54 Years | 23 (100.0%) | 0 (0.0%) |
| 55 to 64 Years | 8 (100.0%) | 0 (0.0%) |
| 65 to 74 Years | 21 (100.0%) | 0 (0.0%) |
| 75 Years and older | 10 (100.0%) | 0 (0.0%) |
| Total | 71 (86.6%) | 11 (13.4%) |
Health Insurance Coverage by Citizenship Status in Stonyford
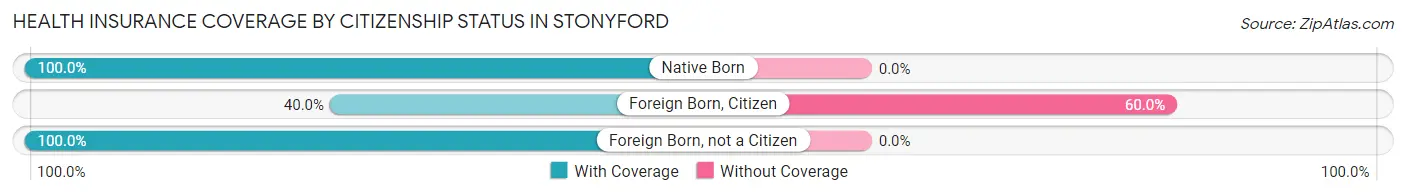
| Citizenship Status | With Coverage | Without Coverage |
| Native Born | 2 (100.0%) | 0 (0.0%) |
| Foreign Born, Citizen | 4 (40.0%) | 6 (60.0%) |
| Foreign Born, not a Citizen | 2 (100.0%) | 0 (0.0%) |
Health Insurance Coverage by Household Income in Stonyford
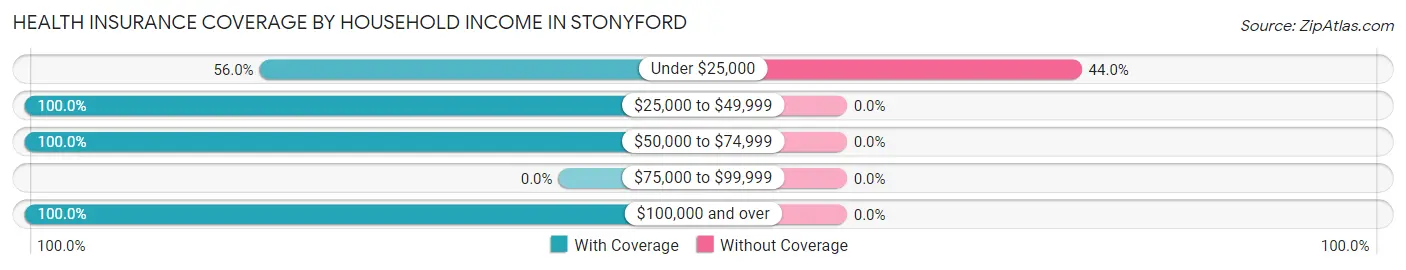
| Household Income | With Coverage | Without Coverage |
| Under $25,000 | 14 (56.0%) | 11 (44.0%) |
| $25,000 to $49,999 | 2 (100.0%) | 0 (0.0%) |
| $50,000 to $74,999 | 25 (100.0%) | 0 (0.0%) |
| $75,000 to $99,999 | 0 (0.0%) | 0 (0.0%) |
| $100,000 and over | 25 (100.0%) | 0 (0.0%) |
Public vs Private Health Insurance Coverage by Age in Stonyford
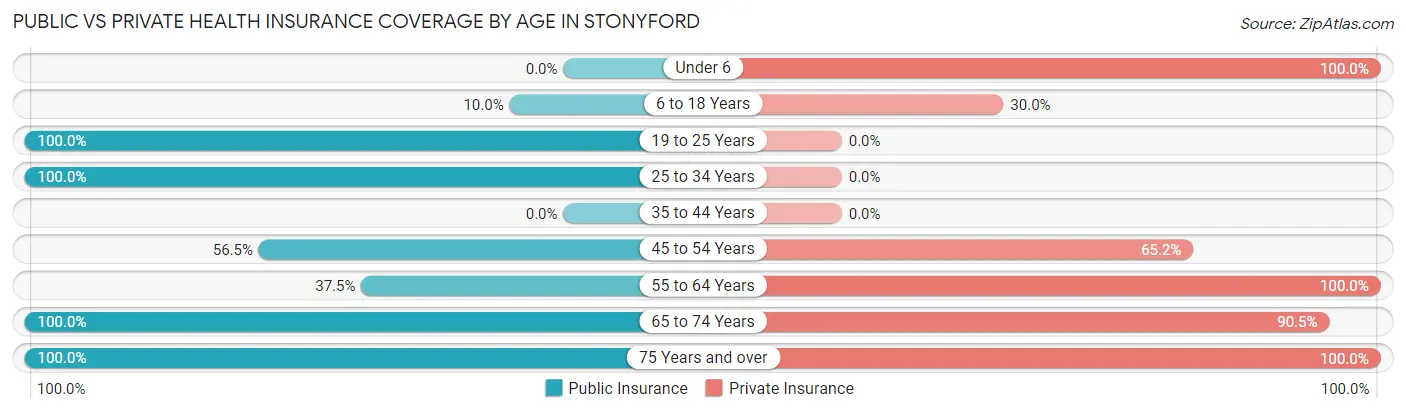
| Age Bracket | Public Insurance | Private Insurance |
| Under 6 | 0 (0.0%) | 2 (100.0%) |
| 6 to 18 Years | 1 (10.0%) | 3 (30.0%) |
| 19 to 25 Years | 2 (100.0%) | 0 (0.0%) |
| 25 to 34 Years | 1 (100.0%) | 0 (0.0%) |
| 35 to 44 Years | 0 (0.0%) | 0 (0.0%) |
| 45 to 54 Years | 13 (56.5%) | 15 (65.2%) |
| 55 to 64 Years | 3 (37.5%) | 8 (100.0%) |
| 65 to 74 Years | 21 (100.0%) | 19 (90.5%) |
| 75 Years and over | 10 (100.0%) | 10 (100.0%) |
| Total | 51 (62.2%) | 57 (69.5%) |
Disability Status by Sex by Age in Stonyford
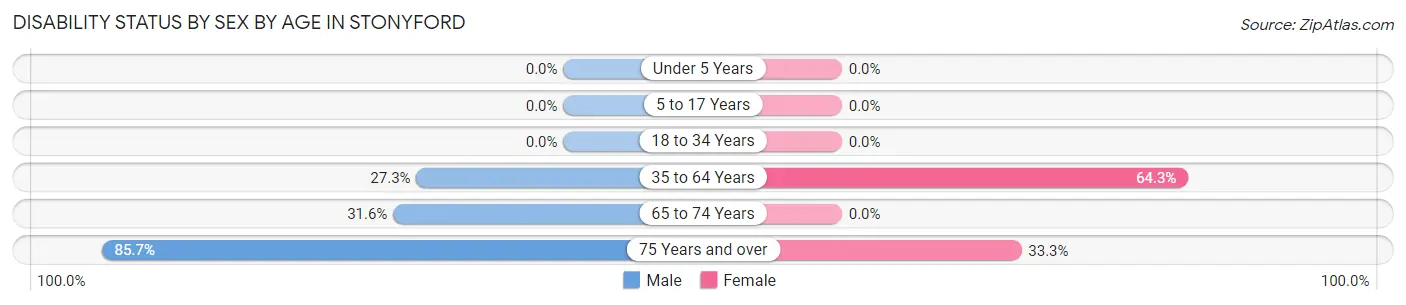
| Age Bracket | Male | Female |
| Under 5 Years | 0 (0.0%) | 0 (0.0%) |
| 5 to 17 Years | 0 (0.0%) | 0 (0.0%) |
| 18 to 34 Years | 0 (0.0%) | 0 (0.0%) |
| 35 to 64 Years | 6 (27.3%) | 9 (64.3%) |
| 65 to 74 Years | 6 (31.6%) | 0 (0.0%) |
| 75 Years and over | 6 (85.7%) | 1 (33.3%) |
Disability Class by Sex by Age in Stonyford
Disability Class: Hearing Difficulty
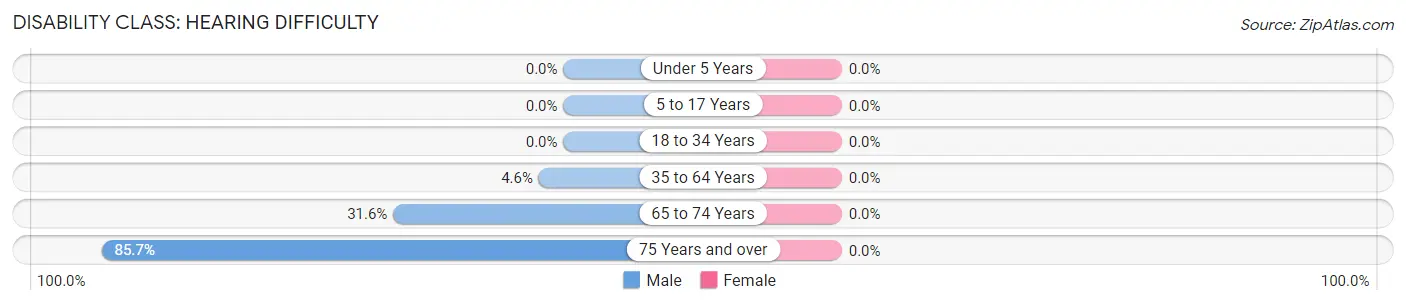
| Age Bracket | Male | Female |
| Under 5 Years | 0 (0.0%) | 0 (0.0%) |
| 5 to 17 Years | 0 (0.0%) | 0 (0.0%) |
| 18 to 34 Years | 0 (0.0%) | 0 (0.0%) |
| 35 to 64 Years | 1 (4.5%) | 0 (0.0%) |
| 65 to 74 Years | 6 (31.6%) | 0 (0.0%) |
| 75 Years and over | 6 (85.7%) | 0 (0.0%) |
Disability Class: Vision Difficulty
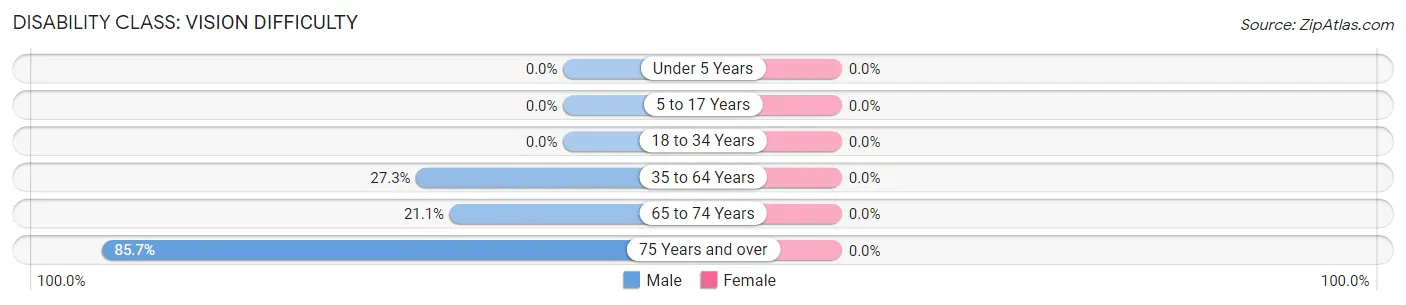
| Age Bracket | Male | Female |
| Under 5 Years | 0 (0.0%) | 0 (0.0%) |
| 5 to 17 Years | 0 (0.0%) | 0 (0.0%) |
| 18 to 34 Years | 0 (0.0%) | 0 (0.0%) |
| 35 to 64 Years | 6 (27.3%) | 0 (0.0%) |
| 65 to 74 Years | 4 (21.0%) | 0 (0.0%) |
| 75 Years and over | 6 (85.7%) | 0 (0.0%) |
Disability Class: Cognitive Difficulty
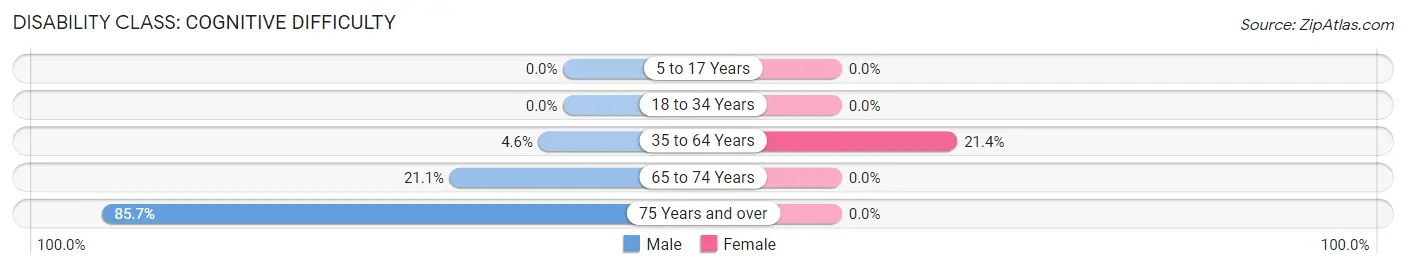
| Age Bracket | Male | Female |
| 5 to 17 Years | 0 (0.0%) | 0 (0.0%) |
| 18 to 34 Years | 0 (0.0%) | 0 (0.0%) |
| 35 to 64 Years | 1 (4.5%) | 3 (21.4%) |
| 65 to 74 Years | 4 (21.0%) | 0 (0.0%) |
| 75 Years and over | 6 (85.7%) | 0 (0.0%) |
Disability Class: Ambulatory Difficulty
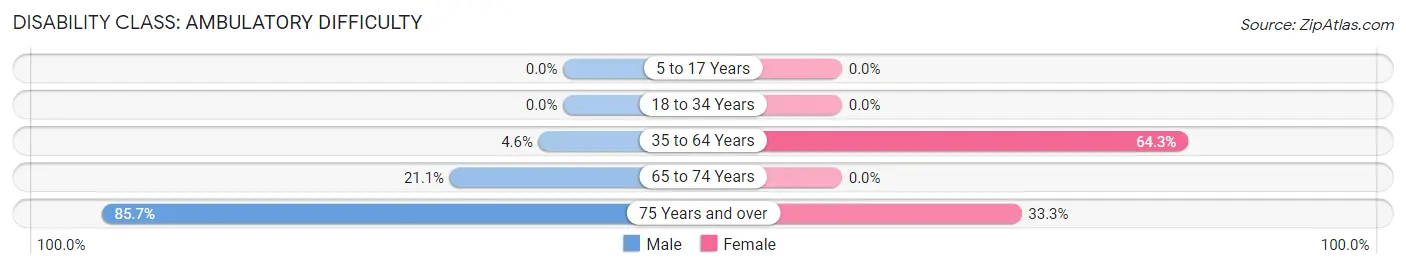
| Age Bracket | Male | Female |
| 5 to 17 Years | 0 (0.0%) | 0 (0.0%) |
| 18 to 34 Years | 0 (0.0%) | 0 (0.0%) |
| 35 to 64 Years | 1 (4.5%) | 9 (64.3%) |
| 65 to 74 Years | 4 (21.0%) | 0 (0.0%) |
| 75 Years and over | 6 (85.7%) | 1 (33.3%) |
Disability Class: Self-Care Difficulty
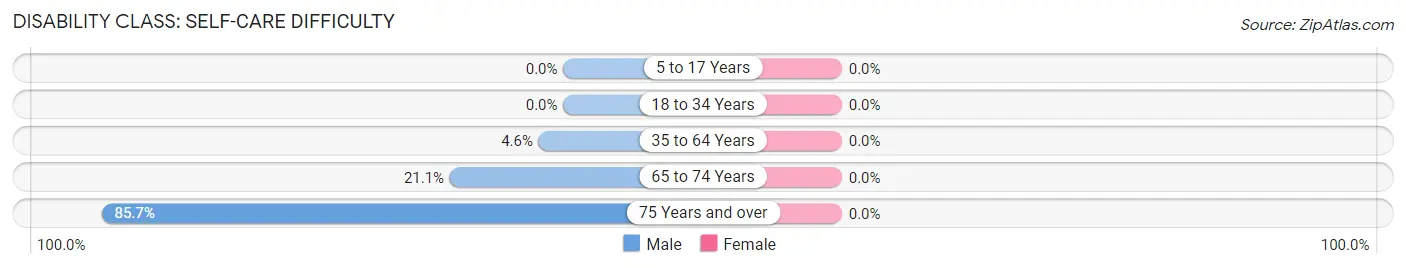
| Age Bracket | Male | Female |
| 5 to 17 Years | 0 (0.0%) | 0 (0.0%) |
| 18 to 34 Years | 0 (0.0%) | 0 (0.0%) |
| 35 to 64 Years | 1 (4.5%) | 0 (0.0%) |
| 65 to 74 Years | 4 (21.0%) | 0 (0.0%) |
| 75 Years and over | 6 (85.7%) | 0 (0.0%) |
Technology Access in Stonyford
Computing Device Access in Stonyford
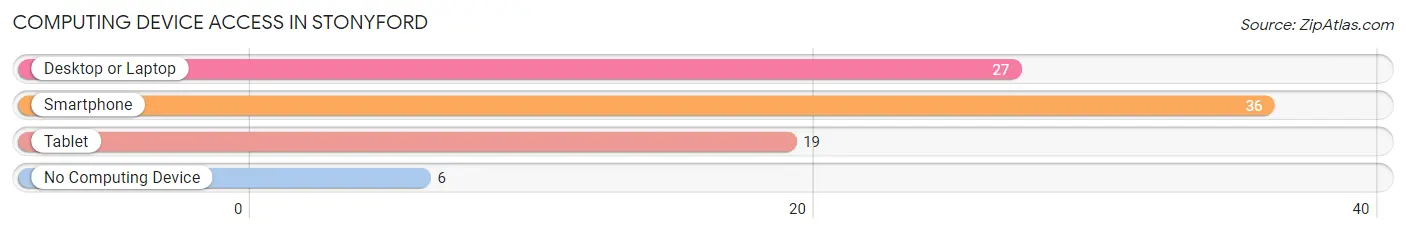
| Device Type | # Households | % Households |
| Desktop or Laptop | 27 | 61.4% |
| Smartphone | 36 | 81.8% |
| Tablet | 19 | 43.2% |
| No Computing Device | 6 | 13.6% |
| Total | 44 | 100.0% |
Internet Access in Stonyford
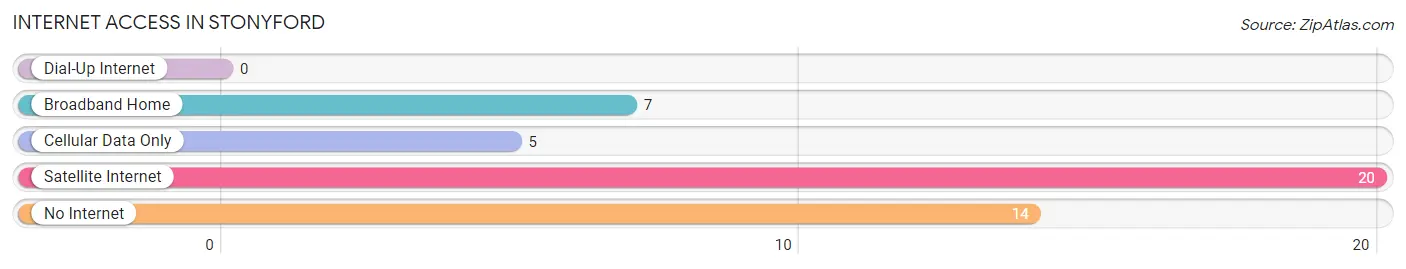
| Internet Type | # Households | % Households |
| Dial-Up Internet | 0 | 0.0% |
| Broadband Home | 7 | 15.9% |
| Cellular Data Only | 5 | 11.4% |
| Satellite Internet | 20 | 45.5% |
| No Internet | 14 | 31.8% |
| Total | 44 | 100.0% |
Stonyford Summary
Stonyford is a small unincorporated community located in Colusa County, California. It is situated in the foothills of the Coast Range Mountains, approximately 20 miles northwest of the county seat of Colusa. The population of Stonyford was estimated to be around 200 in 2020.
History
Stonyford was founded in 1858 by a group of settlers from the Midwest. The settlers were attracted to the area by the abundance of natural resources, including timber, water, and fertile soil. The town was named after the nearby Stony Creek, which was named for the rocky terrain of the area.
The first post office in Stonyford was established in 1859. The town quickly grew and by the late 1800s, it had become a thriving agricultural community. The town was home to several businesses, including a general store, a blacksmith shop, a hotel, and a saloon.
In the early 1900s, Stonyford was a popular destination for tourists. The town was known for its scenic beauty and its abundance of outdoor activities, such as fishing, hunting, and camping.
Geography
Stonyford is located in the foothills of the Coast Range Mountains, approximately 20 miles northwest of the county seat of Colusa. The town is situated at an elevation of 1,400 feet above sea level. The climate in Stonyford is generally mild, with temperatures ranging from the mid-50s in the winter to the mid-90s in the summer.
The town is surrounded by rolling hills and open grasslands. The nearby Stony Creek provides a source of water for the town and its surrounding area.
Economy
Stonyford’s economy is largely based on agriculture. The town is home to several farms, which produce a variety of crops, including wheat, corn, and hay. The town is also home to several small businesses, including a general store, a gas station, and a restaurant.
Demographics
As of 2020, the population of Stonyford was estimated to be around 200. The town is predominantly white, with a small Hispanic population. The median household income in Stonyford is $45,000, and the median home value is $150,000.
Conclusion
Stonyford is a small unincorporated community located in Colusa County, California. It is situated in the foothills of the Coast Range Mountains, approximately 20 miles northwest of the county seat of Colusa. The population of Stonyford was estimated to be around 200 in 2020. The town’s economy is largely based on agriculture, and it is home to several small businesses. The town is predominantly white, with a small Hispanic population. Stonyford is a popular destination for tourists due to its scenic beauty and abundance of outdoor activities.
Common Questions
What is Per Capita Income in Stonyford?
Per Capita income in Stonyford is $34,052.
What is Inequality or Gini Index in Stonyford?
Inequality or Gini Index in Stonyford is 0.48.
What is the Total Population of Stonyford?
Total Population of Stonyford is 82.
What is the Total Male Population of Stonyford?
Total Male Population of Stonyford is 57.
What is the Total Female Population of Stonyford?
Total Female Population of Stonyford is 25.
What is the Ratio of Males per 100 Females in Stonyford?
There are 228.00 Males per 100 Females in Stonyford.
What is the Ratio of Females per 100 Males in Stonyford?
There are 43.86 Females per 100 Males in Stonyford.
What is the Median Population Age in Stonyford?
Median Population Age in Stonyford is 54.7 Years.
What is the Average Family Size in Stonyford
Average Family Size in Stonyford is 2.1 People.
What is the Average Household Size in Stonyford
Average Household Size in Stonyford is 1.8 People.
How Large is the Labor Force in Stonyford?
There are 16 People in the Labor Forcein in Stonyford.
What is the Percentage of People in the Labor Force in Stonyford?
20.8% of People are in the Labor Force in Stonyford.
What is the Unemployment Rate in Stonyford?
Unemployment Rate in Stonyford is 25.0%.