Rollingwood, CA Map & Demographics
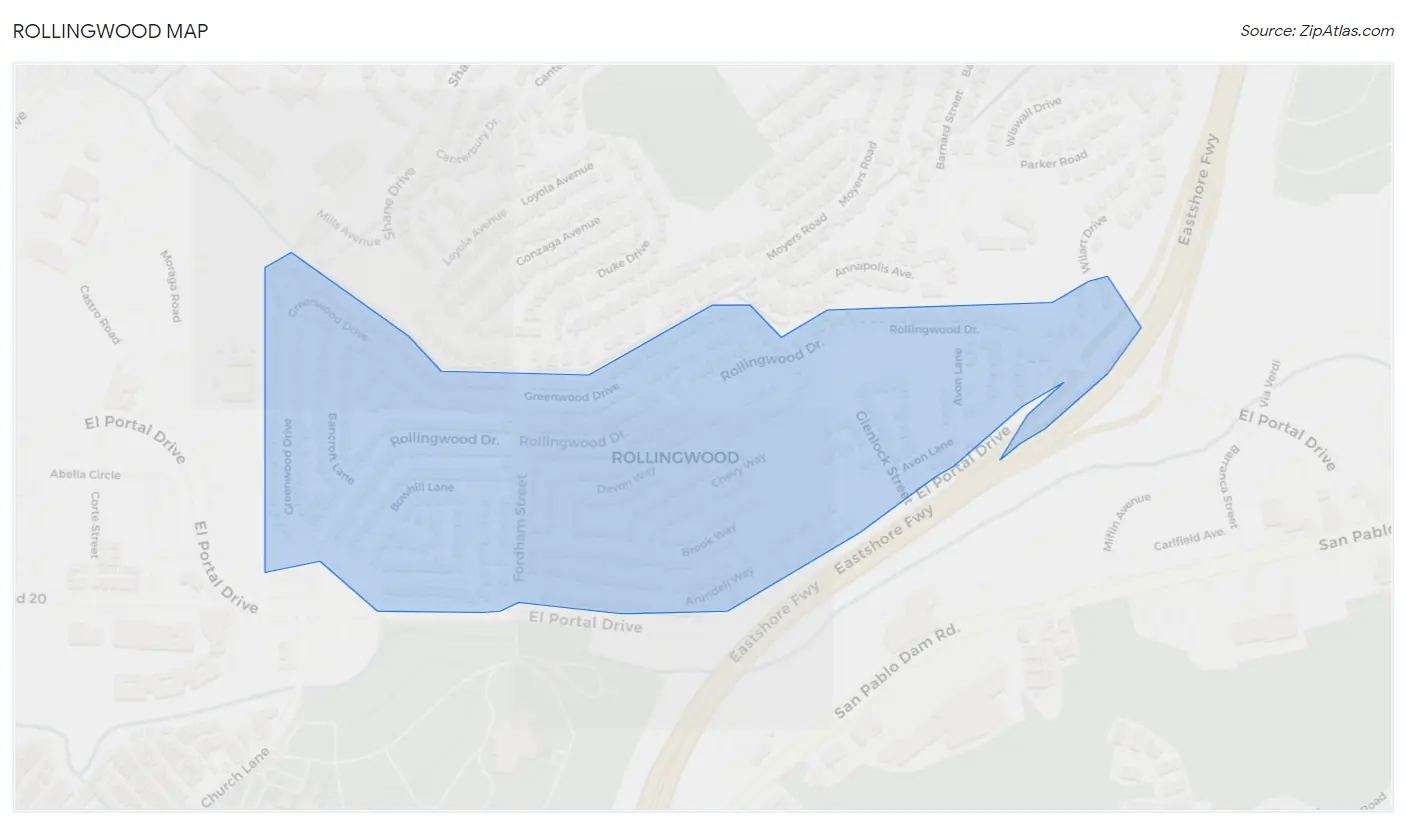
Rollingwood Map
Rollingwood Overview
$29,249
PER CAPITA INCOME
$97,176
AVG FAMILY INCOME
$106,786
AVG HOUSEHOLD INCOME
29.1%
WAGE / INCOME GAP [ % ]
70.9¢/ $1
WAGE / INCOME GAP [ $ ]
0.35
INEQUALITY / GINI INDEX
3,483
TOTAL POPULATION
1,764
MALE POPULATION
1,719
FEMALE POPULATION
102.62
MALES / 100 FEMALES
97.45
FEMALES / 100 MALES
36.5
MEDIAN AGE
4.5
AVG FAMILY SIZE
4.0
AVG HOUSEHOLD SIZE
1,839
LABOR FORCE [ PEOPLE ]
66.6%
PERCENT IN LABOR FORCE
12.6%
UNEMPLOYMENT RATE
Income in Rollingwood
Income Overview in Rollingwood
Per Capita Income in Rollingwood is $29,249, while median incomes of families and households are $97,176 and $106,786 respectively.
| Characteristic | Number | Measure |
| Per Capita Income | 3,483 | $29,249 |
| Median Family Income | 645 | $97,176 |
| Mean Family Income | 645 | $108,973 |
| Median Household Income | 862 | $106,786 |
| Mean Household Income | 862 | $109,463 |
| Income Deficit | 645 | $0 |
| Wage / Income Gap (%) | 3,483 | 29.14% |
| Wage / Income Gap ($) | 3,483 | 70.86¢ per $1 |
| Gini / Inequality Index | 3,483 | 0.35 |
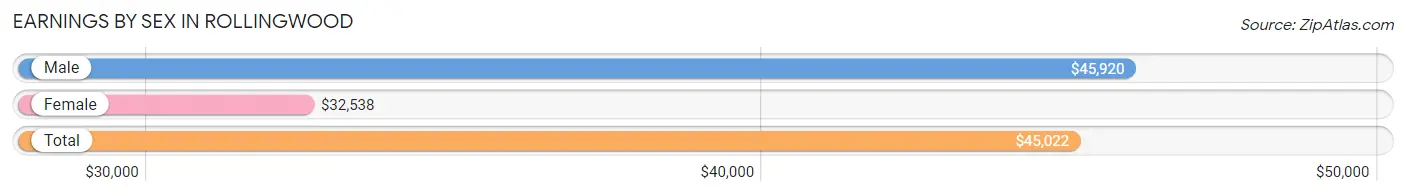
Earnings by Sex in Rollingwood
Average Earnings in Rollingwood are $45,022, $45,920 for men and $32,538 for women, a difference of 29.1%.
| Sex | Number | Average Earnings |
| Male | 1,062 (56.6%) | $45,920 |
| Female | 815 (43.4%) | $32,538 |
| Total | 1,877 (100.0%) | $45,022 |
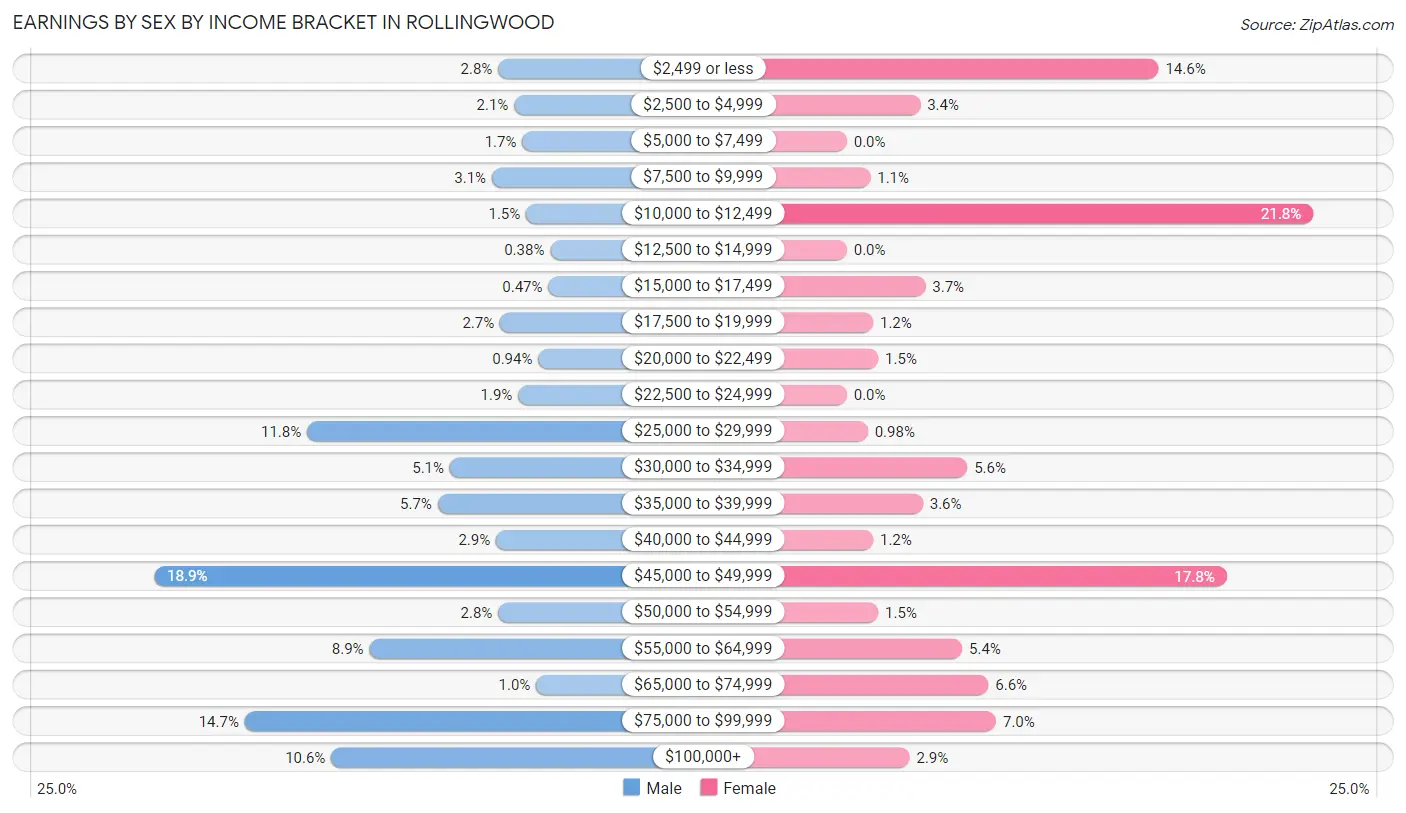
Earnings by Sex by Income Bracket in Rollingwood
The most common earnings brackets in Rollingwood are $45,000 to $49,999 for men (201 | 18.9%) and $10,000 to $12,499 for women (178 | 21.8%).
| Income | Male | Female |
| $2,499 or less | 30 (2.8%) | 119 (14.6%) |
| $2,500 to $4,999 | 22 (2.1%) | 28 (3.4%) |
| $5,000 to $7,499 | 18 (1.7%) | 0 (0.0%) |
| $7,500 to $9,999 | 33 (3.1%) | 9 (1.1%) |
| $10,000 to $12,499 | 16 (1.5%) | 178 (21.8%) |
| $12,500 to $14,999 | 4 (0.4%) | 0 (0.0%) |
| $15,000 to $17,499 | 5 (0.5%) | 30 (3.7%) |
| $17,500 to $19,999 | 29 (2.7%) | 10 (1.2%) |
| $20,000 to $22,499 | 10 (0.9%) | 12 (1.5%) |
| $22,500 to $24,999 | 20 (1.9%) | 0 (0.0%) |
| $25,000 to $29,999 | 125 (11.8%) | 8 (1.0%) |
| $30,000 to $34,999 | 54 (5.1%) | 46 (5.6%) |
| $35,000 to $39,999 | 60 (5.7%) | 29 (3.6%) |
| $40,000 to $44,999 | 31 (2.9%) | 10 (1.2%) |
| $45,000 to $49,999 | 201 (18.9%) | 145 (17.8%) |
| $50,000 to $54,999 | 30 (2.8%) | 12 (1.5%) |
| $55,000 to $64,999 | 94 (8.8%) | 44 (5.4%) |
| $65,000 to $74,999 | 11 (1.0%) | 54 (6.6%) |
| $75,000 to $99,999 | 156 (14.7%) | 57 (7.0%) |
| $100,000+ | 113 (10.6%) | 24 (2.9%) |
| Total | 1,062 (100.0%) | 815 (100.0%) |
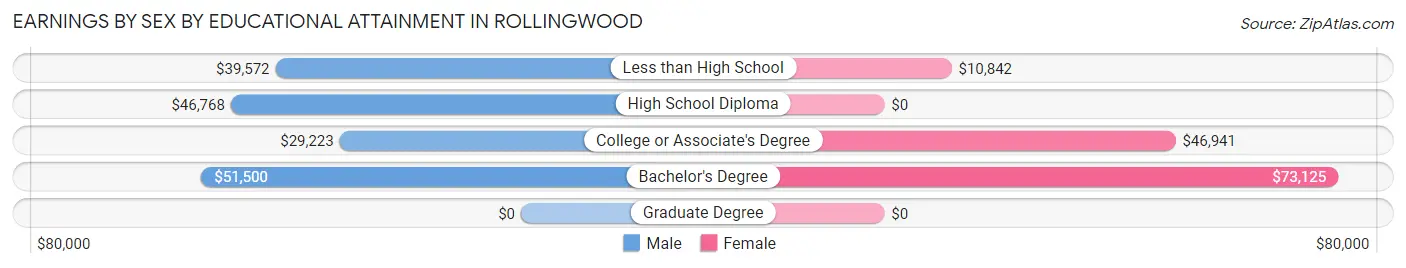
Earnings by Sex by Educational Attainment in Rollingwood
| Educational Attainment | Male Income | Female Income |
| Less than High School | $39,572 | $10,842 |
| High School Diploma | $46,768 | $0 |
| College or Associate's Degree | $29,223 | $46,941 |
| Bachelor's Degree | $51,500 | $73,125 |
| Graduate Degree | - | - |
| Total | $46,685 | $0 |
Family Income in Rollingwood
Family Income Brackets in Rollingwood
According to the Rollingwood family income data, there are 157 families falling into the $100,000 to $149,999 income range, which is the most common income bracket and makes up 24.3% of all families. Conversely, the $25,000 to $34,999 income bracket is the least frequent group with only 7 families (1.1%) belonging to this category.
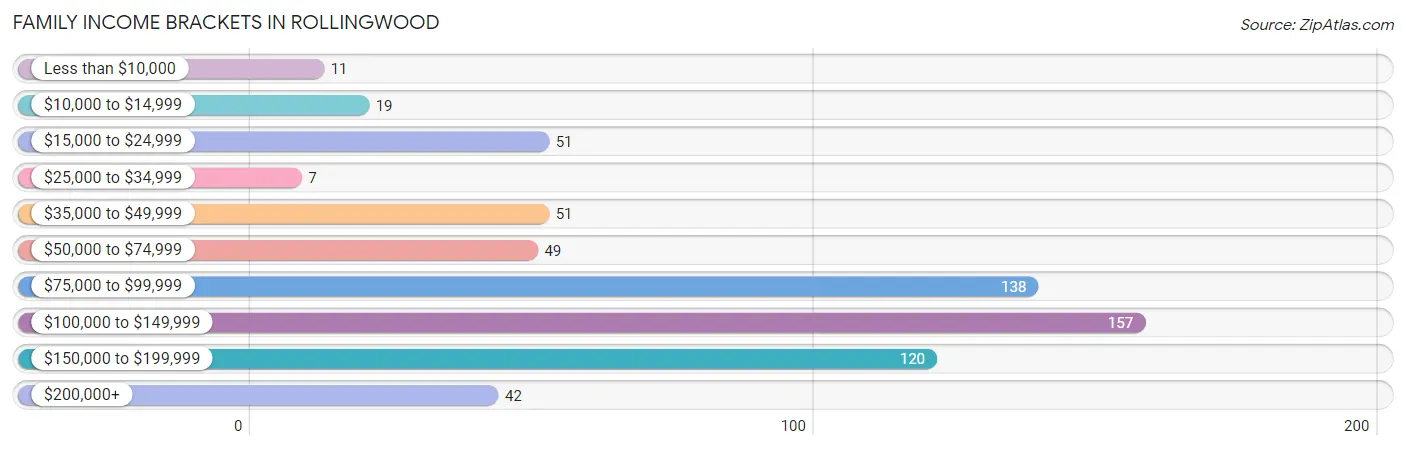
| Income Bracket | # Families | % Families |
| Less than $10,000 | 11 | 1.7% |
| $10,000 to $14,999 | 19 | 2.9% |
| $15,000 to $24,999 | 51 | 7.9% |
| $25,000 to $34,999 | 7 | 1.1% |
| $35,000 to $49,999 | 51 | 7.9% |
| $50,000 to $74,999 | 49 | 7.6% |
| $75,000 to $99,999 | 138 | 21.4% |
| $100,000 to $149,999 | 157 | 24.3% |
| $150,000 to $199,999 | 120 | 18.6% |
| $200,000+ | 42 | 6.5% |
Family Income by Famaliy Size in Rollingwood
5-person families (169 | 26.2%) account for the highest median family income in Rollingwood with $132,279 per family, while 2-person families (114 | 17.7%) have the highest median income of $41,992 per family member.
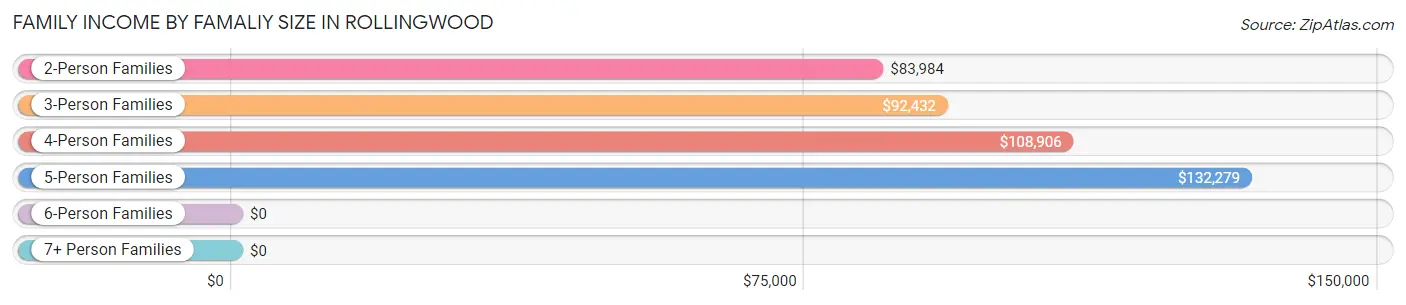
| Income Bracket | # Families | Median Income |
| 2-Person Families | 114 (17.7%) | $83,984 |
| 3-Person Families | 128 (19.8%) | $92,432 |
| 4-Person Families | 136 (21.1%) | $108,906 |
| 5-Person Families | 169 (26.2%) | $132,279 |
| 6-Person Families | 25 (3.9%) | $0 |
| 7+ Person Families | 73 (11.3%) | $0 |
| Total | 645 (100.0%) | $97,176 |
Family Income by Number of Earners in Rollingwood
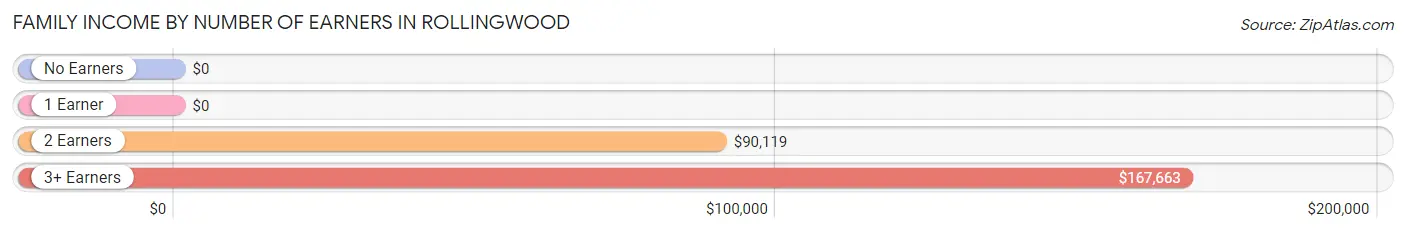
| Number of Earners | # Families | Median Income |
| No Earners | 61 (9.5%) | $0 |
| 1 Earner | 201 (31.2%) | $0 |
| 2 Earners | 158 (24.5%) | $90,119 |
| 3+ Earners | 225 (34.9%) | $167,663 |
| Total | 645 (100.0%) | $97,176 |
Household Income in Rollingwood
Household Income Brackets in Rollingwood
With 208 households falling in the category, the $150,000 to $199,999 income range is the most frequent in Rollingwood, accounting for 24.1% of all households. In contrast, only 7 households (0.8%) fall into the $25,000 to $34,999 income bracket, making it the least populous group.
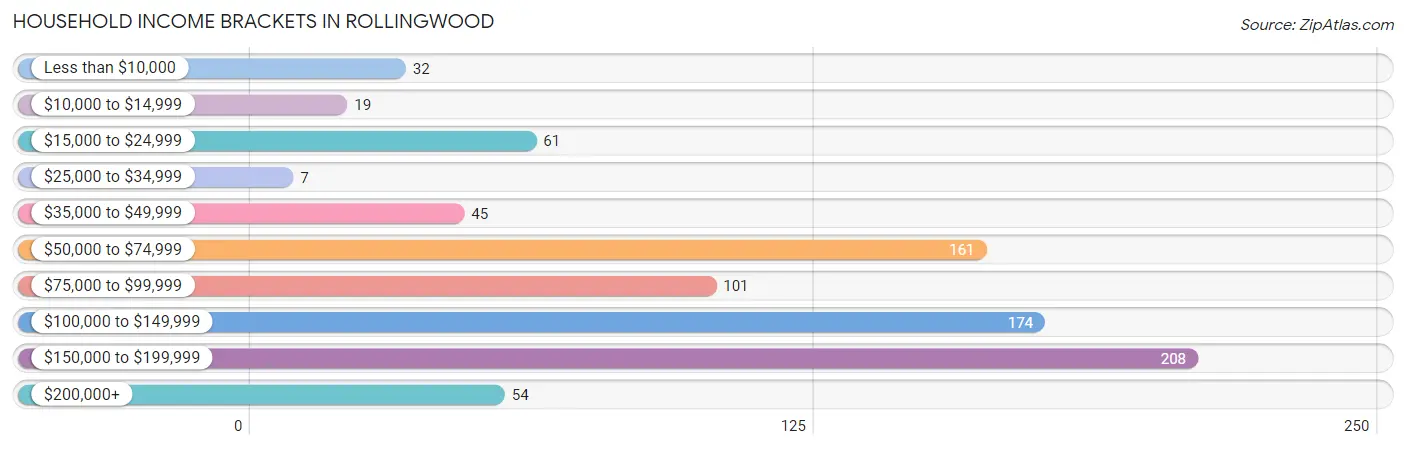
| Income Bracket | # Households | % Households |
| Less than $10,000 | 32 | 3.7% |
| $10,000 to $14,999 | 19 | 2.2% |
| $15,000 to $24,999 | 61 | 7.1% |
| $25,000 to $34,999 | 7 | 0.8% |
| $35,000 to $49,999 | 45 | 5.2% |
| $50,000 to $74,999 | 161 | 18.7% |
| $75,000 to $99,999 | 101 | 11.7% |
| $100,000 to $149,999 | 174 | 20.2% |
| $150,000 to $199,999 | 208 | 24.1% |
| $200,000+ | 54 | 6.3% |
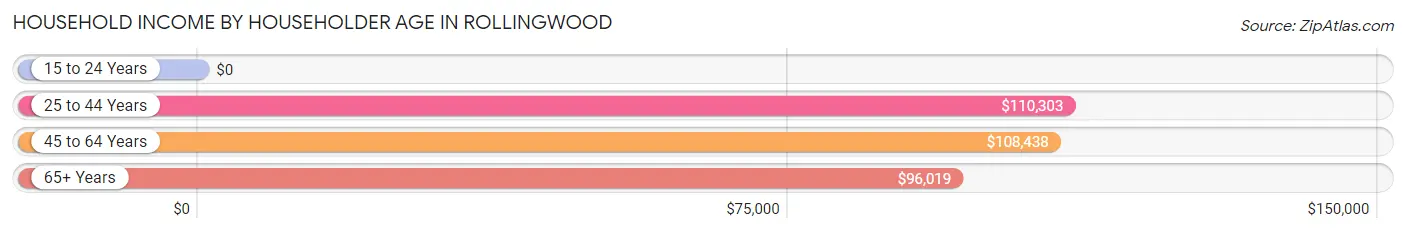
Household Income by Householder Age in Rollingwood
The median household income in Rollingwood is $106,786, with the highest median household income of $110,303 found in the 25 to 44 years age bracket for the primary householder. A total of 280 households (32.5%) fall into this category. Meanwhile, the 15 to 24 years age bracket for the primary householder has the lowest median household income of $0, with 8 households (0.9%) in this group.
| Income Bracket | # Households | Median Income |
| 15 to 24 Years | 8 (0.9%) | $0 |
| 25 to 44 Years | 280 (32.5%) | $110,303 |
| 45 to 64 Years | 456 (52.9%) | $108,438 |
| 65+ Years | 118 (13.7%) | $96,019 |
| Total | 862 (100.0%) | $106,786 |
Poverty in Rollingwood
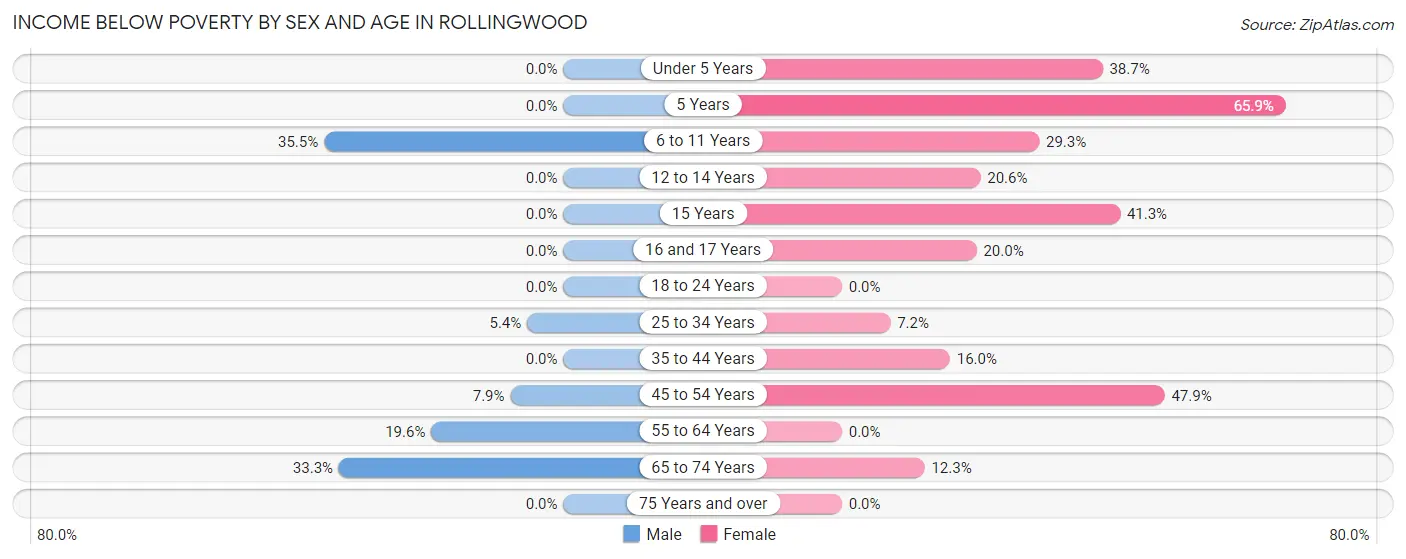
Income Below Poverty by Sex and Age in Rollingwood
With 9.4% poverty level for males and 21.3% for females among the residents of Rollingwood, 6 to 11 year old males and 5 year old females are the most vulnerable to poverty, with 54 males (35.5%) and 29 females (65.9%) in their respective age groups living below the poverty level.
| Age Bracket | Male | Female |
| Under 5 Years | 0 (0.0%) | 12 (38.7%) |
| 5 Years | 0 (0.0%) | 29 (65.9%) |
| 6 to 11 Years | 54 (35.5%) | 29 (29.3%) |
| 12 to 14 Years | 0 (0.0%) | 29 (20.6%) |
| 15 Years | 0 (0.0%) | 19 (41.3%) |
| 16 and 17 Years | 0 (0.0%) | 19 (20.0%) |
| 18 to 24 Years | 0 (0.0%) | 0 (0.0%) |
| 25 to 34 Years | 14 (5.4%) | 10 (7.2%) |
| 35 to 44 Years | 0 (0.0%) | 30 (16.0%) |
| 45 to 54 Years | 21 (7.9%) | 173 (47.9%) |
| 55 to 64 Years | 51 (19.6%) | 0 (0.0%) |
| 65 to 74 Years | 25 (33.3%) | 14 (12.3%) |
| 75 Years and over | 0 (0.0%) | 0 (0.0%) |
| Total | 165 (9.4%) | 364 (21.3%) |
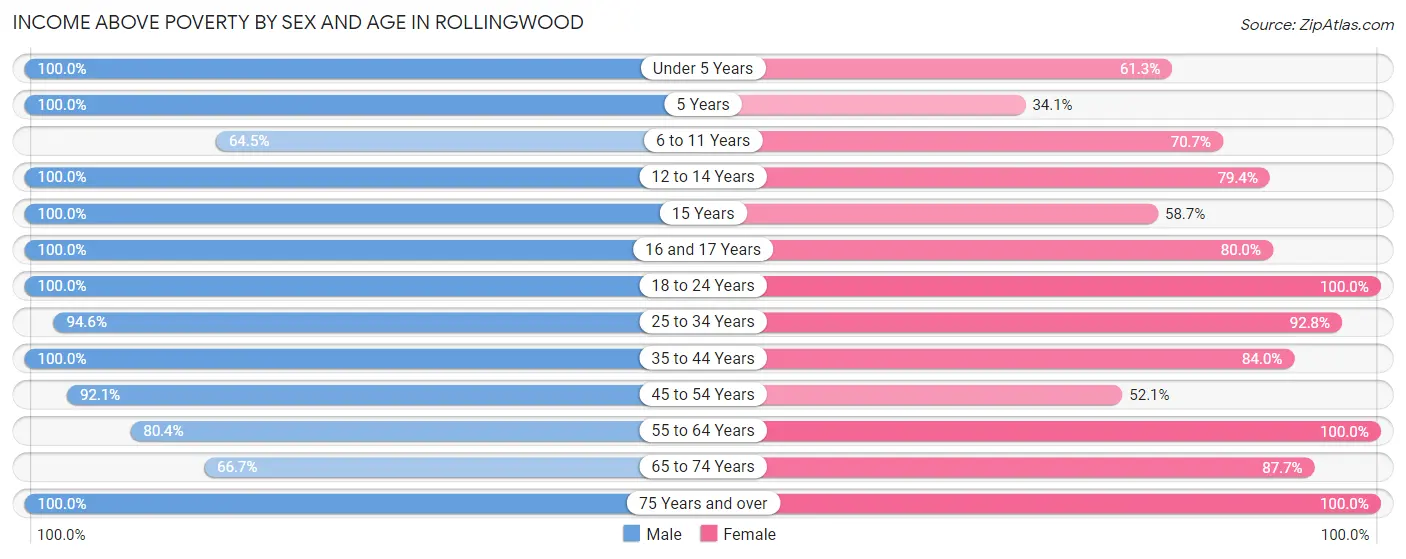
Income Above Poverty by Sex and Age in Rollingwood
According to the poverty statistics in Rollingwood, males aged under 5 years and females aged 18 to 24 years are the age groups that are most secure financially, with 100.0% of males and 100.0% of females in these age groups living above the poverty line.
| Age Bracket | Male | Female |
| Under 5 Years | 16 (100.0%) | 19 (61.3%) |
| 5 Years | 6 (100.0%) | 15 (34.1%) |
| 6 to 11 Years | 98 (64.5%) | 70 (70.7%) |
| 12 to 14 Years | 137 (100.0%) | 112 (79.4%) |
| 15 Years | 36 (100.0%) | 27 (58.7%) |
| 16 and 17 Years | 63 (100.0%) | 76 (80.0%) |
| 18 to 24 Years | 147 (100.0%) | 213 (100.0%) |
| 25 to 34 Years | 246 (94.6%) | 129 (92.8%) |
| 35 to 44 Years | 296 (100.0%) | 157 (84.0%) |
| 45 to 54 Years | 246 (92.1%) | 188 (52.1%) |
| 55 to 64 Years | 209 (80.4%) | 190 (100.0%) |
| 65 to 74 Years | 50 (66.7%) | 100 (87.7%) |
| 75 Years and over | 32 (100.0%) | 52 (100.0%) |
| Total | 1,582 (90.6%) | 1,348 (78.7%) |
Income Below Poverty Among Married-Couple Families in Rollingwood
The poverty statistics for married-couple families in Rollingwood show that 6.1% or 29 of the total 478 families live below the poverty line. Families with 5 or more children have the highest poverty rate of 100.0%, comprising of 29 families. On the other hand, families with no children have the lowest poverty rate of 0.0%, which includes 0 families.

| Children | Above Poverty | Below Poverty |
| No Children | 129 (100.0%) | 0 (0.0%) |
| 1 or 2 Children | 252 (100.0%) | 0 (0.0%) |
| 3 or 4 Children | 68 (100.0%) | 0 (0.0%) |
| 5 or more Children | 0 (0.0%) | 29 (100.0%) |
| Total | 449 (93.9%) | 29 (6.1%) |
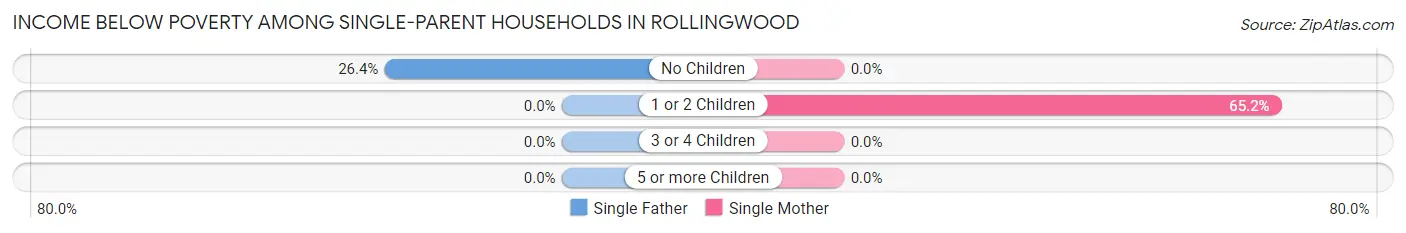
Income Below Poverty Among Single-Parent Households in Rollingwood
According to the poverty data in Rollingwood, 21.9% or 14 single-father households and 29.1% or 30 single-mother households are living below the poverty line. Among single-father households, those with no children have the highest poverty rate, with 14 households (26.4%) experiencing poverty. Likewise, among single-mother households, those with 1 or 2 children have the highest poverty rate, with 30 households (65.2%) falling below the poverty line.
| Children | Single Father | Single Mother |
| No Children | 14 (26.4%) | 0 (0.0%) |
| 1 or 2 Children | 0 (0.0%) | 30 (65.2%) |
| 3 or 4 Children | 0 (0.0%) | 0 (0.0%) |
| 5 or more Children | 0 (0.0%) | 0 (0.0%) |
| Total | 14 (21.9%) | 30 (29.1%) |
Income Below Poverty Among Married-Couple vs Single-Parent Households in Rollingwood
The poverty data for Rollingwood shows that 29 of the married-couple family households (6.1%) and 44 of the single-parent households (26.4%) are living below the poverty level. Within the married-couple family households, those with 5 or more children have the highest poverty rate, with 29 households (100.0%) falling below the poverty line. Among the single-parent households, those with 1 or 2 children have the highest poverty rate, with 30 household (52.6%) living below poverty.
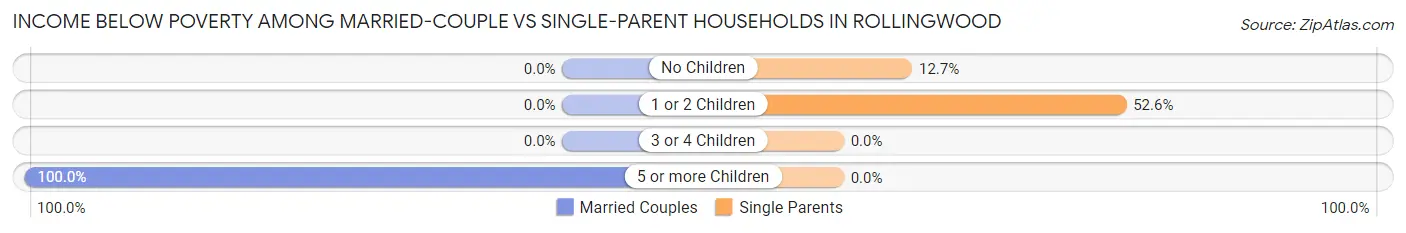
| Children | Married-Couple Families | Single-Parent Households |
| No Children | 0 (0.0%) | 14 (12.7%) |
| 1 or 2 Children | 0 (0.0%) | 30 (52.6%) |
| 3 or 4 Children | 0 (0.0%) | 0 (0.0%) |
| 5 or more Children | 29 (100.0%) | 0 (0.0%) |
| Total | 29 (6.1%) | 44 (26.4%) |
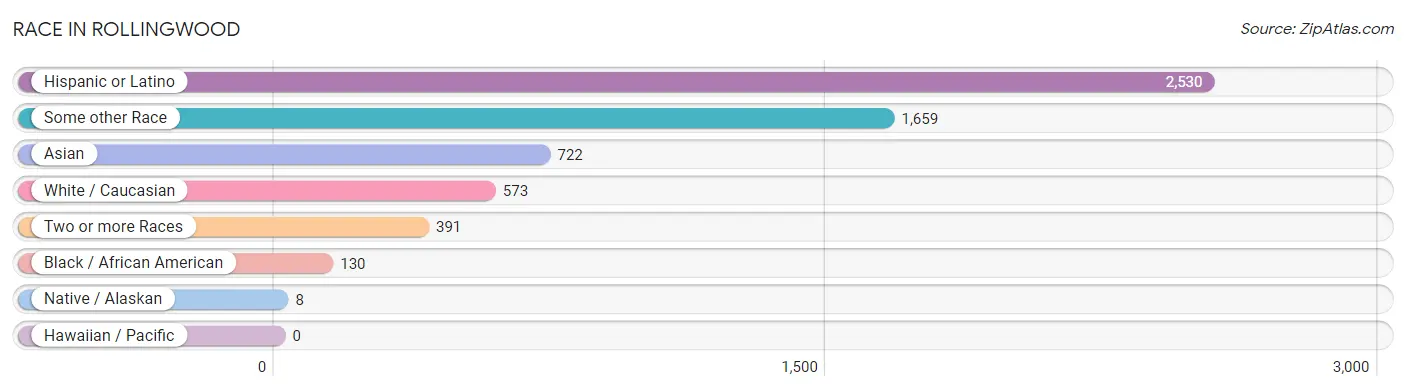
Race in Rollingwood
The most populous races in Rollingwood are Hispanic or Latino (2,530 | 72.6%), Some other Race (1,659 | 47.6%), and Asian (722 | 20.7%).
| Race | # Population | % Population |
| Asian | 722 | 20.7% |
| Black / African American | 130 | 3.7% |
| Hawaiian / Pacific | 0 | 0.0% |
| Hispanic or Latino | 2,530 | 72.6% |
| Native / Alaskan | 8 | 0.2% |
| White / Caucasian | 573 | 16.5% |
| Two or more Races | 391 | 11.2% |
| Some other Race | 1,659 | 47.6% |
| Total | 3,483 | 100.0% |
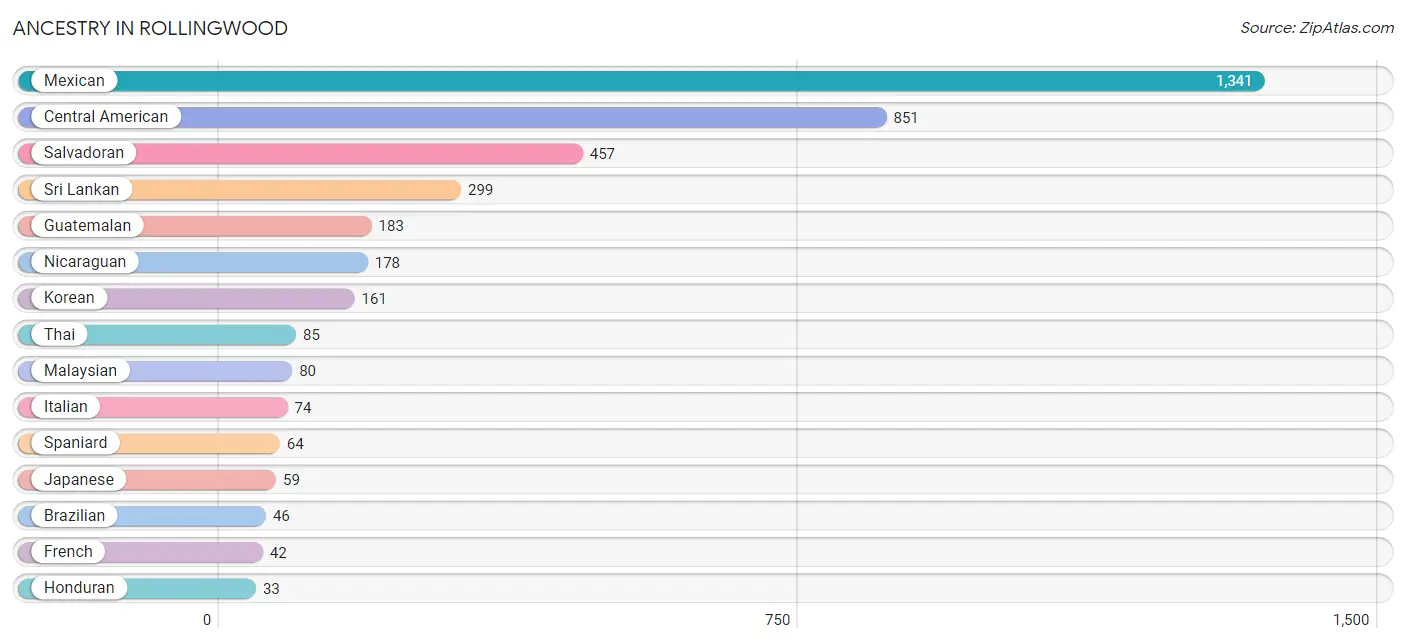
Ancestry in Rollingwood
The most populous ancestries reported in Rollingwood are Mexican (1,341 | 38.5%), Central American (851 | 24.4%), Salvadoran (457 | 13.1%), Sri Lankan (299 | 8.6%), and Guatemalan (183 | 5.2%), together accounting for 89.9% of all Rollingwood residents.
| Ancestry | # Population | % Population |
| American | 21 | 0.6% |
| Bhutanese | 1 | 0.0% |
| Brazilian | 46 | 1.3% |
| Burmese | 12 | 0.3% |
| Central American | 851 | 24.4% |
| Central American Indian | 14 | 0.4% |
| Cherokee | 10 | 0.3% |
| English | 10 | 0.3% |
| French | 42 | 1.2% |
| German | 28 | 0.8% |
| Guatemalan | 183 | 5.2% |
| Honduran | 33 | 0.9% |
| Irish | 11 | 0.3% |
| Italian | 74 | 2.1% |
| Japanese | 59 | 1.7% |
| Korean | 161 | 4.6% |
| Lithuanian | 10 | 0.3% |
| Malaysian | 80 | 2.3% |
| Mexican | 1,341 | 38.5% |
| Mexican American Indian | 22 | 0.6% |
| Nicaraguan | 178 | 5.1% |
| Puerto Rican | 20 | 0.6% |
| Salvadoran | 457 | 13.1% |
| Spaniard | 64 | 1.8% |
| Sri Lankan | 299 | 8.6% |
| Thai | 85 | 2.4% | View All 26 Rows |
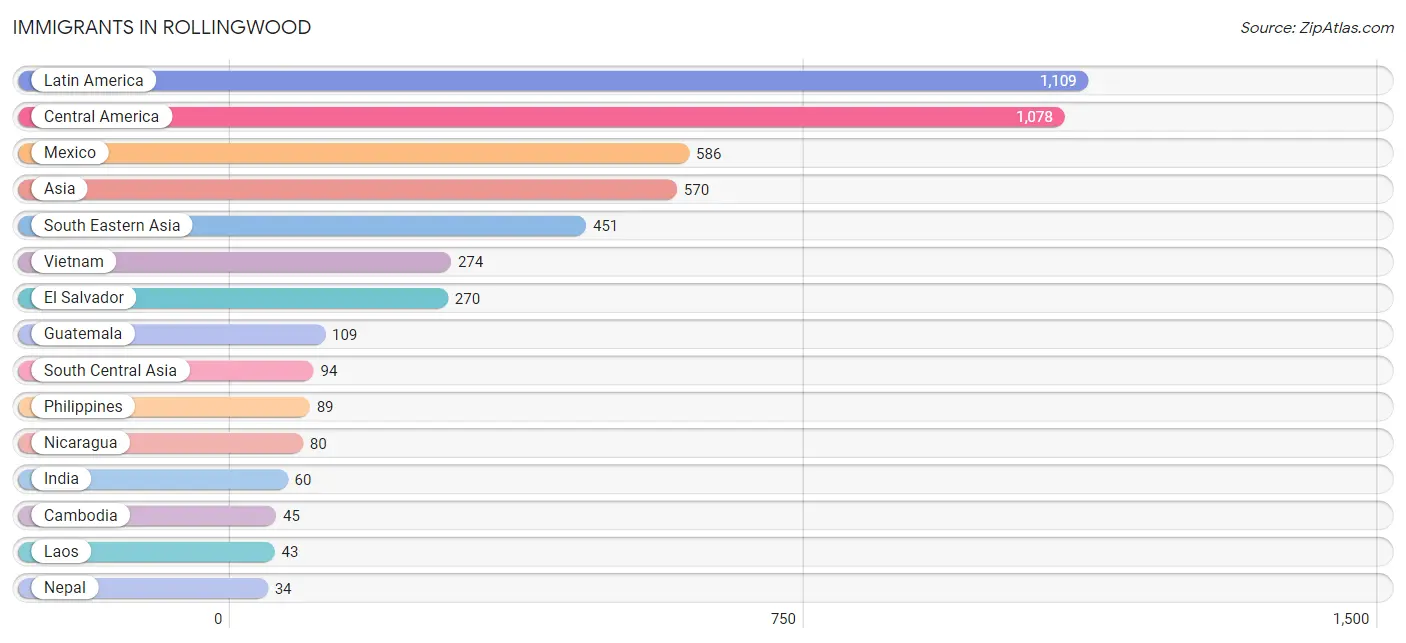
Immigrants in Rollingwood
The most numerous immigrant groups reported in Rollingwood came from Latin America (1,109 | 31.8%), Central America (1,078 | 30.9%), Mexico (586 | 16.8%), Asia (570 | 16.4%), and South Eastern Asia (451 | 13.0%), together accounting for 108.9% of all Rollingwood residents.
| Immigration Origin | # Population | % Population |
| Asia | 570 | 16.4% |
| Brazil | 31 | 0.9% |
| Cambodia | 45 | 1.3% |
| Central America | 1,078 | 30.9% |
| China | 25 | 0.7% |
| Eastern Asia | 25 | 0.7% |
| El Salvador | 270 | 7.7% |
| Europe | 17 | 0.5% |
| France | 17 | 0.5% |
| Guatemala | 109 | 3.1% |
| Honduras | 33 | 0.9% |
| India | 60 | 1.7% |
| Laos | 43 | 1.2% |
| Latin America | 1,109 | 31.8% |
| Mexico | 586 | 16.8% |
| Nepal | 34 | 1.0% |
| Nicaragua | 80 | 2.3% |
| Philippines | 89 | 2.6% |
| South America | 31 | 0.9% |
| South Central Asia | 94 | 2.7% |
| South Eastern Asia | 451 | 13.0% |
| Vietnam | 274 | 7.9% |
| Western Europe | 17 | 0.5% | View All 23 Rows |
Sex and Age in Rollingwood
Sex and Age in Rollingwood
The most populous age groups in Rollingwood are 55 to 59 Years (221 | 12.5%) for men and 50 to 54 Years (233 | 13.6%) for women.
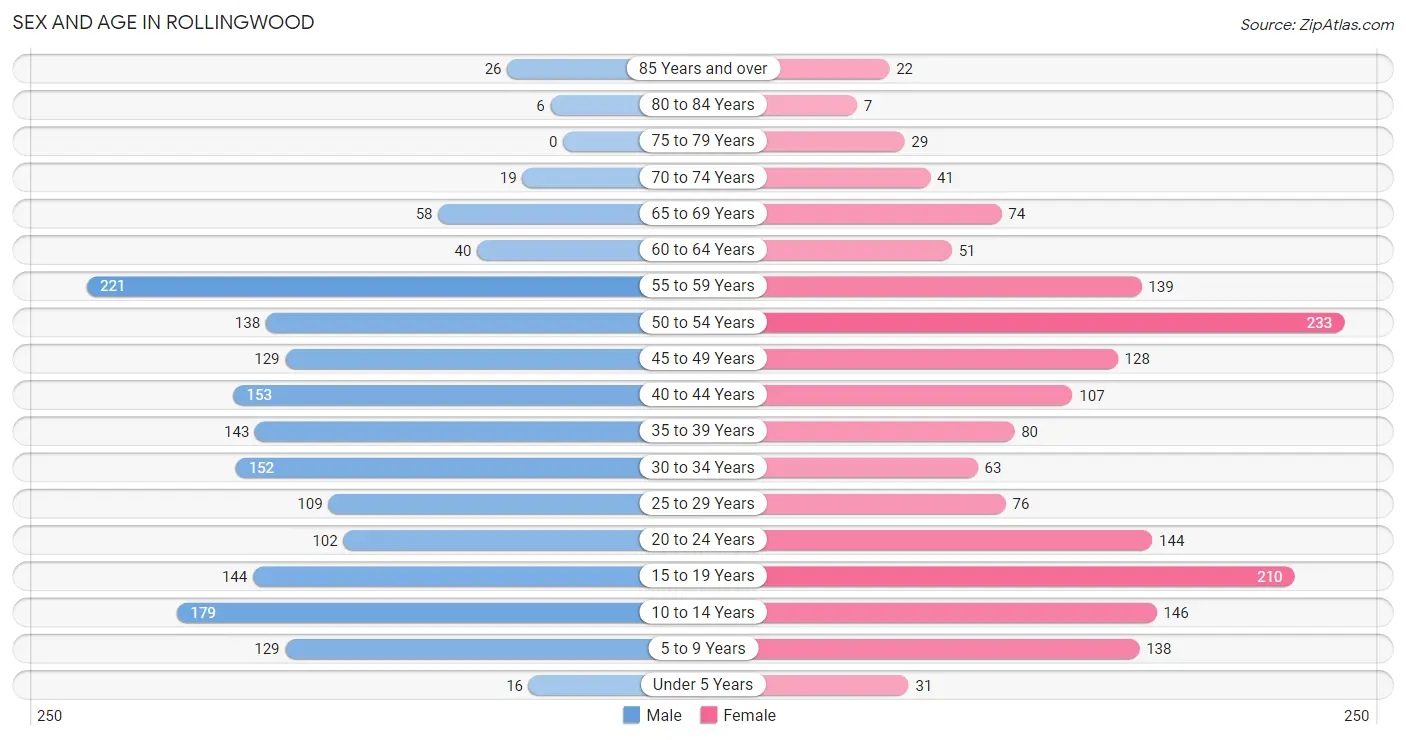
| Age Bracket | Male | Female |
| Under 5 Years | 16 (0.9%) | 31 (1.8%) |
| 5 to 9 Years | 129 (7.3%) | 138 (8.0%) |
| 10 to 14 Years | 179 (10.2%) | 146 (8.5%) |
| 15 to 19 Years | 144 (8.2%) | 210 (12.2%) |
| 20 to 24 Years | 102 (5.8%) | 144 (8.4%) |
| 25 to 29 Years | 109 (6.2%) | 76 (4.4%) |
| 30 to 34 Years | 152 (8.6%) | 63 (3.7%) |
| 35 to 39 Years | 143 (8.1%) | 80 (4.6%) |
| 40 to 44 Years | 153 (8.7%) | 107 (6.2%) |
| 45 to 49 Years | 129 (7.3%) | 128 (7.4%) |
| 50 to 54 Years | 138 (7.8%) | 233 (13.6%) |
| 55 to 59 Years | 221 (12.5%) | 139 (8.1%) |
| 60 to 64 Years | 40 (2.3%) | 51 (3.0%) |
| 65 to 69 Years | 58 (3.3%) | 74 (4.3%) |
| 70 to 74 Years | 19 (1.1%) | 41 (2.4%) |
| 75 to 79 Years | 0 (0.0%) | 29 (1.7%) |
| 80 to 84 Years | 6 (0.3%) | 7 (0.4%) |
| 85 Years and over | 26 (1.5%) | 22 (1.3%) |
| Total | 1,764 (100.0%) | 1,719 (100.0%) |
Families and Households in Rollingwood
Median Family Size in Rollingwood
The median family size in Rollingwood is 4.53 persons per family, with married-couple families (478 | 74.1%) accounting for the largest median family size of 4.99 persons per family. On the other hand, single male/father families (64 | 9.9%) represent the smallest median family size with 2.72 persons per family.
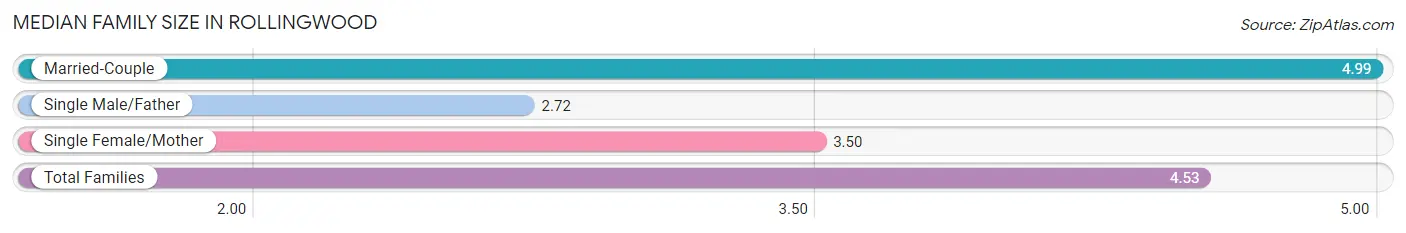
| Family Type | # Families | Family Size |
| Married-Couple | 478 (74.1%) | 4.99 |
| Single Male/Father | 64 (9.9%) | 2.72 |
| Single Female/Mother | 103 (16.0%) | 3.50 |
| Total Families | 645 (100.0%) | 4.53 |
Median Household Size in Rollingwood
The median household size in Rollingwood is 4.03 persons per household, with married-couple households (478 | 55.4%) accounting for the largest median household size of 5 persons per household. non-family households (217 | 25.2%) represent the smallest median household size with 1.88 persons per household.
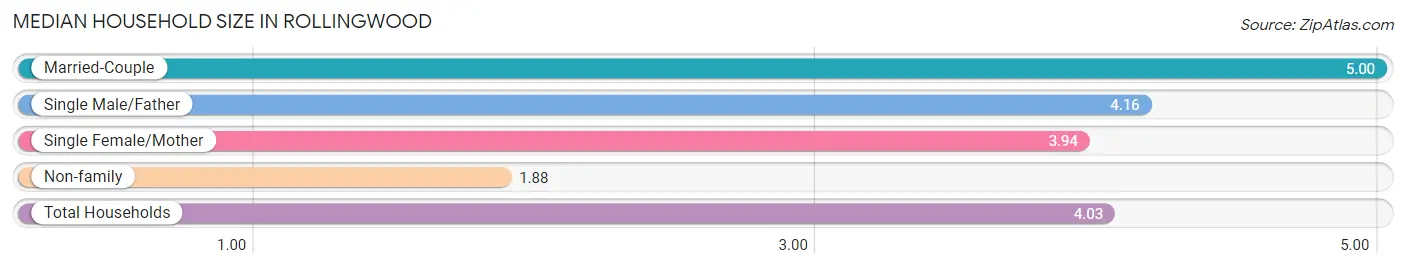
| Household Type | # Households | Household Size |
| Married-Couple | 478 (55.4%) | 5.00 |
| Single Male/Father | 64 (7.4%) | 4.16 |
| Single Female/Mother | 103 (11.9%) | 3.94 |
| Non-family | 217 (25.2%) | 1.88 |
| Total Households | 862 (100.0%) | 4.03 |
Household Size by Marriage Status in Rollingwood
Out of a total of 862 households in Rollingwood, 645 (74.8%) are family households, while 217 (25.2%) are nonfamily households. The most numerous type of family households are 5-person households, comprising 201, and the most common type of nonfamily households are 2-person households, comprising 107.
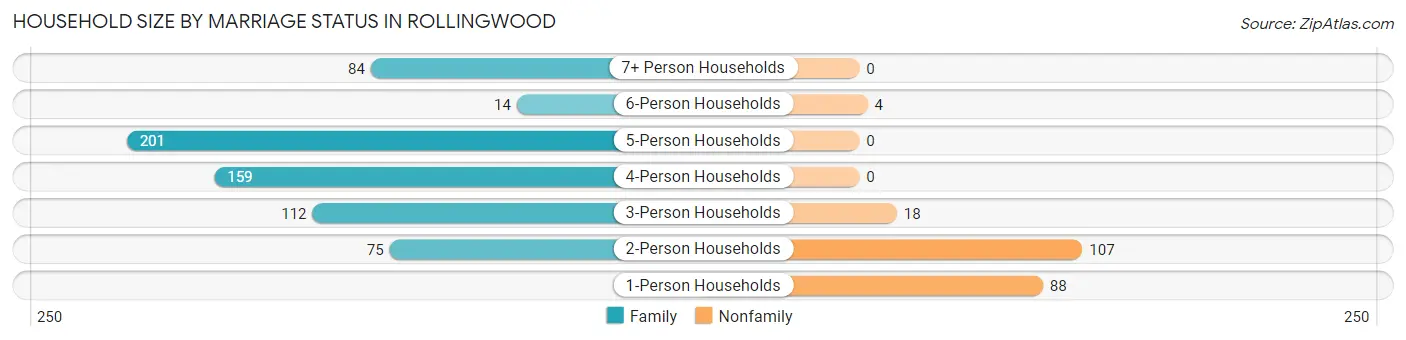
| Household Size | Family Households | Nonfamily Households |
| 1-Person Households | - | 88 (10.2%) |
| 2-Person Households | 75 (8.7%) | 107 (12.4%) |
| 3-Person Households | 112 (13.0%) | 18 (2.1%) |
| 4-Person Households | 159 (18.4%) | 0 (0.0%) |
| 5-Person Households | 201 (23.3%) | 0 (0.0%) |
| 6-Person Households | 14 (1.6%) | 4 (0.5%) |
| 7+ Person Households | 84 (9.7%) | 0 (0.0%) |
| Total | 645 (74.8%) | 217 (25.2%) |
Female Fertility in Rollingwood
Fertility by Age in Rollingwood
Average fertility rate in Rollingwood is 7.0 births per 1,000 women. Women in the age bracket of 20 to 34 years have the highest fertility rate with 25.0 births per 1,000 women. Women in the age bracket of 20 to 34 years acount for 100.0% of all women with births.
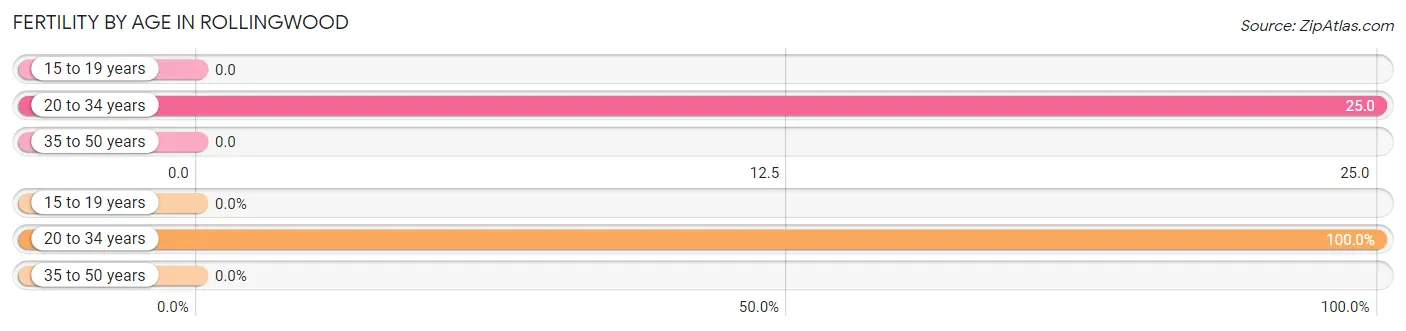
| Age Bracket | Women with Births | Births / 1,000 Women |
| 15 to 19 years | 0 (0.0%) | 0.0 |
| 20 to 34 years | 7 (100.0%) | 25.0 |
| 35 to 50 years | 0 (0.0%) | 0.0 |
| Total | 7 (100.0%) | 7.0 |
Fertility by Age by Marriage Status in Rollingwood
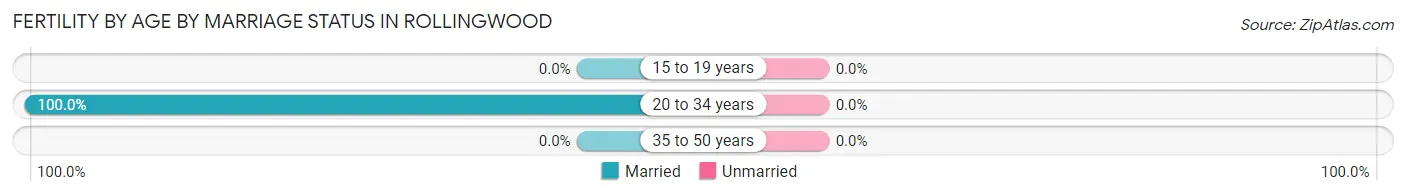
| Age Bracket | Married | Unmarried |
| 15 to 19 years | 0 (0.0%) | 0 (0.0%) |
| 20 to 34 years | 7 (100.0%) | 0 (0.0%) |
| 35 to 50 years | 0 (0.0%) | 0 (0.0%) |
| Total | 7 (100.0%) | 0 (0.0%) |
Fertility by Education in Rollingwood
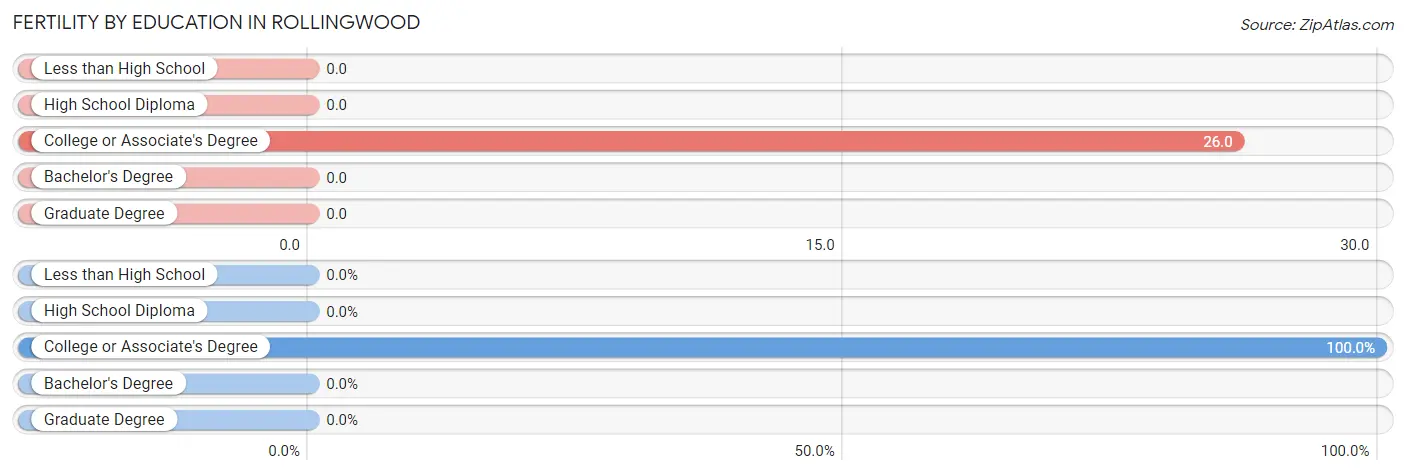
| Educational Attainment | Women with Births | Births / 1,000 Women |
| Less than High School | 0 (0.0%) | 0.0 |
| High School Diploma | 0 (0.0%) | 0.0 |
| College or Associate's Degree | 7 (100.0%) | 26.0 |
| Bachelor's Degree | 0 (0.0%) | 0.0 |
| Graduate Degree | 0 (0.0%) | 0.0 |
| Total | 7 (100.0%) | 7.0 |
Fertility by Education by Marriage Status in Rollingwood
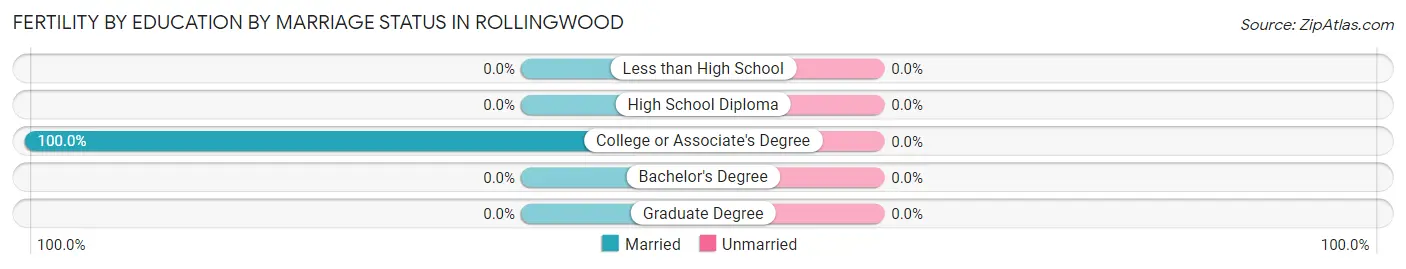
| Educational Attainment | Married | Unmarried |
| Less than High School | 0 (0.0%) | 0 (0.0%) |
| High School Diploma | 0 (0.0%) | 0 (0.0%) |
| College or Associate's Degree | 7 (100.0%) | 0 (0.0%) |
| Bachelor's Degree | 0 (0.0%) | 0 (0.0%) |
| Graduate Degree | 0 (0.0%) | 0 (0.0%) |
| Total | 7 (100.0%) | 0 (0.0%) |
Employment Characteristics in Rollingwood
Employment by Class of Employer in Rollingwood
Among the 1,543 employed individuals in Rollingwood, private company employees (1,188 | 77.0%), self-employed (not incorporated) (117 | 7.6%), and not-for-profit organizations (88 | 5.7%) make up the most common classes of employment.
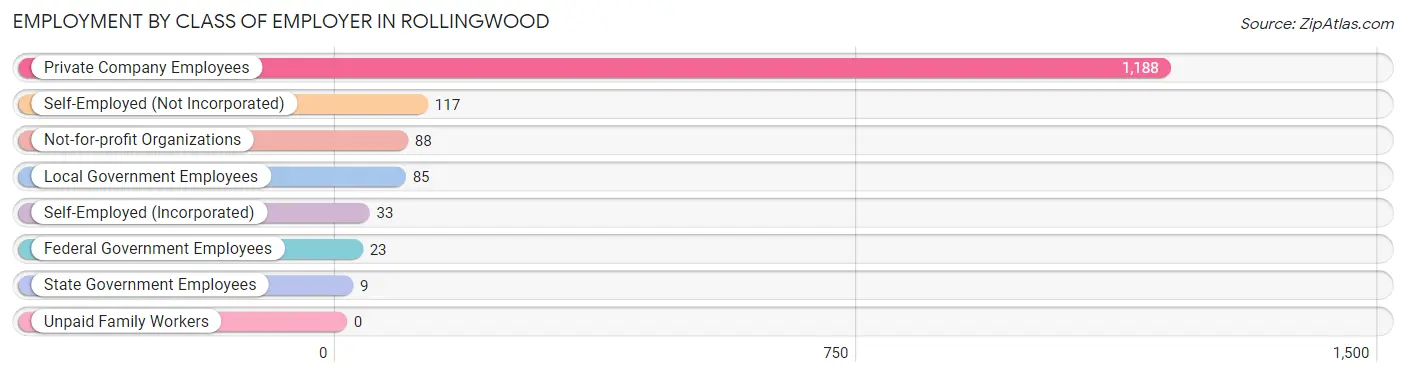
| Employer Class | # Employees | % Employees |
| Private Company Employees | 1,188 | 77.0% |
| Self-Employed (Incorporated) | 33 | 2.1% |
| Self-Employed (Not Incorporated) | 117 | 7.6% |
| Not-for-profit Organizations | 88 | 5.7% |
| Local Government Employees | 85 | 5.5% |
| State Government Employees | 9 | 0.6% |
| Federal Government Employees | 23 | 1.5% |
| Unpaid Family Workers | 0 | 0.0% |
| Total | 1,543 | 100.0% |
Employment Status by Age in Rollingwood
According to the labor force statistics for Rollingwood, out of the total population over 16 years of age (2,762), 66.6% or 1,839 individuals are in the labor force, with 12.6% or 232 of them unemployed. The age group with the highest labor force participation rate is 35 to 44 years, with 89.2% or 431 individuals in the labor force. Within the labor force, the 16 to 19 years age range has the highest percentage of unemployed individuals, with 48.8% or 41 of them being unemployed.
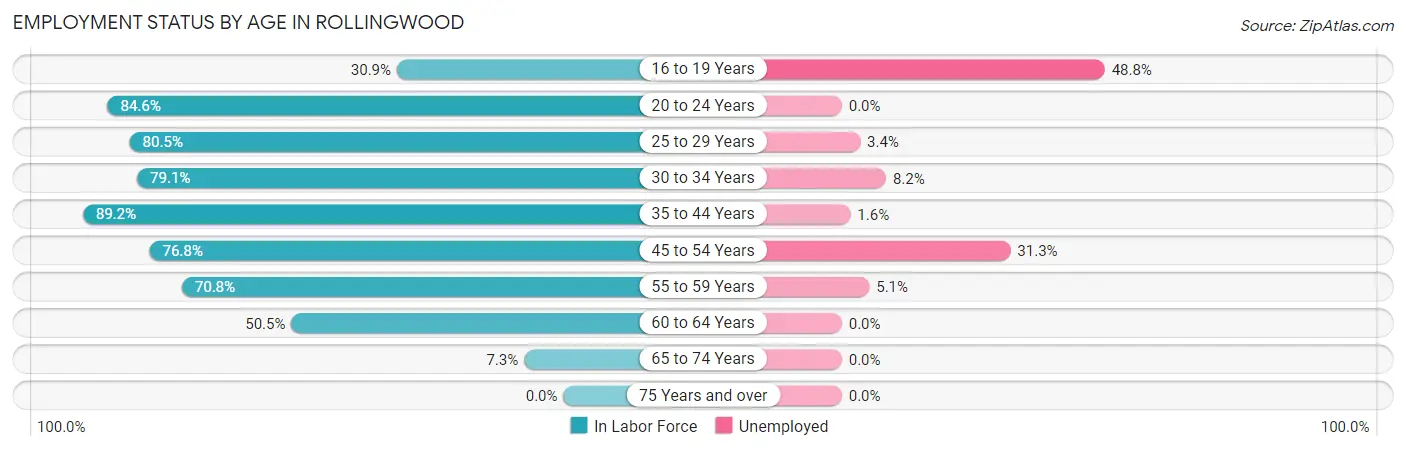
| Age Bracket | In Labor Force | Unemployed |
| 16 to 19 Years | 84 (30.9%) | 41 (48.8%) |
| 20 to 24 Years | 208 (84.6%) | 0 (0.0%) |
| 25 to 29 Years | 149 (80.5%) | 5 (3.4%) |
| 30 to 34 Years | 170 (79.1%) | 14 (8.2%) |
| 35 to 44 Years | 431 (89.2%) | 7 (1.6%) |
| 45 to 54 Years | 482 (76.8%) | 151 (31.3%) |
| 55 to 59 Years | 255 (70.8%) | 13 (5.1%) |
| 60 to 64 Years | 46 (50.5%) | 0 (0.0%) |
| 65 to 74 Years | 14 (7.3%) | 0 (0.0%) |
| 75 Years and over | 0 (0.0%) | 0 (0.0%) |
| Total | 1,839 (66.6%) | 232 (12.6%) |
Employment Status by Educational Attainment in Rollingwood
According to labor force statistics for Rollingwood, 78.1% of individuals (1,532) out of the total population between 25 and 64 years of age (1,962) are in the labor force, with 12.4% or 190 of them being unemployed. The group with the highest labor force participation rate are those with the educational attainment of bachelor's degree or higher, with 87.3% or 199 individuals in the labor force. Within the labor force, individuals with less than high school education have the highest percentage of unemployment, with 28.3% or 132 of them being unemployed.
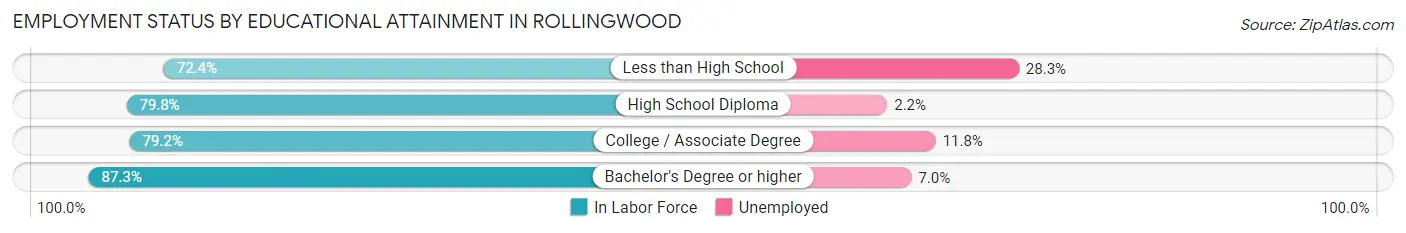
| Educational Attainment | In Labor Force | Unemployed |
| Less than High School | 467 (72.4%) | 183 (28.3%) |
| High School Diploma | 604 (79.8%) | 17 (2.2%) |
| College / Associate Degree | 263 (79.2%) | 39 (11.8%) |
| Bachelor's Degree or higher | 199 (87.3%) | 16 (7.0%) |
| Total | 1,532 (78.1%) | 243 (12.4%) |
Employment Occupations by Sex in Rollingwood
Management, Business, Science and Arts Occupations
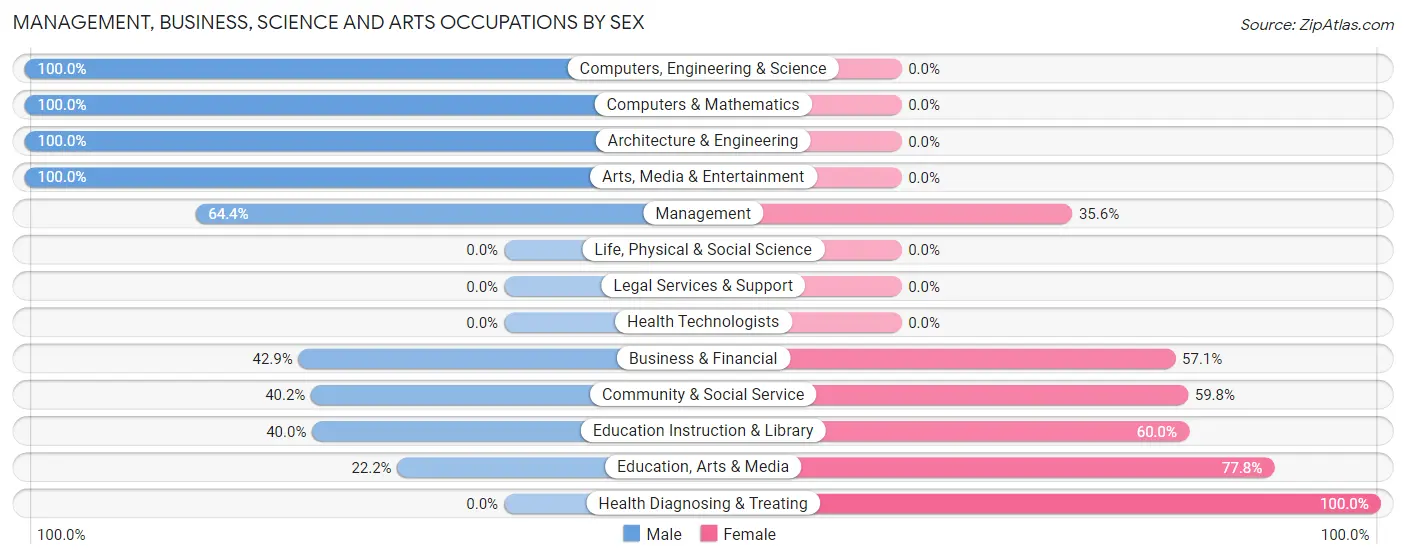
The most common Management, Business, Science and Arts occupations in Rollingwood are Community & Social Service (97 | 6.0%), Computers, Engineering & Science (88 | 5.5%), Management (87 | 5.4%), Health Diagnosing & Treating (71 | 4.4%), and Education Instruction & Library (50 | 3.1%).
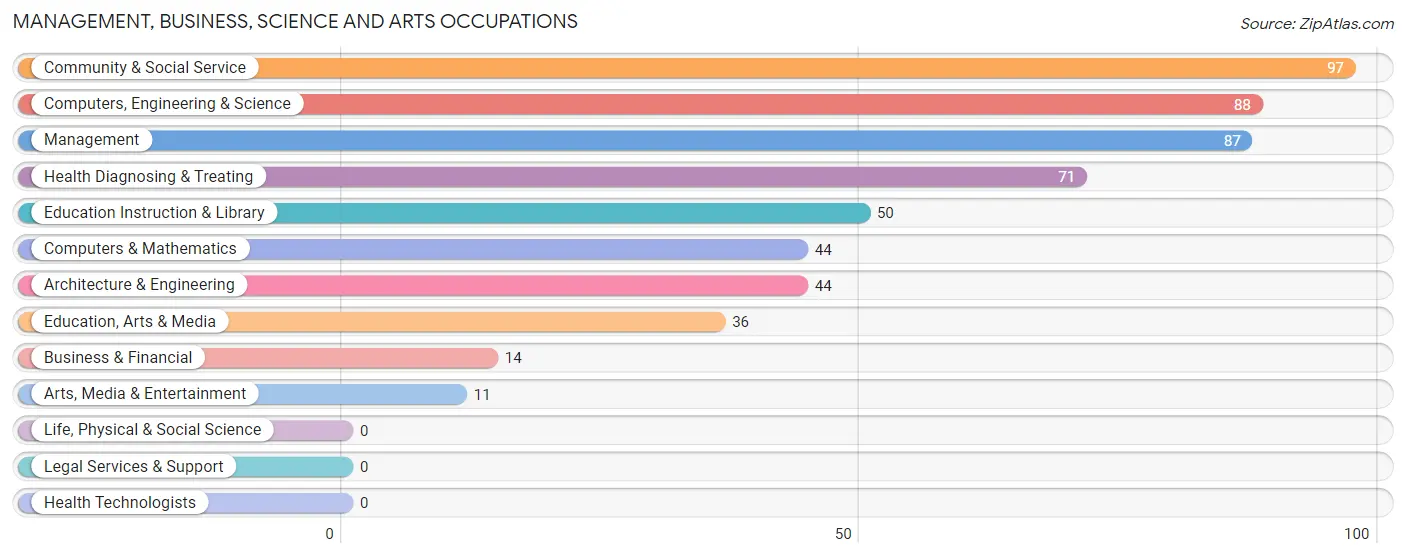
Management, Business, Science and Arts Occupations by Sex
Within the Management, Business, Science and Arts occupations in Rollingwood, the most male-oriented occupations are Computers, Engineering & Science (100.0%), Computers & Mathematics (100.0%), and Architecture & Engineering (100.0%), while the most female-oriented occupations are Health Diagnosing & Treating (100.0%), Education, Arts & Media (77.8%), and Education Instruction & Library (60.0%).
| Occupation | Male | Female |
| Management | 56 (64.4%) | 31 (35.6%) |
| Business & Financial | 6 (42.9%) | 8 (57.1%) |
| Computers, Engineering & Science | 88 (100.0%) | 0 (0.0%) |
| Computers & Mathematics | 44 (100.0%) | 0 (0.0%) |
| Architecture & Engineering | 44 (100.0%) | 0 (0.0%) |
| Life, Physical & Social Science | 0 (0.0%) | 0 (0.0%) |
| Community & Social Service | 39 (40.2%) | 58 (59.8%) |
| Education, Arts & Media | 8 (22.2%) | 28 (77.8%) |
| Legal Services & Support | 0 (0.0%) | 0 (0.0%) |
| Education Instruction & Library | 20 (40.0%) | 30 (60.0%) |
| Arts, Media & Entertainment | 11 (100.0%) | 0 (0.0%) |
| Health Diagnosing & Treating | 0 (0.0%) | 71 (100.0%) |
| Health Technologists | 0 (0.0%) | 0 (0.0%) |
| Total (Category) | 189 (52.9%) | 168 (47.1%) |
| Total (Overall) | 1,011 (62.9%) | 597 (37.1%) |
Services Occupations
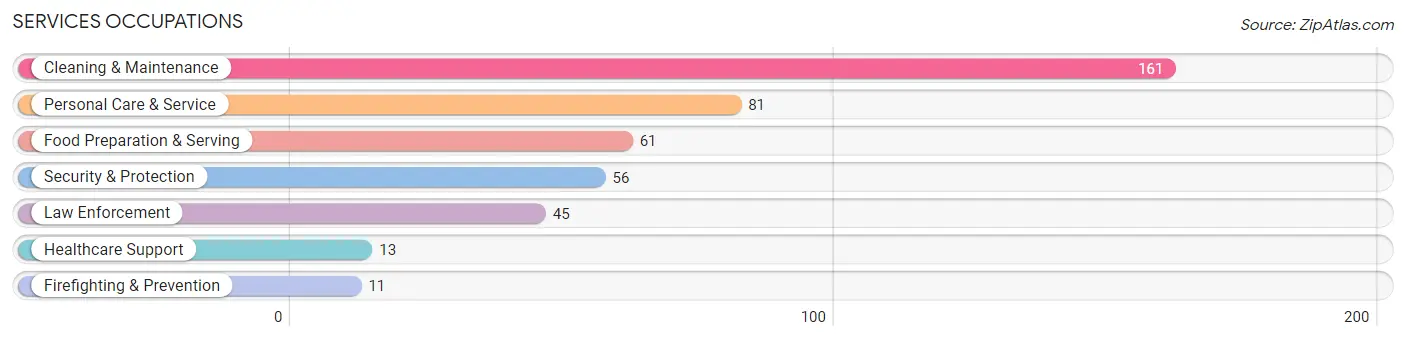
The most common Services occupations in Rollingwood are Cleaning & Maintenance (161 | 10.0%), Personal Care & Service (81 | 5.0%), Food Preparation & Serving (61 | 3.8%), Security & Protection (56 | 3.5%), and Law Enforcement (45 | 2.8%).
Services Occupations by Sex
Within the Services occupations in Rollingwood, the most male-oriented occupations are Security & Protection (100.0%), Firefighting & Prevention (100.0%), and Law Enforcement (100.0%), while the most female-oriented occupations are Healthcare Support (100.0%), Food Preparation & Serving (100.0%), and Personal Care & Service (61.7%).
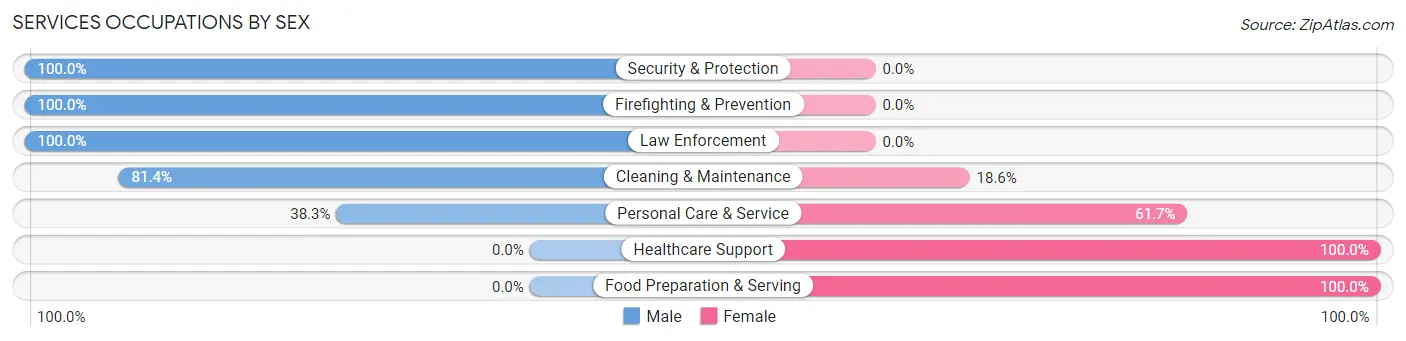
| Occupation | Male | Female |
| Healthcare Support | 0 (0.0%) | 13 (100.0%) |
| Security & Protection | 56 (100.0%) | 0 (0.0%) |
| Firefighting & Prevention | 11 (100.0%) | 0 (0.0%) |
| Law Enforcement | 45 (100.0%) | 0 (0.0%) |
| Food Preparation & Serving | 0 (0.0%) | 61 (100.0%) |
| Cleaning & Maintenance | 131 (81.4%) | 30 (18.6%) |
| Personal Care & Service | 31 (38.3%) | 50 (61.7%) |
| Total (Category) | 218 (58.6%) | 154 (41.4%) |
| Total (Overall) | 1,011 (62.9%) | 597 (37.1%) |
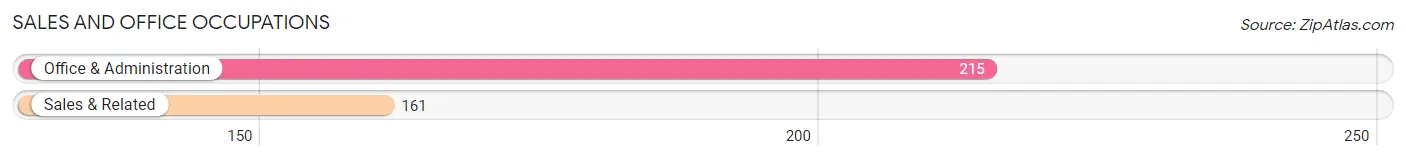
Sales and Office Occupations
The most common Sales and Office occupations in Rollingwood are Office & Administration (215 | 13.4%), and Sales & Related (161 | 10.0%).
Sales and Office Occupations by Sex
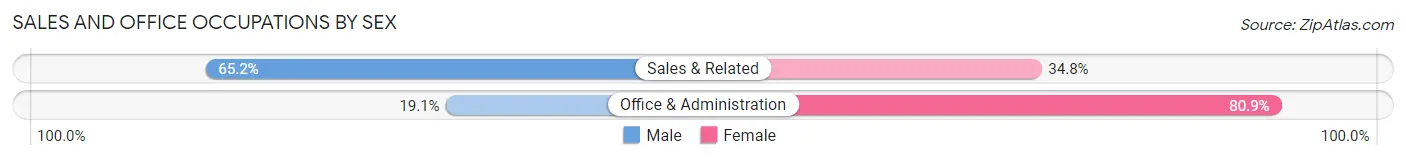
| Occupation | Male | Female |
| Sales & Related | 105 (65.2%) | 56 (34.8%) |
| Office & Administration | 41 (19.1%) | 174 (80.9%) |
| Total (Category) | 146 (38.8%) | 230 (61.2%) |
| Total (Overall) | 1,011 (62.9%) | 597 (37.1%) |
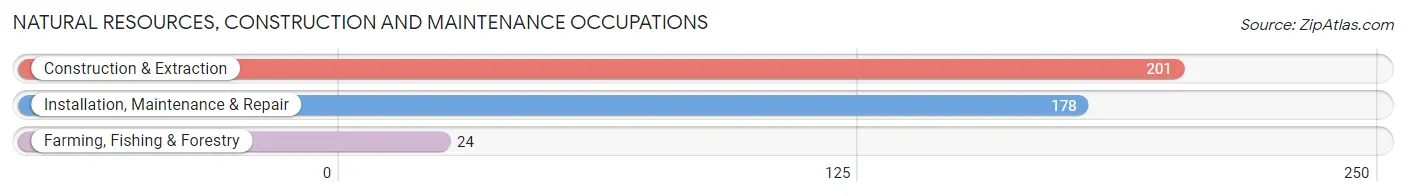
Natural Resources, Construction and Maintenance Occupations
The most common Natural Resources, Construction and Maintenance occupations in Rollingwood are Construction & Extraction (201 | 12.5%), Installation, Maintenance & Repair (178 | 11.1%), and Farming, Fishing & Forestry (24 | 1.5%).
Natural Resources, Construction and Maintenance Occupations by Sex
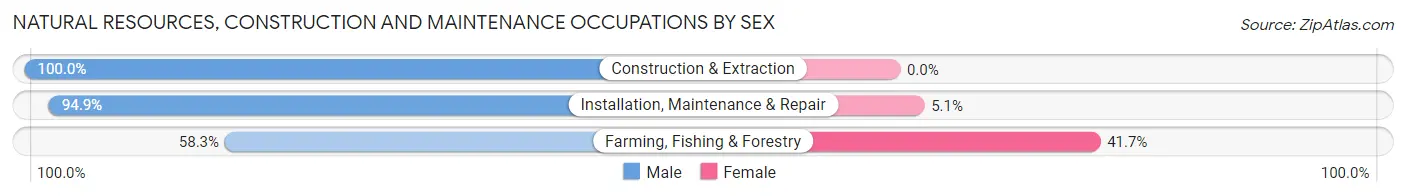
| Occupation | Male | Female |
| Farming, Fishing & Forestry | 14 (58.3%) | 10 (41.7%) |
| Construction & Extraction | 201 (100.0%) | 0 (0.0%) |
| Installation, Maintenance & Repair | 169 (94.9%) | 9 (5.1%) |
| Total (Category) | 384 (95.3%) | 19 (4.7%) |
| Total (Overall) | 1,011 (62.9%) | 597 (37.1%) |
Production, Transportation and Moving Occupations
The most common Production, Transportation and Moving occupations in Rollingwood are Production (74 | 4.6%), Transportation (16 | 1.0%), and Material Moving (10 | 0.6%).
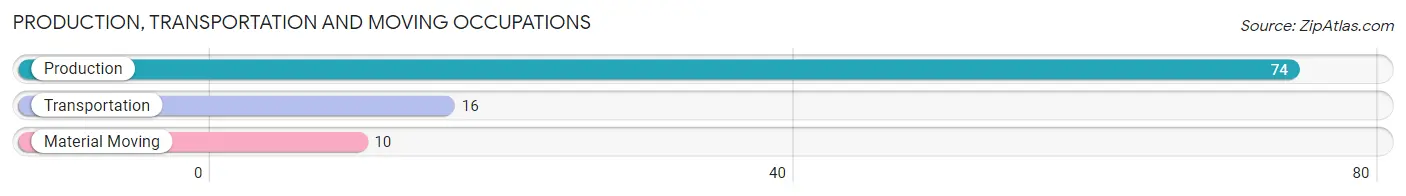
Production, Transportation and Moving Occupations by Sex
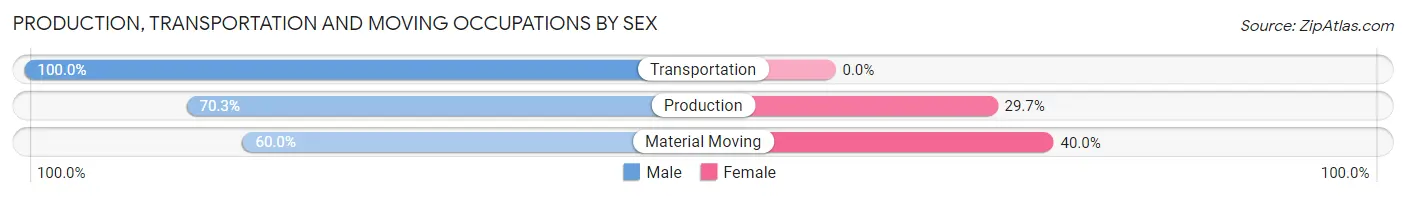
| Occupation | Male | Female |
| Production | 52 (70.3%) | 22 (29.7%) |
| Transportation | 16 (100.0%) | 0 (0.0%) |
| Material Moving | 6 (60.0%) | 4 (40.0%) |
| Total (Category) | 74 (74.0%) | 26 (26.0%) |
| Total (Overall) | 1,011 (62.9%) | 597 (37.1%) |
Employment Industries by Sex in Rollingwood
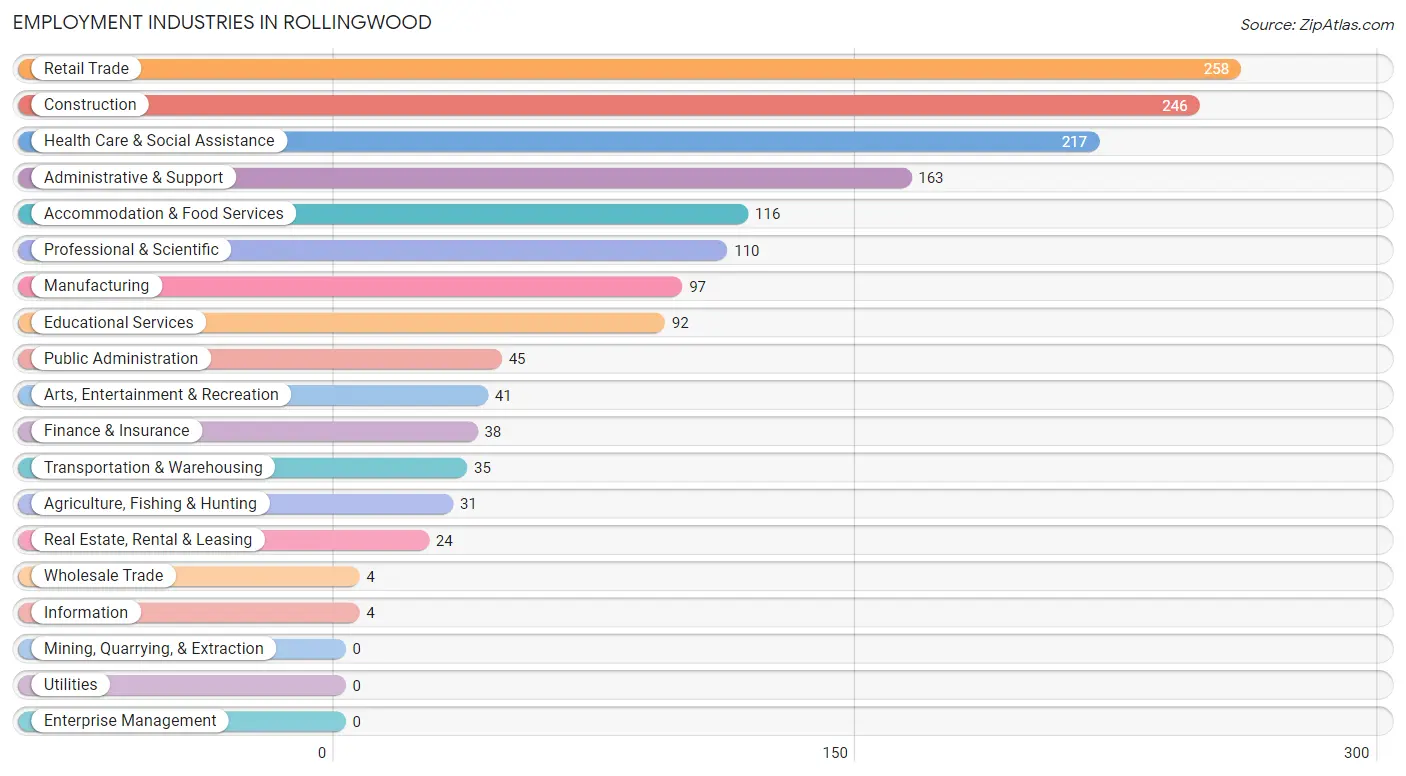
Employment Industries in Rollingwood
The major employment industries in Rollingwood include Retail Trade (258 | 16.0%), Construction (246 | 15.3%), Health Care & Social Assistance (217 | 13.5%), Administrative & Support (163 | 10.1%), and Accommodation & Food Services (116 | 7.2%).
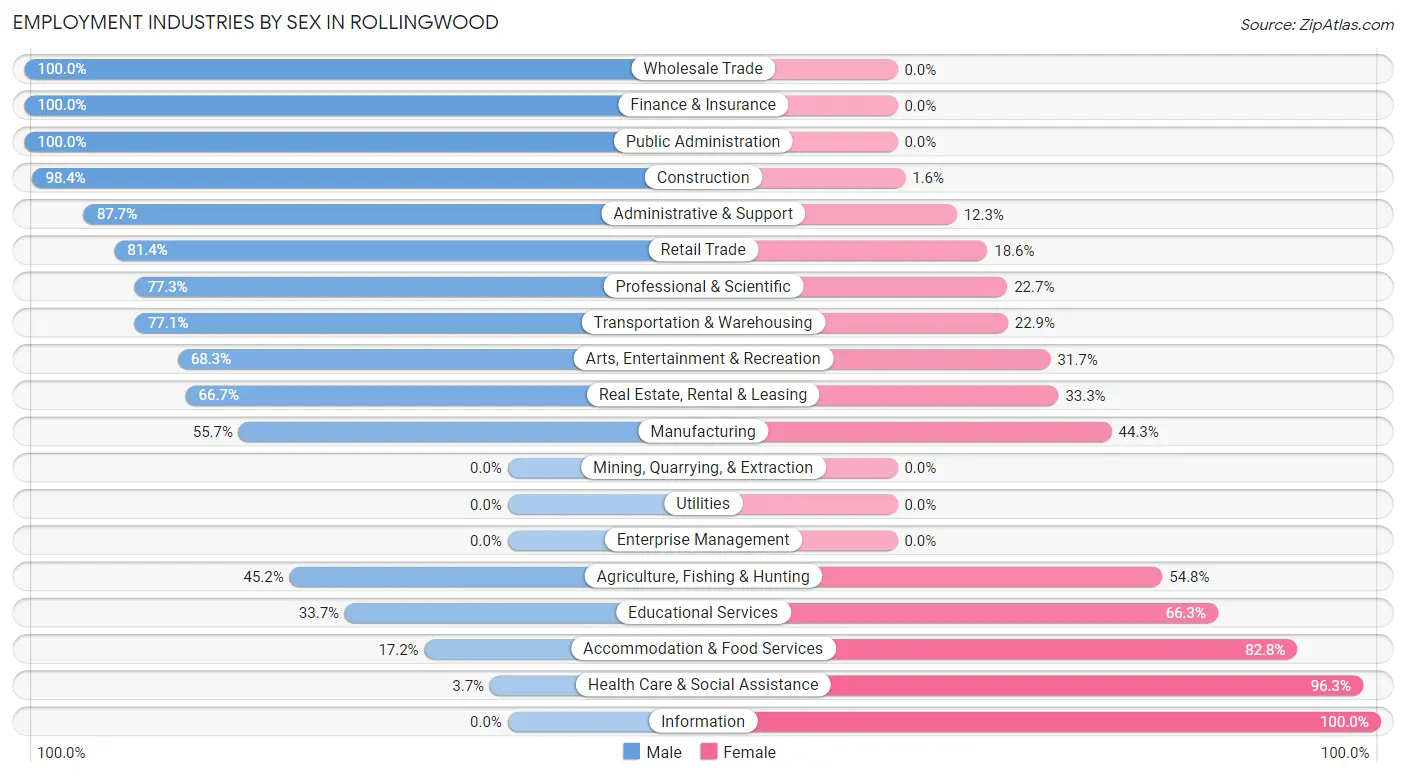
Employment Industries by Sex in Rollingwood
The Rollingwood industries that see more men than women are Wholesale Trade (100.0%), Finance & Insurance (100.0%), and Public Administration (100.0%), whereas the industries that tend to have a higher number of women are Information (100.0%), Health Care & Social Assistance (96.3%), and Accommodation & Food Services (82.8%).
| Industry | Male | Female |
| Agriculture, Fishing & Hunting | 14 (45.2%) | 17 (54.8%) |
| Mining, Quarrying, & Extraction | 0 (0.0%) | 0 (0.0%) |
| Construction | 242 (98.4%) | 4 (1.6%) |
| Manufacturing | 54 (55.7%) | 43 (44.3%) |
| Wholesale Trade | 4 (100.0%) | 0 (0.0%) |
| Retail Trade | 210 (81.4%) | 48 (18.6%) |
| Transportation & Warehousing | 27 (77.1%) | 8 (22.9%) |
| Utilities | 0 (0.0%) | 0 (0.0%) |
| Information | 0 (0.0%) | 4 (100.0%) |
| Finance & Insurance | 38 (100.0%) | 0 (0.0%) |
| Real Estate, Rental & Leasing | 16 (66.7%) | 8 (33.3%) |
| Professional & Scientific | 85 (77.3%) | 25 (22.7%) |
| Enterprise Management | 0 (0.0%) | 0 (0.0%) |
| Administrative & Support | 143 (87.7%) | 20 (12.3%) |
| Educational Services | 31 (33.7%) | 61 (66.3%) |
| Health Care & Social Assistance | 8 (3.7%) | 209 (96.3%) |
| Arts, Entertainment & Recreation | 28 (68.3%) | 13 (31.7%) |
| Accommodation & Food Services | 20 (17.2%) | 96 (82.8%) |
| Public Administration | 45 (100.0%) | 0 (0.0%) |
| Total | 1,011 (62.9%) | 597 (37.1%) |
Education in Rollingwood
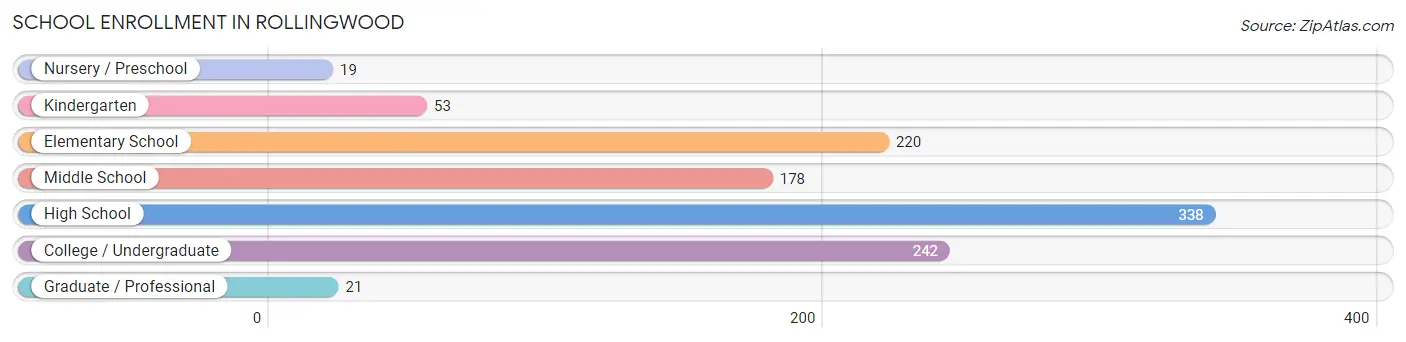
School Enrollment in Rollingwood
The most common levels of schooling among the 1,071 students in Rollingwood are high school (338 | 31.6%), college / undergraduate (242 | 22.6%), and elementary school (220 | 20.5%).
| School Level | # Students | % Students |
| Nursery / Preschool | 19 | 1.8% |
| Kindergarten | 53 | 5.0% |
| Elementary School | 220 | 20.5% |
| Middle School | 178 | 16.6% |
| High School | 338 | 31.6% |
| College / Undergraduate | 242 | 22.6% |
| Graduate / Professional | 21 | 2.0% |
| Total | 1,071 | 100.0% |
School Enrollment by Age by Funding Source in Rollingwood
Out of a total of 1,071 students who are enrolled in schools in Rollingwood, 75 (7.0%) attend a private institution, while the remaining 996 (93.0%) are enrolled in public schools. The age group of 18 to 19 year olds has the highest likelihood of being enrolled in private schools, with 21 (19.3% in the age bracket) enrolled. Conversely, the age group of 3 to 4 year olds has the lowest likelihood of being enrolled in a private school, with 19 (100.0% in the age bracket) attending a public institution.
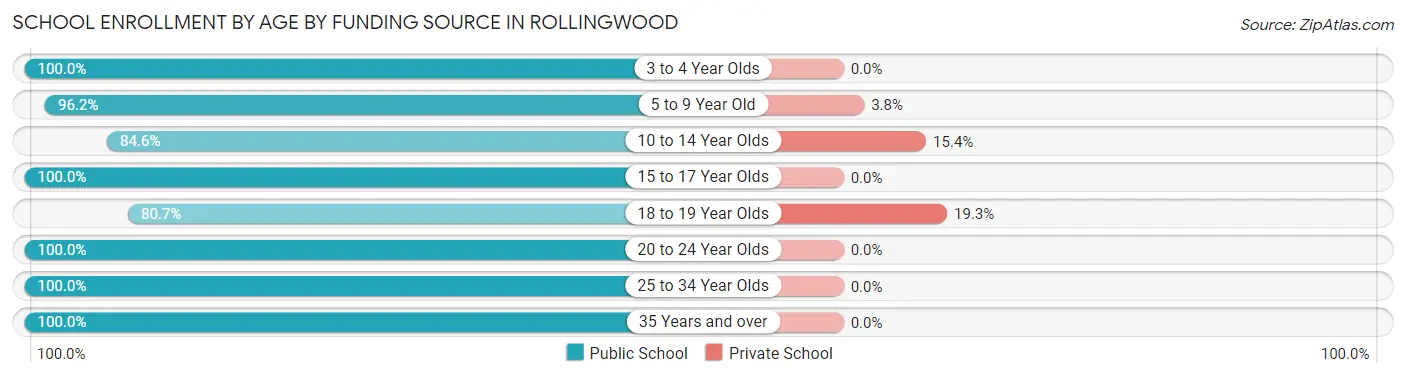
| Age Bracket | Public School | Private School |
| 3 to 4 Year Olds | 19 (100.0%) | 0 (0.0%) |
| 5 to 9 Year Old | 226 (96.2%) | 9 (3.8%) |
| 10 to 14 Year Olds | 248 (84.6%) | 45 (15.4%) |
| 15 to 17 Year Olds | 240 (100.0%) | 0 (0.0%) |
| 18 to 19 Year Olds | 88 (80.7%) | 21 (19.3%) |
| 20 to 24 Year Olds | 110 (100.0%) | 0 (0.0%) |
| 25 to 34 Year Olds | 37 (100.0%) | 0 (0.0%) |
| 35 Years and over | 28 (100.0%) | 0 (0.0%) |
| Total | 996 (93.0%) | 75 (7.0%) |
Educational Attainment by Field of Study in Rollingwood
Social sciences (56 | 18.2%), engineering (49 | 15.9%), physical & health sciences (45 | 14.6%), business (42 | 13.6%), and arts & humanities (24 | 7.8%) are the most common fields of study among 308 individuals in Rollingwood who have obtained a bachelor's degree or higher.
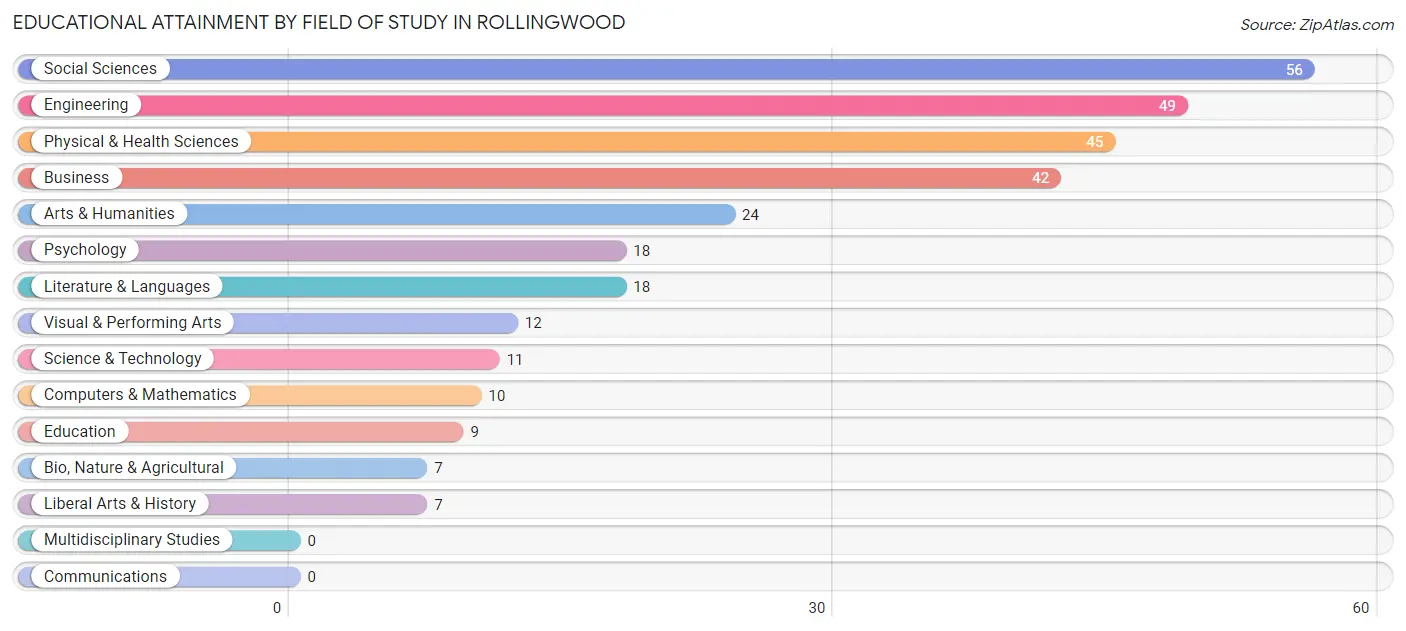
| Field of Study | # Graduates | % Graduates |
| Computers & Mathematics | 10 | 3.3% |
| Bio, Nature & Agricultural | 7 | 2.3% |
| Physical & Health Sciences | 45 | 14.6% |
| Psychology | 18 | 5.8% |
| Social Sciences | 56 | 18.2% |
| Engineering | 49 | 15.9% |
| Multidisciplinary Studies | 0 | 0.0% |
| Science & Technology | 11 | 3.6% |
| Business | 42 | 13.6% |
| Education | 9 | 2.9% |
| Literature & Languages | 18 | 5.8% |
| Liberal Arts & History | 7 | 2.3% |
| Visual & Performing Arts | 12 | 3.9% |
| Communications | 0 | 0.0% |
| Arts & Humanities | 24 | 7.8% |
| Total | 308 | 100.0% |
Transportation & Commute in Rollingwood
Vehicle Availability by Sex in Rollingwood
The most prevalent vehicle ownership categories in Rollingwood are males with 3 vehicles (382, accounting for 40.4%) and females with 3 vehicles (192, making up 64.0%).
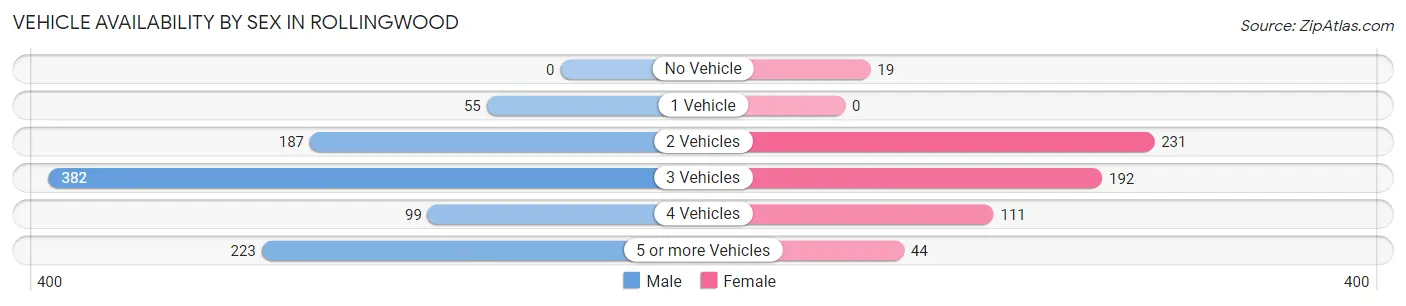
| Vehicles Available | Male | Female |
| No Vehicle | 0 (0.0%) | 19 (3.2%) |
| 1 Vehicle | 55 (5.8%) | 0 (0.0%) |
| 2 Vehicles | 187 (19.8%) | 231 (38.7%) |
| 3 Vehicles | 382 (40.4%) | 192 (32.2%) |
| 4 Vehicles | 99 (10.5%) | 111 (18.6%) |
| 5 or more Vehicles | 223 (23.6%) | 44 (7.4%) |
| Total | 946 (100.0%) | 597 (100.0%) |
Commute Time in Rollingwood
The most frequently occuring commute durations in Rollingwood are 15 to 19 minutes (346 commuters, 22.9%), 60 to 89 minutes (274 commuters, 18.2%), and 20 to 24 minutes (156 commuters, 10.3%).
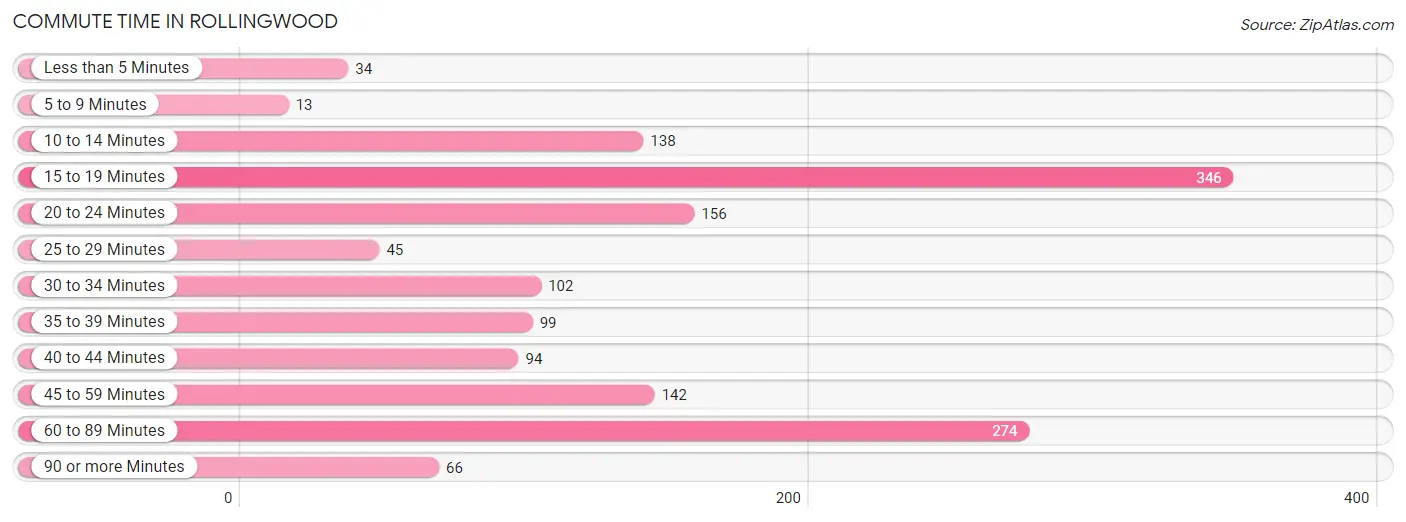
| Commute Time | # Commuters | % Commuters |
| Less than 5 Minutes | 34 | 2.2% |
| 5 to 9 Minutes | 13 | 0.9% |
| 10 to 14 Minutes | 138 | 9.1% |
| 15 to 19 Minutes | 346 | 22.9% |
| 20 to 24 Minutes | 156 | 10.3% |
| 25 to 29 Minutes | 45 | 3.0% |
| 30 to 34 Minutes | 102 | 6.8% |
| 35 to 39 Minutes | 99 | 6.6% |
| 40 to 44 Minutes | 94 | 6.2% |
| 45 to 59 Minutes | 142 | 9.4% |
| 60 to 89 Minutes | 274 | 18.2% |
| 90 or more Minutes | 66 | 4.4% |
Commute Time by Sex in Rollingwood
The most common commute times in Rollingwood are 15 to 19 minutes (232 commuters, 25.4%) for males and 15 to 19 minutes (114 commuters, 19.1%) for females.
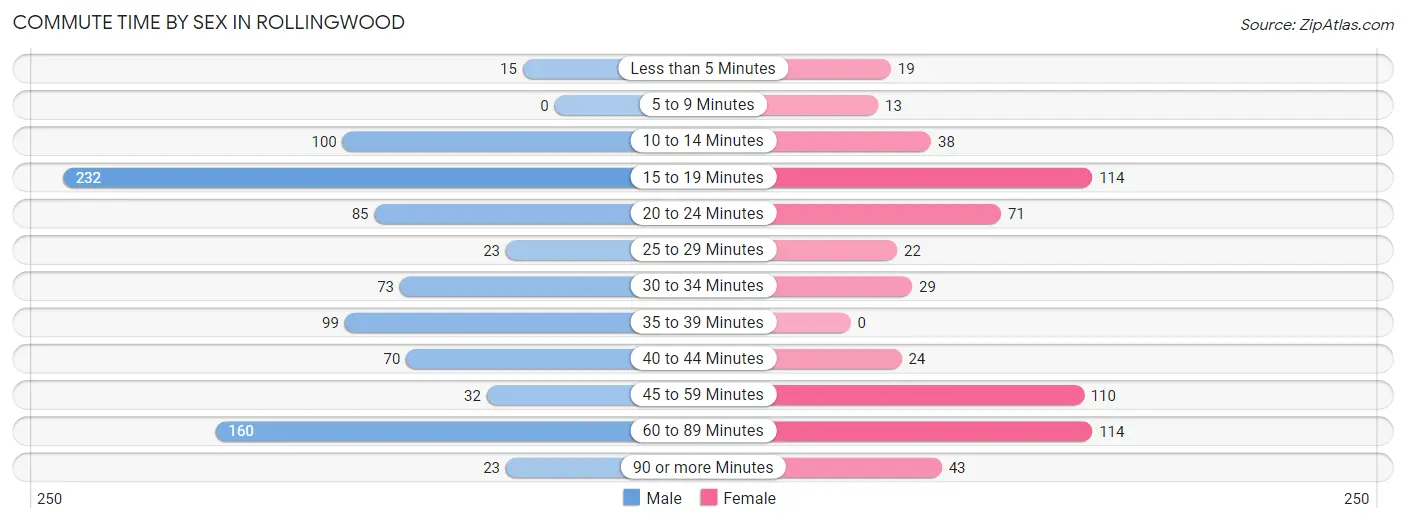
| Commute Time | Male | Female |
| Less than 5 Minutes | 15 (1.6%) | 19 (3.2%) |
| 5 to 9 Minutes | 0 (0.0%) | 13 (2.2%) |
| 10 to 14 Minutes | 100 (11.0%) | 38 (6.4%) |
| 15 to 19 Minutes | 232 (25.4%) | 114 (19.1%) |
| 20 to 24 Minutes | 85 (9.3%) | 71 (11.9%) |
| 25 to 29 Minutes | 23 (2.5%) | 22 (3.7%) |
| 30 to 34 Minutes | 73 (8.0%) | 29 (4.9%) |
| 35 to 39 Minutes | 99 (10.9%) | 0 (0.0%) |
| 40 to 44 Minutes | 70 (7.7%) | 24 (4.0%) |
| 45 to 59 Minutes | 32 (3.5%) | 110 (18.4%) |
| 60 to 89 Minutes | 160 (17.5%) | 114 (19.1%) |
| 90 or more Minutes | 23 (2.5%) | 43 (7.2%) |
Time of Departure to Work by Sex in Rollingwood
The most frequent times of departure to work in Rollingwood are 5:30 AM to 5:59 AM (193, 21.2%) for males and 7:00 AM to 7:29 AM (159, 26.6%) for females.
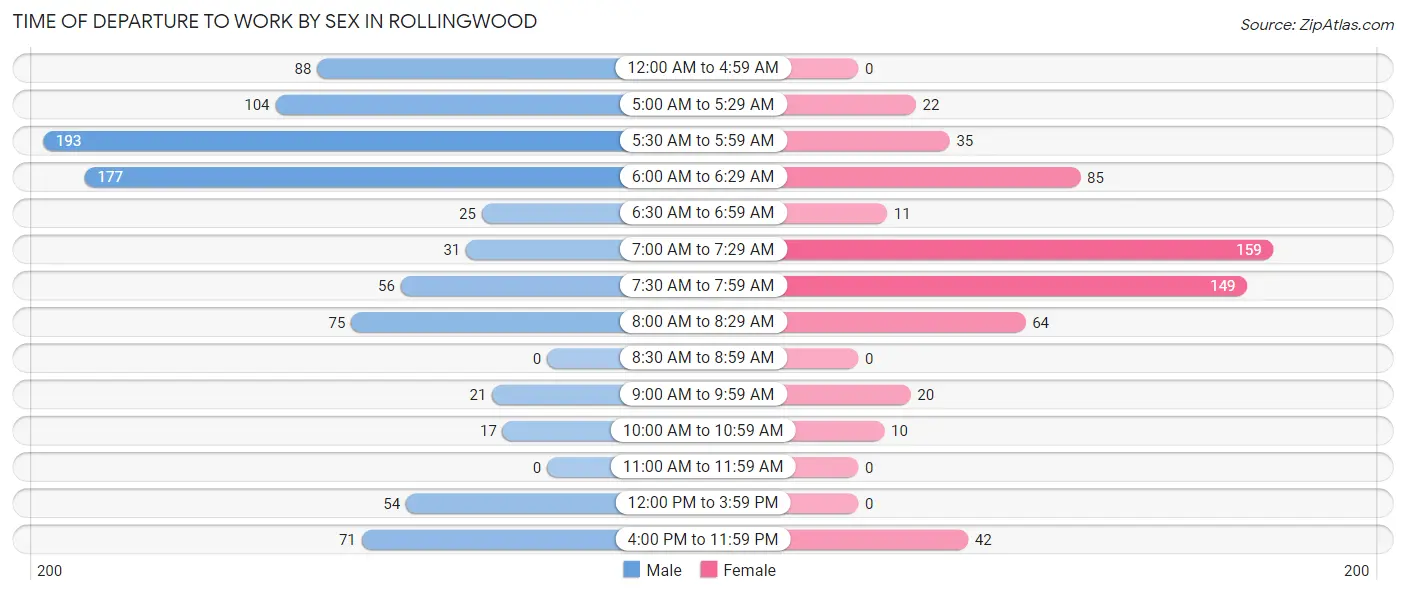
| Time of Departure | Male | Female |
| 12:00 AM to 4:59 AM | 88 (9.7%) | 0 (0.0%) |
| 5:00 AM to 5:29 AM | 104 (11.4%) | 22 (3.7%) |
| 5:30 AM to 5:59 AM | 193 (21.2%) | 35 (5.9%) |
| 6:00 AM to 6:29 AM | 177 (19.4%) | 85 (14.2%) |
| 6:30 AM to 6:59 AM | 25 (2.7%) | 11 (1.8%) |
| 7:00 AM to 7:29 AM | 31 (3.4%) | 159 (26.6%) |
| 7:30 AM to 7:59 AM | 56 (6.1%) | 149 (25.0%) |
| 8:00 AM to 8:29 AM | 75 (8.2%) | 64 (10.7%) |
| 8:30 AM to 8:59 AM | 0 (0.0%) | 0 (0.0%) |
| 9:00 AM to 9:59 AM | 21 (2.3%) | 20 (3.4%) |
| 10:00 AM to 10:59 AM | 17 (1.9%) | 10 (1.7%) |
| 11:00 AM to 11:59 AM | 0 (0.0%) | 0 (0.0%) |
| 12:00 PM to 3:59 PM | 54 (5.9%) | 0 (0.0%) |
| 4:00 PM to 11:59 PM | 71 (7.8%) | 42 (7.0%) |
| Total | 912 (100.0%) | 597 (100.0%) |
Housing Occupancy in Rollingwood
Occupancy by Ownership in Rollingwood
Of the total 862 dwellings in Rollingwood, owner-occupied units account for 562 (65.2%), while renter-occupied units make up 300 (34.8%).
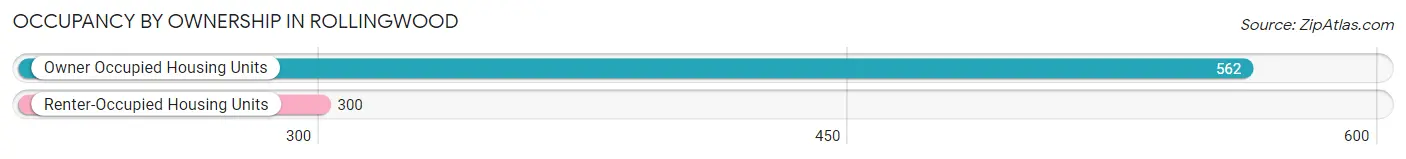
| Occupancy | # Housing Units | % Housing Units |
| Owner Occupied Housing Units | 562 | 65.2% |
| Renter-Occupied Housing Units | 300 | 34.8% |
| Total Occupied Housing Units | 862 | 100.0% |
Occupancy by Household Size in Rollingwood
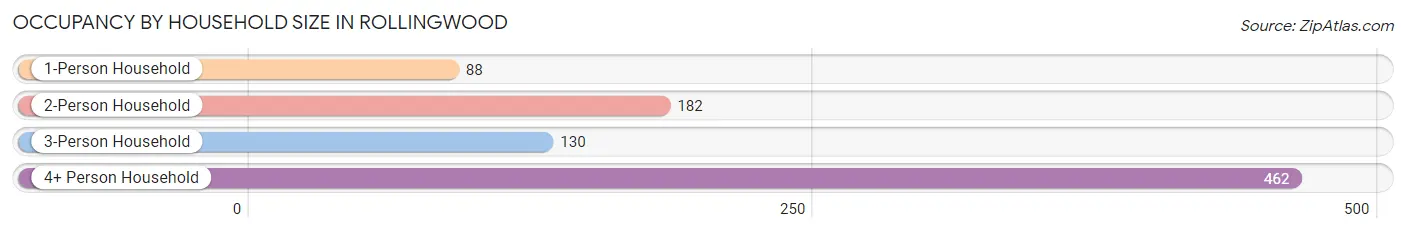
| Household Size | # Housing Units | % Housing Units |
| 1-Person Household | 88 | 10.2% |
| 2-Person Household | 182 | 21.1% |
| 3-Person Household | 130 | 15.1% |
| 4+ Person Household | 462 | 53.6% |
| Total Housing Units | 862 | 100.0% |
Occupancy by Ownership by Household Size in Rollingwood
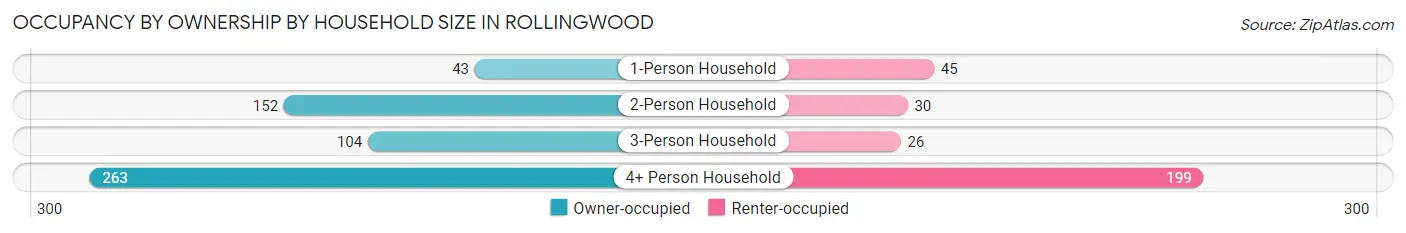
| Household Size | Owner-occupied | Renter-occupied |
| 1-Person Household | 43 (48.9%) | 45 (51.1%) |
| 2-Person Household | 152 (83.5%) | 30 (16.5%) |
| 3-Person Household | 104 (80.0%) | 26 (20.0%) |
| 4+ Person Household | 263 (56.9%) | 199 (43.1%) |
| Total Housing Units | 562 (65.2%) | 300 (34.8%) |
Occupancy by Educational Attainment in Rollingwood
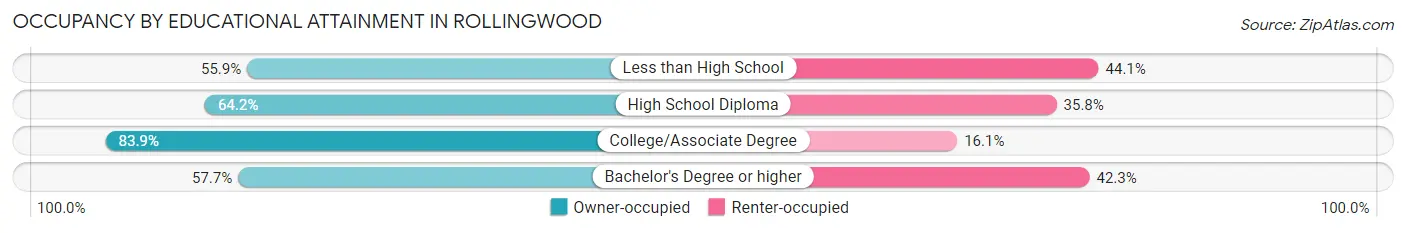
| Household Size | Owner-occupied | Renter-occupied |
| Less than High School | 109 (55.9%) | 86 (44.1%) |
| High School Diploma | 237 (64.2%) | 132 (35.8%) |
| College/Associate Degree | 141 (83.9%) | 27 (16.1%) |
| Bachelor's Degree or higher | 75 (57.7%) | 55 (42.3%) |
Occupancy by Age of Householder in Rollingwood
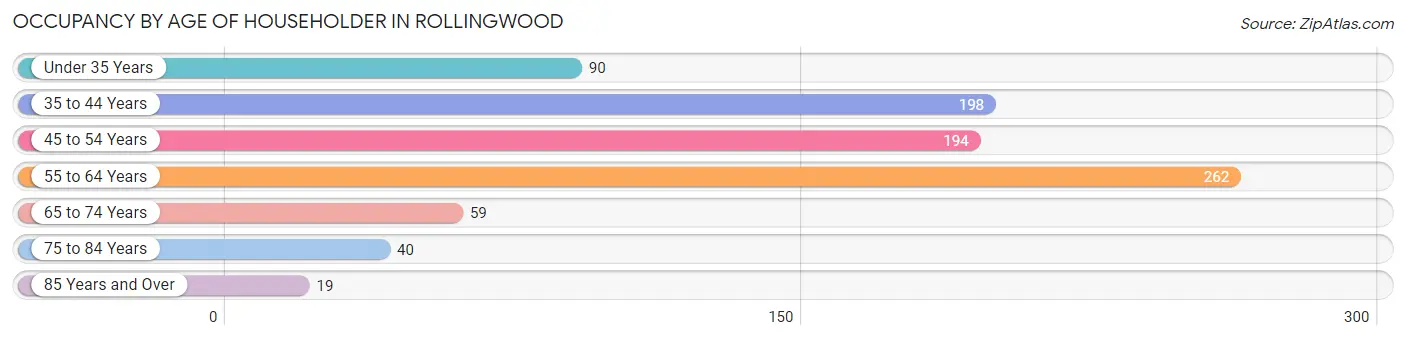
| Age Bracket | # Households | % Households |
| Under 35 Years | 90 | 10.4% |
| 35 to 44 Years | 198 | 23.0% |
| 45 to 54 Years | 194 | 22.5% |
| 55 to 64 Years | 262 | 30.4% |
| 65 to 74 Years | 59 | 6.8% |
| 75 to 84 Years | 40 | 4.6% |
| 85 Years and Over | 19 | 2.2% |
| Total | 862 | 100.0% |
Housing Finances in Rollingwood
Median Income by Occupancy in Rollingwood
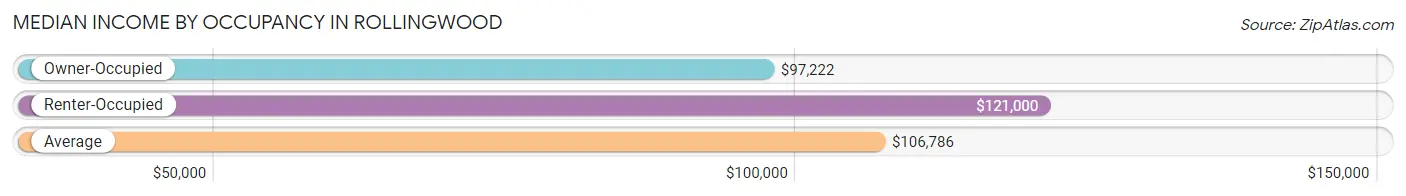
| Occupancy Type | # Households | Median Income |
| Owner-Occupied | 562 (65.2%) | $97,222 |
| Renter-Occupied | 300 (34.8%) | $121,000 |
| Average | 862 (100.0%) | $106,786 |
Occupancy by Householder Income Bracket in Rollingwood
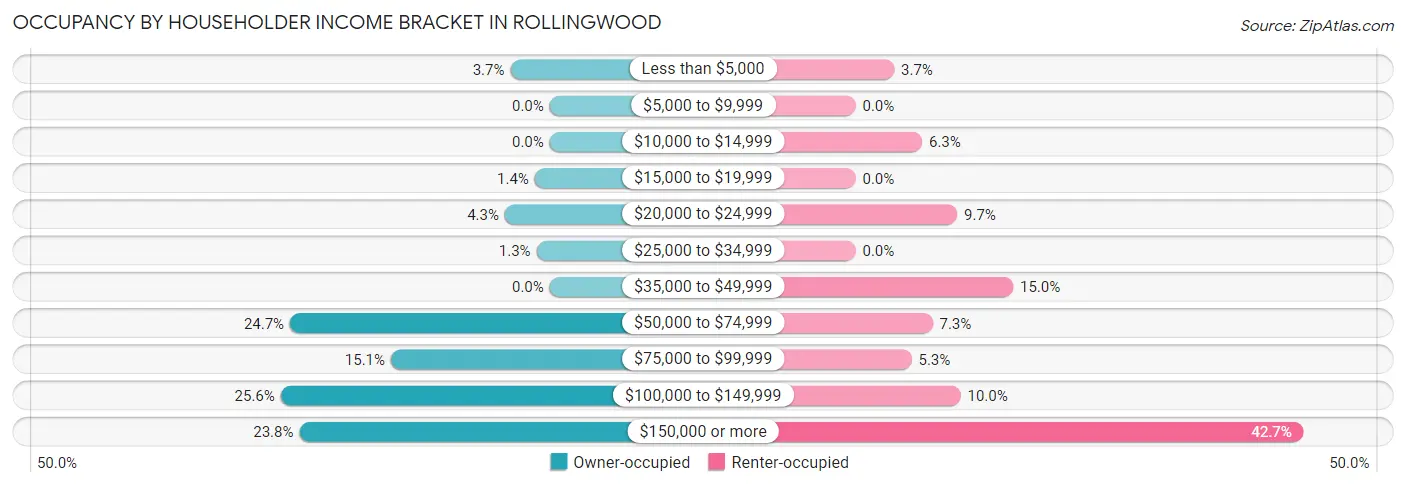
| Income Bracket | Owner-occupied | Renter-occupied |
| Less than $5,000 | 21 (3.7%) | 11 (3.7%) |
| $5,000 to $9,999 | 0 (0.0%) | 0 (0.0%) |
| $10,000 to $14,999 | 0 (0.0%) | 19 (6.3%) |
| $15,000 to $19,999 | 8 (1.4%) | 0 (0.0%) |
| $20,000 to $24,999 | 24 (4.3%) | 29 (9.7%) |
| $25,000 to $34,999 | 7 (1.3%) | 0 (0.0%) |
| $35,000 to $49,999 | 0 (0.0%) | 45 (15.0%) |
| $50,000 to $74,999 | 139 (24.7%) | 22 (7.3%) |
| $75,000 to $99,999 | 85 (15.1%) | 16 (5.3%) |
| $100,000 to $149,999 | 144 (25.6%) | 30 (10.0%) |
| $150,000 or more | 134 (23.8%) | 128 (42.7%) |
| Total | 562 (100.0%) | 300 (100.0%) |
Monthly Housing Cost Tiers in Rollingwood
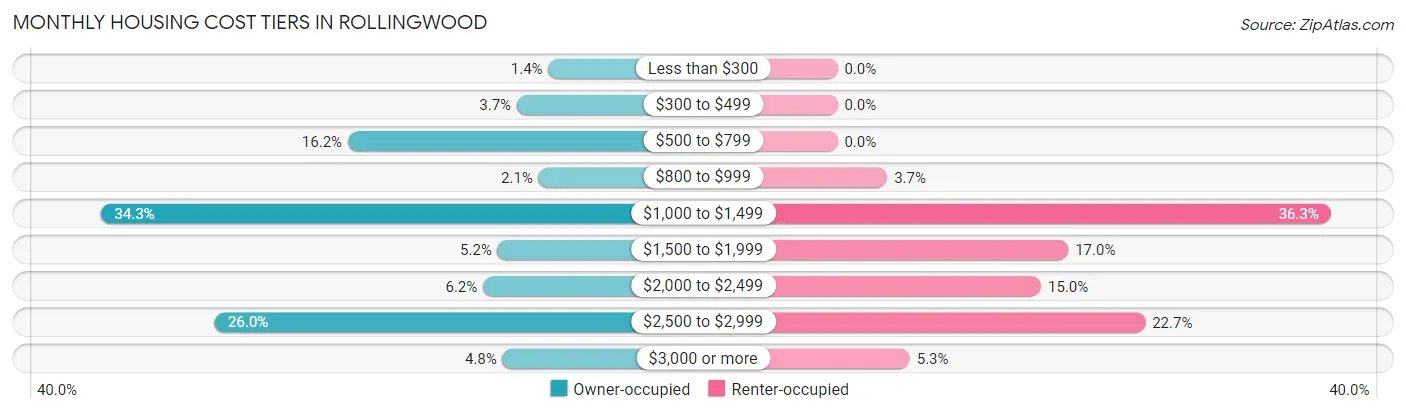
| Monthly Cost | Owner-occupied | Renter-occupied |
| Less than $300 | 8 (1.4%) | 0 (0.0%) |
| $300 to $499 | 21 (3.7%) | 0 (0.0%) |
| $500 to $799 | 91 (16.2%) | 0 (0.0%) |
| $800 to $999 | 12 (2.1%) | 11 (3.7%) |
| $1,000 to $1,499 | 193 (34.3%) | 109 (36.3%) |
| $1,500 to $1,999 | 29 (5.2%) | 51 (17.0%) |
| $2,000 to $2,499 | 35 (6.2%) | 45 (15.0%) |
| $2,500 to $2,999 | 146 (26.0%) | 68 (22.7%) |
| $3,000 or more | 27 (4.8%) | 16 (5.3%) |
| Total | 562 (100.0%) | 300 (100.0%) |
Physical Housing Characteristics in Rollingwood
Housing Structures in Rollingwood
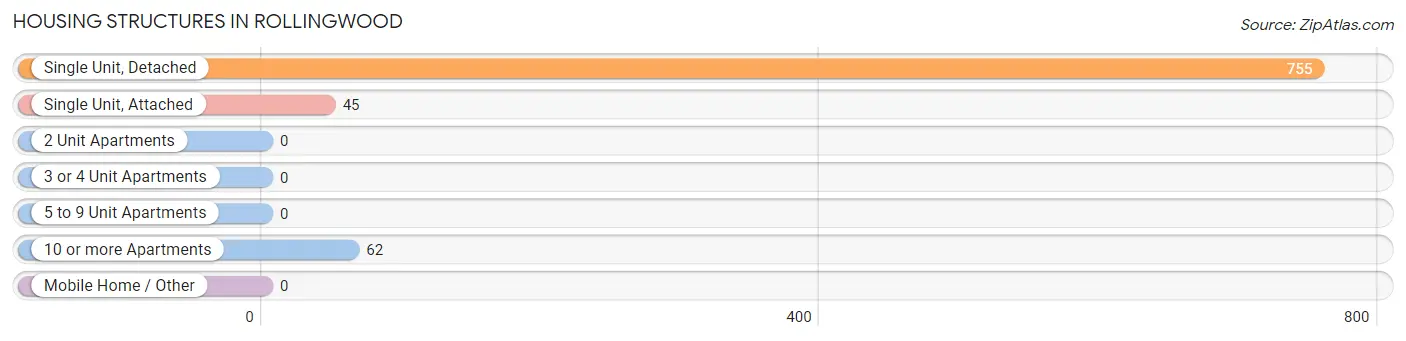
| Structure Type | # Housing Units | % Housing Units |
| Single Unit, Detached | 755 | 87.6% |
| Single Unit, Attached | 45 | 5.2% |
| 2 Unit Apartments | 0 | 0.0% |
| 3 or 4 Unit Apartments | 0 | 0.0% |
| 5 to 9 Unit Apartments | 0 | 0.0% |
| 10 or more Apartments | 62 | 7.2% |
| Mobile Home / Other | 0 | 0.0% |
| Total | 862 | 100.0% |
Housing Structures by Occupancy in Rollingwood
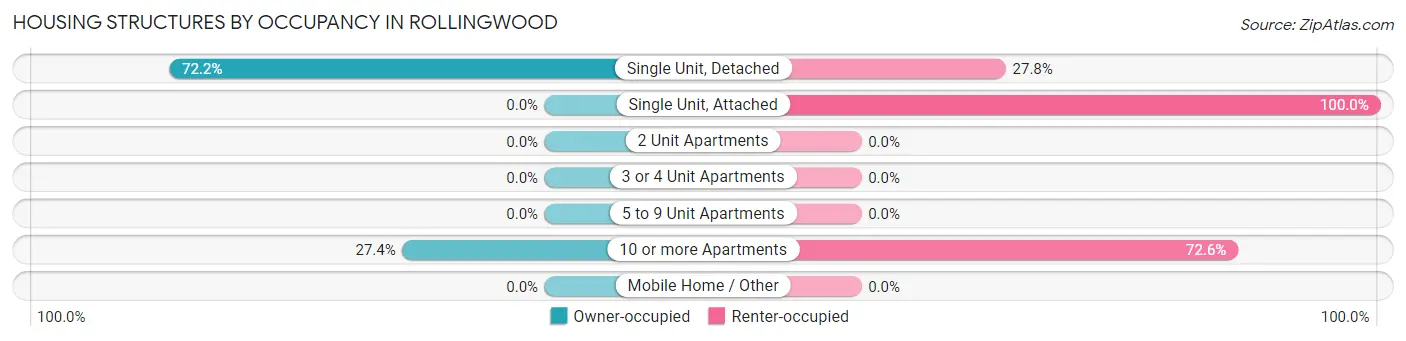
| Structure Type | Owner-occupied | Renter-occupied |
| Single Unit, Detached | 545 (72.2%) | 210 (27.8%) |
| Single Unit, Attached | 0 (0.0%) | 45 (100.0%) |
| 2 Unit Apartments | 0 (0.0%) | 0 (0.0%) |
| 3 or 4 Unit Apartments | 0 (0.0%) | 0 (0.0%) |
| 5 to 9 Unit Apartments | 0 (0.0%) | 0 (0.0%) |
| 10 or more Apartments | 17 (27.4%) | 45 (72.6%) |
| Mobile Home / Other | 0 (0.0%) | 0 (0.0%) |
| Total | 562 (65.2%) | 300 (34.8%) |
Housing Structures by Number of Rooms in Rollingwood
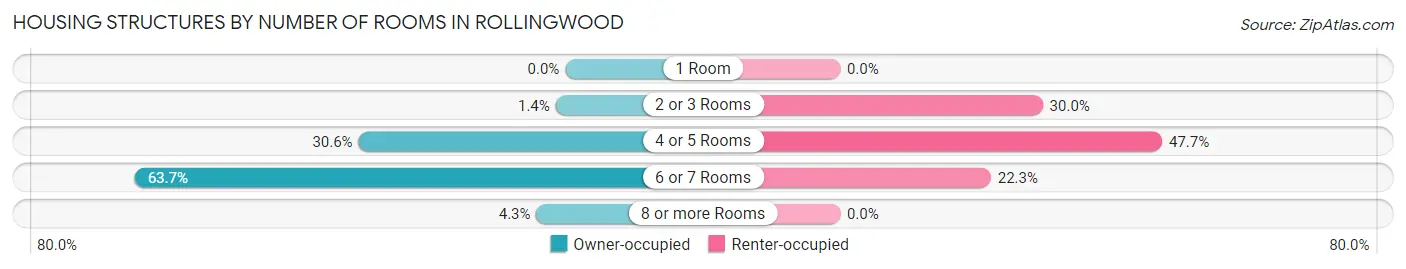
| Number of Rooms | Owner-occupied | Renter-occupied |
| 1 Room | 0 (0.0%) | 0 (0.0%) |
| 2 or 3 Rooms | 8 (1.4%) | 90 (30.0%) |
| 4 or 5 Rooms | 172 (30.6%) | 143 (47.7%) |
| 6 or 7 Rooms | 358 (63.7%) | 67 (22.3%) |
| 8 or more Rooms | 24 (4.3%) | 0 (0.0%) |
| Total | 562 (100.0%) | 300 (100.0%) |
Housing Structure by Heating Type in Rollingwood
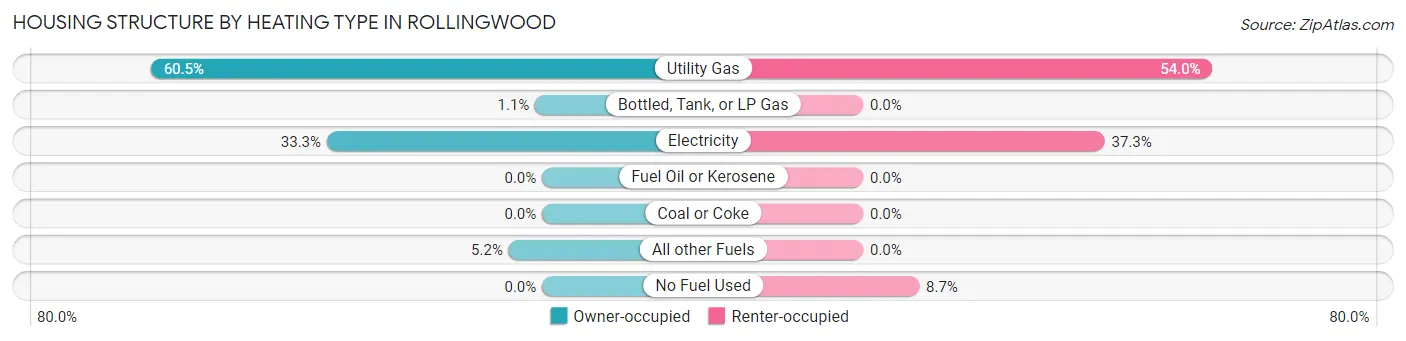
| Heating Type | Owner-occupied | Renter-occupied |
| Utility Gas | 340 (60.5%) | 162 (54.0%) |
| Bottled, Tank, or LP Gas | 6 (1.1%) | 0 (0.0%) |
| Electricity | 187 (33.3%) | 112 (37.3%) |
| Fuel Oil or Kerosene | 0 (0.0%) | 0 (0.0%) |
| Coal or Coke | 0 (0.0%) | 0 (0.0%) |
| All other Fuels | 29 (5.2%) | 0 (0.0%) |
| No Fuel Used | 0 (0.0%) | 26 (8.7%) |
| Total | 562 (100.0%) | 300 (100.0%) |
Household Vehicle Usage in Rollingwood
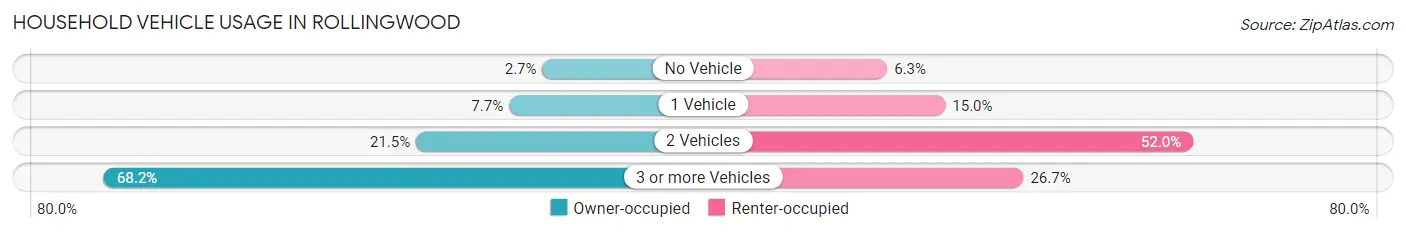
| Vehicles per Household | Owner-occupied | Renter-occupied |
| No Vehicle | 15 (2.7%) | 19 (6.3%) |
| 1 Vehicle | 43 (7.6%) | 45 (15.0%) |
| 2 Vehicles | 121 (21.5%) | 156 (52.0%) |
| 3 or more Vehicles | 383 (68.1%) | 80 (26.7%) |
| Total | 562 (100.0%) | 300 (100.0%) |
Real Estate & Mortgages in Rollingwood
Real Estate and Mortgage Overview in Rollingwood
| Characteristic | Without Mortgage | With Mortgage |
| Housing Units | 147 | 415 |
| Median Property Value | $523,100 | $605,900 |
| Median Household Income | $110,265 | $90 |
| Monthly Housing Costs | $589 | $27 |
| Real Estate Taxes | $3,158 | $0 |
Property Value by Mortgage Status in Rollingwood
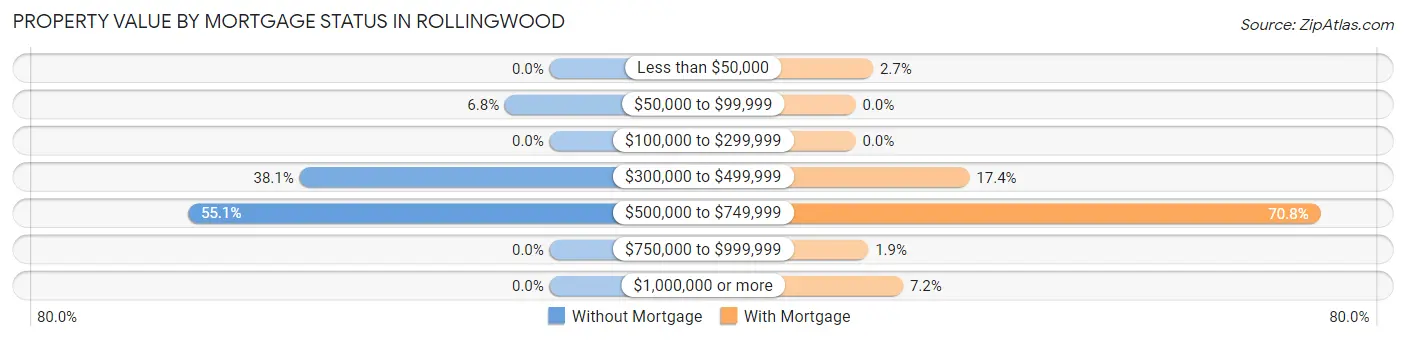
| Property Value | Without Mortgage | With Mortgage |
| Less than $50,000 | 0 (0.0%) | 11 (2.6%) |
| $50,000 to $99,999 | 10 (6.8%) | 0 (0.0%) |
| $100,000 to $299,999 | 0 (0.0%) | 0 (0.0%) |
| $300,000 to $499,999 | 56 (38.1%) | 72 (17.3%) |
| $500,000 to $749,999 | 81 (55.1%) | 294 (70.8%) |
| $750,000 to $999,999 | 0 (0.0%) | 8 (1.9%) |
| $1,000,000 or more | 0 (0.0%) | 30 (7.2%) |
| Total | 147 (100.0%) | 415 (100.0%) |
Household Income by Mortgage Status in Rollingwood
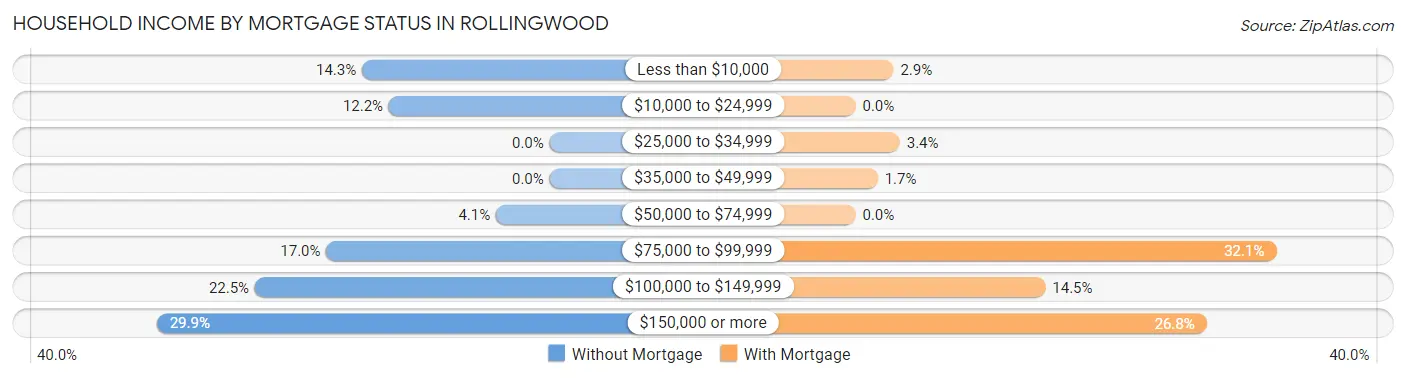
| Household Income | Without Mortgage | With Mortgage |
| Less than $10,000 | 21 (14.3%) | 12 (2.9%) |
| $10,000 to $24,999 | 18 (12.2%) | 0 (0.0%) |
| $25,000 to $34,999 | 0 (0.0%) | 14 (3.4%) |
| $35,000 to $49,999 | 0 (0.0%) | 7 (1.7%) |
| $50,000 to $74,999 | 6 (4.1%) | 0 (0.0%) |
| $75,000 to $99,999 | 25 (17.0%) | 133 (32.1%) |
| $100,000 to $149,999 | 33 (22.5%) | 60 (14.5%) |
| $150,000 or more | 44 (29.9%) | 111 (26.8%) |
| Total | 147 (100.0%) | 415 (100.0%) |
Property Value to Household Income Ratio in Rollingwood
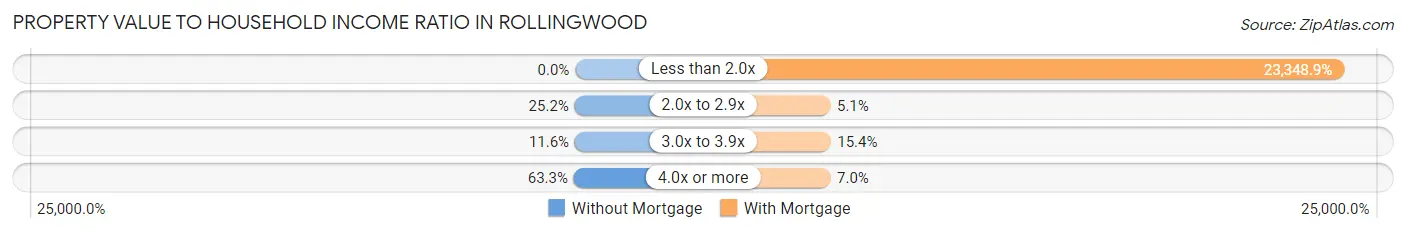
| Value-to-Income Ratio | Without Mortgage | With Mortgage |
| Less than 2.0x | 0 (0.0%) | 96,898 (23,348.9%) |
| 2.0x to 2.9x | 37 (25.2%) | 21 (5.1%) |
| 3.0x to 3.9x | 17 (11.6%) | 64 (15.4%) |
| 4.0x or more | 93 (63.3%) | 29 (7.0%) |
| Total | 147 (100.0%) | 415 (100.0%) |
Real Estate Taxes by Mortgage Status in Rollingwood
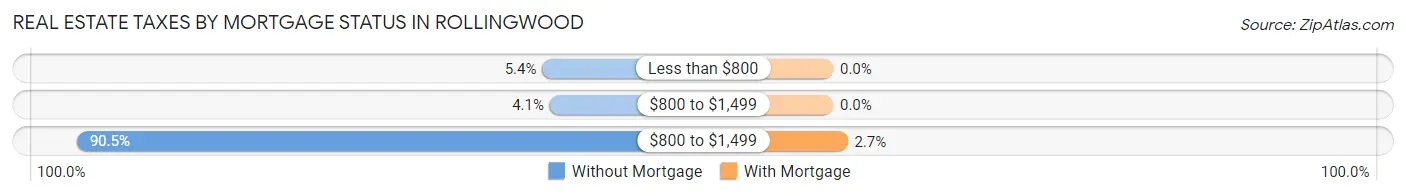
| Property Taxes | Without Mortgage | With Mortgage |
| Less than $800 | 8 (5.4%) | 0 (0.0%) |
| $800 to $1,499 | 6 (4.1%) | 0 (0.0%) |
| $800 to $1,499 | 133 (90.5%) | 11 (2.6%) |
| Total | 147 (100.0%) | 415 (100.0%) |
Health & Disability in Rollingwood
Health Insurance Coverage by Age in Rollingwood
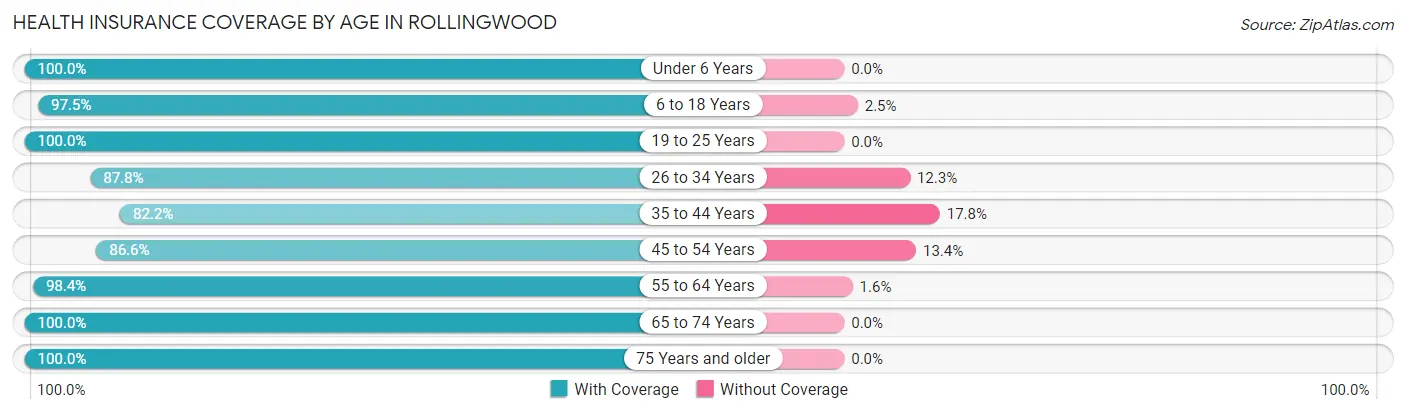
| Age Bracket | With Coverage | Without Coverage |
| Under 6 Years | 106 (100.0%) | 0 (0.0%) |
| 6 to 18 Years | 778 (97.5%) | 20 (2.5%) |
| 19 to 25 Years | 383 (100.0%) | 0 (0.0%) |
| 26 to 34 Years | 308 (87.7%) | 43 (12.2%) |
| 35 to 44 Years | 397 (82.2%) | 86 (17.8%) |
| 45 to 54 Years | 544 (86.6%) | 84 (13.4%) |
| 55 to 64 Years | 443 (98.4%) | 7 (1.6%) |
| 65 to 74 Years | 189 (100.0%) | 0 (0.0%) |
| 75 Years and older | 84 (100.0%) | 0 (0.0%) |
| Total | 3,232 (93.1%) | 240 (6.9%) |
Health Insurance Coverage by Citizenship Status in Rollingwood
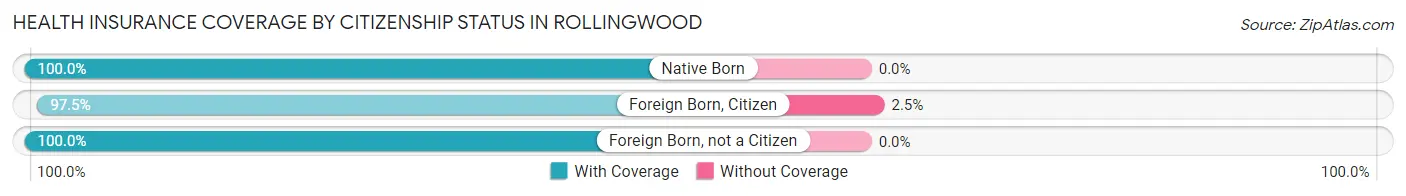
| Citizenship Status | With Coverage | Without Coverage |
| Native Born | 106 (100.0%) | 0 (0.0%) |
| Foreign Born, Citizen | 778 (97.5%) | 20 (2.5%) |
| Foreign Born, not a Citizen | 383 (100.0%) | 0 (0.0%) |
Health Insurance Coverage by Household Income in Rollingwood
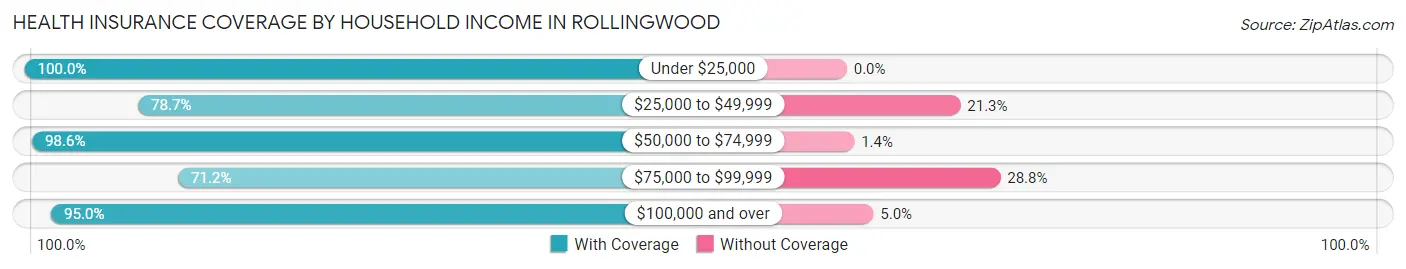
| Household Income | With Coverage | Without Coverage |
| Under $25,000 | 363 (100.0%) | 0 (0.0%) |
| $25,000 to $49,999 | 148 (78.7%) | 40 (21.3%) |
| $50,000 to $74,999 | 495 (98.6%) | 7 (1.4%) |
| $75,000 to $99,999 | 218 (71.2%) | 88 (28.8%) |
| $100,000 and over | 2,008 (95.0%) | 105 (5.0%) |
Public vs Private Health Insurance Coverage by Age in Rollingwood
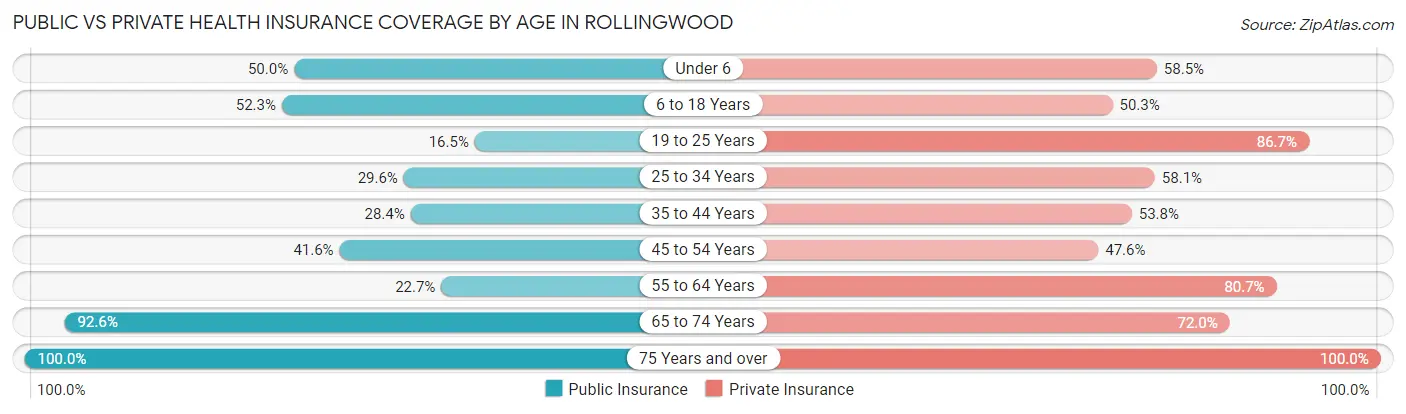
| Age Bracket | Public Insurance | Private Insurance |
| Under 6 | 53 (50.0%) | 62 (58.5%) |
| 6 to 18 Years | 417 (52.3%) | 401 (50.2%) |
| 19 to 25 Years | 63 (16.5%) | 332 (86.7%) |
| 25 to 34 Years | 104 (29.6%) | 204 (58.1%) |
| 35 to 44 Years | 137 (28.4%) | 260 (53.8%) |
| 45 to 54 Years | 261 (41.6%) | 299 (47.6%) |
| 55 to 64 Years | 102 (22.7%) | 363 (80.7%) |
| 65 to 74 Years | 175 (92.6%) | 136 (72.0%) |
| 75 Years and over | 84 (100.0%) | 84 (100.0%) |
| Total | 1,396 (40.2%) | 2,141 (61.7%) |
Disability Status by Sex by Age in Rollingwood
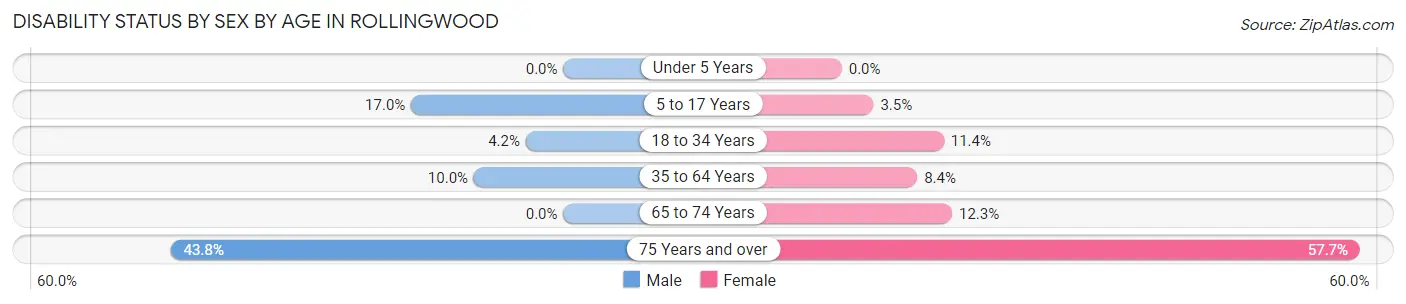
| Age Bracket | Male | Female |
| Under 5 Years | 0 (0.0%) | 0 (0.0%) |
| 5 to 17 Years | 69 (17.0%) | 15 (3.5%) |
| 18 to 34 Years | 17 (4.2%) | 40 (11.4%) |
| 35 to 64 Years | 82 (10.0%) | 62 (8.4%) |
| 65 to 74 Years | 0 (0.0%) | 14 (12.3%) |
| 75 Years and over | 14 (43.8%) | 30 (57.7%) |
Disability Class by Sex by Age in Rollingwood
Disability Class: Hearing Difficulty
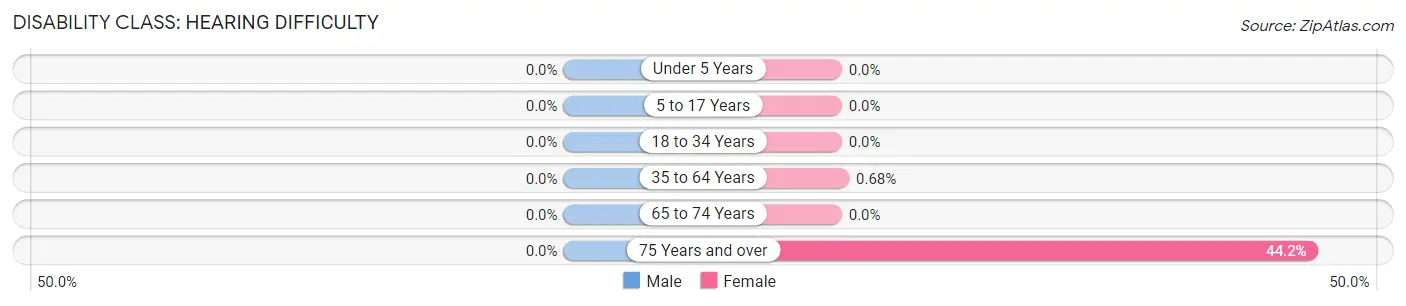
| Age Bracket | Male | Female |
| Under 5 Years | 0 (0.0%) | 0 (0.0%) |
| 5 to 17 Years | 0 (0.0%) | 0 (0.0%) |
| 18 to 34 Years | 0 (0.0%) | 0 (0.0%) |
| 35 to 64 Years | 0 (0.0%) | 5 (0.7%) |
| 65 to 74 Years | 0 (0.0%) | 0 (0.0%) |
| 75 Years and over | 0 (0.0%) | 23 (44.2%) |
Disability Class: Vision Difficulty
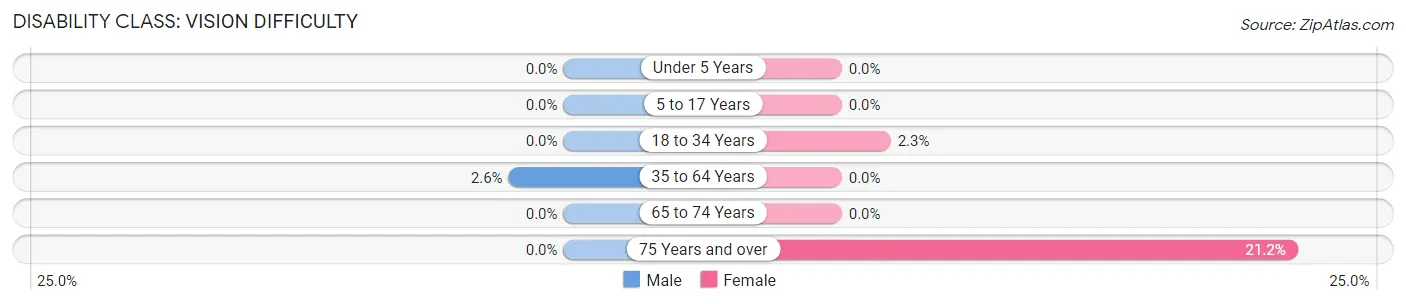
| Age Bracket | Male | Female |
| Under 5 Years | 0 (0.0%) | 0 (0.0%) |
| 5 to 17 Years | 0 (0.0%) | 0 (0.0%) |
| 18 to 34 Years | 0 (0.0%) | 8 (2.3%) |
| 35 to 64 Years | 21 (2.5%) | 0 (0.0%) |
| 65 to 74 Years | 0 (0.0%) | 0 (0.0%) |
| 75 Years and over | 0 (0.0%) | 11 (21.1%) |
Disability Class: Cognitive Difficulty
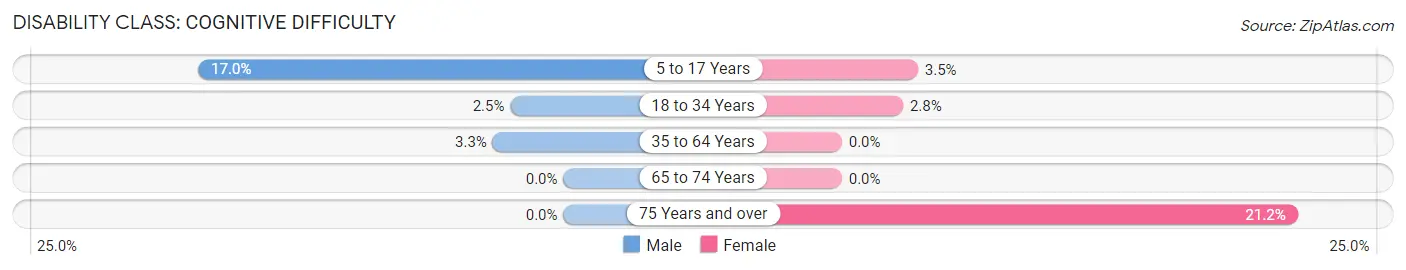
| Age Bracket | Male | Female |
| 5 to 17 Years | 69 (17.0%) | 15 (3.5%) |
| 18 to 34 Years | 10 (2.5%) | 10 (2.8%) |
| 35 to 64 Years | 27 (3.3%) | 0 (0.0%) |
| 65 to 74 Years | 0 (0.0%) | 0 (0.0%) |
| 75 Years and over | 0 (0.0%) | 11 (21.1%) |
Disability Class: Ambulatory Difficulty
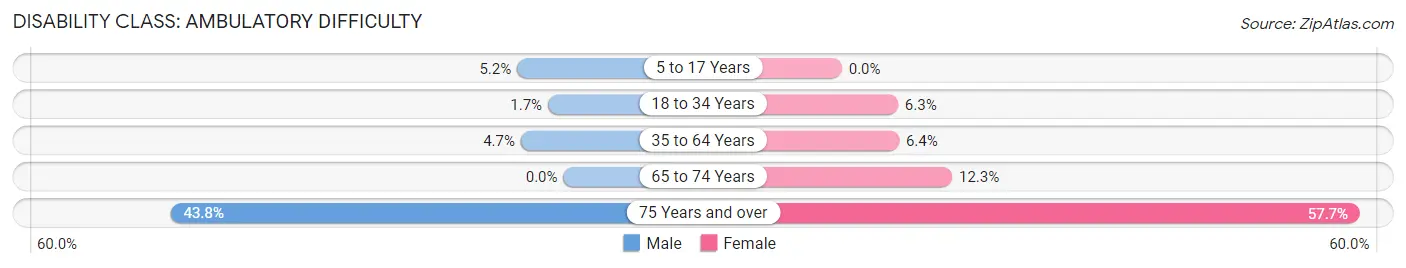
| Age Bracket | Male | Female |
| 5 to 17 Years | 21 (5.2%) | 0 (0.0%) |
| 18 to 34 Years | 7 (1.7%) | 22 (6.2%) |
| 35 to 64 Years | 39 (4.7%) | 47 (6.4%) |
| 65 to 74 Years | 0 (0.0%) | 14 (12.3%) |
| 75 Years and over | 14 (43.8%) | 30 (57.7%) |
Disability Class: Self-Care Difficulty
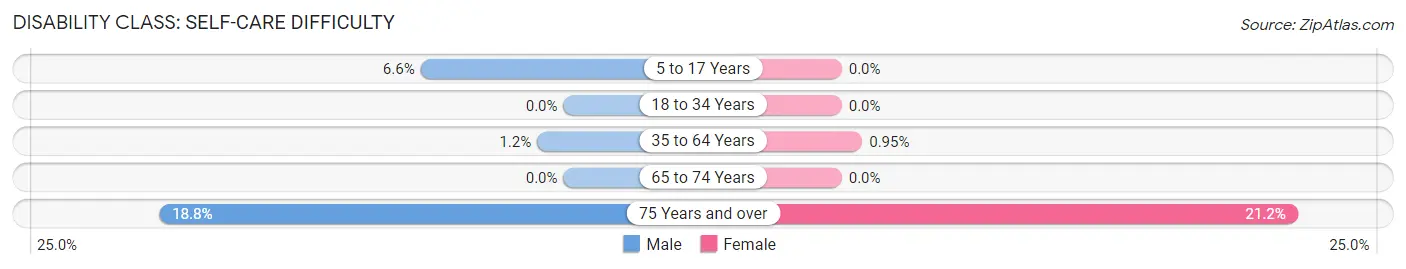
| Age Bracket | Male | Female |
| 5 to 17 Years | 27 (6.6%) | 0 (0.0%) |
| 18 to 34 Years | 0 (0.0%) | 0 (0.0%) |
| 35 to 64 Years | 10 (1.2%) | 7 (0.9%) |
| 65 to 74 Years | 0 (0.0%) | 0 (0.0%) |
| 75 Years and over | 6 (18.8%) | 11 (21.1%) |
Technology Access in Rollingwood
Computing Device Access in Rollingwood
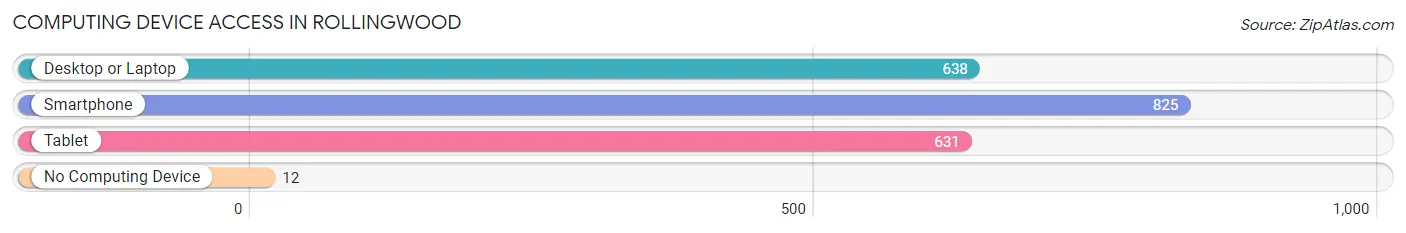
| Device Type | # Households | % Households |
| Desktop or Laptop | 638 | 74.0% |
| Smartphone | 825 | 95.7% |
| Tablet | 631 | 73.2% |
| No Computing Device | 12 | 1.4% |
| Total | 862 | 100.0% |
Internet Access in Rollingwood
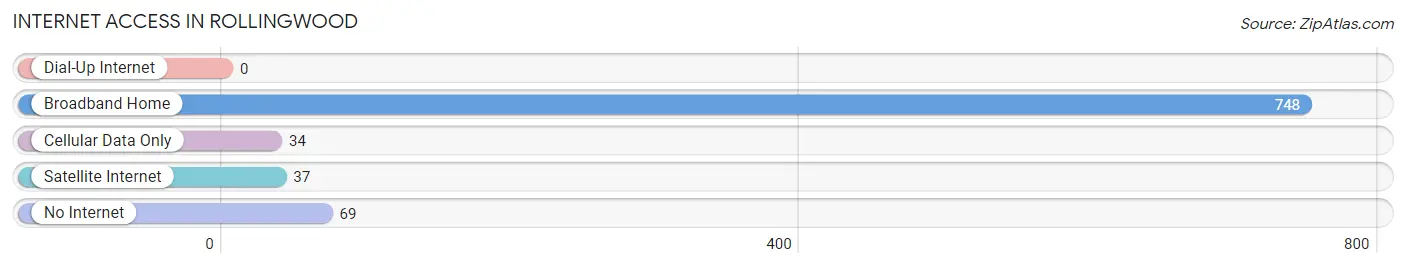
| Internet Type | # Households | % Households |
| Dial-Up Internet | 0 | 0.0% |
| Broadband Home | 748 | 86.8% |
| Cellular Data Only | 34 | 3.9% |
| Satellite Internet | 37 | 4.3% |
| No Internet | 69 | 8.0% |
| Total | 862 | 100.0% |
Rollingwood Summary
Rollingwood is a small, unincorporated community located in Marin County, California. It is situated on the western edge of the San Francisco Bay, just south of the city of Sausalito. The community is bordered by the cities of Mill Valley and Corte Madera, and is part of the larger Marin County area. Rollingwood is home to approximately 1,000 residents, and is known for its quiet, residential atmosphere.
History
Rollingwood was originally part of the Rancho Corte Madera del Presidio, a Mexican land grant given to John Thomas Reed in 1834. The area was later developed by the Reed family, who built a sawmill and a small village. The village was named Rollingwood in 1876, after the rolling hills of the area.
In the early 1900s, the area was developed further by the construction of a railroad line, which connected the community to the nearby cities of Mill Valley and Corte Madera. The railroad line was eventually abandoned in the 1950s, and the area was rezoned for residential development.
Geography
Rollingwood is located in Marin County, California, on the western edge of the San Francisco Bay. It is bordered by the cities of Mill Valley and Corte Madera, and is part of the larger Marin County area. The community is situated on a hillside, and is surrounded by rolling hills and wooded areas.
The climate in Rollingwood is mild and temperate, with warm summers and cool winters. The average annual temperature is around 60 degrees Fahrenheit, and the average annual precipitation is around 25 inches.
Economy
The economy of Rollingwood is largely based on the service industry. The community is home to a variety of restaurants, cafes, and retail stores. There are also several professional services, such as accounting and legal firms, located in the area.
The community is also home to a number of small businesses, such as art galleries, antique stores, and specialty shops. Many of these businesses are owned and operated by local residents.
Demographics
As of the 2010 census, the population of Rollingwood was 1,000. The racial makeup of the community was 87.7% White, 5.2% Asian, 2.2% African American, 0.7% Native American, and 4.2% from other races. The median household income was $90,000, and the median age was 44.
Conclusion
Rollingwood is a small, unincorporated community located in Marin County, California. It is situated on the western edge of the San Francisco Bay, just south of the city of Sausalito. The community is bordered by the cities of Mill Valley and Corte Madera, and is part of the larger Marin County area. Rollingwood is home to approximately 1,000 residents, and is known for its quiet, residential atmosphere. The economy of Rollingwood is largely based on the service industry, and the population is predominantly White, with a median household income of $90,000 and a median age of 44.
Common Questions
What is Per Capita Income in Rollingwood?
Per Capita income in Rollingwood is $29,249.
What is the Median Family Income in Rollingwood?
Median Family Income in Rollingwood is $97,176.
What is the Median Household income in Rollingwood?
Median Household Income in Rollingwood is $106,786.
What is Income or Wage Gap in Rollingwood?
Income or Wage Gap in Rollingwood is 29.1%.
Women in Rollingwood earn 70.9 cents for every dollar earned by a man.
What is Inequality or Gini Index in Rollingwood?
Inequality or Gini Index in Rollingwood is 0.35.
What is the Total Population of Rollingwood?
Total Population of Rollingwood is 3,483.
What is the Total Male Population of Rollingwood?
Total Male Population of Rollingwood is 1,764.
What is the Total Female Population of Rollingwood?
Total Female Population of Rollingwood is 1,719.
What is the Ratio of Males per 100 Females in Rollingwood?
There are 102.62 Males per 100 Females in Rollingwood.
What is the Ratio of Females per 100 Males in Rollingwood?
There are 97.45 Females per 100 Males in Rollingwood.
What is the Median Population Age in Rollingwood?
Median Population Age in Rollingwood is 36.5 Years.
What is the Average Family Size in Rollingwood
Average Family Size in Rollingwood is 4.5 People.
What is the Average Household Size in Rollingwood
Average Household Size in Rollingwood is 4.0 People.
How Large is the Labor Force in Rollingwood?
There are 1,839 People in the Labor Forcein in Rollingwood.
What is the Percentage of People in the Labor Force in Rollingwood?
66.6% of People are in the Labor Force in Rollingwood.
What is the Unemployment Rate in Rollingwood?
Unemployment Rate in Rollingwood is 12.6%.