Junction City, CA Map & Demographics
Junction City Map
Junction City Overview
$24,123
PER CAPITA INCOME
$62,131
AVG FAMILY INCOME
$60,377
AVG HOUSEHOLD INCOME
18.2%
WAGE / INCOME GAP [ % ]
81.8¢/ $1
WAGE / INCOME GAP [ $ ]
0.40
INEQUALITY / GINI INDEX
1,195
TOTAL POPULATION
865
MALE POPULATION
330
FEMALE POPULATION
262.12
MALES / 100 FEMALES
38.15
FEMALES / 100 MALES
46.9
MEDIAN AGE
4.4
AVG FAMILY SIZE
3.8
AVG HOUSEHOLD SIZE
564
LABOR FORCE [ PEOPLE ]
52.5%
PERCENT IN LABOR FORCE
6.9%
UNEMPLOYMENT RATE
Junction City Zip Codes
Junction City Area Codes
Income in Junction City
Income Overview in Junction City
Per Capita Income in Junction City is $24,123, while median incomes of families and households are $62,131 and $60,377 respectively.
| Characteristic | Number | Measure |
| Per Capita Income | 1,195 | $24,123 |
| Median Family Income | 189 | $62,131 |
| Mean Family Income | 189 | $78,072 |
| Median Household Income | 304 | $60,377 |
| Mean Household Income | 304 | $59,908 |
| Income Deficit | 189 | $0 |
| Wage / Income Gap (%) | 1,195 | 18.23% |
| Wage / Income Gap ($) | 1,195 | 81.77¢ per $1 |
| Gini / Inequality Index | 1,195 | 0.40 |
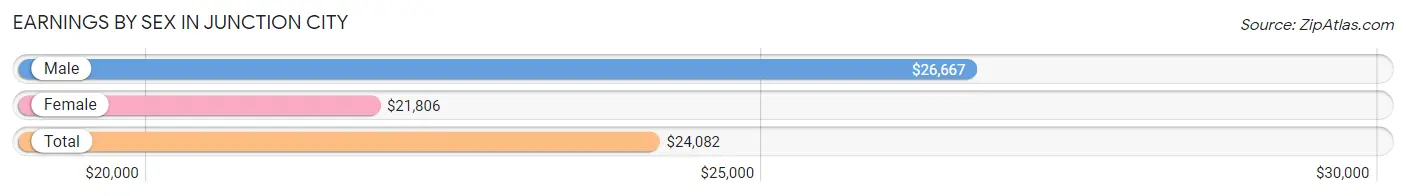
Earnings by Sex in Junction City
Average Earnings in Junction City are $24,082, $26,667 for men and $21,806 for women, a difference of 18.2%.
| Sex | Number | Average Earnings |
| Male | 426 (74.1%) | $26,667 |
| Female | 149 (25.9%) | $21,806 |
| Total | 575 (100.0%) | $24,082 |
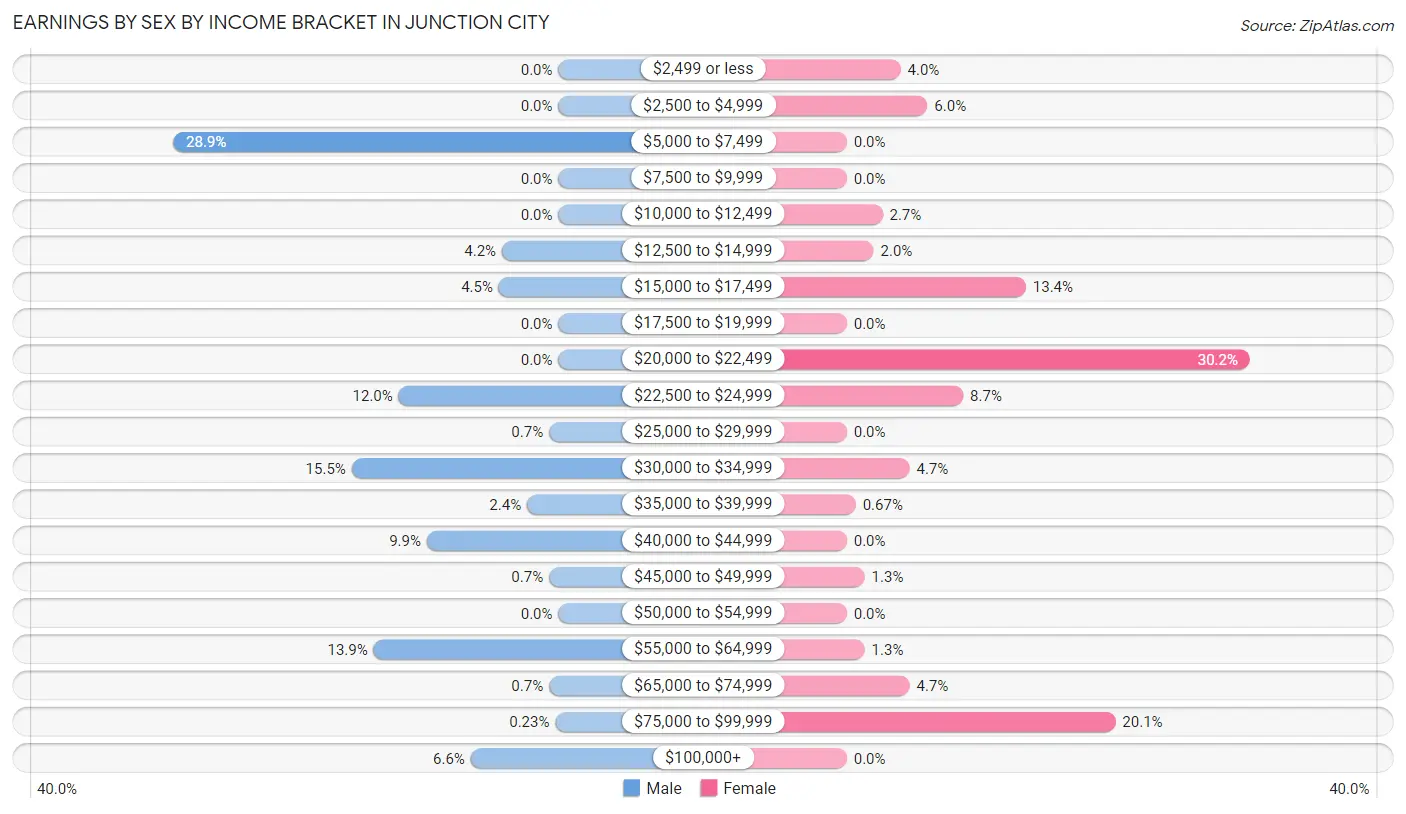
Earnings by Sex by Income Bracket in Junction City
The most common earnings brackets in Junction City are $5,000 to $7,499 for men (123 | 28.9%) and $20,000 to $22,499 for women (45 | 30.2%).
| Income | Male | Female |
| $2,499 or less | 0 (0.0%) | 6 (4.0%) |
| $2,500 to $4,999 | 0 (0.0%) | 9 (6.0%) |
| $5,000 to $7,499 | 123 (28.9%) | 0 (0.0%) |
| $7,500 to $9,999 | 0 (0.0%) | 0 (0.0%) |
| $10,000 to $12,499 | 0 (0.0%) | 4 (2.7%) |
| $12,500 to $14,999 | 18 (4.2%) | 3 (2.0%) |
| $15,000 to $17,499 | 19 (4.5%) | 20 (13.4%) |
| $17,500 to $19,999 | 0 (0.0%) | 0 (0.0%) |
| $20,000 to $22,499 | 0 (0.0%) | 45 (30.2%) |
| $22,500 to $24,999 | 51 (12.0%) | 13 (8.7%) |
| $25,000 to $29,999 | 3 (0.7%) | 0 (0.0%) |
| $30,000 to $34,999 | 66 (15.5%) | 7 (4.7%) |
| $35,000 to $39,999 | 10 (2.4%) | 1 (0.7%) |
| $40,000 to $44,999 | 42 (9.9%) | 0 (0.0%) |
| $45,000 to $49,999 | 3 (0.7%) | 2 (1.3%) |
| $50,000 to $54,999 | 0 (0.0%) | 0 (0.0%) |
| $55,000 to $64,999 | 59 (13.9%) | 2 (1.3%) |
| $65,000 to $74,999 | 3 (0.7%) | 7 (4.7%) |
| $75,000 to $99,999 | 1 (0.2%) | 30 (20.1%) |
| $100,000+ | 28 (6.6%) | 0 (0.0%) |
| Total | 426 (100.0%) | 149 (100.0%) |
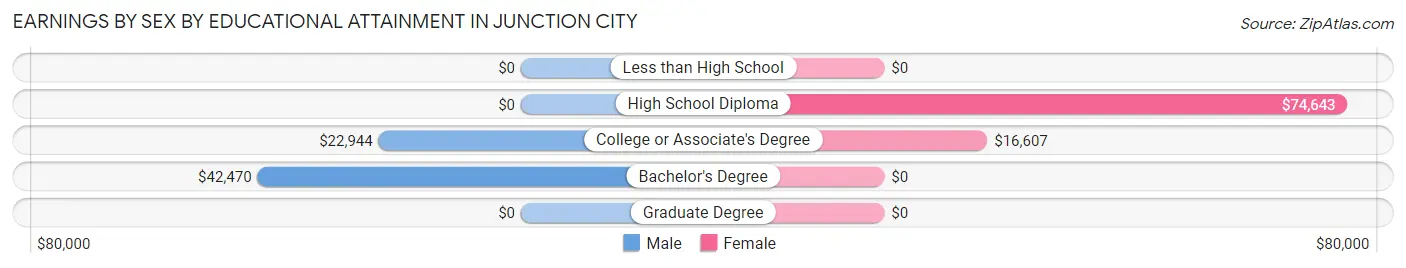
Earnings by Sex by Educational Attainment in Junction City
Average earnings in Junction City are $30,436 for men and $21,889 for women, a difference of 28.1%. Men with an educational attainment of bachelor's degree enjoy the highest average annual earnings of $42,470, while those with college or associate's degree education earn the least with $22,944. Women with an educational attainment of high school diploma earn the most with the average annual earnings of $74,643, while those with college or associate's degree education have the smallest earnings of $16,607.
| Educational Attainment | Male Income | Female Income |
| Less than High School | - | - |
| High School Diploma | - | - |
| College or Associate's Degree | $22,944 | $16,607 |
| Bachelor's Degree | $42,470 | $0 |
| Graduate Degree | - | - |
| Total | $30,436 | $21,889 |
Family Income in Junction City
Family Income Brackets in Junction City
According to the Junction City family income data, there are 62 families falling into the $50,000 to $74,999 income range, which is the most common income bracket and makes up 32.8% of all families.
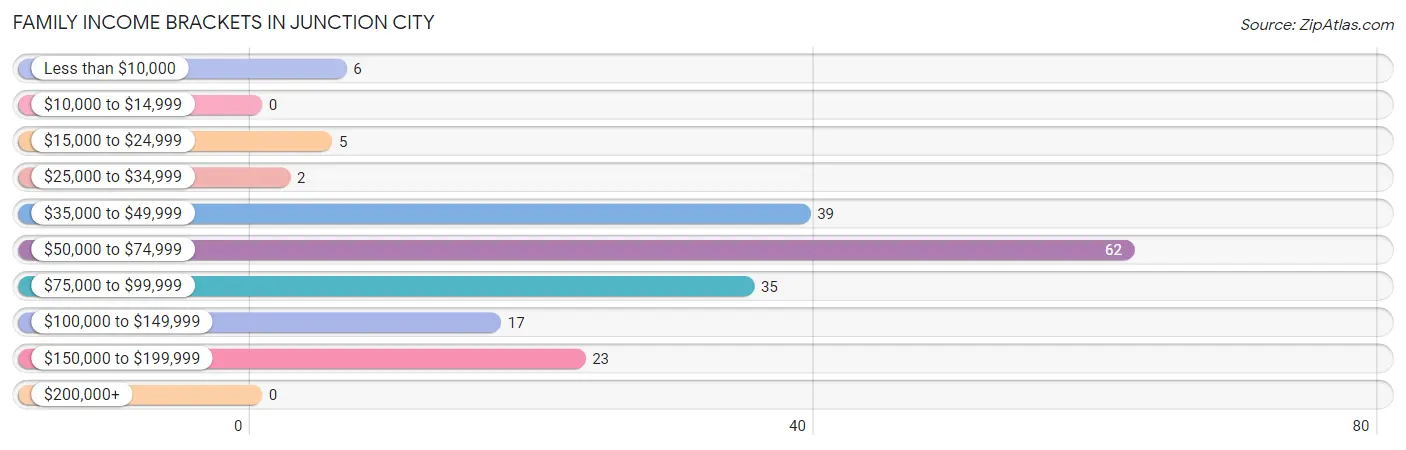
| Income Bracket | # Families | % Families |
| Less than $10,000 | 6 | 3.2% |
| $10,000 to $14,999 | 0 | 0.0% |
| $15,000 to $24,999 | 5 | 2.6% |
| $25,000 to $34,999 | 2 | 1.1% |
| $35,000 to $49,999 | 39 | 20.6% |
| $50,000 to $74,999 | 62 | 32.8% |
| $75,000 to $99,999 | 35 | 18.5% |
| $100,000 to $149,999 | 17 | 9.0% |
| $150,000 to $199,999 | 23 | 12.2% |
| $200,000+ | 0 | 0.0% |
Family Income by Famaliy Size in Junction City
2-person families (123 | 65.1%) account for the highest median family income in Junction City with $62,404 per family, while 2-person families (123 | 65.1%) have the highest median income of $31,202 per family member.
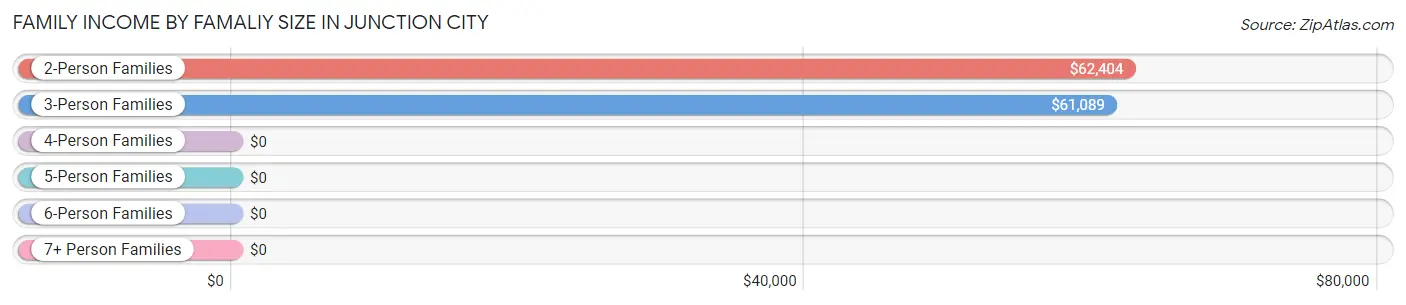
| Income Bracket | # Families | Median Income |
| 2-Person Families | 123 (65.1%) | $62,404 |
| 3-Person Families | 39 (20.6%) | $61,089 |
| 4-Person Families | 4 (2.1%) | $0 |
| 5-Person Families | 1 (0.5%) | $0 |
| 6-Person Families | 0 (0.0%) | $0 |
| 7+ Person Families | 22 (11.6%) | $0 |
| Total | 189 (100.0%) | $62,131 |
Family Income by Number of Earners in Junction City
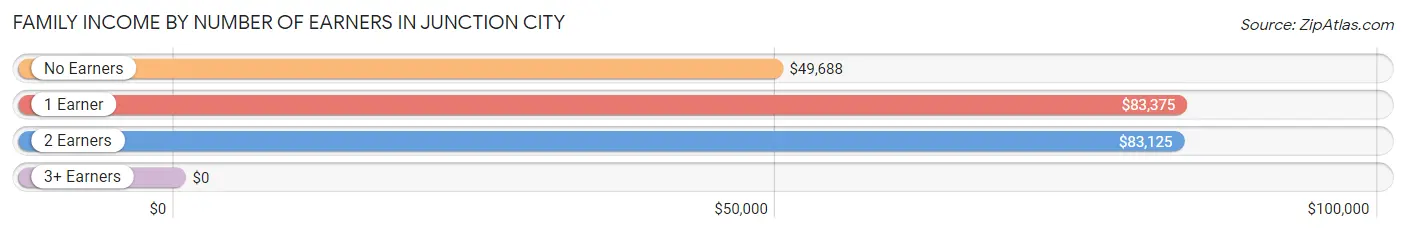
| Number of Earners | # Families | Median Income |
| No Earners | 44 (23.3%) | $49,688 |
| 1 Earner | 74 (39.2%) | $83,375 |
| 2 Earners | 26 (13.8%) | $83,125 |
| 3+ Earners | 45 (23.8%) | $0 |
| Total | 189 (100.0%) | $62,131 |
Household Income in Junction City
Household Income Brackets in Junction City
With 86 households falling in the category, the $50,000 to $74,999 income range is the most frequent in Junction City, accounting for 28.3% of all households.
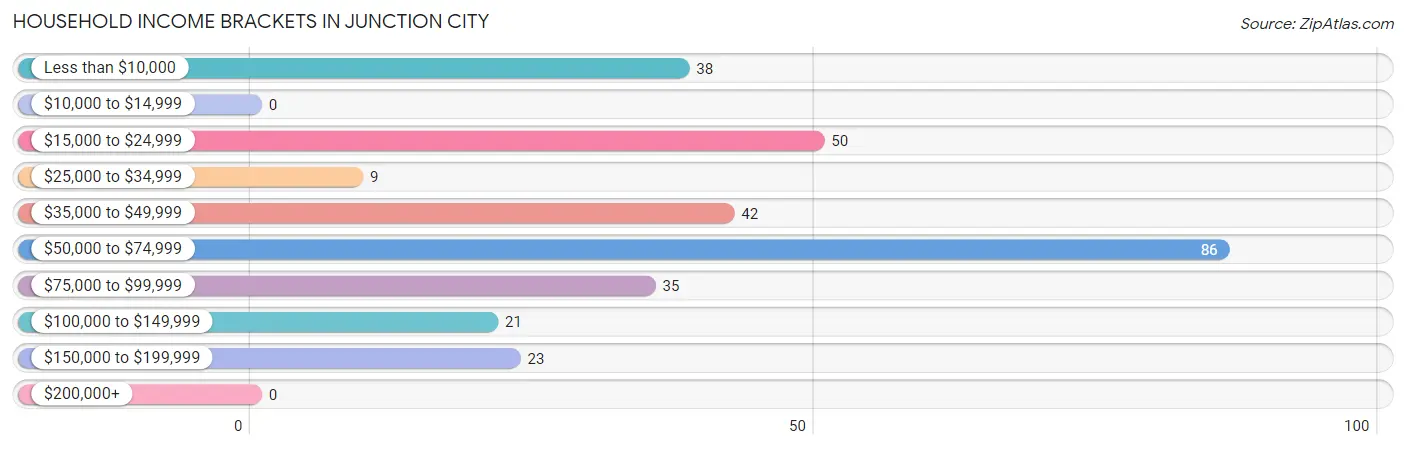
| Income Bracket | # Households | % Households |
| Less than $10,000 | 38 | 12.5% |
| $10,000 to $14,999 | 0 | 0.0% |
| $15,000 to $24,999 | 50 | 16.4% |
| $25,000 to $34,999 | 9 | 3.0% |
| $35,000 to $49,999 | 42 | 13.8% |
| $50,000 to $74,999 | 86 | 28.3% |
| $75,000 to $99,999 | 35 | 11.5% |
| $100,000 to $149,999 | 21 | 6.9% |
| $150,000 to $199,999 | 23 | 7.6% |
| $200,000+ | 0 | 0.0% |
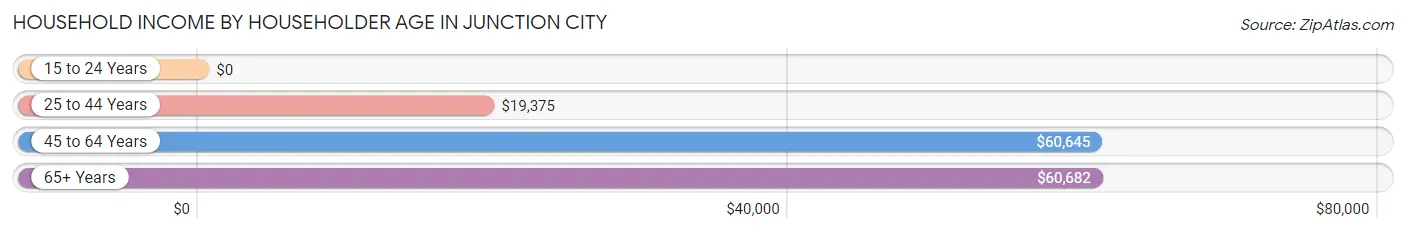
Household Income by Householder Age in Junction City
The median household income in Junction City is $60,377, with the highest median household income of $60,682 found in the 65+ years age bracket for the primary householder. A total of 132 households (43.4%) fall into this category. Meanwhile, the 15 to 24 years age bracket for the primary householder has the lowest median household income of $0, with 7 households (2.3%) in this group.
| Income Bracket | # Households | Median Income |
| 15 to 24 Years | 7 (2.3%) | $0 |
| 25 to 44 Years | 15 (4.9%) | $19,375 |
| 45 to 64 Years | 150 (49.3%) | $60,645 |
| 65+ Years | 132 (43.4%) | $60,682 |
| Total | 304 (100.0%) | $60,377 |
Poverty in Junction City
Income Below Poverty by Sex and Age in Junction City
With 25.7% poverty level for males and 3.0% for females among the residents of Junction City, 55 to 64 year old males and 18 to 24 year old females are the most vulnerable to poverty, with 105 males (55.0%) and 7 females (100.0%) in their respective age groups living below the poverty level.
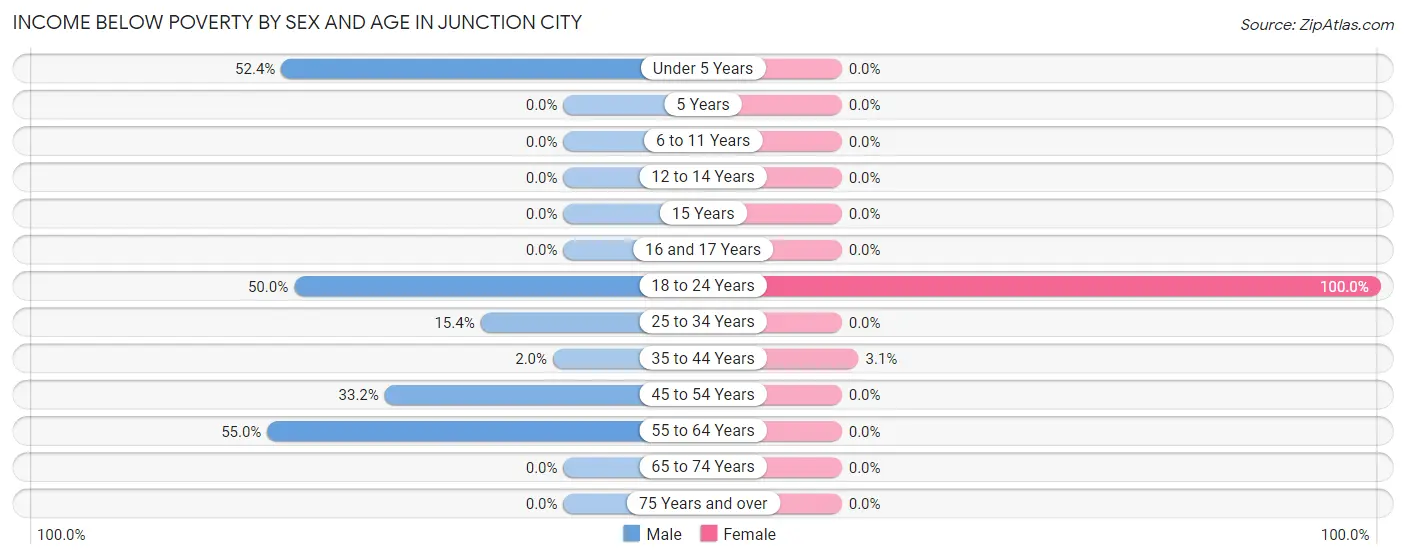
| Age Bracket | Male | Female |
| Under 5 Years | 11 (52.4%) | 0 (0.0%) |
| 5 Years | 0 (0.0%) | 0 (0.0%) |
| 6 to 11 Years | 0 (0.0%) | 0 (0.0%) |
| 12 to 14 Years | 0 (0.0%) | 0 (0.0%) |
| 15 Years | 0 (0.0%) | 0 (0.0%) |
| 16 and 17 Years | 0 (0.0%) | 0 (0.0%) |
| 18 to 24 Years | 25 (50.0%) | 7 (100.0%) |
| 25 to 34 Years | 6 (15.4%) | 0 (0.0%) |
| 35 to 44 Years | 3 (1.9%) | 3 (3.1%) |
| 45 to 54 Years | 72 (33.2%) | 0 (0.0%) |
| 55 to 64 Years | 105 (55.0%) | 0 (0.0%) |
| 65 to 74 Years | 0 (0.0%) | 0 (0.0%) |
| 75 Years and over | 0 (0.0%) | 0 (0.0%) |
| Total | 222 (25.7%) | 10 (3.0%) |
Income Above Poverty by Sex and Age in Junction City
According to the poverty statistics in Junction City, males aged 6 to 11 years and females aged under 5 years are the age groups that are most secure financially, with 100.0% of males and 100.0% of females in these age groups living above the poverty line.
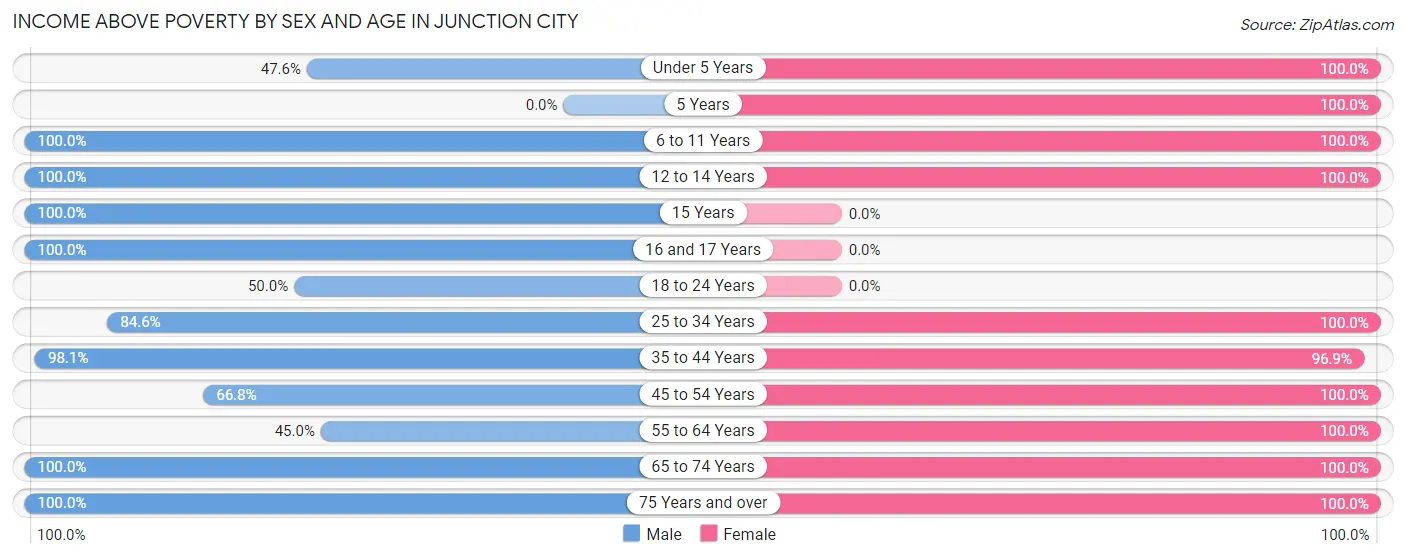
| Age Bracket | Male | Female |
| Under 5 Years | 10 (47.6%) | 35 (100.0%) |
| 5 Years | 0 (0.0%) | 13 (100.0%) |
| 6 to 11 Years | 20 (100.0%) | 15 (100.0%) |
| 12 to 14 Years | 12 (100.0%) | 2 (100.0%) |
| 15 Years | 3 (100.0%) | 0 (0.0%) |
| 16 and 17 Years | 7 (100.0%) | 0 (0.0%) |
| 18 to 24 Years | 25 (50.0%) | 0 (0.0%) |
| 25 to 34 Years | 33 (84.6%) | 3 (100.0%) |
| 35 to 44 Years | 151 (98.1%) | 93 (96.9%) |
| 45 to 54 Years | 145 (66.8%) | 4 (100.0%) |
| 55 to 64 Years | 86 (45.0%) | 70 (100.0%) |
| 65 to 74 Years | 96 (100.0%) | 74 (100.0%) |
| 75 Years and over | 55 (100.0%) | 11 (100.0%) |
| Total | 643 (74.3%) | 320 (97.0%) |
Income Below Poverty Among Married-Couple Families in Junction City
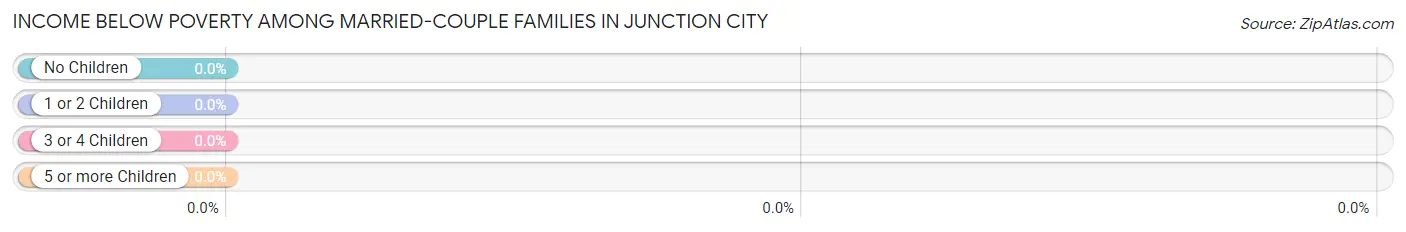
| Children | Above Poverty | Below Poverty |
| No Children | 137 (100.0%) | 0 (0.0%) |
| 1 or 2 Children | 7 (100.0%) | 0 (0.0%) |
| 3 or 4 Children | 22 (100.0%) | 0 (0.0%) |
| 5 or more Children | 0 (0.0%) | 0 (0.0%) |
| Total | 166 (100.0%) | 0 (0.0%) |
Income Below Poverty Among Single-Parent Households in Junction City
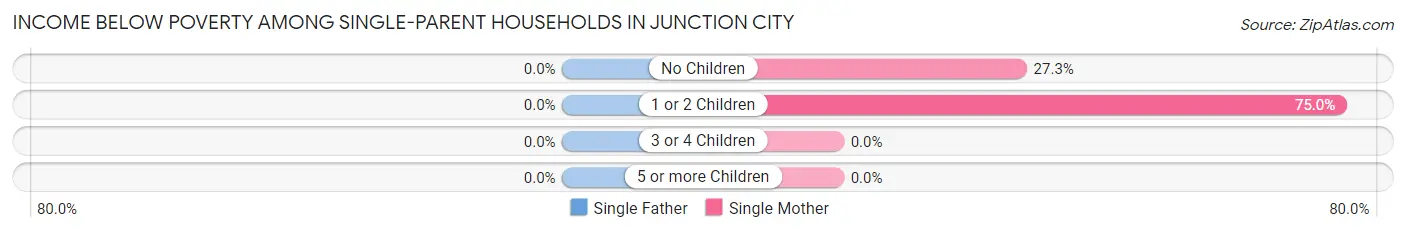
| Children | Single Father | Single Mother |
| No Children | 0 (0.0%) | 3 (27.3%) |
| 1 or 2 Children | 0 (0.0%) | 3 (75.0%) |
| 3 or 4 Children | 0 (0.0%) | 0 (0.0%) |
| 5 or more Children | 0 (0.0%) | 0 (0.0%) |
| Total | 0 (0.0%) | 6 (40.0%) |
Income Below Poverty Among Married-Couple vs Single-Parent Households in Junction City
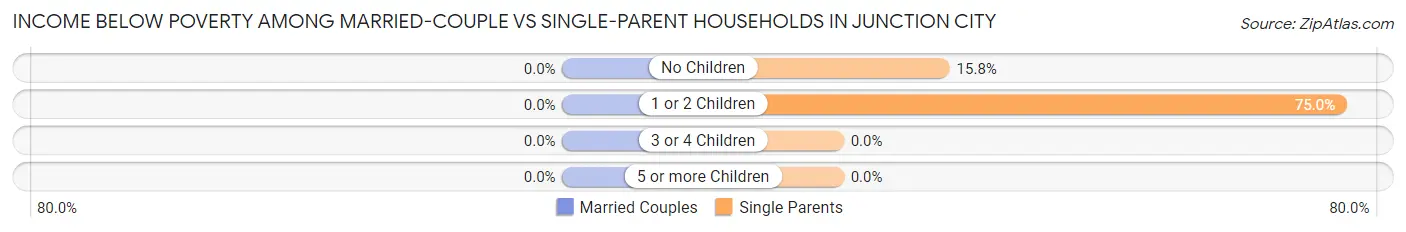
| Children | Married-Couple Families | Single-Parent Households |
| No Children | 0 (0.0%) | 3 (15.8%) |
| 1 or 2 Children | 0 (0.0%) | 3 (75.0%) |
| 3 or 4 Children | 0 (0.0%) | 0 (0.0%) |
| 5 or more Children | 0 (0.0%) | 0 (0.0%) |
| Total | 0 (0.0%) | 6 (26.1%) |
Race in Junction City
The most populous races in Junction City are White / Caucasian (1,022 | 85.5%), Two or more Races (111 | 9.3%), and Hispanic or Latino (69 | 5.8%).
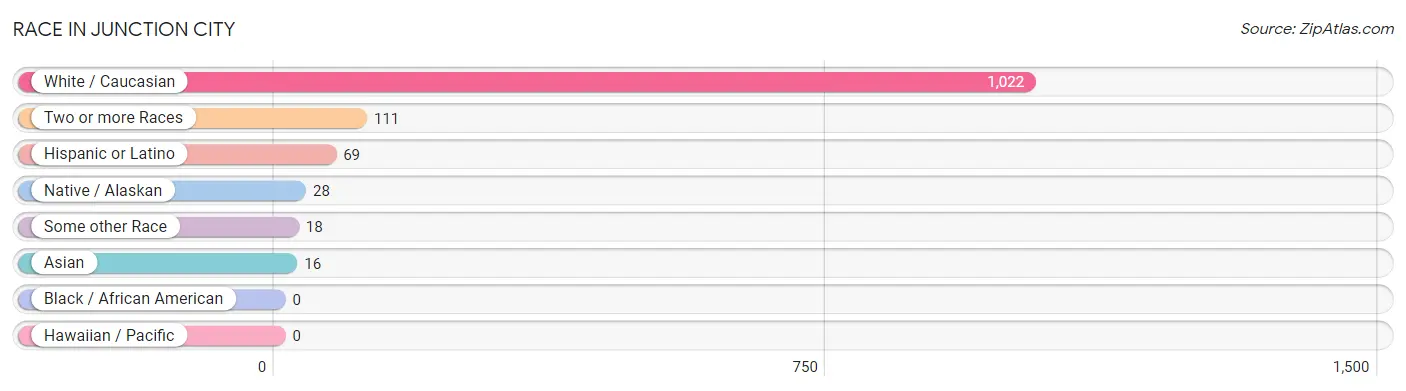
| Race | # Population | % Population |
| Asian | 16 | 1.3% |
| Black / African American | 0 | 0.0% |
| Hawaiian / Pacific | 0 | 0.0% |
| Hispanic or Latino | 69 | 5.8% |
| Native / Alaskan | 28 | 2.3% |
| White / Caucasian | 1,022 | 85.5% |
| Two or more Races | 111 | 9.3% |
| Some other Race | 18 | 1.5% |
| Total | 1,195 | 100.0% |
Ancestry in Junction City
The most populous ancestries reported in Junction City are German (410 | 34.3%), English (229 | 19.2%), American (171 | 14.3%), Irish (111 | 9.3%), and Mexican (60 | 5.0%), together accounting for 82.1% of all Junction City residents.
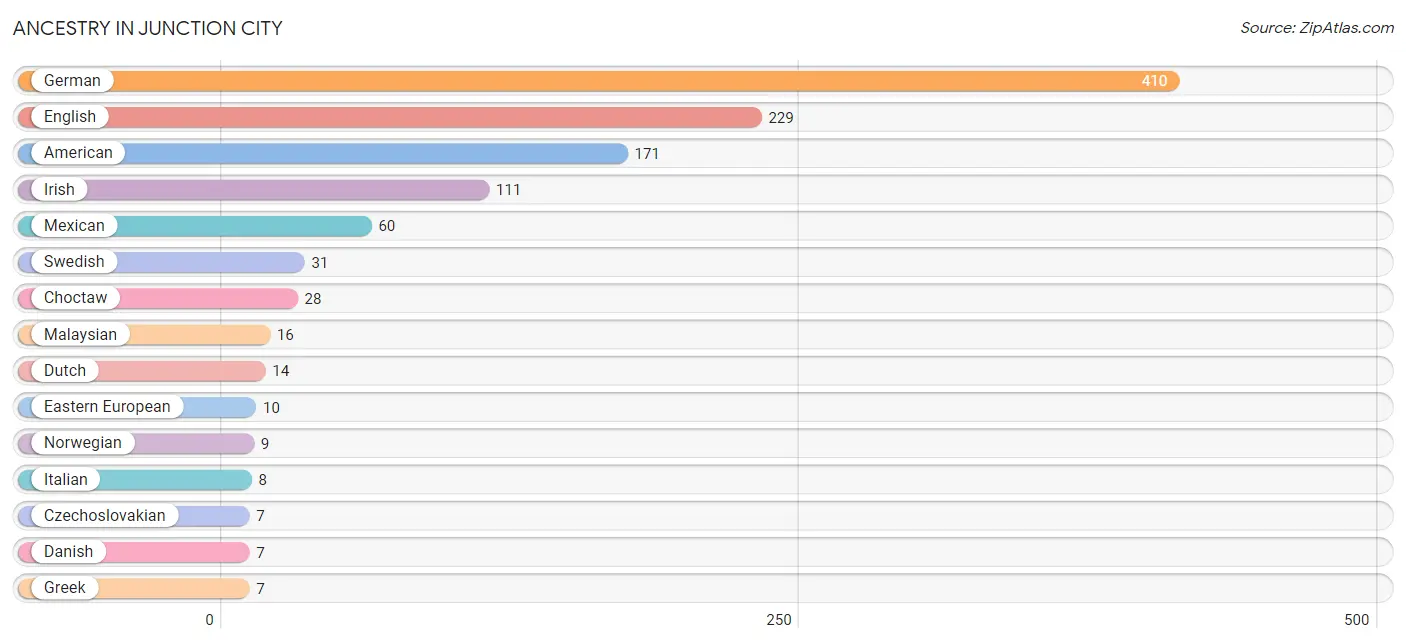
| Ancestry | # Population | % Population |
| American | 171 | 14.3% |
| Armenian | 2 | 0.2% |
| Cherokee | 4 | 0.3% |
| Choctaw | 28 | 2.3% |
| Czechoslovakian | 7 | 0.6% |
| Danish | 7 | 0.6% |
| Dutch | 14 | 1.2% |
| Eastern European | 10 | 0.8% |
| English | 229 | 19.2% |
| European | 4 | 0.3% |
| French | 5 | 0.4% |
| German | 410 | 34.3% |
| Greek | 7 | 0.6% |
| Hungarian | 5 | 0.4% |
| Irish | 111 | 9.3% |
| Italian | 8 | 0.7% |
| Malaysian | 16 | 1.3% |
| Mexican | 60 | 5.0% |
| Norwegian | 9 | 0.7% |
| Russian | 6 | 0.5% |
| Scandinavian | 7 | 0.6% |
| Scottish | 5 | 0.4% |
| Swedish | 31 | 2.6% | View All 23 Rows |
Immigrants in Junction City
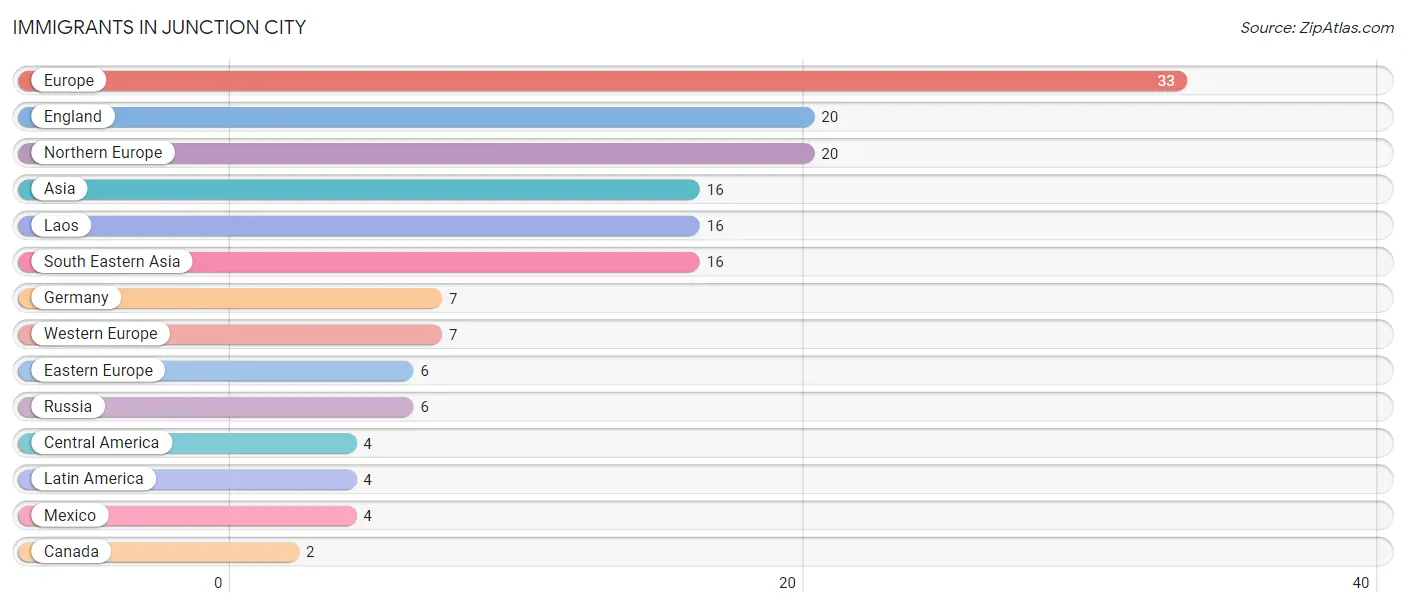
The most numerous immigrant groups reported in Junction City came from Europe (33 | 2.8%), England (20 | 1.7%), Northern Europe (20 | 1.7%), Asia (16 | 1.3%), and Laos (16 | 1.3%), together accounting for 8.8% of all Junction City residents.
| Immigration Origin | # Population | % Population |
| Asia | 16 | 1.3% |
| Canada | 2 | 0.2% |
| Central America | 4 | 0.3% |
| Eastern Europe | 6 | 0.5% |
| England | 20 | 1.7% |
| Europe | 33 | 2.8% |
| Germany | 7 | 0.6% |
| Laos | 16 | 1.3% |
| Latin America | 4 | 0.3% |
| Mexico | 4 | 0.3% |
| Northern Europe | 20 | 1.7% |
| Russia | 6 | 0.5% |
| South Eastern Asia | 16 | 1.3% |
| Western Europe | 7 | 0.6% | View All 14 Rows |
Sex and Age in Junction City
Sex and Age in Junction City
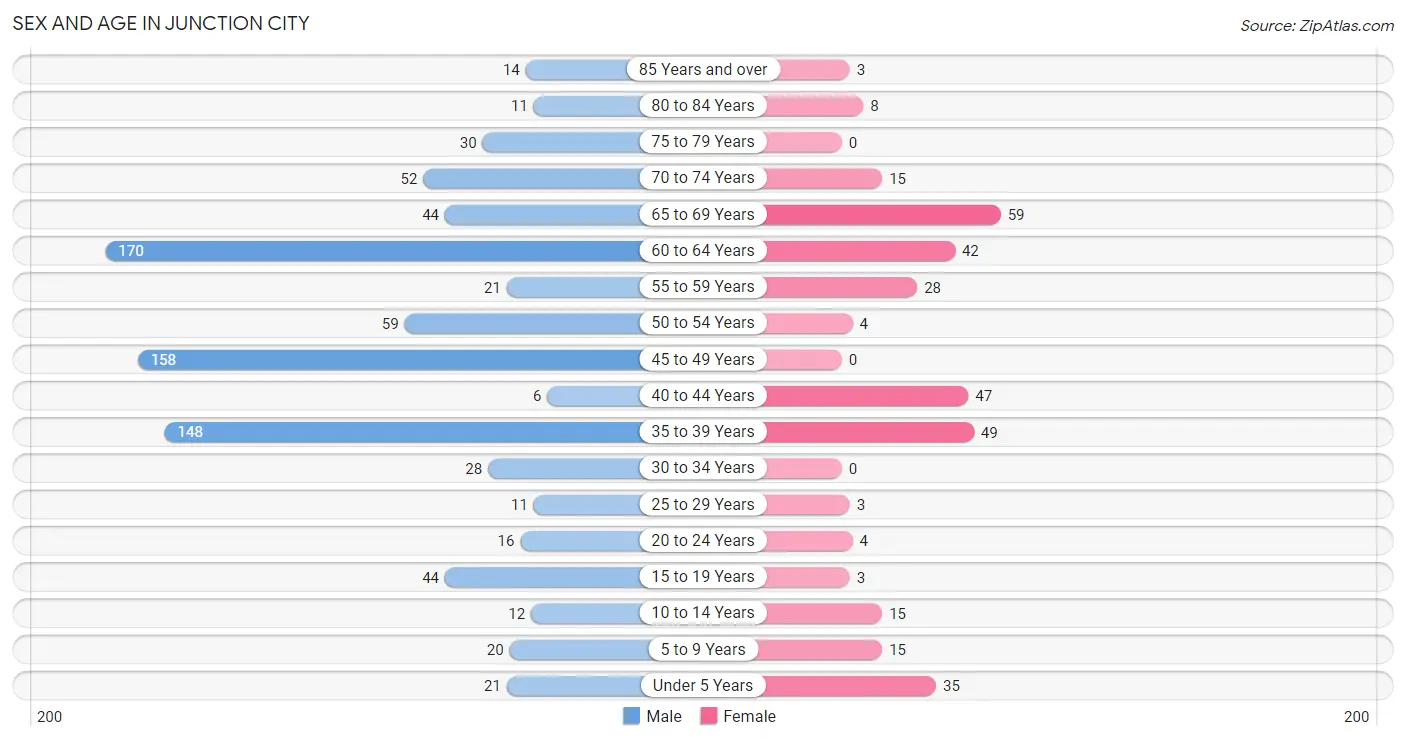
The most populous age groups in Junction City are 60 to 64 Years (170 | 19.7%) for men and 65 to 69 Years (59 | 17.9%) for women.
| Age Bracket | Male | Female |
| Under 5 Years | 21 (2.4%) | 35 (10.6%) |
| 5 to 9 Years | 20 (2.3%) | 15 (4.5%) |
| 10 to 14 Years | 12 (1.4%) | 15 (4.5%) |
| 15 to 19 Years | 44 (5.1%) | 3 (0.9%) |
| 20 to 24 Years | 16 (1.8%) | 4 (1.2%) |
| 25 to 29 Years | 11 (1.3%) | 3 (0.9%) |
| 30 to 34 Years | 28 (3.2%) | 0 (0.0%) |
| 35 to 39 Years | 148 (17.1%) | 49 (14.8%) |
| 40 to 44 Years | 6 (0.7%) | 47 (14.2%) |
| 45 to 49 Years | 158 (18.3%) | 0 (0.0%) |
| 50 to 54 Years | 59 (6.8%) | 4 (1.2%) |
| 55 to 59 Years | 21 (2.4%) | 28 (8.5%) |
| 60 to 64 Years | 170 (19.7%) | 42 (12.7%) |
| 65 to 69 Years | 44 (5.1%) | 59 (17.9%) |
| 70 to 74 Years | 52 (6.0%) | 15 (4.5%) |
| 75 to 79 Years | 30 (3.5%) | 0 (0.0%) |
| 80 to 84 Years | 11 (1.3%) | 8 (2.4%) |
| 85 Years and over | 14 (1.6%) | 3 (0.9%) |
| Total | 865 (100.0%) | 330 (100.0%) |
Families and Households in Junction City
Median Family Size in Junction City
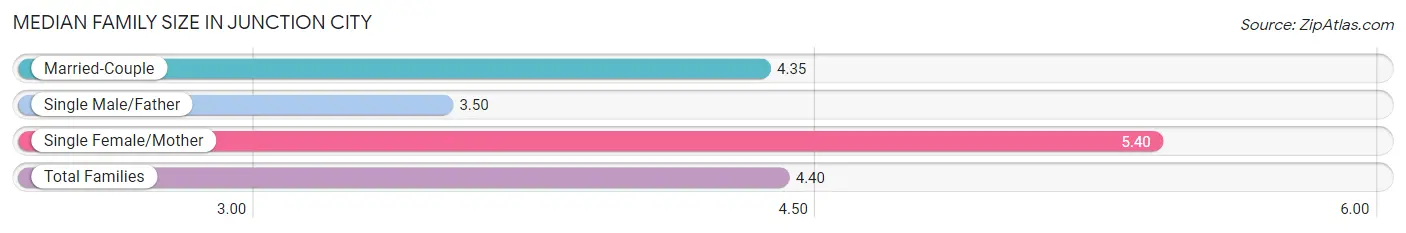
The median family size in Junction City is 4.40 persons per family, with single female/mother families (15 | 7.9%) accounting for the largest median family size of 5.4 persons per family. On the other hand, single male/father families (8 | 4.2%) represent the smallest median family size with 3.50 persons per family.
| Family Type | # Families | Family Size |
| Married-Couple | 166 (87.8%) | 4.35 |
| Single Male/Father | 8 (4.2%) | 3.50 |
| Single Female/Mother | 15 (7.9%) | 5.40 |
| Total Families | 189 (100.0%) | 4.40 |
Median Household Size in Junction City
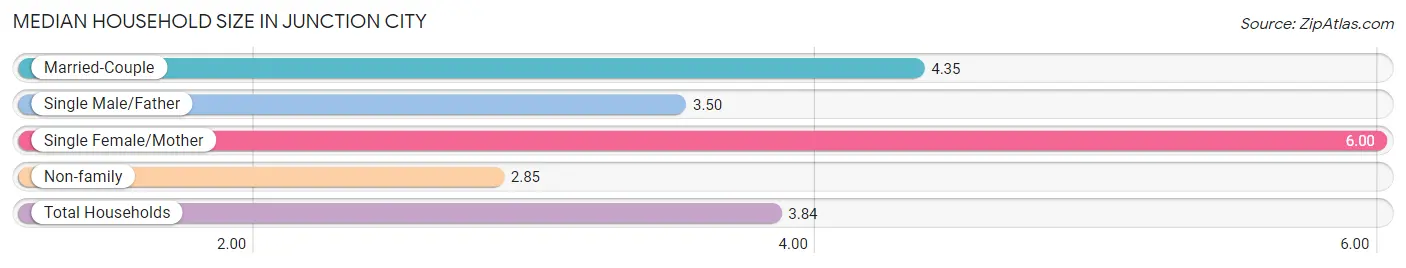
The median household size in Junction City is 3.84 persons per household, with single female/mother households (15 | 4.9%) accounting for the largest median household size of 6 persons per household. non-family households (115 | 37.8%) represent the smallest median household size with 2.85 persons per household.
| Household Type | # Households | Household Size |
| Married-Couple | 166 (54.6%) | 4.35 |
| Single Male/Father | 8 (2.6%) | 3.50 |
| Single Female/Mother | 15 (4.9%) | 6.00 |
| Non-family | 115 (37.8%) | 2.85 |
| Total Households | 304 (100.0%) | 3.84 |
Household Size by Marriage Status in Junction City
Out of a total of 304 households in Junction City, 189 (62.2%) are family households, while 115 (37.8%) are nonfamily households. The most numerous type of family households are 2-person households, comprising 120, and the most common type of nonfamily households are 1-person households, comprising 103.
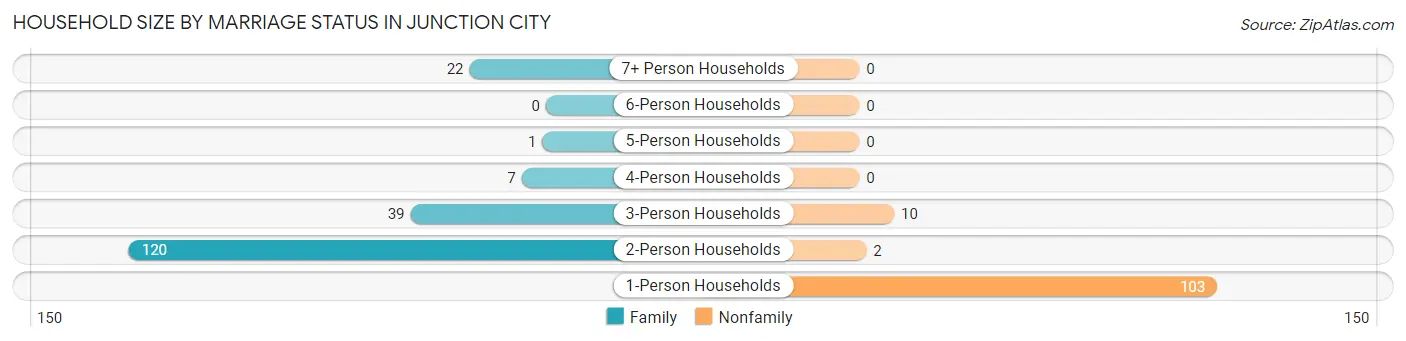
| Household Size | Family Households | Nonfamily Households |
| 1-Person Households | - | 103 (33.9%) |
| 2-Person Households | 120 (39.5%) | 2 (0.7%) |
| 3-Person Households | 39 (12.8%) | 10 (3.3%) |
| 4-Person Households | 7 (2.3%) | 0 (0.0%) |
| 5-Person Households | 1 (0.3%) | 0 (0.0%) |
| 6-Person Households | 0 (0.0%) | 0 (0.0%) |
| 7+ Person Households | 22 (7.2%) | 0 (0.0%) |
| Total | 189 (62.2%) | 115 (37.8%) |
Female Fertility in Junction City
Fertility by Age in Junction City
| Age Bracket | Women with Births | Births / 1,000 Women |
| 15 to 19 years | 0 (0.0%) | 0.0 |
| 20 to 34 years | 0 (0.0%) | 0.0 |
| 35 to 50 years | 0 (0.0%) | 0.0 |
| Total | 0 (0.0%) | 0.0 |
Fertility by Age by Marriage Status in Junction City
| Age Bracket | Married | Unmarried |
| 15 to 19 years | 0 (0.0%) | 0 (0.0%) |
| 20 to 34 years | 0 (0.0%) | 0 (0.0%) |
| 35 to 50 years | 0 (0.0%) | 0 (0.0%) |
| Total | 0 (0.0%) | 0 (0.0%) |
Fertility by Education in Junction City
| Educational Attainment | Women with Births | Births / 1,000 Women |
| Less than High School | 0 (0.0%) | 0.0 |
| High School Diploma | 0 (0.0%) | 0.0 |
| College or Associate's Degree | 0 (0.0%) | 0.0 |
| Bachelor's Degree | 0 (0.0%) | 0.0 |
| Graduate Degree | 0 (0.0%) | 0.0 |
| Total | 0 (0.0%) | 0.0 |
Fertility by Education by Marriage Status in Junction City
| Educational Attainment | Married | Unmarried |
| Less than High School | 0 (0.0%) | 0 (0.0%) |
| High School Diploma | 0 (0.0%) | 0 (0.0%) |
| College or Associate's Degree | 0 (0.0%) | 0 (0.0%) |
| Bachelor's Degree | 0 (0.0%) | 0 (0.0%) |
| Graduate Degree | 0 (0.0%) | 0 (0.0%) |
| Total | 0 (0.0%) | 0 (0.0%) |
Employment Characteristics in Junction City
Employment by Class of Employer in Junction City
Among the 525 employed individuals in Junction City, private company employees (305 | 58.1%), self-employed (not incorporated) (59 | 11.2%), and state government employees (45 | 8.6%) make up the most common classes of employment.
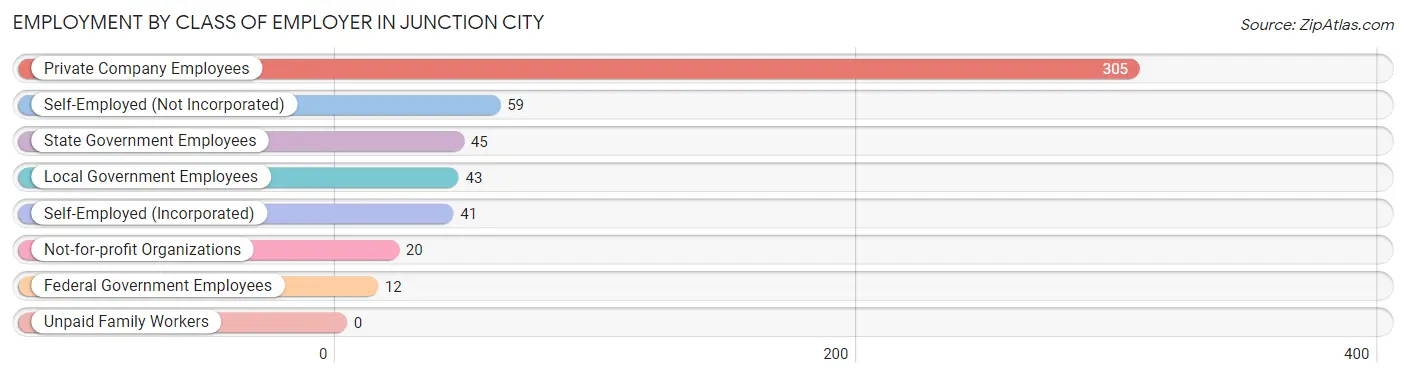
| Employer Class | # Employees | % Employees |
| Private Company Employees | 305 | 58.1% |
| Self-Employed (Incorporated) | 41 | 7.8% |
| Self-Employed (Not Incorporated) | 59 | 11.2% |
| Not-for-profit Organizations | 20 | 3.8% |
| Local Government Employees | 43 | 8.2% |
| State Government Employees | 45 | 8.6% |
| Federal Government Employees | 12 | 2.3% |
| Unpaid Family Workers | 0 | 0.0% |
| Total | 525 | 100.0% |
Employment Status by Age in Junction City
According to the labor force statistics for Junction City, out of the total population over 16 years of age (1,074), 52.5% or 564 individuals are in the labor force, with 6.9% or 39 of them unemployed. The age group with the highest labor force participation rate is 30 to 34 years, with 100.0% or 28 individuals in the labor force. Within the labor force, the 20 to 24 years age range has the highest percentage of unemployed individuals, with 50.0% or 5 of them being unemployed.
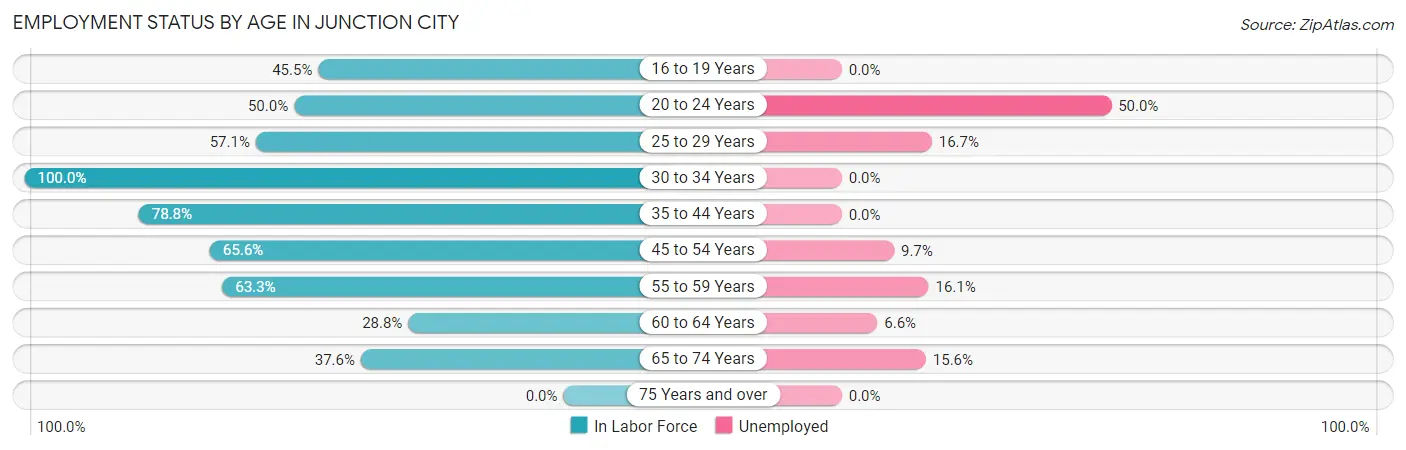
| Age Bracket | In Labor Force | Unemployed |
| 16 to 19 Years | 20 (45.5%) | 0 (0.0%) |
| 20 to 24 Years | 10 (50.0%) | 5 (50.0%) |
| 25 to 29 Years | 8 (57.1%) | 1 (16.7%) |
| 30 to 34 Years | 28 (100.0%) | 0 (0.0%) |
| 35 to 44 Years | 197 (78.8%) | 0 (0.0%) |
| 45 to 54 Years | 145 (65.6%) | 14 (9.7%) |
| 55 to 59 Years | 31 (63.3%) | 5 (16.1%) |
| 60 to 64 Years | 61 (28.8%) | 4 (6.6%) |
| 65 to 74 Years | 64 (37.6%) | 10 (15.6%) |
| 75 Years and over | 0 (0.0%) | 0 (0.0%) |
| Total | 564 (52.5%) | 39 (6.9%) |
Employment Status by Educational Attainment in Junction City
According to labor force statistics for Junction City, 60.7% of individuals (470) out of the total population between 25 and 64 years of age (774) are in the labor force, with 5.1% or 24 of them being unemployed. The group with the highest labor force participation rate are those with the educational attainment of bachelor's degree or higher, with 83.4% or 131 individuals in the labor force. Within the labor force, individuals with college / associate degree education have the highest percentage of unemployment, with 29.2% or 19 of them being unemployed.
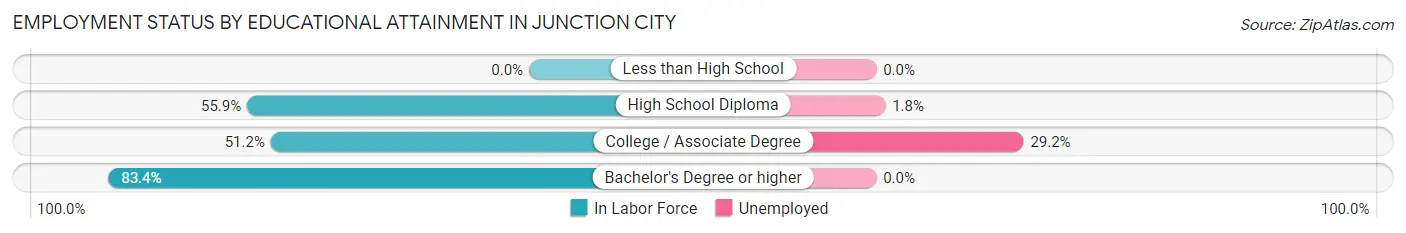
| Educational Attainment | In Labor Force | Unemployed |
| Less than High School | 0 (0.0%) | 0 (0.0%) |
| High School Diploma | 274 (55.9%) | 9 (1.8%) |
| College / Associate Degree | 65 (51.2%) | 37 (29.2%) |
| Bachelor's Degree or higher | 131 (83.4%) | 0 (0.0%) |
| Total | 470 (60.7%) | 39 (5.1%) |
Employment Occupations by Sex in Junction City
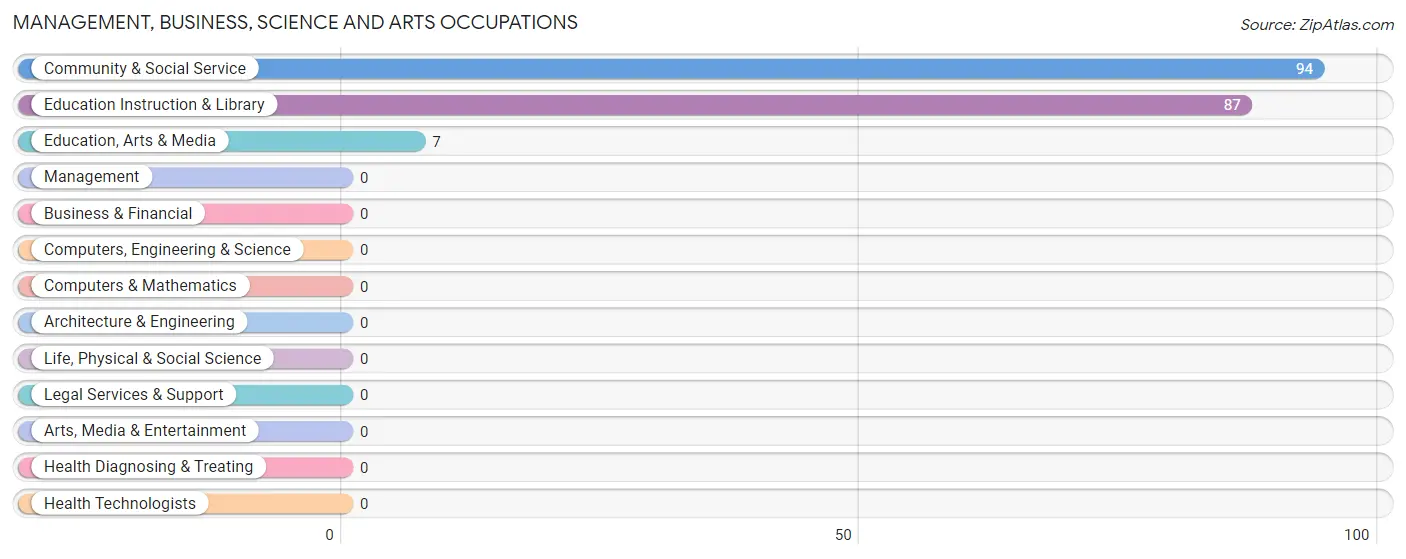
Management, Business, Science and Arts Occupations
The most common Management, Business, Science and Arts occupations in Junction City are Community & Social Service (94 | 18.0%), Education Instruction & Library (87 | 16.6%), and Education, Arts & Media (7 | 1.3%).
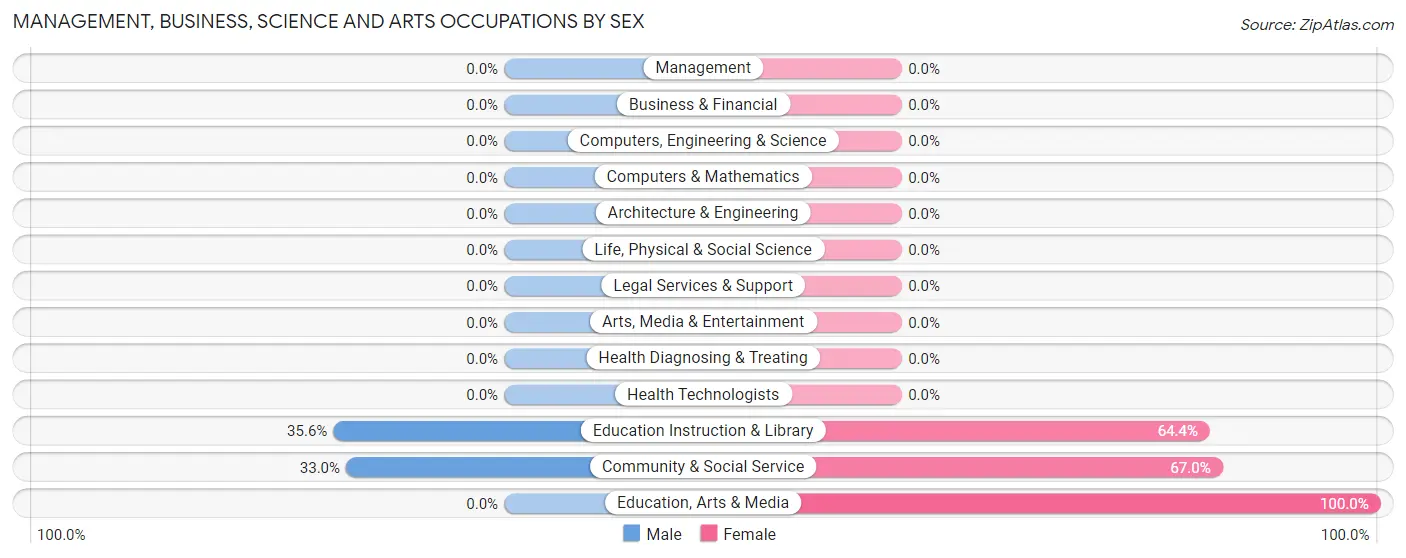
Management, Business, Science and Arts Occupations by Sex
Within the Management, Business, Science and Arts occupations in Junction City, the most male-oriented occupations are Education Instruction & Library (35.6%), and Community & Social Service (33.0%), while the most female-oriented occupations are Education, Arts & Media (100.0%), Community & Social Service (67.0%), and Education Instruction & Library (64.4%).
| Occupation | Male | Female |
| Management | 0 (0.0%) | 0 (0.0%) |
| Business & Financial | 0 (0.0%) | 0 (0.0%) |
| Computers, Engineering & Science | 0 (0.0%) | 0 (0.0%) |
| Computers & Mathematics | 0 (0.0%) | 0 (0.0%) |
| Architecture & Engineering | 0 (0.0%) | 0 (0.0%) |
| Life, Physical & Social Science | 0 (0.0%) | 0 (0.0%) |
| Community & Social Service | 31 (33.0%) | 63 (67.0%) |
| Education, Arts & Media | 0 (0.0%) | 7 (100.0%) |
| Legal Services & Support | 0 (0.0%) | 0 (0.0%) |
| Education Instruction & Library | 31 (35.6%) | 56 (64.4%) |
| Arts, Media & Entertainment | 0 (0.0%) | 0 (0.0%) |
| Health Diagnosing & Treating | 0 (0.0%) | 0 (0.0%) |
| Health Technologists | 0 (0.0%) | 0 (0.0%) |
| Total (Category) | 31 (33.0%) | 63 (67.0%) |
| Total (Overall) | 397 (75.9%) | 126 (24.1%) |
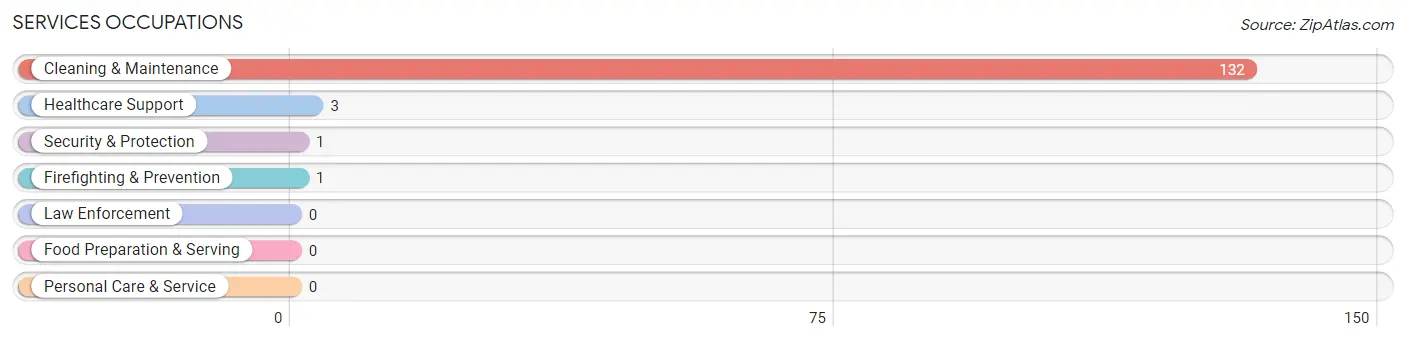
Services Occupations
The most common Services occupations in Junction City are Cleaning & Maintenance (132 | 25.2%), Healthcare Support (3 | 0.6%), Security & Protection (1 | 0.2%), and Firefighting & Prevention (1 | 0.2%).
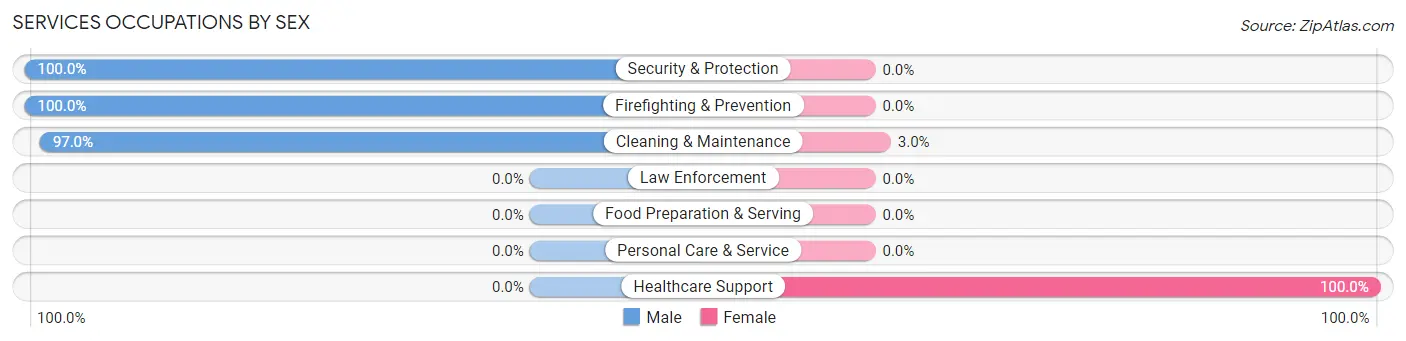
Services Occupations by Sex
Within the Services occupations in Junction City, the most male-oriented occupations are Security & Protection (100.0%), Firefighting & Prevention (100.0%), and Cleaning & Maintenance (97.0%), while the most female-oriented occupations are Healthcare Support (100.0%), and Cleaning & Maintenance (3.0%).
| Occupation | Male | Female |
| Healthcare Support | 0 (0.0%) | 3 (100.0%) |
| Security & Protection | 1 (100.0%) | 0 (0.0%) |
| Firefighting & Prevention | 1 (100.0%) | 0 (0.0%) |
| Law Enforcement | 0 (0.0%) | 0 (0.0%) |
| Food Preparation & Serving | 0 (0.0%) | 0 (0.0%) |
| Cleaning & Maintenance | 128 (97.0%) | 4 (3.0%) |
| Personal Care & Service | 0 (0.0%) | 0 (0.0%) |
| Total (Category) | 129 (94.9%) | 7 (5.1%) |
| Total (Overall) | 397 (75.9%) | 126 (24.1%) |
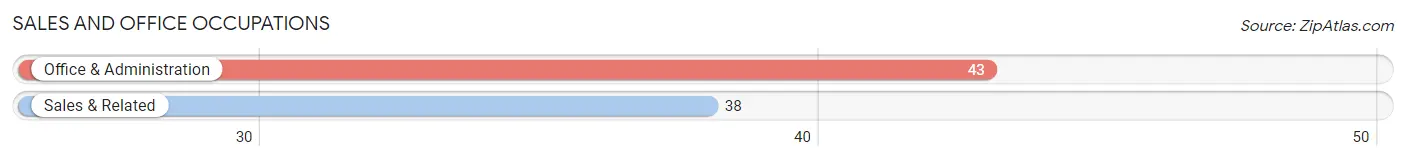
Sales and Office Occupations
The most common Sales and Office occupations in Junction City are Office & Administration (43 | 8.2%), and Sales & Related (38 | 7.3%).
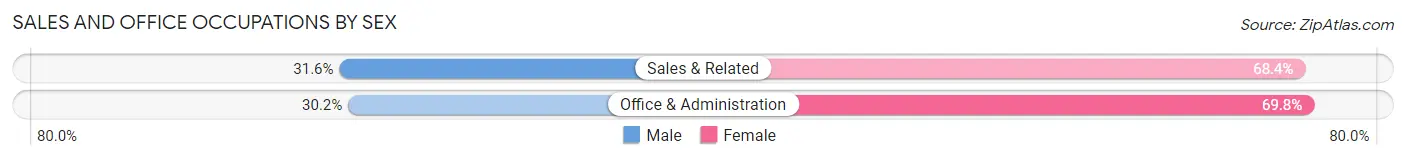
Sales and Office Occupations by Sex
| Occupation | Male | Female |
| Sales & Related | 12 (31.6%) | 26 (68.4%) |
| Office & Administration | 13 (30.2%) | 30 (69.8%) |
| Total (Category) | 25 (30.9%) | 56 (69.1%) |
| Total (Overall) | 397 (75.9%) | 126 (24.1%) |
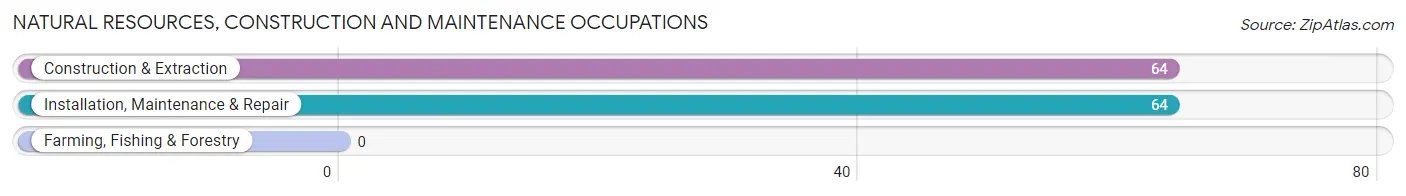
Natural Resources, Construction and Maintenance Occupations
The most common Natural Resources, Construction and Maintenance occupations in Junction City are Construction & Extraction (64 | 12.2%), and Installation, Maintenance & Repair (64 | 12.2%).
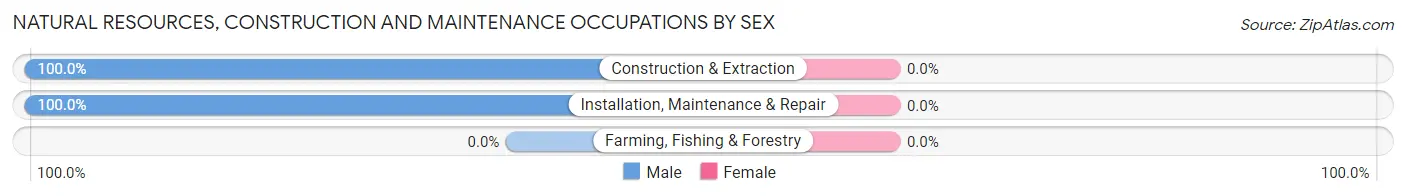
Natural Resources, Construction and Maintenance Occupations by Sex
| Occupation | Male | Female |
| Farming, Fishing & Forestry | 0 (0.0%) | 0 (0.0%) |
| Construction & Extraction | 64 (100.0%) | 0 (0.0%) |
| Installation, Maintenance & Repair | 64 (100.0%) | 0 (0.0%) |
| Total (Category) | 128 (100.0%) | 0 (0.0%) |
| Total (Overall) | 397 (75.9%) | 126 (24.1%) |
Production, Transportation and Moving Occupations
The most common Production, Transportation and Moving occupations in Junction City are Material Moving (42 | 8.0%), Transportation (39 | 7.5%), and Production (3 | 0.6%).
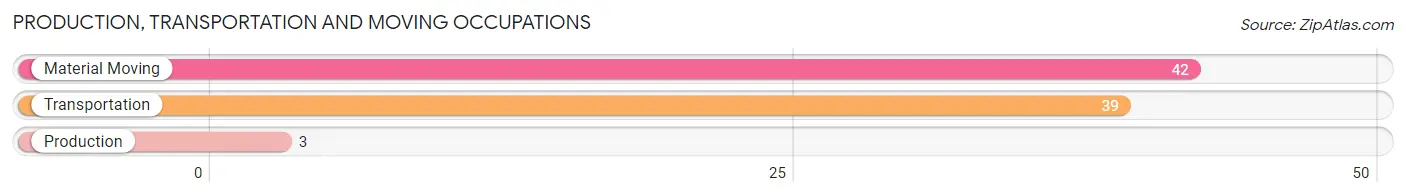
Production, Transportation and Moving Occupations by Sex
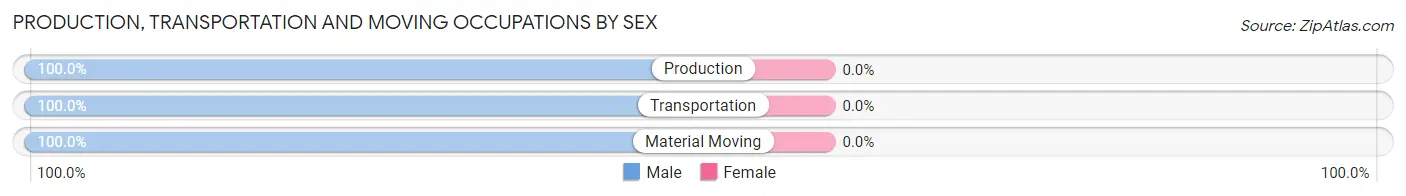
| Occupation | Male | Female |
| Production | 3 (100.0%) | 0 (0.0%) |
| Transportation | 39 (100.0%) | 0 (0.0%) |
| Material Moving | 42 (100.0%) | 0 (0.0%) |
| Total (Category) | 84 (100.0%) | 0 (0.0%) |
| Total (Overall) | 397 (75.9%) | 126 (24.1%) |
Employment Industries by Sex in Junction City
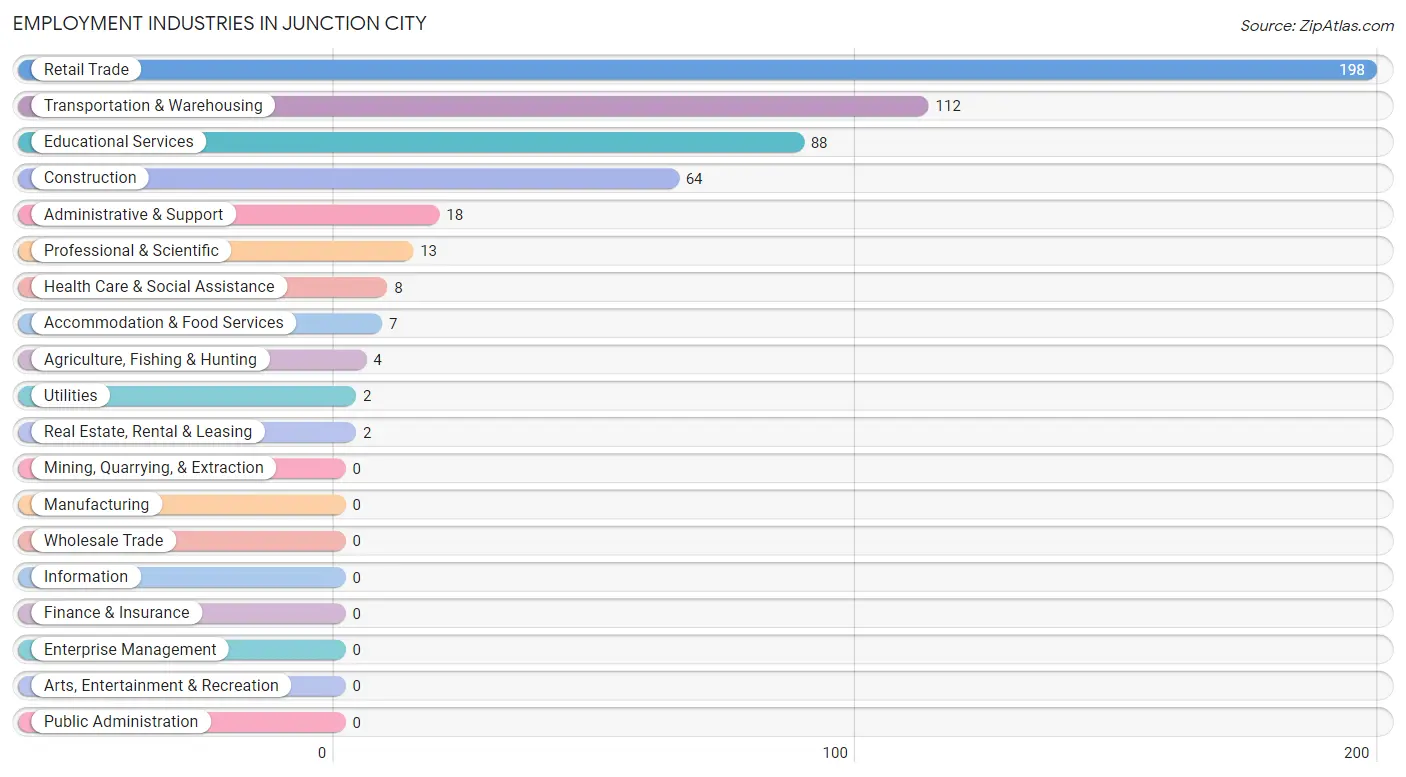
Employment Industries in Junction City
The major employment industries in Junction City include Retail Trade (198 | 37.9%), Transportation & Warehousing (112 | 21.4%), Educational Services (88 | 16.8%), Construction (64 | 12.2%), and Administrative & Support (18 | 3.4%).
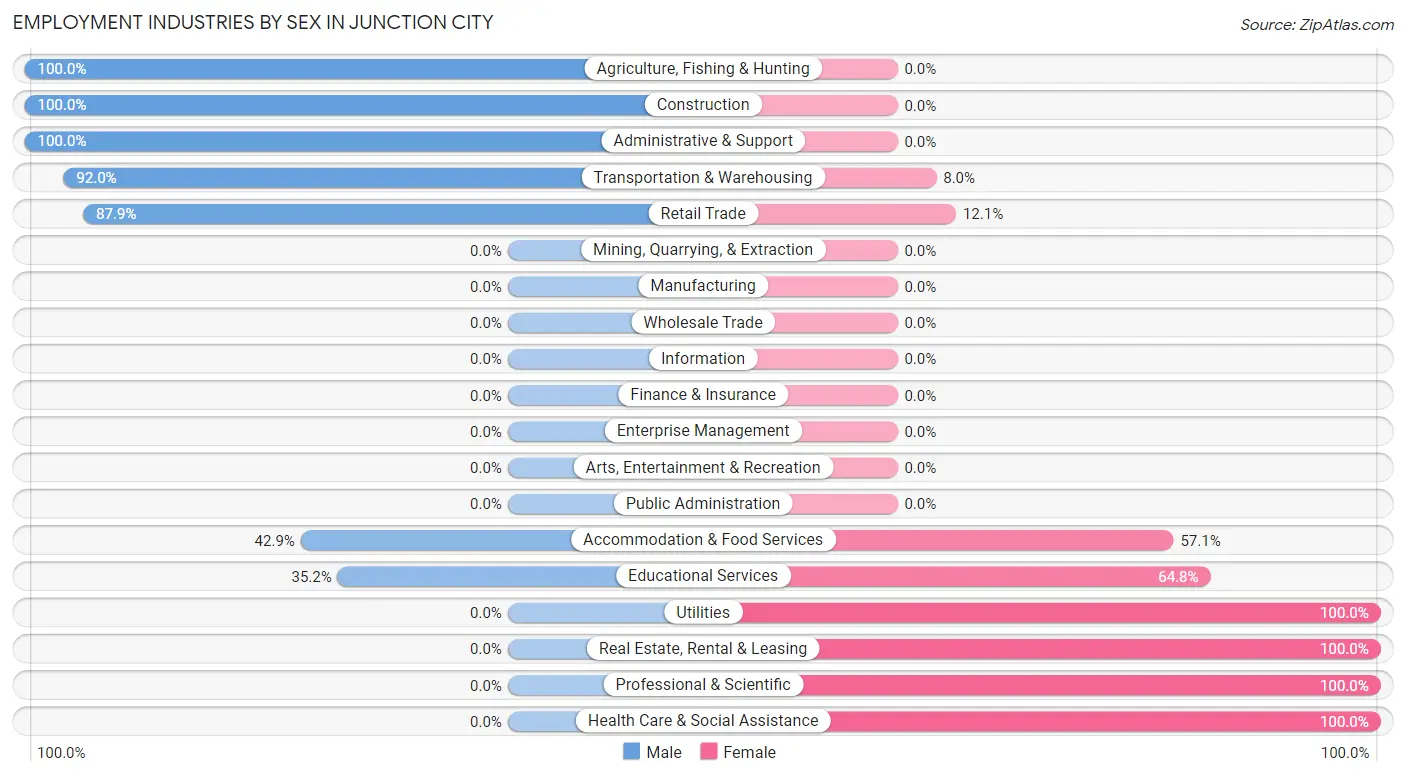
Employment Industries by Sex in Junction City
The Junction City industries that see more men than women are Agriculture, Fishing & Hunting (100.0%), Construction (100.0%), and Administrative & Support (100.0%), whereas the industries that tend to have a higher number of women are Utilities (100.0%), Real Estate, Rental & Leasing (100.0%), and Professional & Scientific (100.0%).
| Industry | Male | Female |
| Agriculture, Fishing & Hunting | 4 (100.0%) | 0 (0.0%) |
| Mining, Quarrying, & Extraction | 0 (0.0%) | 0 (0.0%) |
| Construction | 64 (100.0%) | 0 (0.0%) |
| Manufacturing | 0 (0.0%) | 0 (0.0%) |
| Wholesale Trade | 0 (0.0%) | 0 (0.0%) |
| Retail Trade | 174 (87.9%) | 24 (12.1%) |
| Transportation & Warehousing | 103 (92.0%) | 9 (8.0%) |
| Utilities | 0 (0.0%) | 2 (100.0%) |
| Information | 0 (0.0%) | 0 (0.0%) |
| Finance & Insurance | 0 (0.0%) | 0 (0.0%) |
| Real Estate, Rental & Leasing | 0 (0.0%) | 2 (100.0%) |
| Professional & Scientific | 0 (0.0%) | 13 (100.0%) |
| Enterprise Management | 0 (0.0%) | 0 (0.0%) |
| Administrative & Support | 18 (100.0%) | 0 (0.0%) |
| Educational Services | 31 (35.2%) | 57 (64.8%) |
| Health Care & Social Assistance | 0 (0.0%) | 8 (100.0%) |
| Arts, Entertainment & Recreation | 0 (0.0%) | 0 (0.0%) |
| Accommodation & Food Services | 3 (42.9%) | 4 (57.1%) |
| Public Administration | 0 (0.0%) | 0 (0.0%) |
| Total | 397 (75.9%) | 126 (24.1%) |
Education in Junction City
School Enrollment in Junction City
The most common levels of schooling among the 75 students in Junction City are middle school (27 | 36.0%), elementary school (22 | 29.3%), and kindergarten (13 | 17.3%).
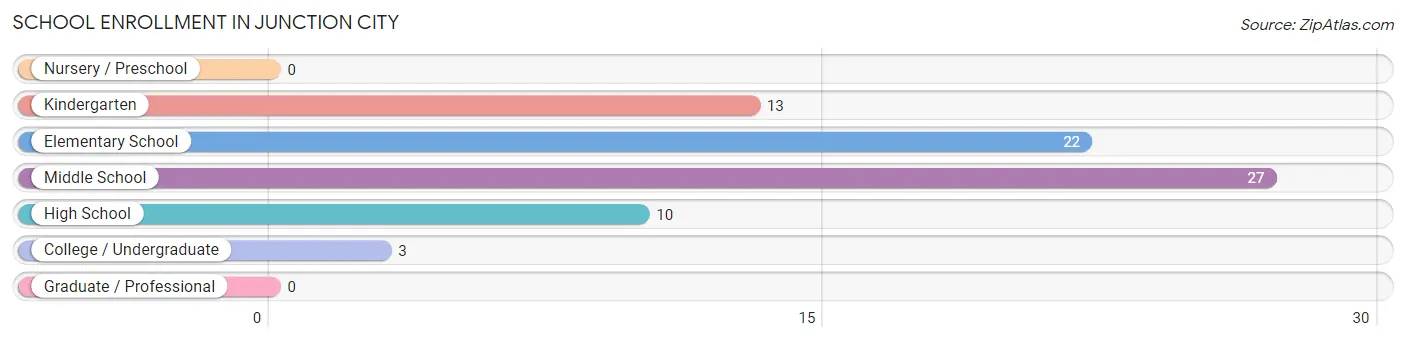
| School Level | # Students | % Students |
| Nursery / Preschool | 0 | 0.0% |
| Kindergarten | 13 | 17.3% |
| Elementary School | 22 | 29.3% |
| Middle School | 27 | 36.0% |
| High School | 10 | 13.3% |
| College / Undergraduate | 3 | 4.0% |
| Graduate / Professional | 0 | 0.0% |
| Total | 75 | 100.0% |
School Enrollment by Age by Funding Source in Junction City
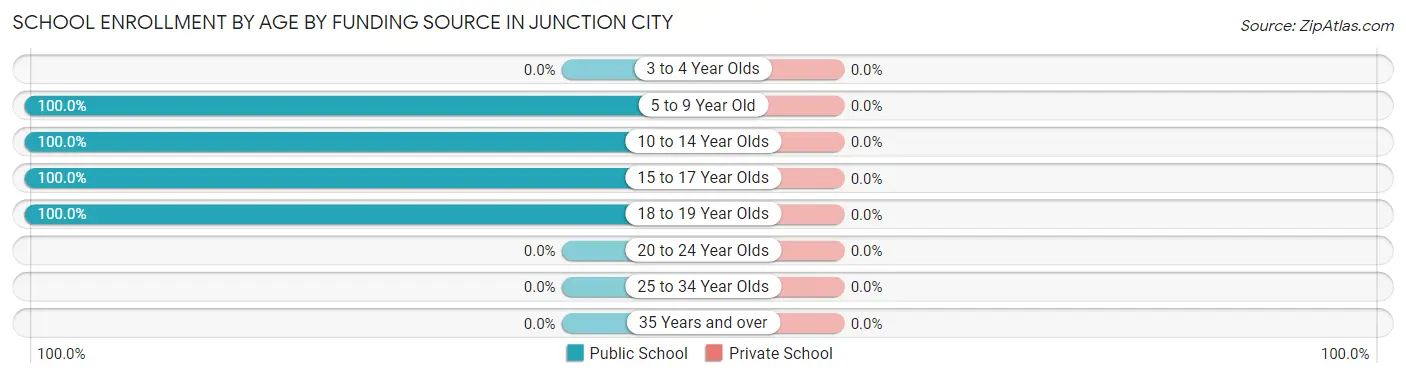
| Age Bracket | Public School | Private School |
| 3 to 4 Year Olds | 0 (0.0%) | 0 (0.0%) |
| 5 to 9 Year Old | 35 (100.0%) | 0 (0.0%) |
| 10 to 14 Year Olds | 27 (100.0%) | 0 (0.0%) |
| 15 to 17 Year Olds | 10 (100.0%) | 0 (0.0%) |
| 18 to 19 Year Olds | 3 (100.0%) | 0 (0.0%) |
| 20 to 24 Year Olds | 0 (0.0%) | 0 (0.0%) |
| 25 to 34 Year Olds | 0 (0.0%) | 0 (0.0%) |
| 35 Years and over | 0 (0.0%) | 0 (0.0%) |
| Total | 75 (100.0%) | 0 (0.0%) |
Educational Attainment by Field of Study in Junction City
Business (106 | 52.5%), arts & humanities (47 | 23.3%), bio, nature & agricultural (21 | 10.4%), liberal arts & history (14 | 6.9%), and literature & languages (13 | 6.4%) are the most common fields of study among 202 individuals in Junction City who have obtained a bachelor's degree or higher.
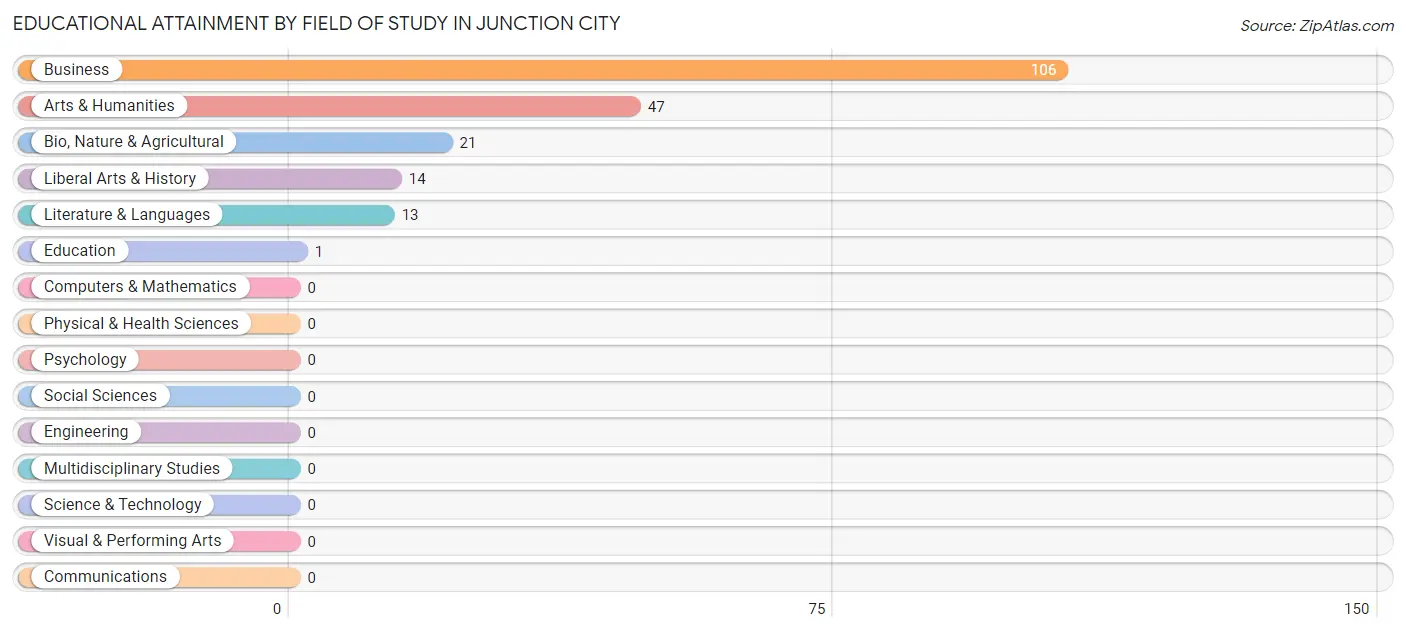
| Field of Study | # Graduates | % Graduates |
| Computers & Mathematics | 0 | 0.0% |
| Bio, Nature & Agricultural | 21 | 10.4% |
| Physical & Health Sciences | 0 | 0.0% |
| Psychology | 0 | 0.0% |
| Social Sciences | 0 | 0.0% |
| Engineering | 0 | 0.0% |
| Multidisciplinary Studies | 0 | 0.0% |
| Science & Technology | 0 | 0.0% |
| Business | 106 | 52.5% |
| Education | 1 | 0.5% |
| Literature & Languages | 13 | 6.4% |
| Liberal Arts & History | 14 | 6.9% |
| Visual & Performing Arts | 0 | 0.0% |
| Communications | 0 | 0.0% |
| Arts & Humanities | 47 | 23.3% |
| Total | 202 | 100.0% |
Transportation & Commute in Junction City
Vehicle Availability by Sex in Junction City
The most prevalent vehicle ownership categories in Junction City are males with 2 vehicles (208, accounting for 52.1%) and females with 2 vehicles (30, making up 165.1%).
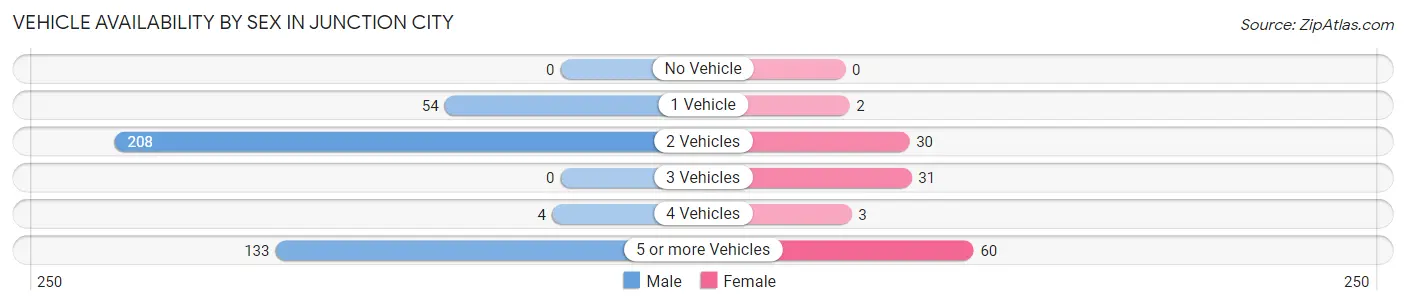
| Vehicles Available | Male | Female |
| No Vehicle | 0 (0.0%) | 0 (0.0%) |
| 1 Vehicle | 54 (13.5%) | 2 (1.6%) |
| 2 Vehicles | 208 (52.1%) | 30 (23.8%) |
| 3 Vehicles | 0 (0.0%) | 31 (24.6%) |
| 4 Vehicles | 4 (1.0%) | 3 (2.4%) |
| 5 or more Vehicles | 133 (33.3%) | 60 (47.6%) |
| Total | 399 (100.0%) | 126 (100.0%) |
Commute Time in Junction City
The most frequently occuring commute durations in Junction City are 10 to 14 minutes (125 commuters, 33.4%), 15 to 19 minutes (93 commuters, 24.9%), and 5 to 9 minutes (74 commuters, 19.8%).
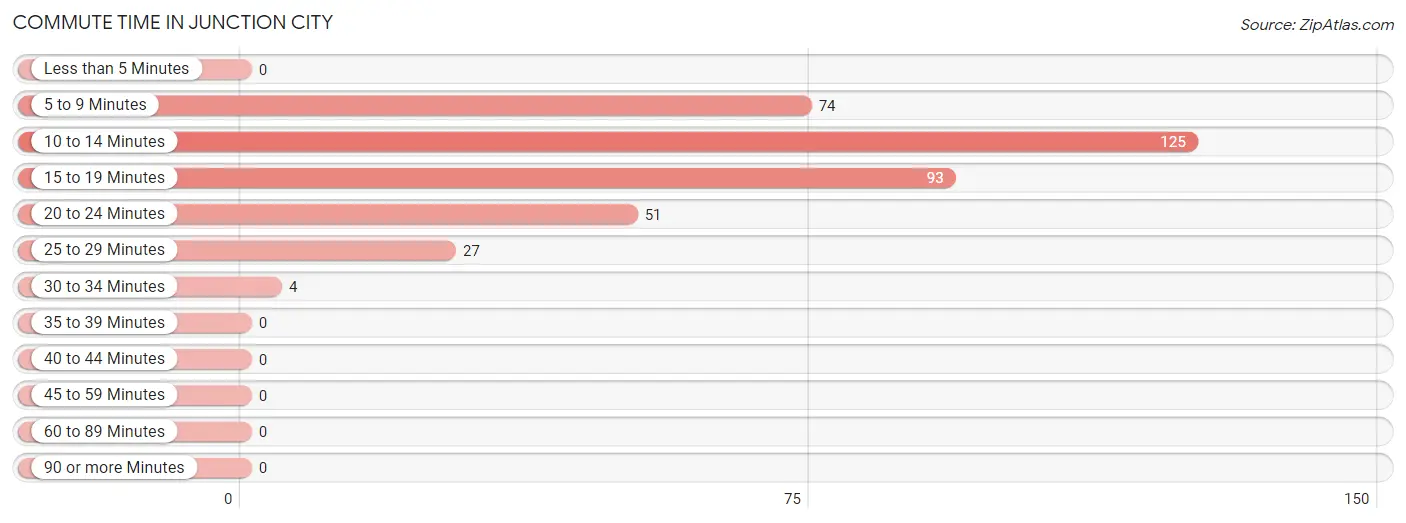
| Commute Time | # Commuters | % Commuters |
| Less than 5 Minutes | 0 | 0.0% |
| 5 to 9 Minutes | 74 | 19.8% |
| 10 to 14 Minutes | 125 | 33.4% |
| 15 to 19 Minutes | 93 | 24.9% |
| 20 to 24 Minutes | 51 | 13.6% |
| 25 to 29 Minutes | 27 | 7.2% |
| 30 to 34 Minutes | 4 | 1.1% |
| 35 to 39 Minutes | 0 | 0.0% |
| 40 to 44 Minutes | 0 | 0.0% |
| 45 to 59 Minutes | 0 | 0.0% |
| 60 to 89 Minutes | 0 | 0.0% |
| 90 or more Minutes | 0 | 0.0% |
Commute Time by Sex in Junction City
The most common commute times in Junction City are 10 to 14 minutes (123 commuters, 49.6%) for males and 5 to 9 minutes (58 commuters, 46.0%) for females.
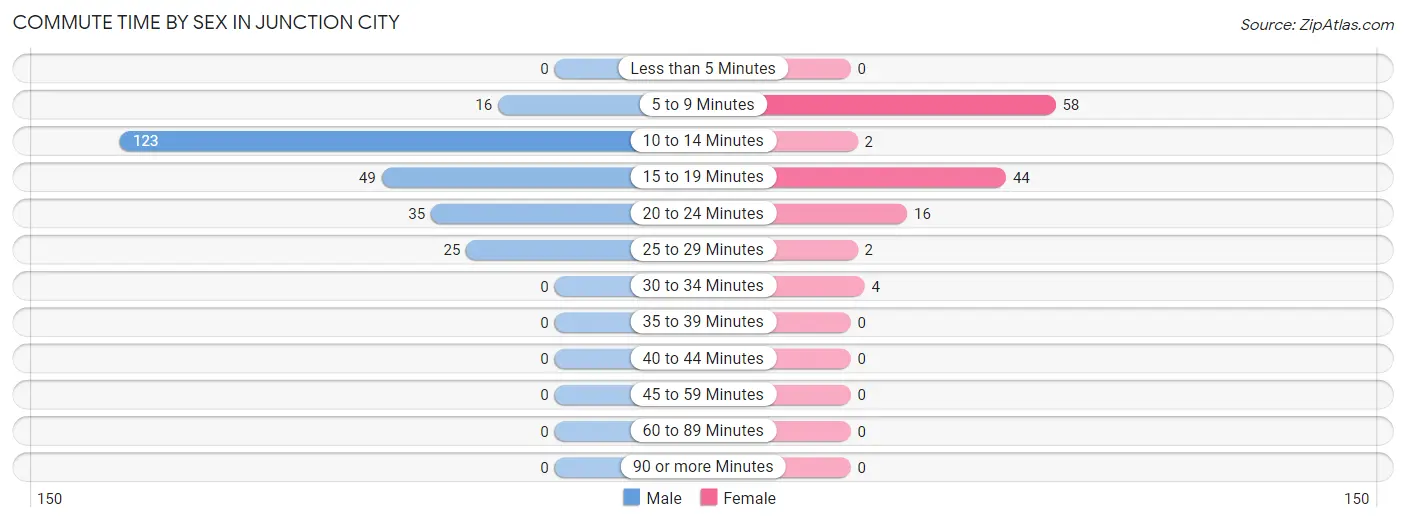
| Commute Time | Male | Female |
| Less than 5 Minutes | 0 (0.0%) | 0 (0.0%) |
| 5 to 9 Minutes | 16 (6.5%) | 58 (46.0%) |
| 10 to 14 Minutes | 123 (49.6%) | 2 (1.6%) |
| 15 to 19 Minutes | 49 (19.8%) | 44 (34.9%) |
| 20 to 24 Minutes | 35 (14.1%) | 16 (12.7%) |
| 25 to 29 Minutes | 25 (10.1%) | 2 (1.6%) |
| 30 to 34 Minutes | 0 (0.0%) | 4 (3.2%) |
| 35 to 39 Minutes | 0 (0.0%) | 0 (0.0%) |
| 40 to 44 Minutes | 0 (0.0%) | 0 (0.0%) |
| 45 to 59 Minutes | 0 (0.0%) | 0 (0.0%) |
| 60 to 89 Minutes | 0 (0.0%) | 0 (0.0%) |
| 90 or more Minutes | 0 (0.0%) | 0 (0.0%) |
Time of Departure to Work by Sex in Junction City
The most frequent times of departure to work in Junction City are 4:00 PM to 11:59 PM (120, 48.4%) for males and 9:00 AM to 9:59 AM (51, 40.5%) for females.
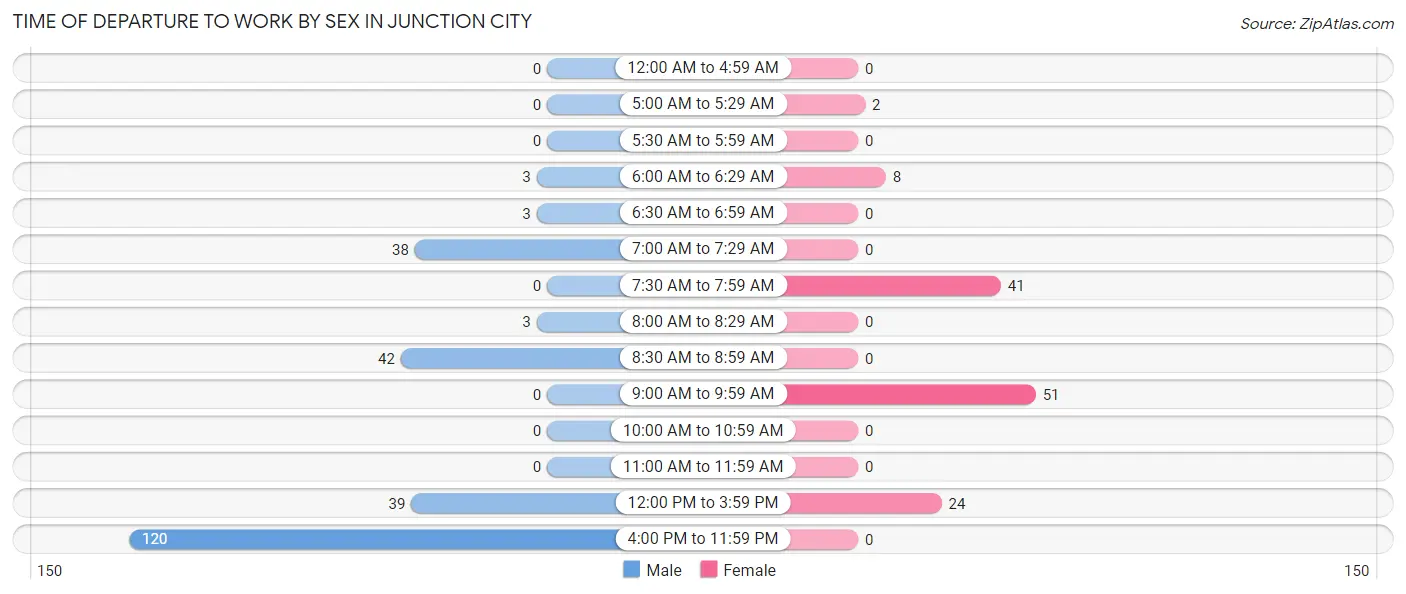
| Time of Departure | Male | Female |
| 12:00 AM to 4:59 AM | 0 (0.0%) | 0 (0.0%) |
| 5:00 AM to 5:29 AM | 0 (0.0%) | 2 (1.6%) |
| 5:30 AM to 5:59 AM | 0 (0.0%) | 0 (0.0%) |
| 6:00 AM to 6:29 AM | 3 (1.2%) | 8 (6.4%) |
| 6:30 AM to 6:59 AM | 3 (1.2%) | 0 (0.0%) |
| 7:00 AM to 7:29 AM | 38 (15.3%) | 0 (0.0%) |
| 7:30 AM to 7:59 AM | 0 (0.0%) | 41 (32.5%) |
| 8:00 AM to 8:29 AM | 3 (1.2%) | 0 (0.0%) |
| 8:30 AM to 8:59 AM | 42 (16.9%) | 0 (0.0%) |
| 9:00 AM to 9:59 AM | 0 (0.0%) | 51 (40.5%) |
| 10:00 AM to 10:59 AM | 0 (0.0%) | 0 (0.0%) |
| 11:00 AM to 11:59 AM | 0 (0.0%) | 0 (0.0%) |
| 12:00 PM to 3:59 PM | 39 (15.7%) | 24 (19.1%) |
| 4:00 PM to 11:59 PM | 120 (48.4%) | 0 (0.0%) |
| Total | 248 (100.0%) | 126 (100.0%) |
Housing Occupancy in Junction City
Occupancy by Ownership in Junction City
Of the total 304 dwellings in Junction City, owner-occupied units account for 248 (81.6%), while renter-occupied units make up 56 (18.4%).
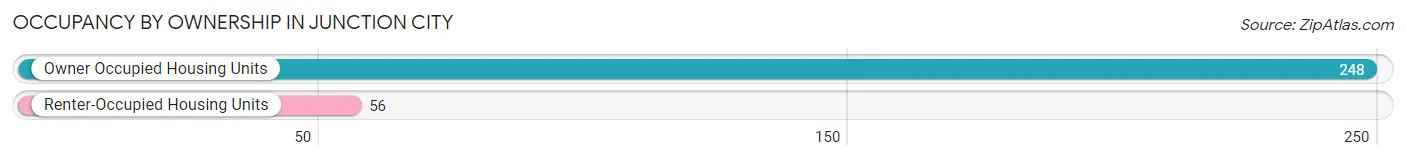
| Occupancy | # Housing Units | % Housing Units |
| Owner Occupied Housing Units | 248 | 81.6% |
| Renter-Occupied Housing Units | 56 | 18.4% |
| Total Occupied Housing Units | 304 | 100.0% |
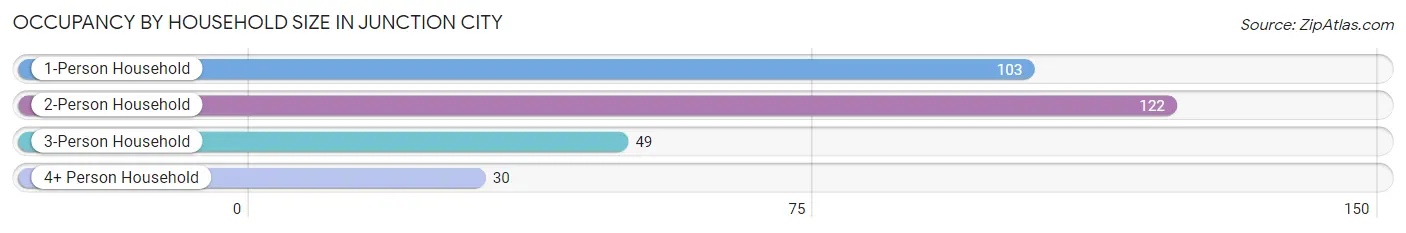
Occupancy by Household Size in Junction City
| Household Size | # Housing Units | % Housing Units |
| 1-Person Household | 103 | 33.9% |
| 2-Person Household | 122 | 40.1% |
| 3-Person Household | 49 | 16.1% |
| 4+ Person Household | 30 | 9.9% |
| Total Housing Units | 304 | 100.0% |
Occupancy by Ownership by Household Size in Junction City
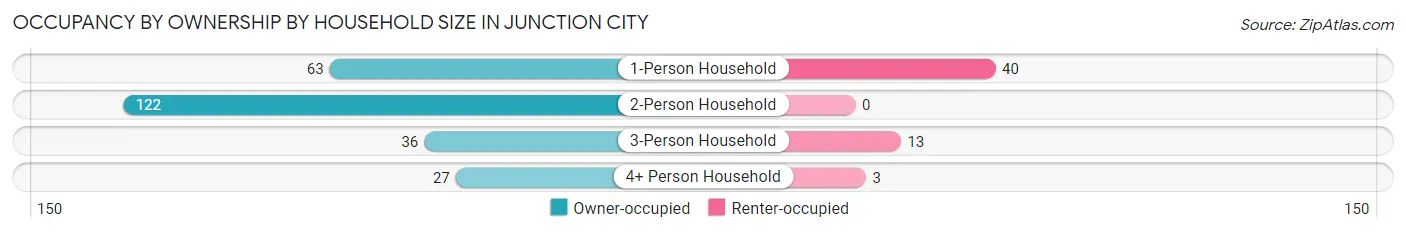
| Household Size | Owner-occupied | Renter-occupied |
| 1-Person Household | 63 (61.2%) | 40 (38.8%) |
| 2-Person Household | 122 (100.0%) | 0 (0.0%) |
| 3-Person Household | 36 (73.5%) | 13 (26.5%) |
| 4+ Person Household | 27 (90.0%) | 3 (10.0%) |
| Total Housing Units | 248 (81.6%) | 56 (18.4%) |
Occupancy by Educational Attainment in Junction City
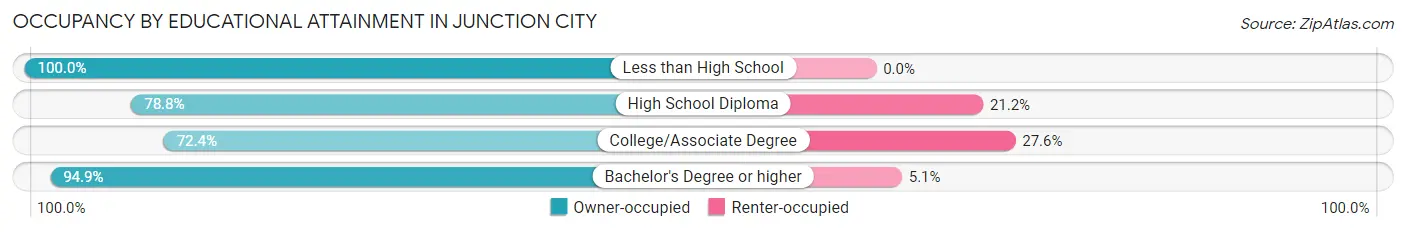
| Household Size | Owner-occupied | Renter-occupied |
| Less than High School | 21 (100.0%) | 0 (0.0%) |
| High School Diploma | 108 (78.8%) | 29 (21.2%) |
| College/Associate Degree | 63 (72.4%) | 24 (27.6%) |
| Bachelor's Degree or higher | 56 (94.9%) | 3 (5.1%) |
Occupancy by Age of Householder in Junction City
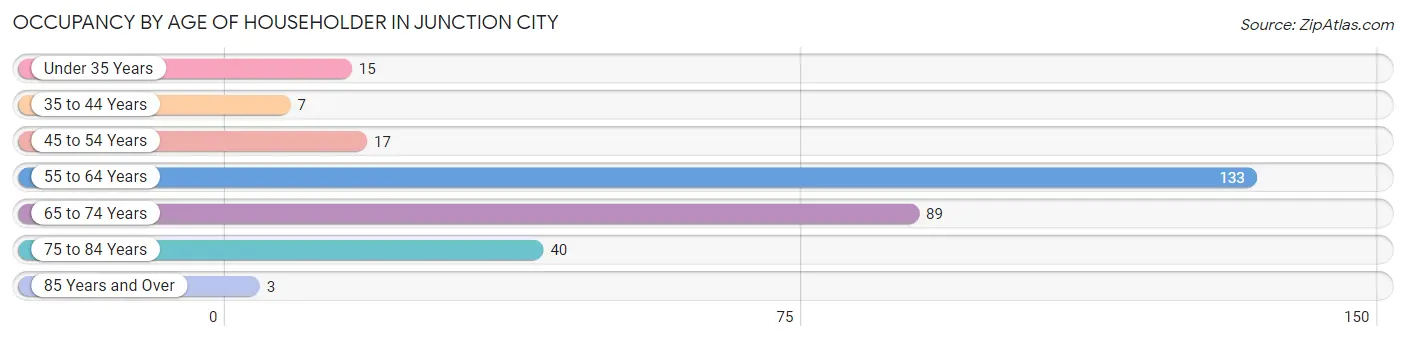
| Age Bracket | # Households | % Households |
| Under 35 Years | 15 | 4.9% |
| 35 to 44 Years | 7 | 2.3% |
| 45 to 54 Years | 17 | 5.6% |
| 55 to 64 Years | 133 | 43.8% |
| 65 to 74 Years | 89 | 29.3% |
| 75 to 84 Years | 40 | 13.2% |
| 85 Years and Over | 3 | 1.0% |
| Total | 304 | 100.0% |
Housing Finances in Junction City
Median Income by Occupancy in Junction City
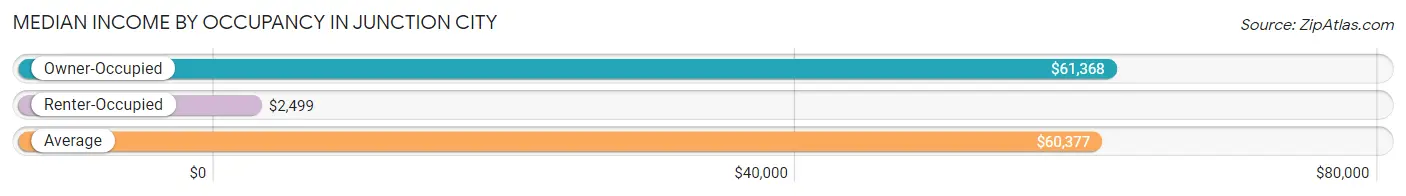
| Occupancy Type | # Households | Median Income |
| Owner-Occupied | 248 (81.6%) | $61,368 |
| Renter-Occupied | 56 (18.4%) | $2,499 |
| Average | 304 (100.0%) | $60,377 |
Occupancy by Householder Income Bracket in Junction City
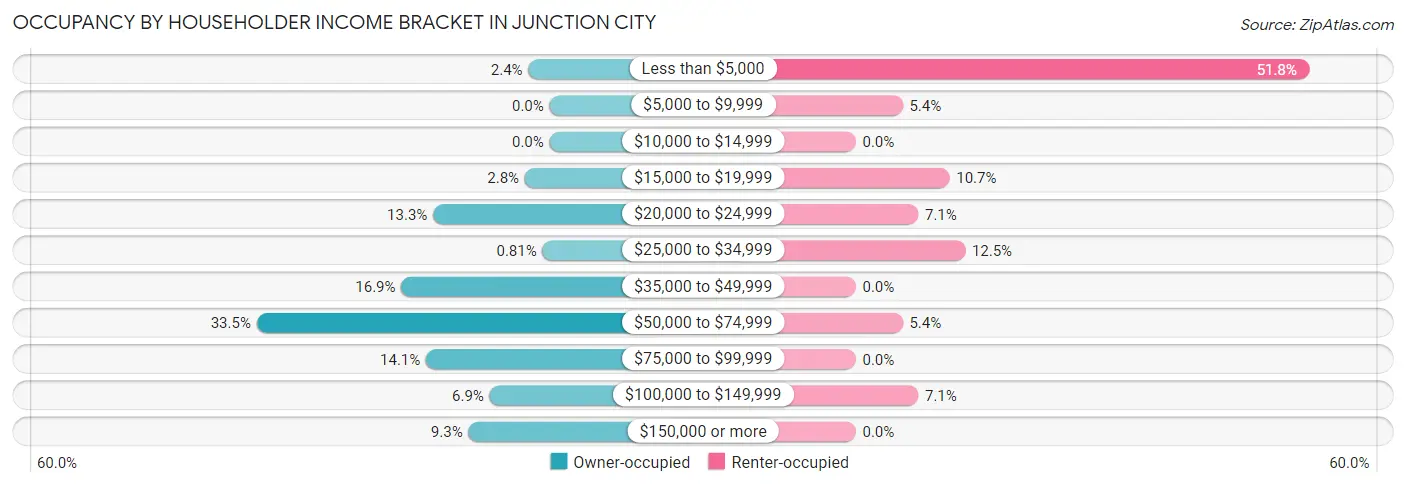
| Income Bracket | Owner-occupied | Renter-occupied |
| Less than $5,000 | 6 (2.4%) | 29 (51.8%) |
| $5,000 to $9,999 | 0 (0.0%) | 3 (5.4%) |
| $10,000 to $14,999 | 0 (0.0%) | 0 (0.0%) |
| $15,000 to $19,999 | 7 (2.8%) | 6 (10.7%) |
| $20,000 to $24,999 | 33 (13.3%) | 4 (7.1%) |
| $25,000 to $34,999 | 2 (0.8%) | 7 (12.5%) |
| $35,000 to $49,999 | 42 (16.9%) | 0 (0.0%) |
| $50,000 to $74,999 | 83 (33.5%) | 3 (5.4%) |
| $75,000 to $99,999 | 35 (14.1%) | 0 (0.0%) |
| $100,000 to $149,999 | 17 (6.9%) | 4 (7.1%) |
| $150,000 or more | 23 (9.3%) | 0 (0.0%) |
| Total | 248 (100.0%) | 56 (100.0%) |
Monthly Housing Cost Tiers in Junction City
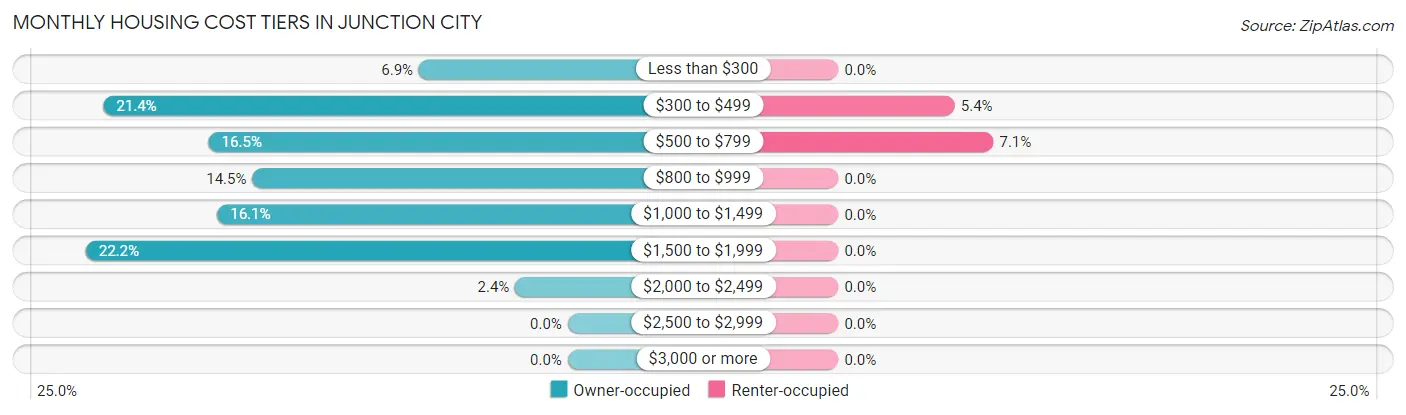
| Monthly Cost | Owner-occupied | Renter-occupied |
| Less than $300 | 17 (6.9%) | 0 (0.0%) |
| $300 to $499 | 53 (21.4%) | 3 (5.4%) |
| $500 to $799 | 41 (16.5%) | 4 (7.1%) |
| $800 to $999 | 36 (14.5%) | 0 (0.0%) |
| $1,000 to $1,499 | 40 (16.1%) | 0 (0.0%) |
| $1,500 to $1,999 | 55 (22.2%) | 0 (0.0%) |
| $2,000 to $2,499 | 6 (2.4%) | 0 (0.0%) |
| $2,500 to $2,999 | 0 (0.0%) | 0 (0.0%) |
| $3,000 or more | 0 (0.0%) | 0 (0.0%) |
| Total | 248 (100.0%) | 56 (100.0%) |
Physical Housing Characteristics in Junction City
Housing Structures in Junction City
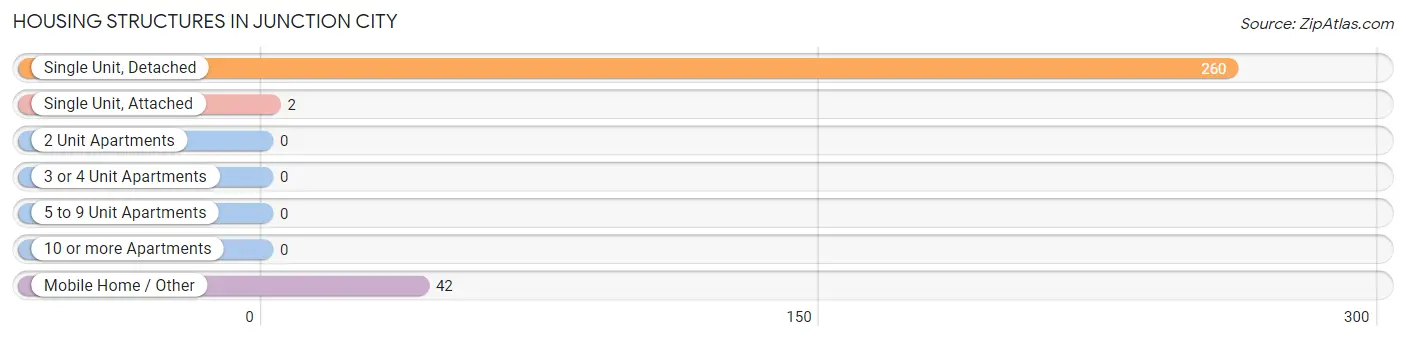
| Structure Type | # Housing Units | % Housing Units |
| Single Unit, Detached | 260 | 85.5% |
| Single Unit, Attached | 2 | 0.7% |
| 2 Unit Apartments | 0 | 0.0% |
| 3 or 4 Unit Apartments | 0 | 0.0% |
| 5 to 9 Unit Apartments | 0 | 0.0% |
| 10 or more Apartments | 0 | 0.0% |
| Mobile Home / Other | 42 | 13.8% |
| Total | 304 | 100.0% |
Housing Structures by Occupancy in Junction City
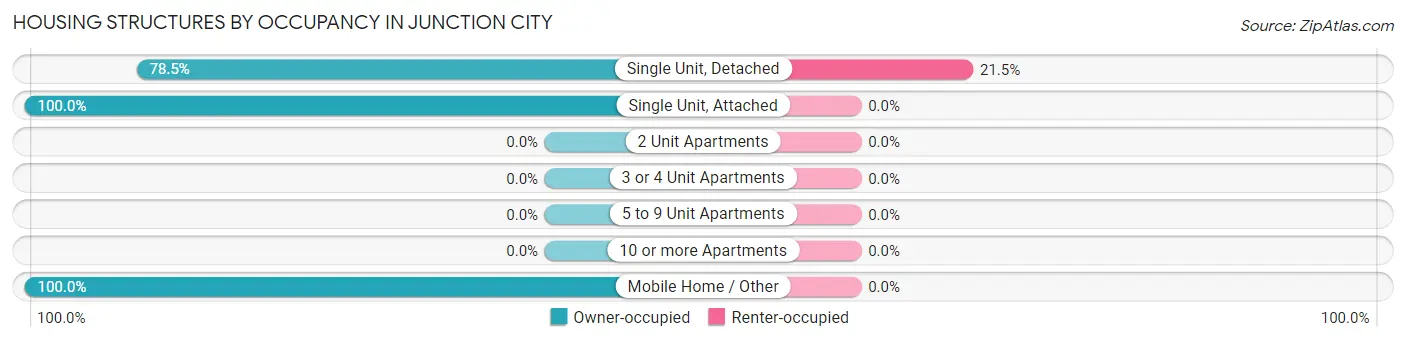
| Structure Type | Owner-occupied | Renter-occupied |
| Single Unit, Detached | 204 (78.5%) | 56 (21.5%) |
| Single Unit, Attached | 2 (100.0%) | 0 (0.0%) |
| 2 Unit Apartments | 0 (0.0%) | 0 (0.0%) |
| 3 or 4 Unit Apartments | 0 (0.0%) | 0 (0.0%) |
| 5 to 9 Unit Apartments | 0 (0.0%) | 0 (0.0%) |
| 10 or more Apartments | 0 (0.0%) | 0 (0.0%) |
| Mobile Home / Other | 42 (100.0%) | 0 (0.0%) |
| Total | 248 (81.6%) | 56 (18.4%) |
Housing Structures by Number of Rooms in Junction City
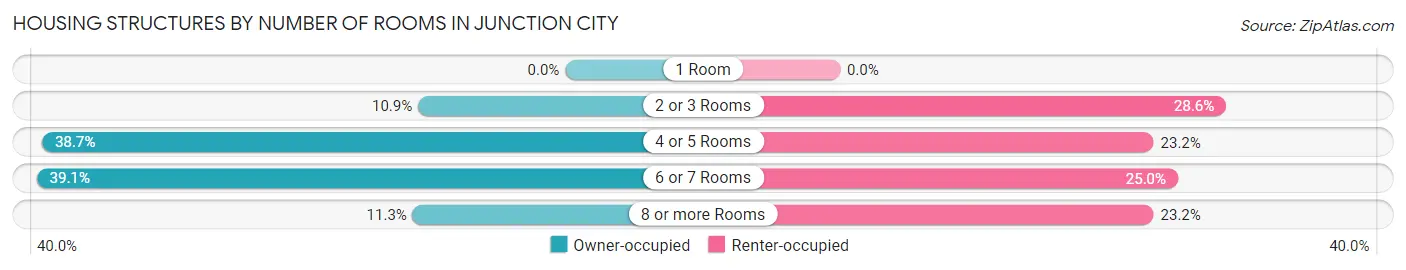
| Number of Rooms | Owner-occupied | Renter-occupied |
| 1 Room | 0 (0.0%) | 0 (0.0%) |
| 2 or 3 Rooms | 27 (10.9%) | 16 (28.6%) |
| 4 or 5 Rooms | 96 (38.7%) | 13 (23.2%) |
| 6 or 7 Rooms | 97 (39.1%) | 14 (25.0%) |
| 8 or more Rooms | 28 (11.3%) | 13 (23.2%) |
| Total | 248 (100.0%) | 56 (100.0%) |
Housing Structure by Heating Type in Junction City
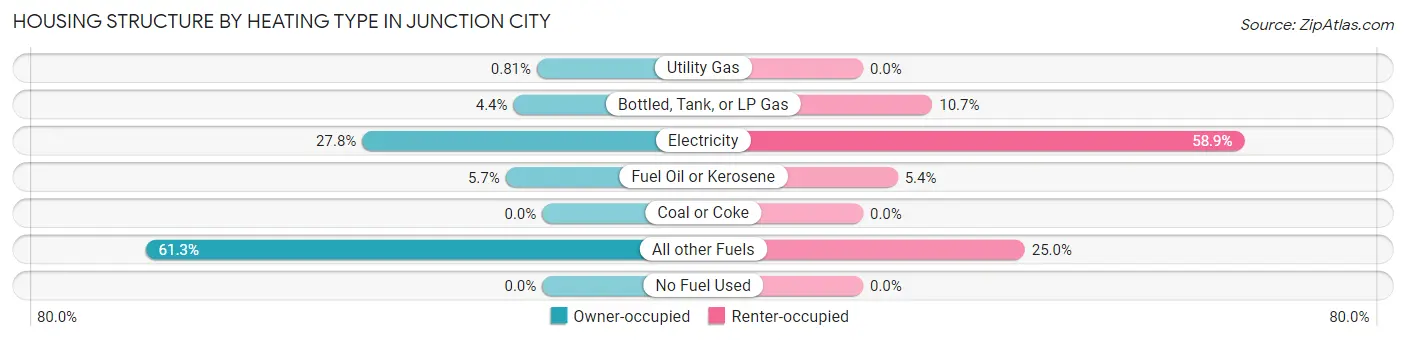
| Heating Type | Owner-occupied | Renter-occupied |
| Utility Gas | 2 (0.8%) | 0 (0.0%) |
| Bottled, Tank, or LP Gas | 11 (4.4%) | 6 (10.7%) |
| Electricity | 69 (27.8%) | 33 (58.9%) |
| Fuel Oil or Kerosene | 14 (5.7%) | 3 (5.4%) |
| Coal or Coke | 0 (0.0%) | 0 (0.0%) |
| All other Fuels | 152 (61.3%) | 14 (25.0%) |
| No Fuel Used | 0 (0.0%) | 0 (0.0%) |
| Total | 248 (100.0%) | 56 (100.0%) |
Household Vehicle Usage in Junction City
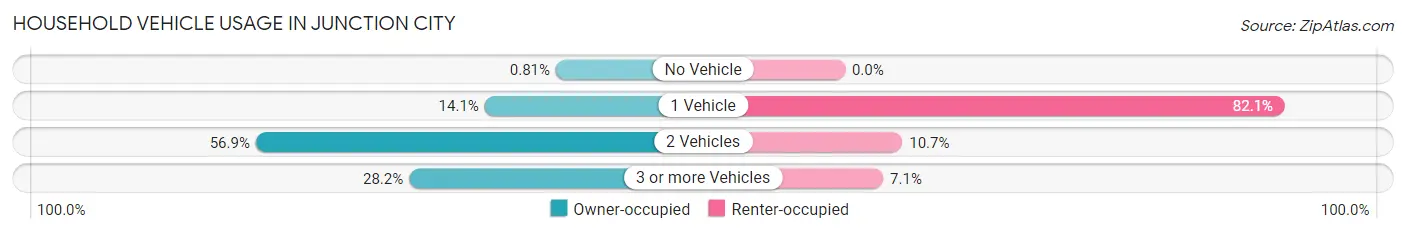
| Vehicles per Household | Owner-occupied | Renter-occupied |
| No Vehicle | 2 (0.8%) | 0 (0.0%) |
| 1 Vehicle | 35 (14.1%) | 46 (82.1%) |
| 2 Vehicles | 141 (56.9%) | 6 (10.7%) |
| 3 or more Vehicles | 70 (28.2%) | 4 (7.1%) |
| Total | 248 (100.0%) | 56 (100.0%) |
Real Estate & Mortgages in Junction City
Real Estate and Mortgage Overview in Junction City
| Characteristic | Without Mortgage | With Mortgage |
| Housing Units | 104 | 144 |
| Median Property Value | $328,600 | $407,900 |
| Median Household Income | $49,250 | $13 |
| Monthly Housing Costs | $449 | $0 |
| Real Estate Taxes | $2,138 | $0 |
Property Value by Mortgage Status in Junction City
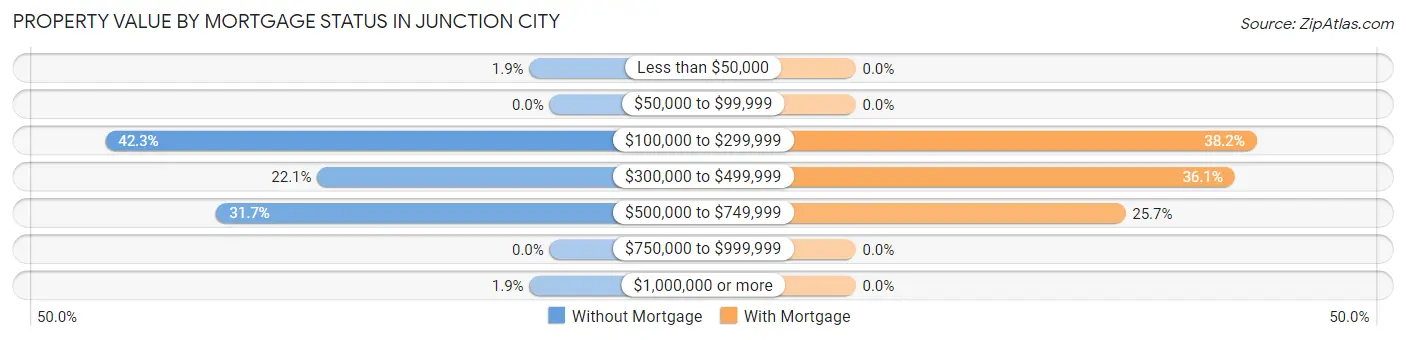
| Property Value | Without Mortgage | With Mortgage |
| Less than $50,000 | 2 (1.9%) | 0 (0.0%) |
| $50,000 to $99,999 | 0 (0.0%) | 0 (0.0%) |
| $100,000 to $299,999 | 44 (42.3%) | 55 (38.2%) |
| $300,000 to $499,999 | 23 (22.1%) | 52 (36.1%) |
| $500,000 to $749,999 | 33 (31.7%) | 37 (25.7%) |
| $750,000 to $999,999 | 0 (0.0%) | 0 (0.0%) |
| $1,000,000 or more | 2 (1.9%) | 0 (0.0%) |
| Total | 104 (100.0%) | 144 (100.0%) |
Household Income by Mortgage Status in Junction City
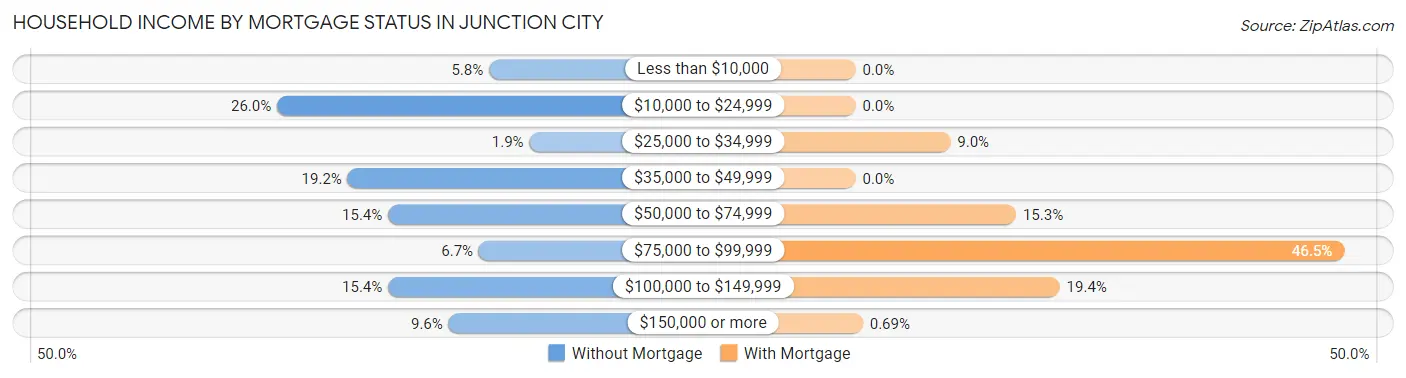
| Household Income | Without Mortgage | With Mortgage |
| Less than $10,000 | 6 (5.8%) | 0 (0.0%) |
| $10,000 to $24,999 | 27 (26.0%) | 0 (0.0%) |
| $25,000 to $34,999 | 2 (1.9%) | 13 (9.0%) |
| $35,000 to $49,999 | 20 (19.2%) | 0 (0.0%) |
| $50,000 to $74,999 | 16 (15.4%) | 22 (15.3%) |
| $75,000 to $99,999 | 7 (6.7%) | 67 (46.5%) |
| $100,000 to $149,999 | 16 (15.4%) | 28 (19.4%) |
| $150,000 or more | 10 (9.6%) | 1 (0.7%) |
| Total | 104 (100.0%) | 144 (100.0%) |
Property Value to Household Income Ratio in Junction City
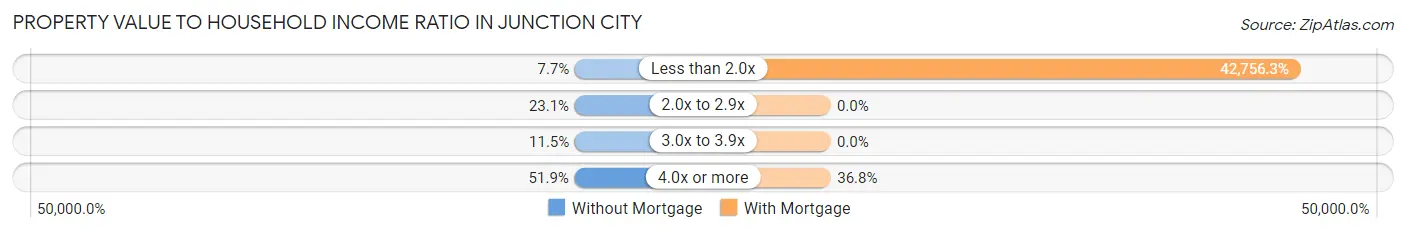
| Value-to-Income Ratio | Without Mortgage | With Mortgage |
| Less than 2.0x | 8 (7.7%) | 61,569 (42,756.2%) |
| 2.0x to 2.9x | 24 (23.1%) | 0 (0.0%) |
| 3.0x to 3.9x | 12 (11.5%) | 0 (0.0%) |
| 4.0x or more | 54 (51.9%) | 53 (36.8%) |
| Total | 104 (100.0%) | 144 (100.0%) |
Real Estate Taxes by Mortgage Status in Junction City
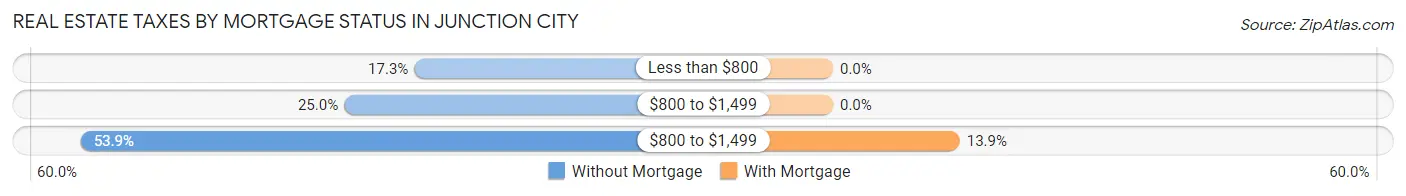
| Property Taxes | Without Mortgage | With Mortgage |
| Less than $800 | 18 (17.3%) | 0 (0.0%) |
| $800 to $1,499 | 26 (25.0%) | 0 (0.0%) |
| $800 to $1,499 | 56 (53.8%) | 20 (13.9%) |
| Total | 104 (100.0%) | 144 (100.0%) |
Health & Disability in Junction City
Health Insurance Coverage by Age in Junction City
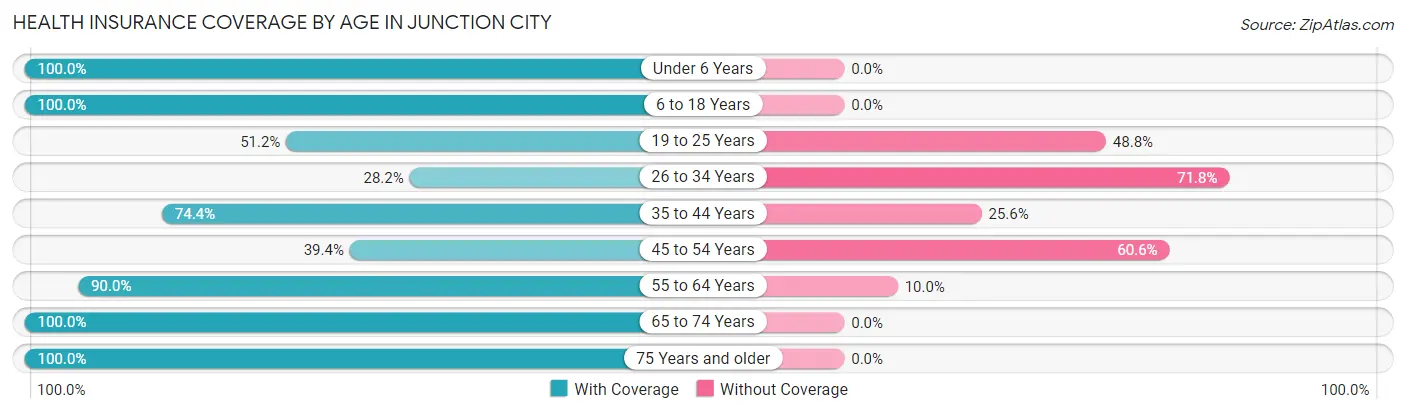
| Age Bracket | With Coverage | Without Coverage |
| Under 6 Years | 69 (100.0%) | 0 (0.0%) |
| 6 to 18 Years | 76 (100.0%) | 0 (0.0%) |
| 19 to 25 Years | 21 (51.2%) | 20 (48.8%) |
| 26 to 34 Years | 11 (28.2%) | 28 (71.8%) |
| 35 to 44 Years | 186 (74.4%) | 64 (25.6%) |
| 45 to 54 Years | 87 (39.4%) | 134 (60.6%) |
| 55 to 64 Years | 235 (90.0%) | 26 (10.0%) |
| 65 to 74 Years | 170 (100.0%) | 0 (0.0%) |
| 75 Years and older | 66 (100.0%) | 0 (0.0%) |
| Total | 921 (77.2%) | 272 (22.8%) |
Health Insurance Coverage by Citizenship Status in Junction City
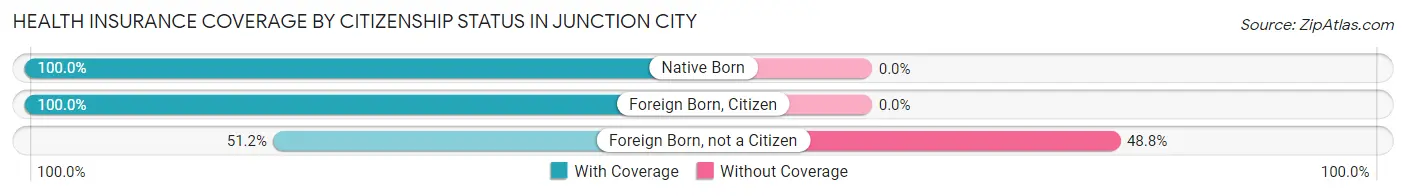
| Citizenship Status | With Coverage | Without Coverage |
| Native Born | 69 (100.0%) | 0 (0.0%) |
| Foreign Born, Citizen | 76 (100.0%) | 0 (0.0%) |
| Foreign Born, not a Citizen | 21 (51.2%) | 20 (48.8%) |
Health Insurance Coverage by Household Income in Junction City
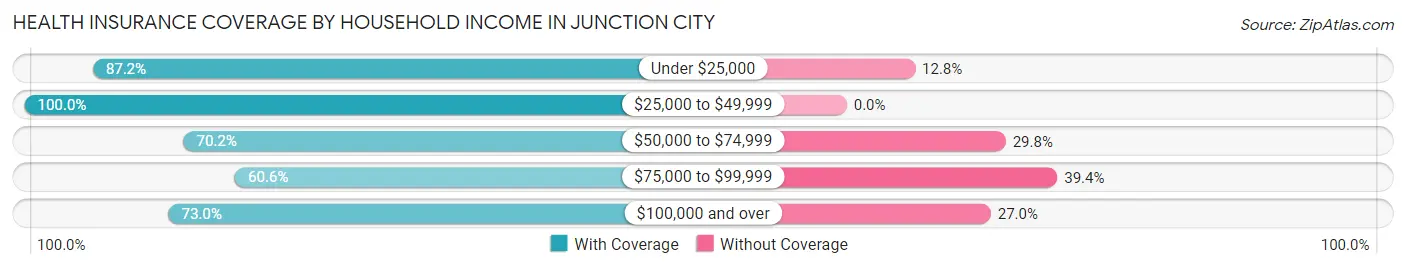
| Household Income | With Coverage | Without Coverage |
| Under $25,000 | 218 (87.2%) | 32 (12.8%) |
| $25,000 to $49,999 | 101 (100.0%) | 0 (0.0%) |
| $50,000 to $74,999 | 283 (70.2%) | 120 (29.8%) |
| $75,000 to $99,999 | 43 (60.6%) | 28 (39.4%) |
| $100,000 and over | 249 (73.0%) | 92 (27.0%) |
Public vs Private Health Insurance Coverage by Age in Junction City
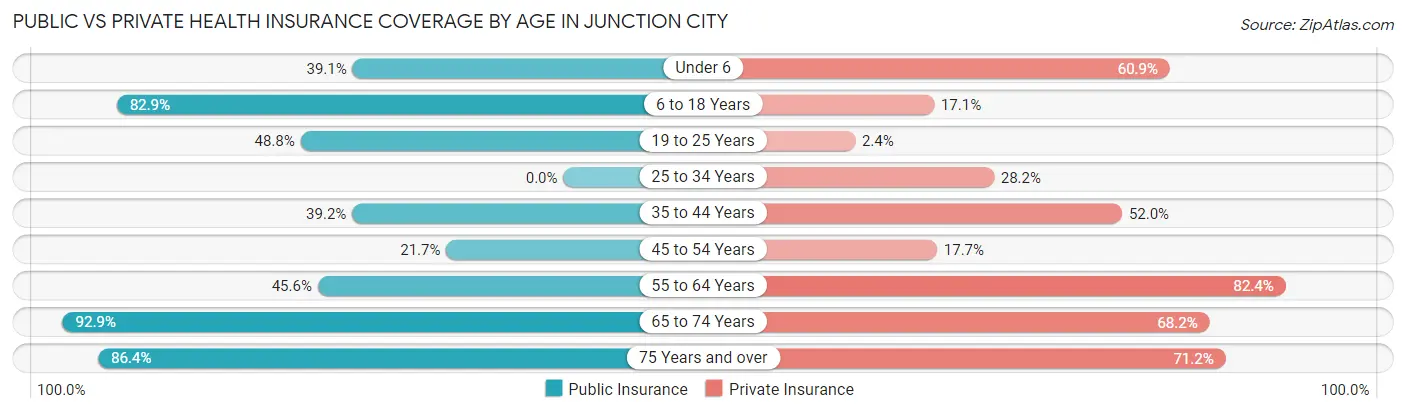
| Age Bracket | Public Insurance | Private Insurance |
| Under 6 | 27 (39.1%) | 42 (60.9%) |
| 6 to 18 Years | 63 (82.9%) | 13 (17.1%) |
| 19 to 25 Years | 20 (48.8%) | 1 (2.4%) |
| 25 to 34 Years | 0 (0.0%) | 11 (28.2%) |
| 35 to 44 Years | 98 (39.2%) | 130 (52.0%) |
| 45 to 54 Years | 48 (21.7%) | 39 (17.6%) |
| 55 to 64 Years | 119 (45.6%) | 215 (82.4%) |
| 65 to 74 Years | 158 (92.9%) | 116 (68.2%) |
| 75 Years and over | 57 (86.4%) | 47 (71.2%) |
| Total | 590 (49.5%) | 614 (51.5%) |
Disability Status by Sex by Age in Junction City
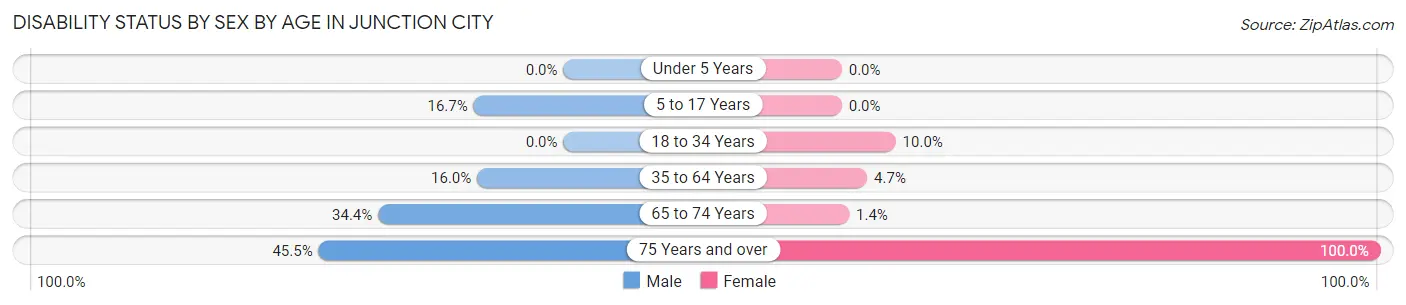
| Age Bracket | Male | Female |
| Under 5 Years | 0 (0.0%) | 0 (0.0%) |
| 5 to 17 Years | 7 (16.7%) | 0 (0.0%) |
| 18 to 34 Years | 0 (0.0%) | 1 (10.0%) |
| 35 to 64 Years | 90 (16.0%) | 8 (4.7%) |
| 65 to 74 Years | 33 (34.4%) | 1 (1.3%) |
| 75 Years and over | 25 (45.5%) | 11 (100.0%) |
Disability Class by Sex by Age in Junction City
Disability Class: Hearing Difficulty
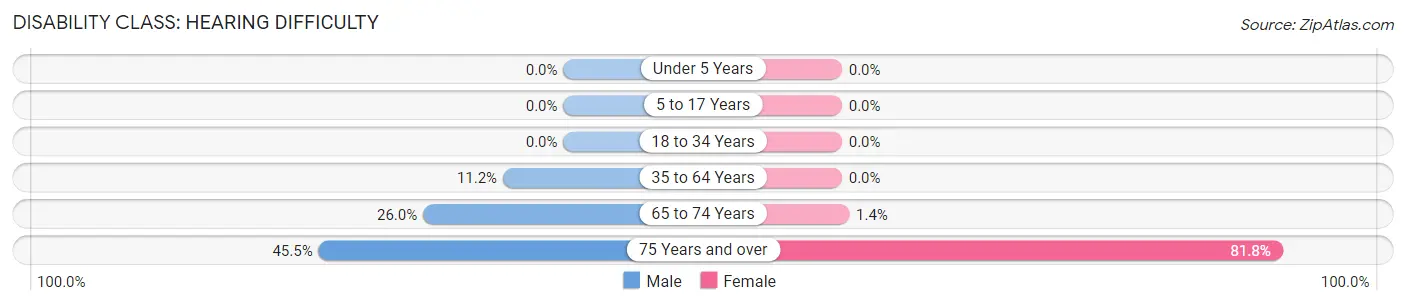
| Age Bracket | Male | Female |
| Under 5 Years | 0 (0.0%) | 0 (0.0%) |
| 5 to 17 Years | 0 (0.0%) | 0 (0.0%) |
| 18 to 34 Years | 0 (0.0%) | 0 (0.0%) |
| 35 to 64 Years | 63 (11.2%) | 0 (0.0%) |
| 65 to 74 Years | 25 (26.0%) | 1 (1.3%) |
| 75 Years and over | 25 (45.5%) | 9 (81.8%) |
Disability Class: Vision Difficulty
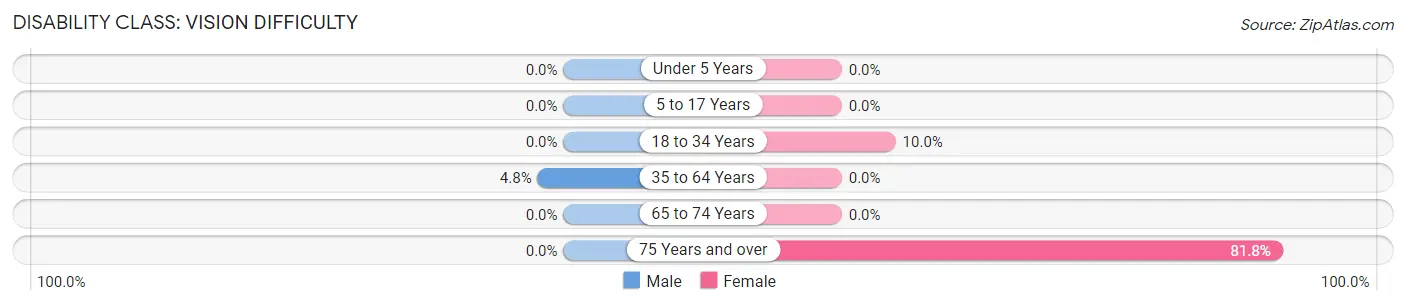
| Age Bracket | Male | Female |
| Under 5 Years | 0 (0.0%) | 0 (0.0%) |
| 5 to 17 Years | 0 (0.0%) | 0 (0.0%) |
| 18 to 34 Years | 0 (0.0%) | 1 (10.0%) |
| 35 to 64 Years | 27 (4.8%) | 0 (0.0%) |
| 65 to 74 Years | 0 (0.0%) | 0 (0.0%) |
| 75 Years and over | 0 (0.0%) | 9 (81.8%) |
Disability Class: Cognitive Difficulty
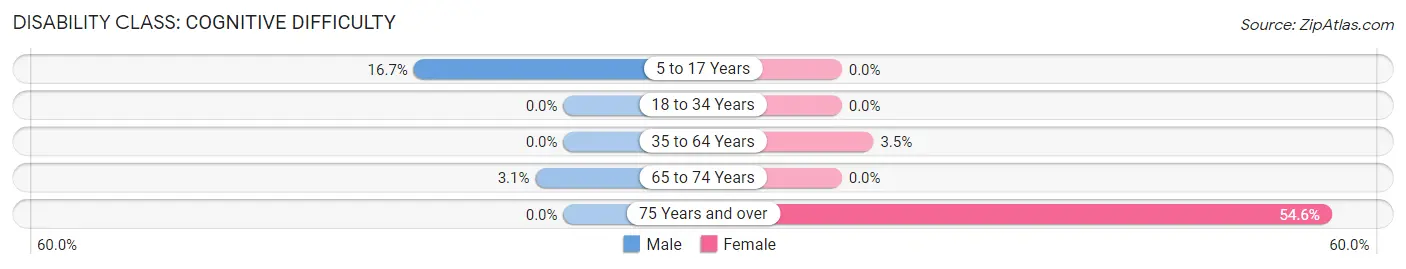
| Age Bracket | Male | Female |
| 5 to 17 Years | 7 (16.7%) | 0 (0.0%) |
| 18 to 34 Years | 0 (0.0%) | 0 (0.0%) |
| 35 to 64 Years | 0 (0.0%) | 6 (3.5%) |
| 65 to 74 Years | 3 (3.1%) | 0 (0.0%) |
| 75 Years and over | 0 (0.0%) | 6 (54.5%) |
Disability Class: Ambulatory Difficulty
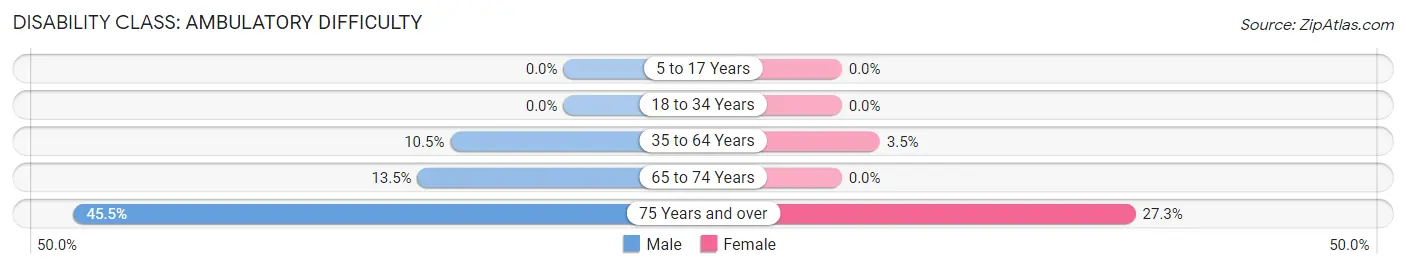
| Age Bracket | Male | Female |
| 5 to 17 Years | 0 (0.0%) | 0 (0.0%) |
| 18 to 34 Years | 0 (0.0%) | 0 (0.0%) |
| 35 to 64 Years | 59 (10.5%) | 6 (3.5%) |
| 65 to 74 Years | 13 (13.5%) | 0 (0.0%) |
| 75 Years and over | 25 (45.5%) | 3 (27.3%) |
Disability Class: Self-Care Difficulty
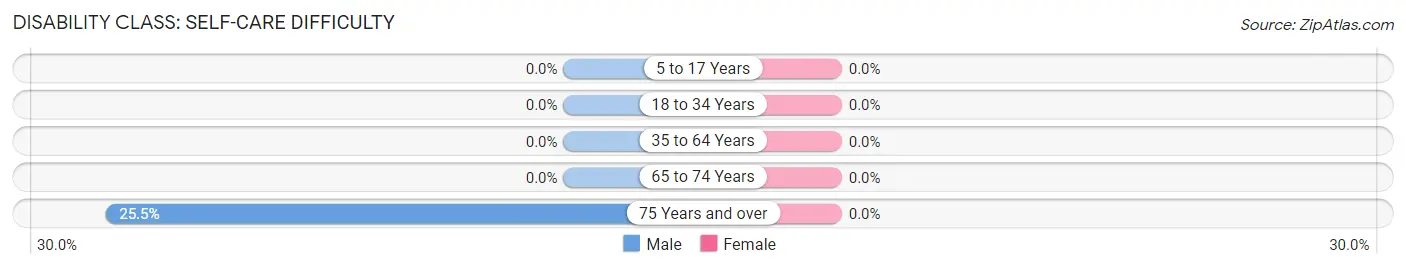
| Age Bracket | Male | Female |
| 5 to 17 Years | 0 (0.0%) | 0 (0.0%) |
| 18 to 34 Years | 0 (0.0%) | 0 (0.0%) |
| 35 to 64 Years | 0 (0.0%) | 0 (0.0%) |
| 65 to 74 Years | 0 (0.0%) | 0 (0.0%) |
| 75 Years and over | 14 (25.5%) | 0 (0.0%) |
Technology Access in Junction City
Computing Device Access in Junction City
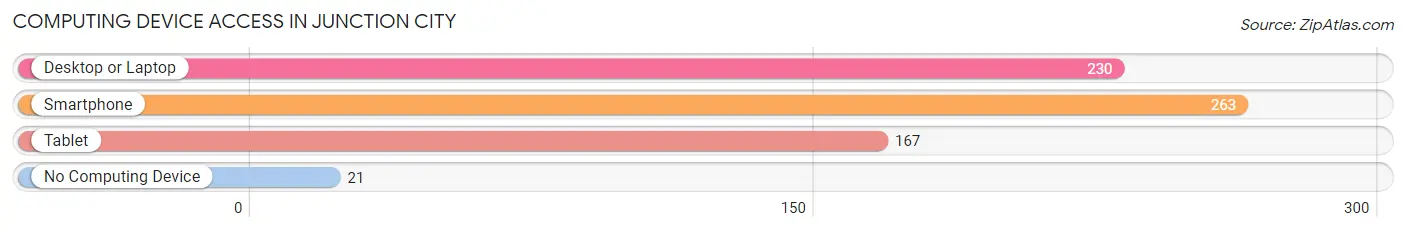
| Device Type | # Households | % Households |
| Desktop or Laptop | 230 | 75.7% |
| Smartphone | 263 | 86.5% |
| Tablet | 167 | 54.9% |
| No Computing Device | 21 | 6.9% |
| Total | 304 | 100.0% |
Internet Access in Junction City
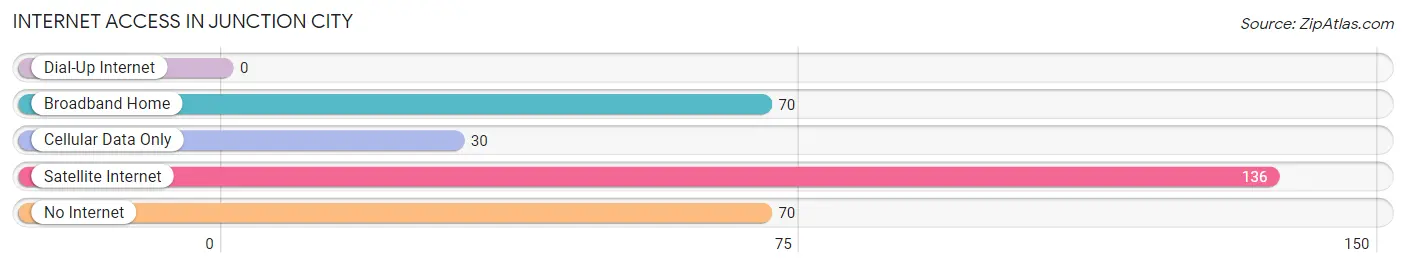
| Internet Type | # Households | % Households |
| Dial-Up Internet | 0 | 0.0% |
| Broadband Home | 70 | 23.0% |
| Cellular Data Only | 30 | 9.9% |
| Satellite Internet | 136 | 44.7% |
| No Internet | 70 | 23.0% |
| Total | 304 | 100.0% |
Junction City Summary
Junction City is a small unincorporated community located in Trinity County, California. It is situated in the foothills of the Trinity Alps, approximately 20 miles east of Weaverville. The town is home to a population of approximately 200 people, and is known for its rural charm and small-town atmosphere.
History
Junction City was founded in 1851 by a group of miners who were searching for gold in the Trinity Alps. The town was originally named “Trinity City”, but was later changed to “Junction City” due to its location at the junction of two rivers, the Trinity and the New River. The town quickly grew in size and by 1854, it had become a bustling center of commerce and industry.
In the late 1800s, Junction City was a major stop on the stagecoach route between Weaverville and Redding. The town was also home to a number of saloons, hotels, and stores. In the early 1900s, the town’s economy shifted from mining to logging and agriculture.
Geography
Junction City is located in the foothills of the Trinity Alps, approximately 20 miles east of Weaverville. The town is situated at an elevation of 1,890 feet and is surrounded by rolling hills and lush forests. The climate in Junction City is mild and temperate, with warm summers and cool winters.
Economy
Junction City’s economy is largely based on agriculture and tourism. The town is home to a number of small farms and ranches, which produce a variety of crops and livestock. The town is also a popular destination for outdoor recreation, such as fishing, hunting, and camping.
Demographics
As of the 2010 census, Junction City had a population of 200 people. The racial makeup of the town was 95.0% White, 0.5% African American, 0.5% Native American, 0.5% Asian, 0.0% Pacific Islander, 0.5% from other races, and 2.5% from two or more races. The median household income in Junction City was $37,500, and the median family income was $41,250.
Conclusion
Junction City is a small unincorporated community located in Trinity County, California. It is situated in the foothills of the Trinity Alps, approximately 20 miles east of Weaverville. The town is home to a population of approximately 200 people, and is known for its rural charm and small-town atmosphere. The town’s economy is largely based on agriculture and tourism, and the town is a popular destination for outdoor recreation. The racial makeup of the town is predominantly White, with a small percentage of African American, Native American, and Asian residents.
Common Questions
What is Per Capita Income in Junction City?
Per Capita income in Junction City is $24,123.
What is the Median Family Income in Junction City?
Median Family Income in Junction City is $62,131.
What is the Median Household income in Junction City?
Median Household Income in Junction City is $60,377.
What is Income or Wage Gap in Junction City?
Income or Wage Gap in Junction City is 18.2%.
Women in Junction City earn 81.8 cents for every dollar earned by a man.
What is Inequality or Gini Index in Junction City?
Inequality or Gini Index in Junction City is 0.40.
What is the Total Population of Junction City?
Total Population of Junction City is 1,195.
What is the Total Male Population of Junction City?
Total Male Population of Junction City is 865.
What is the Total Female Population of Junction City?
Total Female Population of Junction City is 330.
What is the Ratio of Males per 100 Females in Junction City?
There are 262.12 Males per 100 Females in Junction City.
What is the Ratio of Females per 100 Males in Junction City?
There are 38.15 Females per 100 Males in Junction City.
What is the Median Population Age in Junction City?
Median Population Age in Junction City is 46.9 Years.
What is the Average Family Size in Junction City
Average Family Size in Junction City is 4.4 People.
What is the Average Household Size in Junction City
Average Household Size in Junction City is 3.8 People.
How Large is the Labor Force in Junction City?
There are 564 People in the Labor Forcein in Junction City.
What is the Percentage of People in the Labor Force in Junction City?
52.5% of People are in the Labor Force in Junction City.
What is the Unemployment Rate in Junction City?
Unemployment Rate in Junction City is 6.9%.